Spectral Characteristics and Sensor Ability of a New 1,8-Naphthalimide and Its Copolymer with Styrene


Abstract
1. Introduction
2. Materials and Methods
2.1. Synthesis
2.2. Analysis
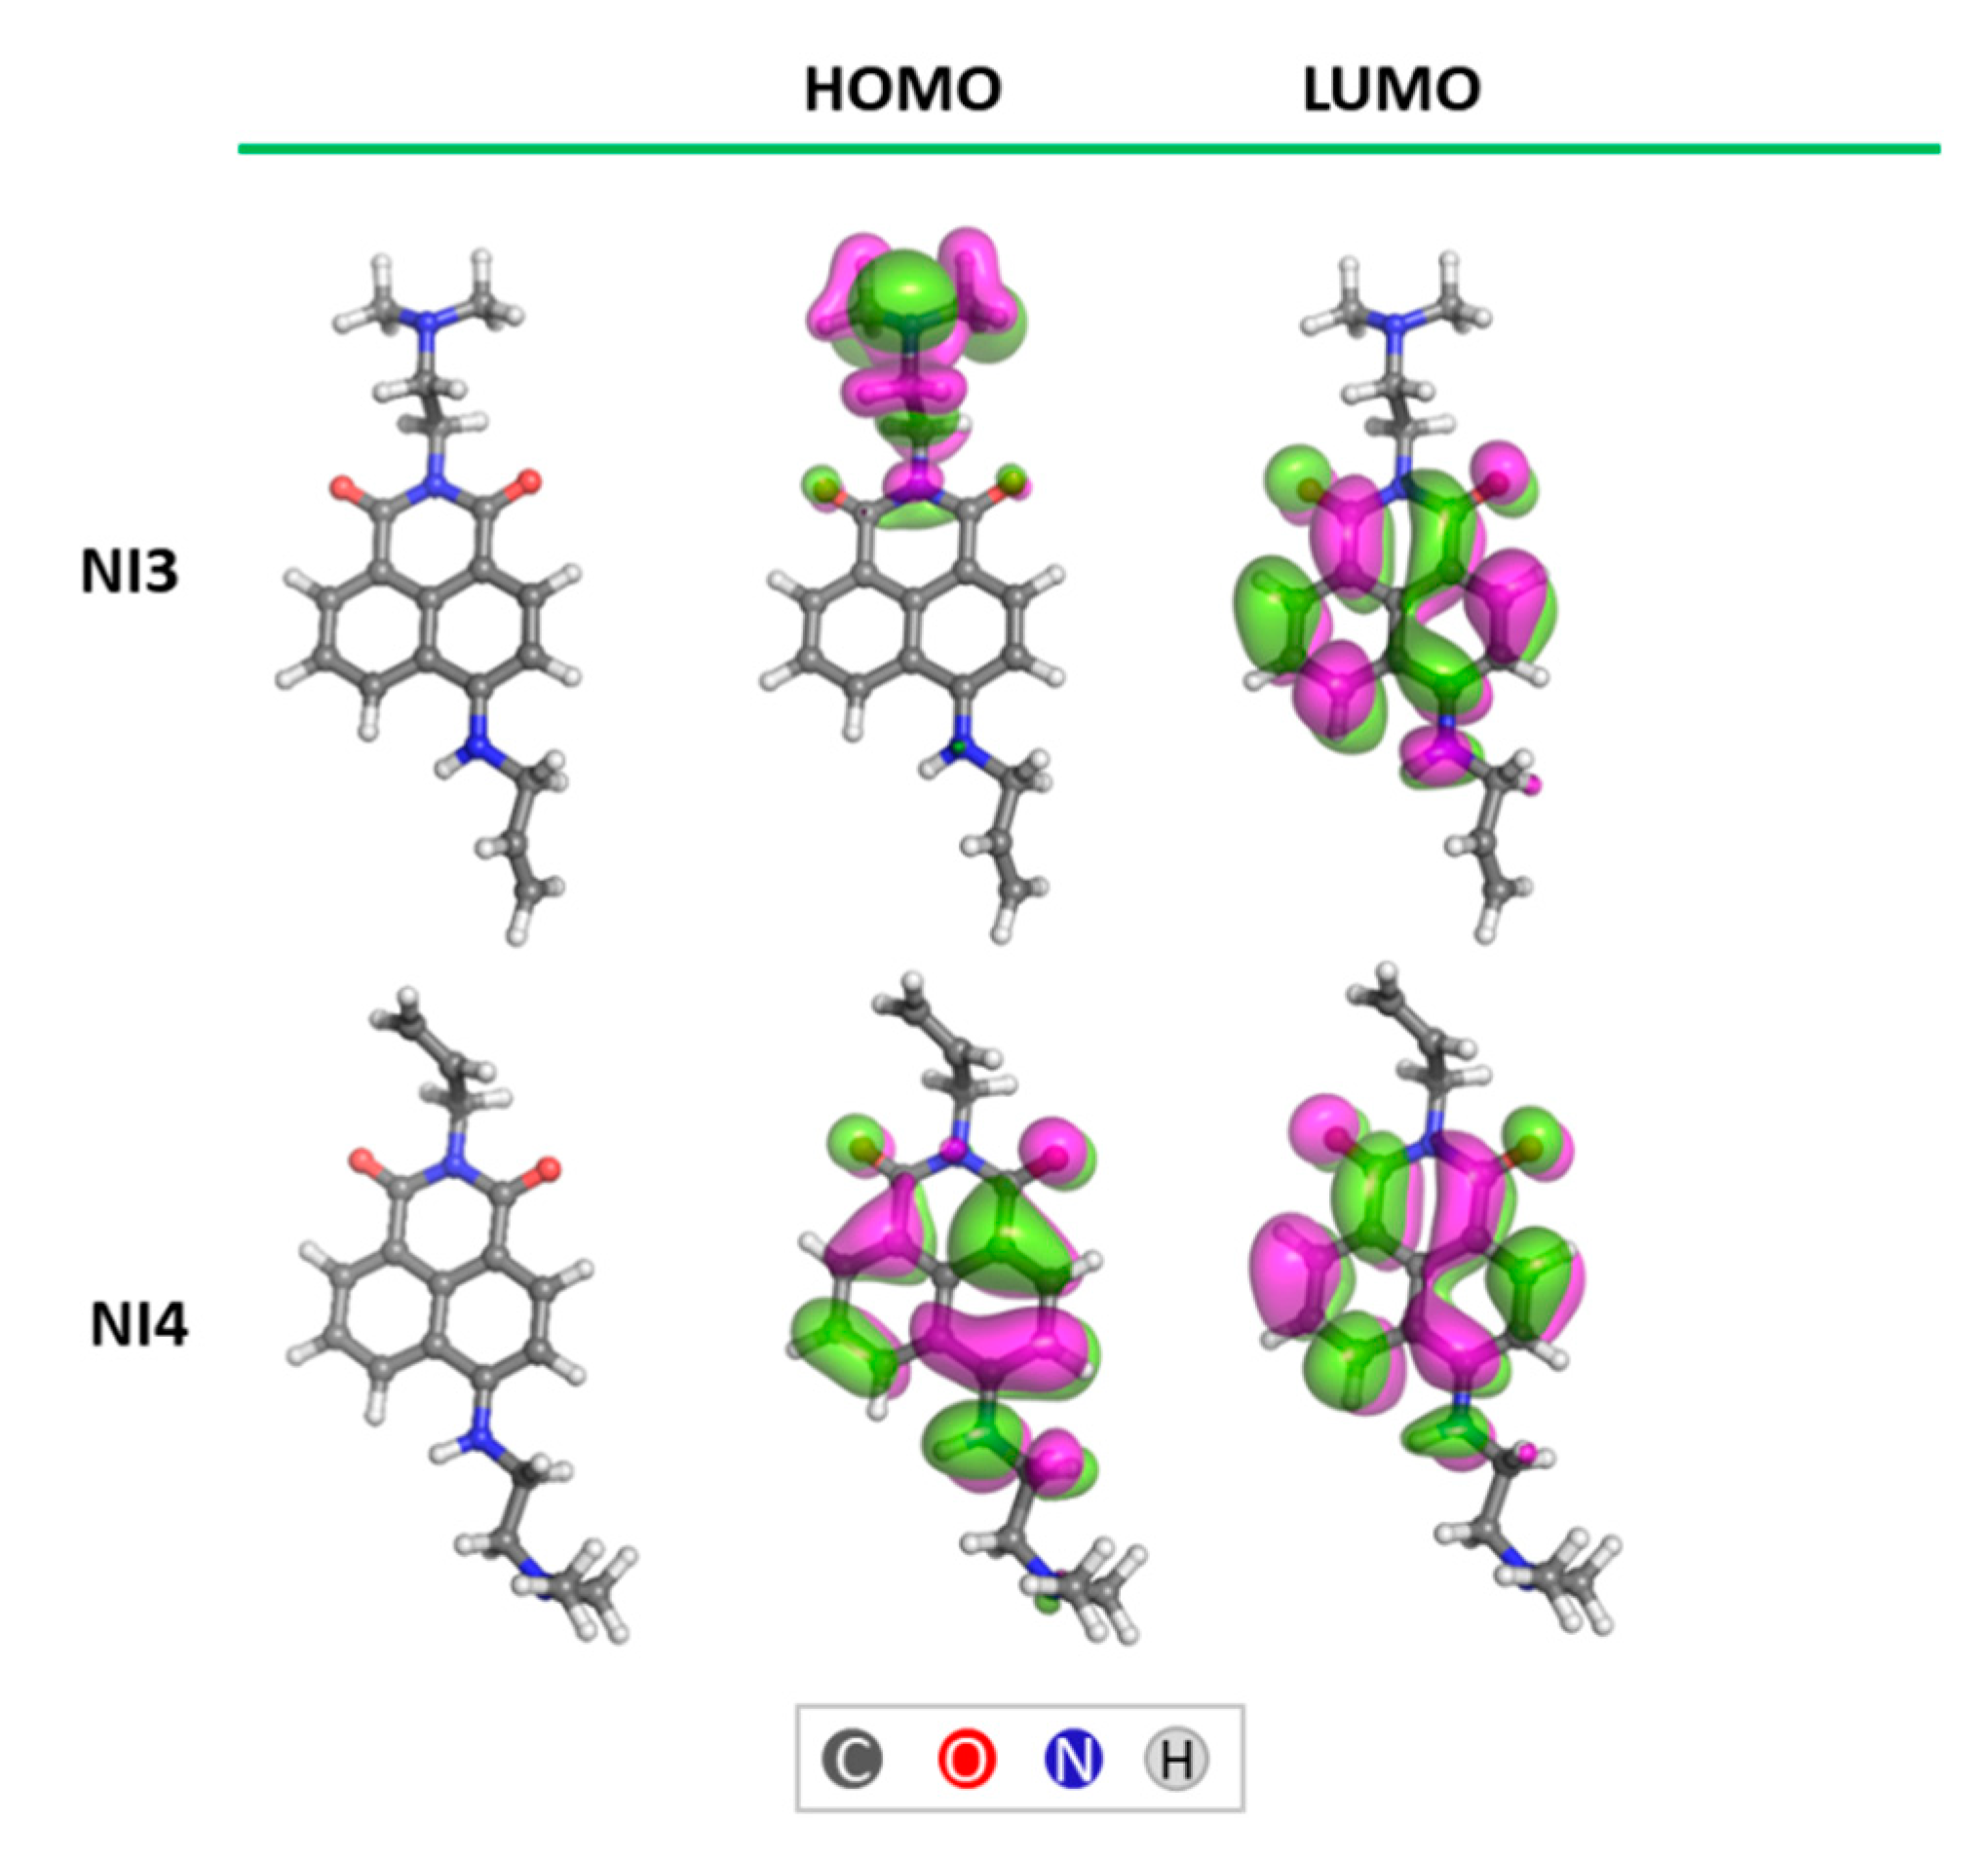
2.3. Computational Details
3. Results
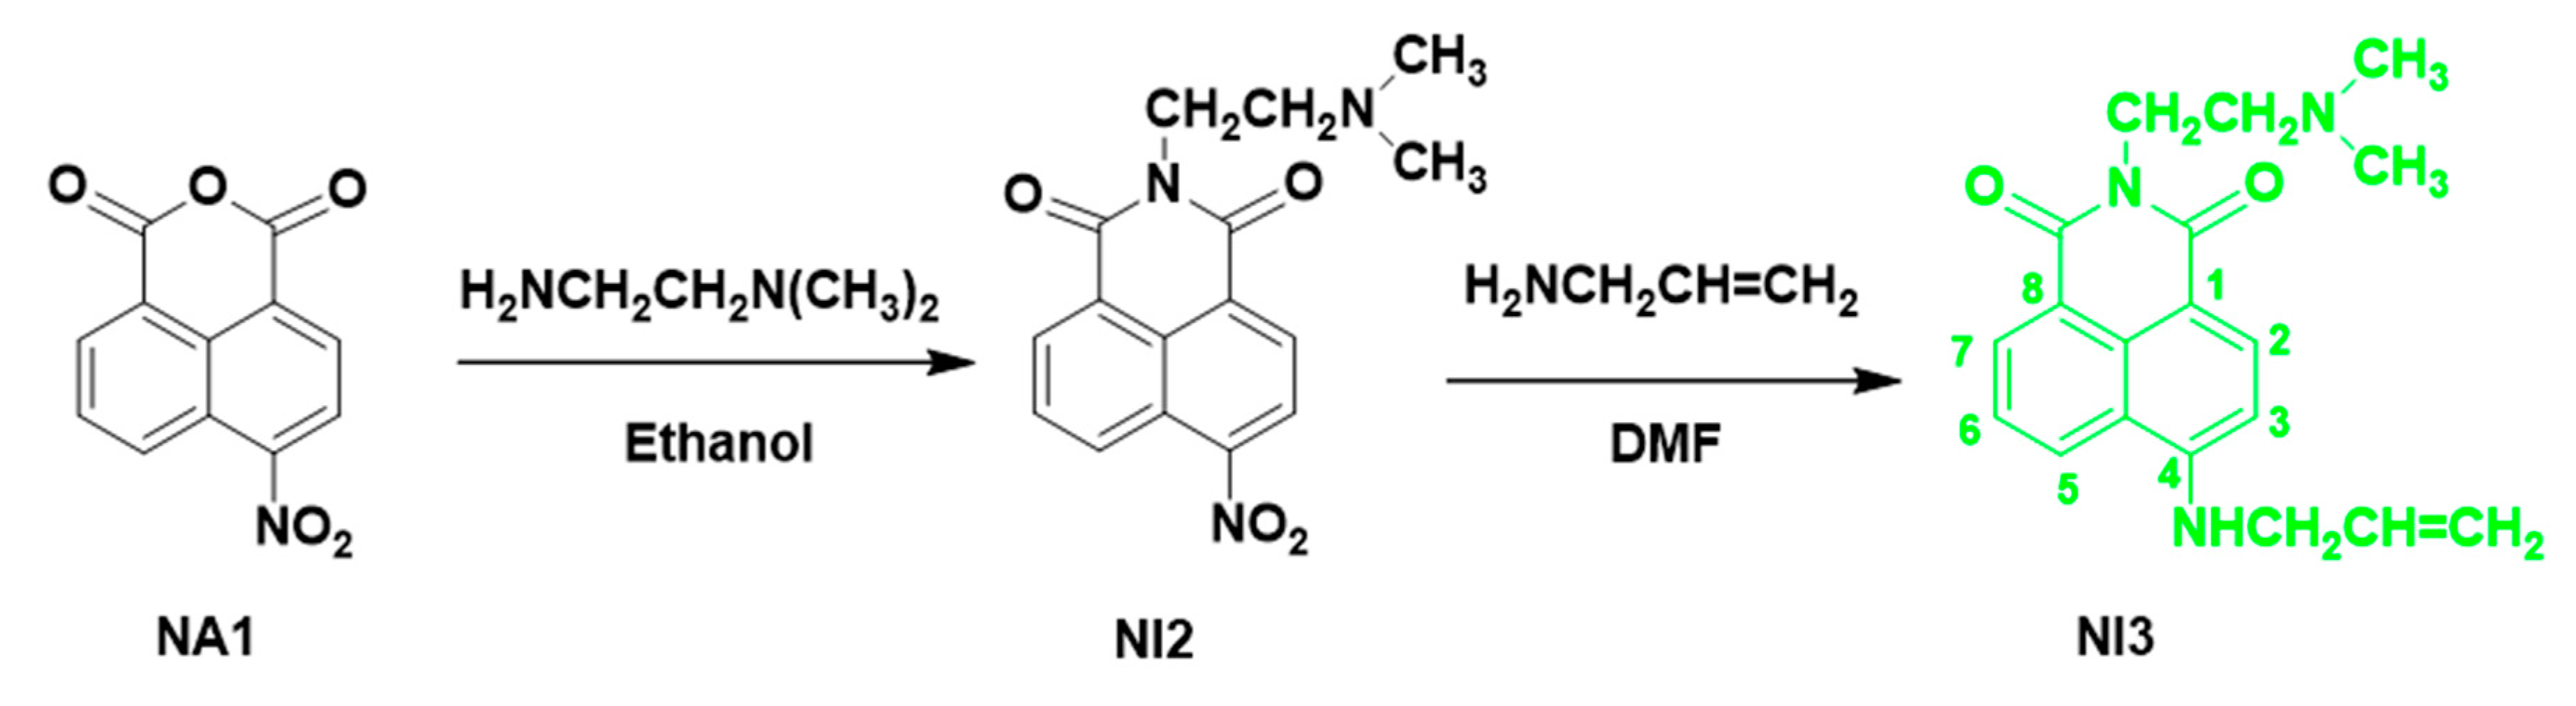
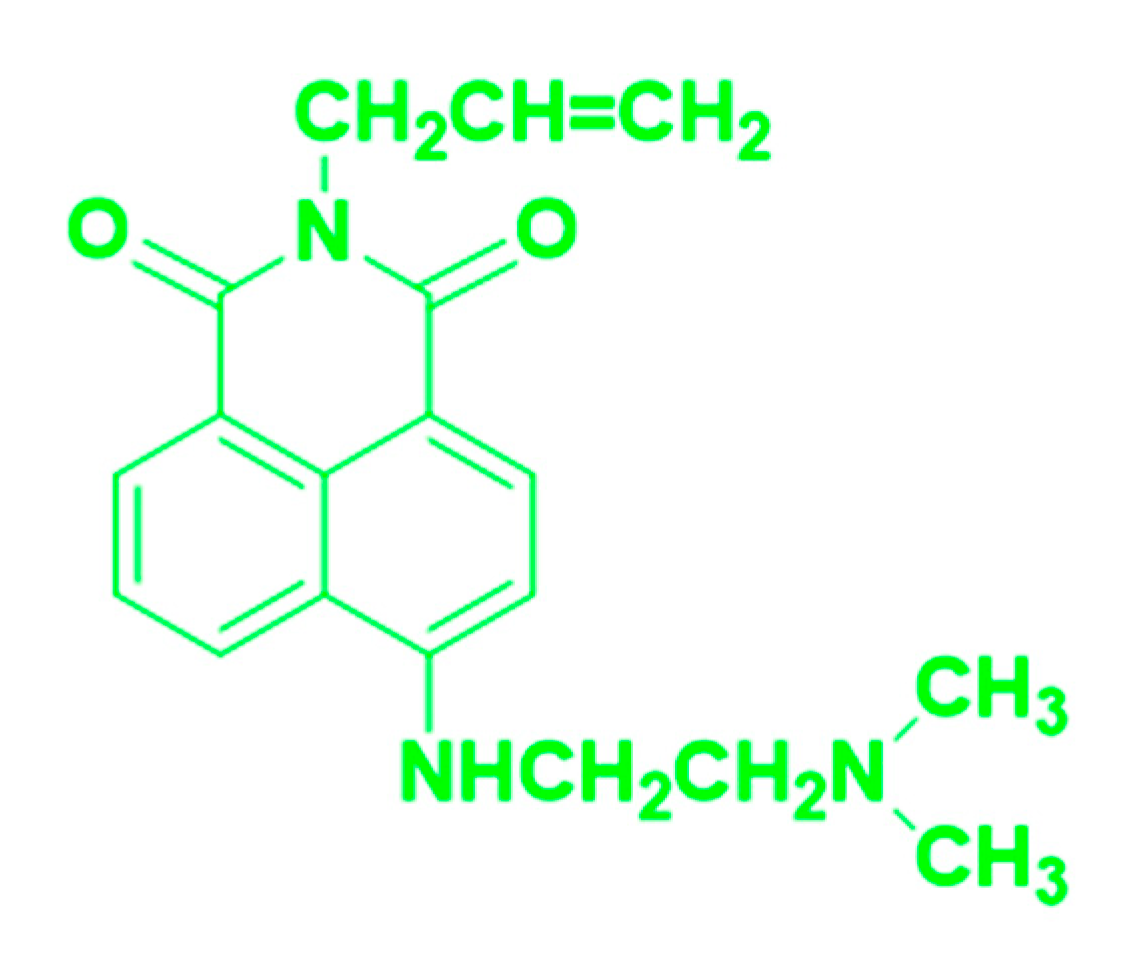
3.1. Synthesis of 6-(Allylamino)-2-(2-(Dimethylamino)Ethyl)-1H-Benzo[de]isoquinoline-1,3(2H)-Dione (NI3)
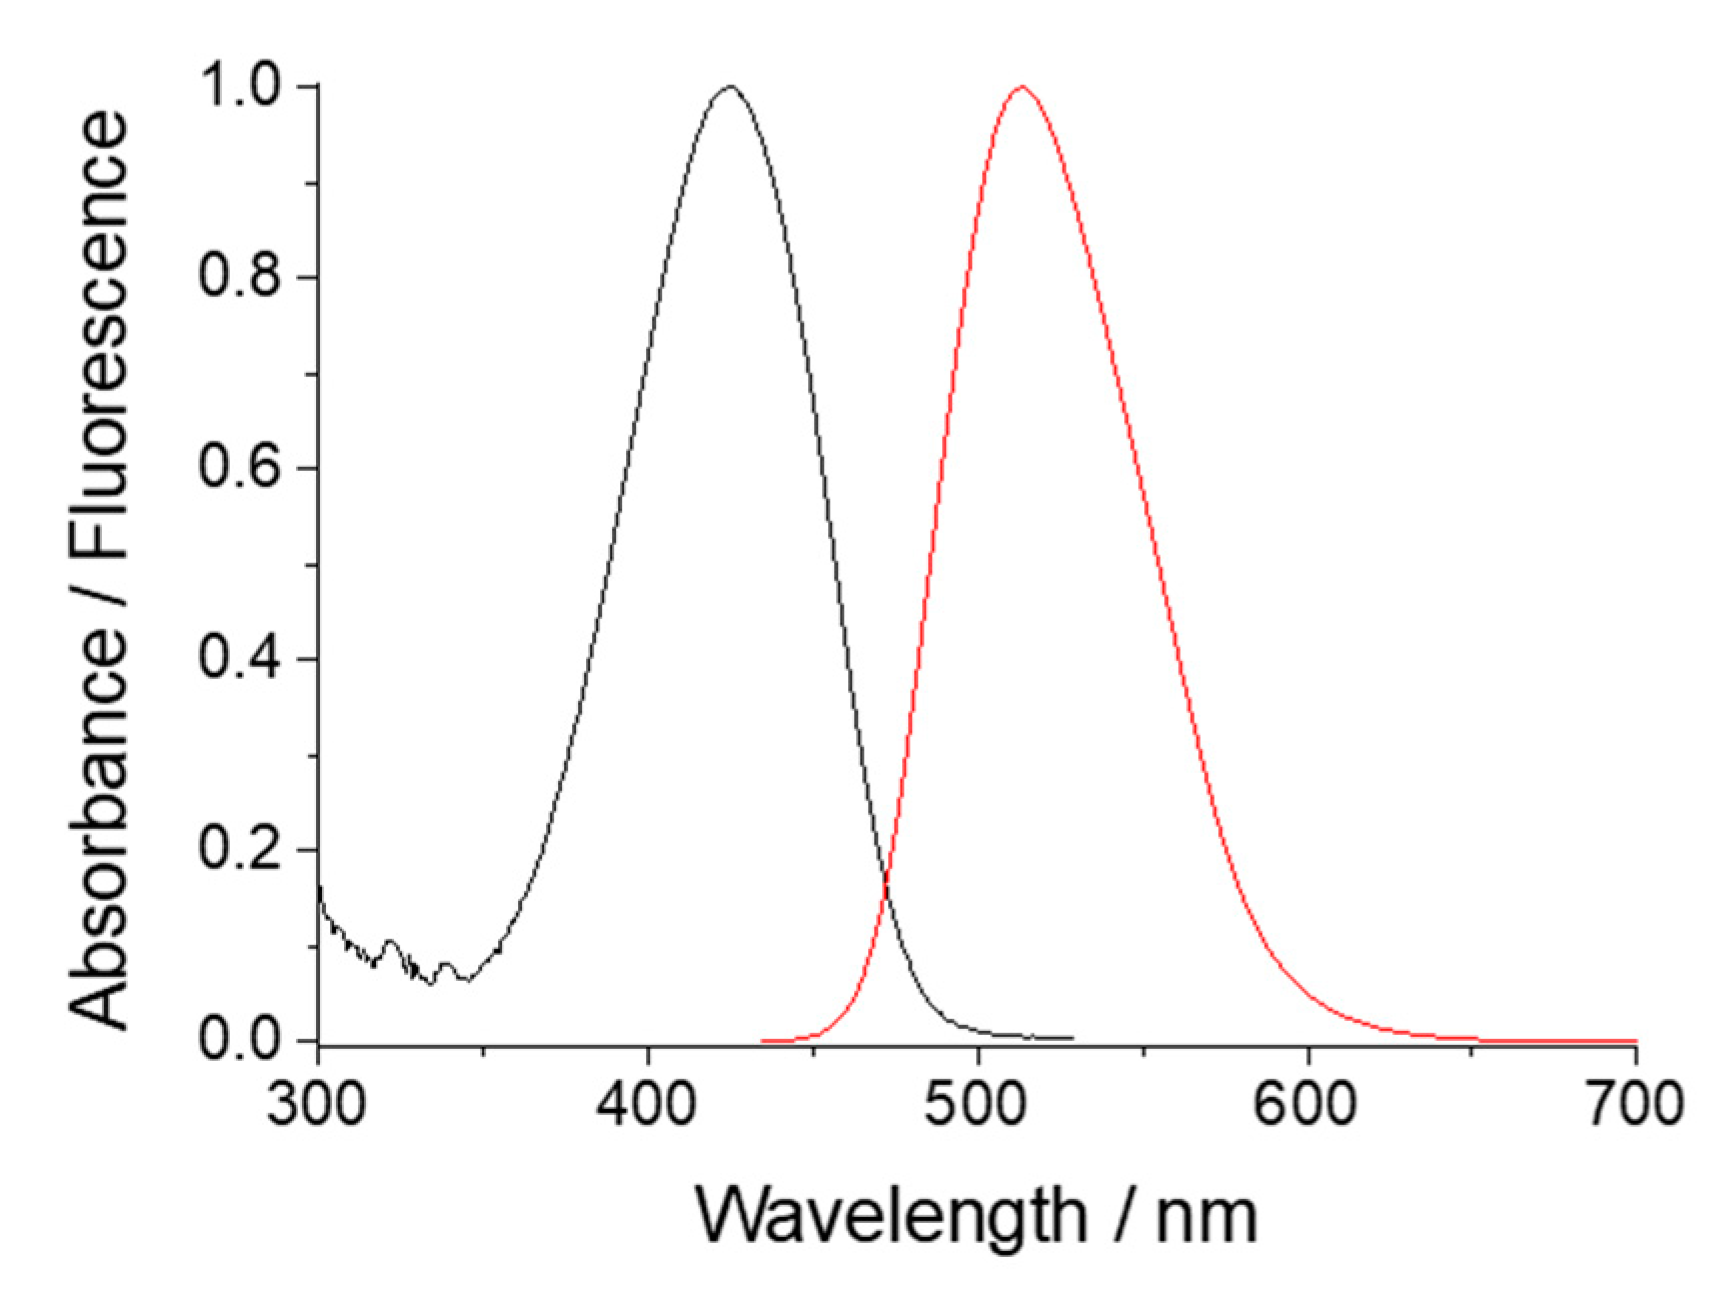
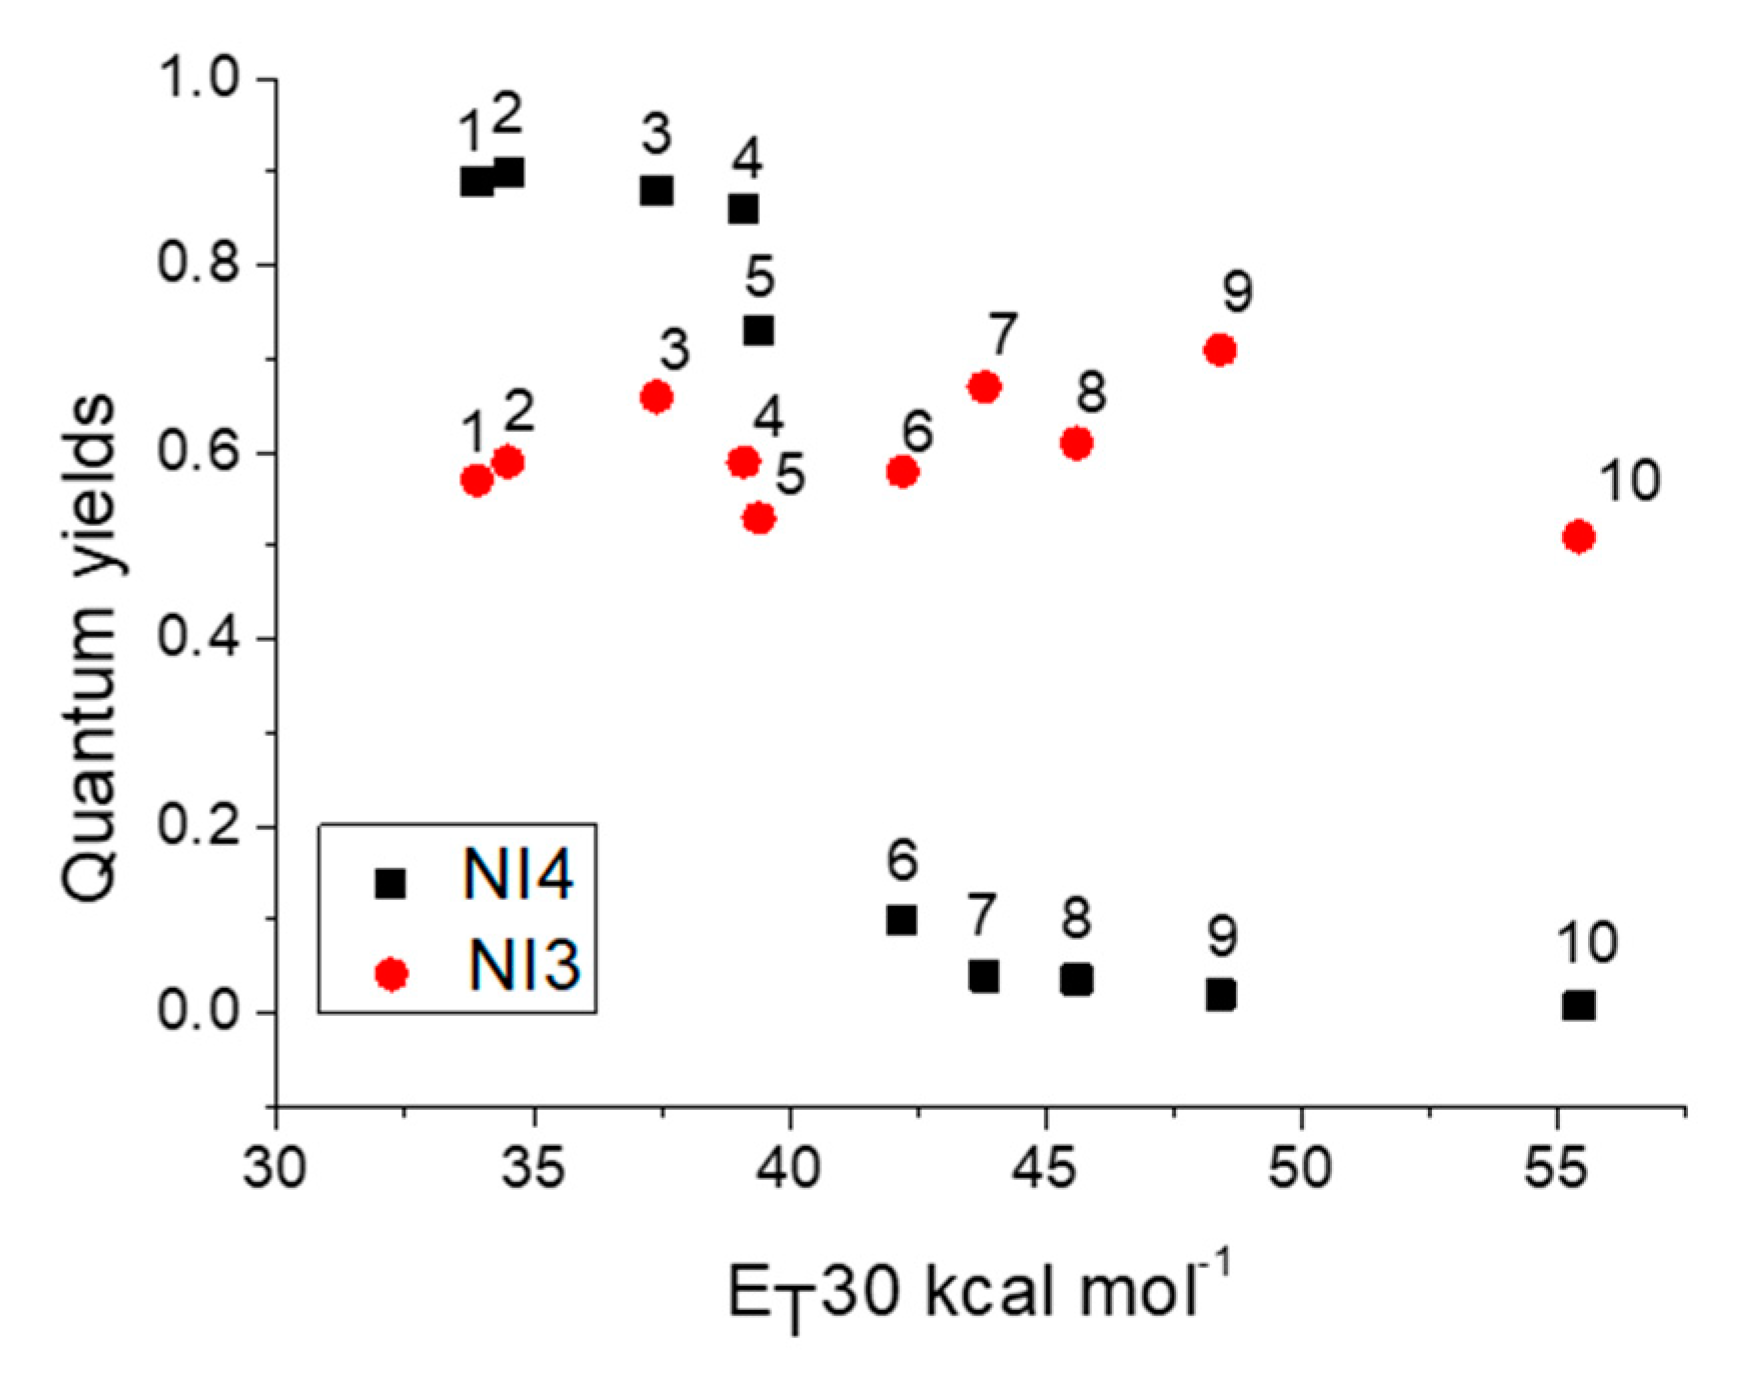
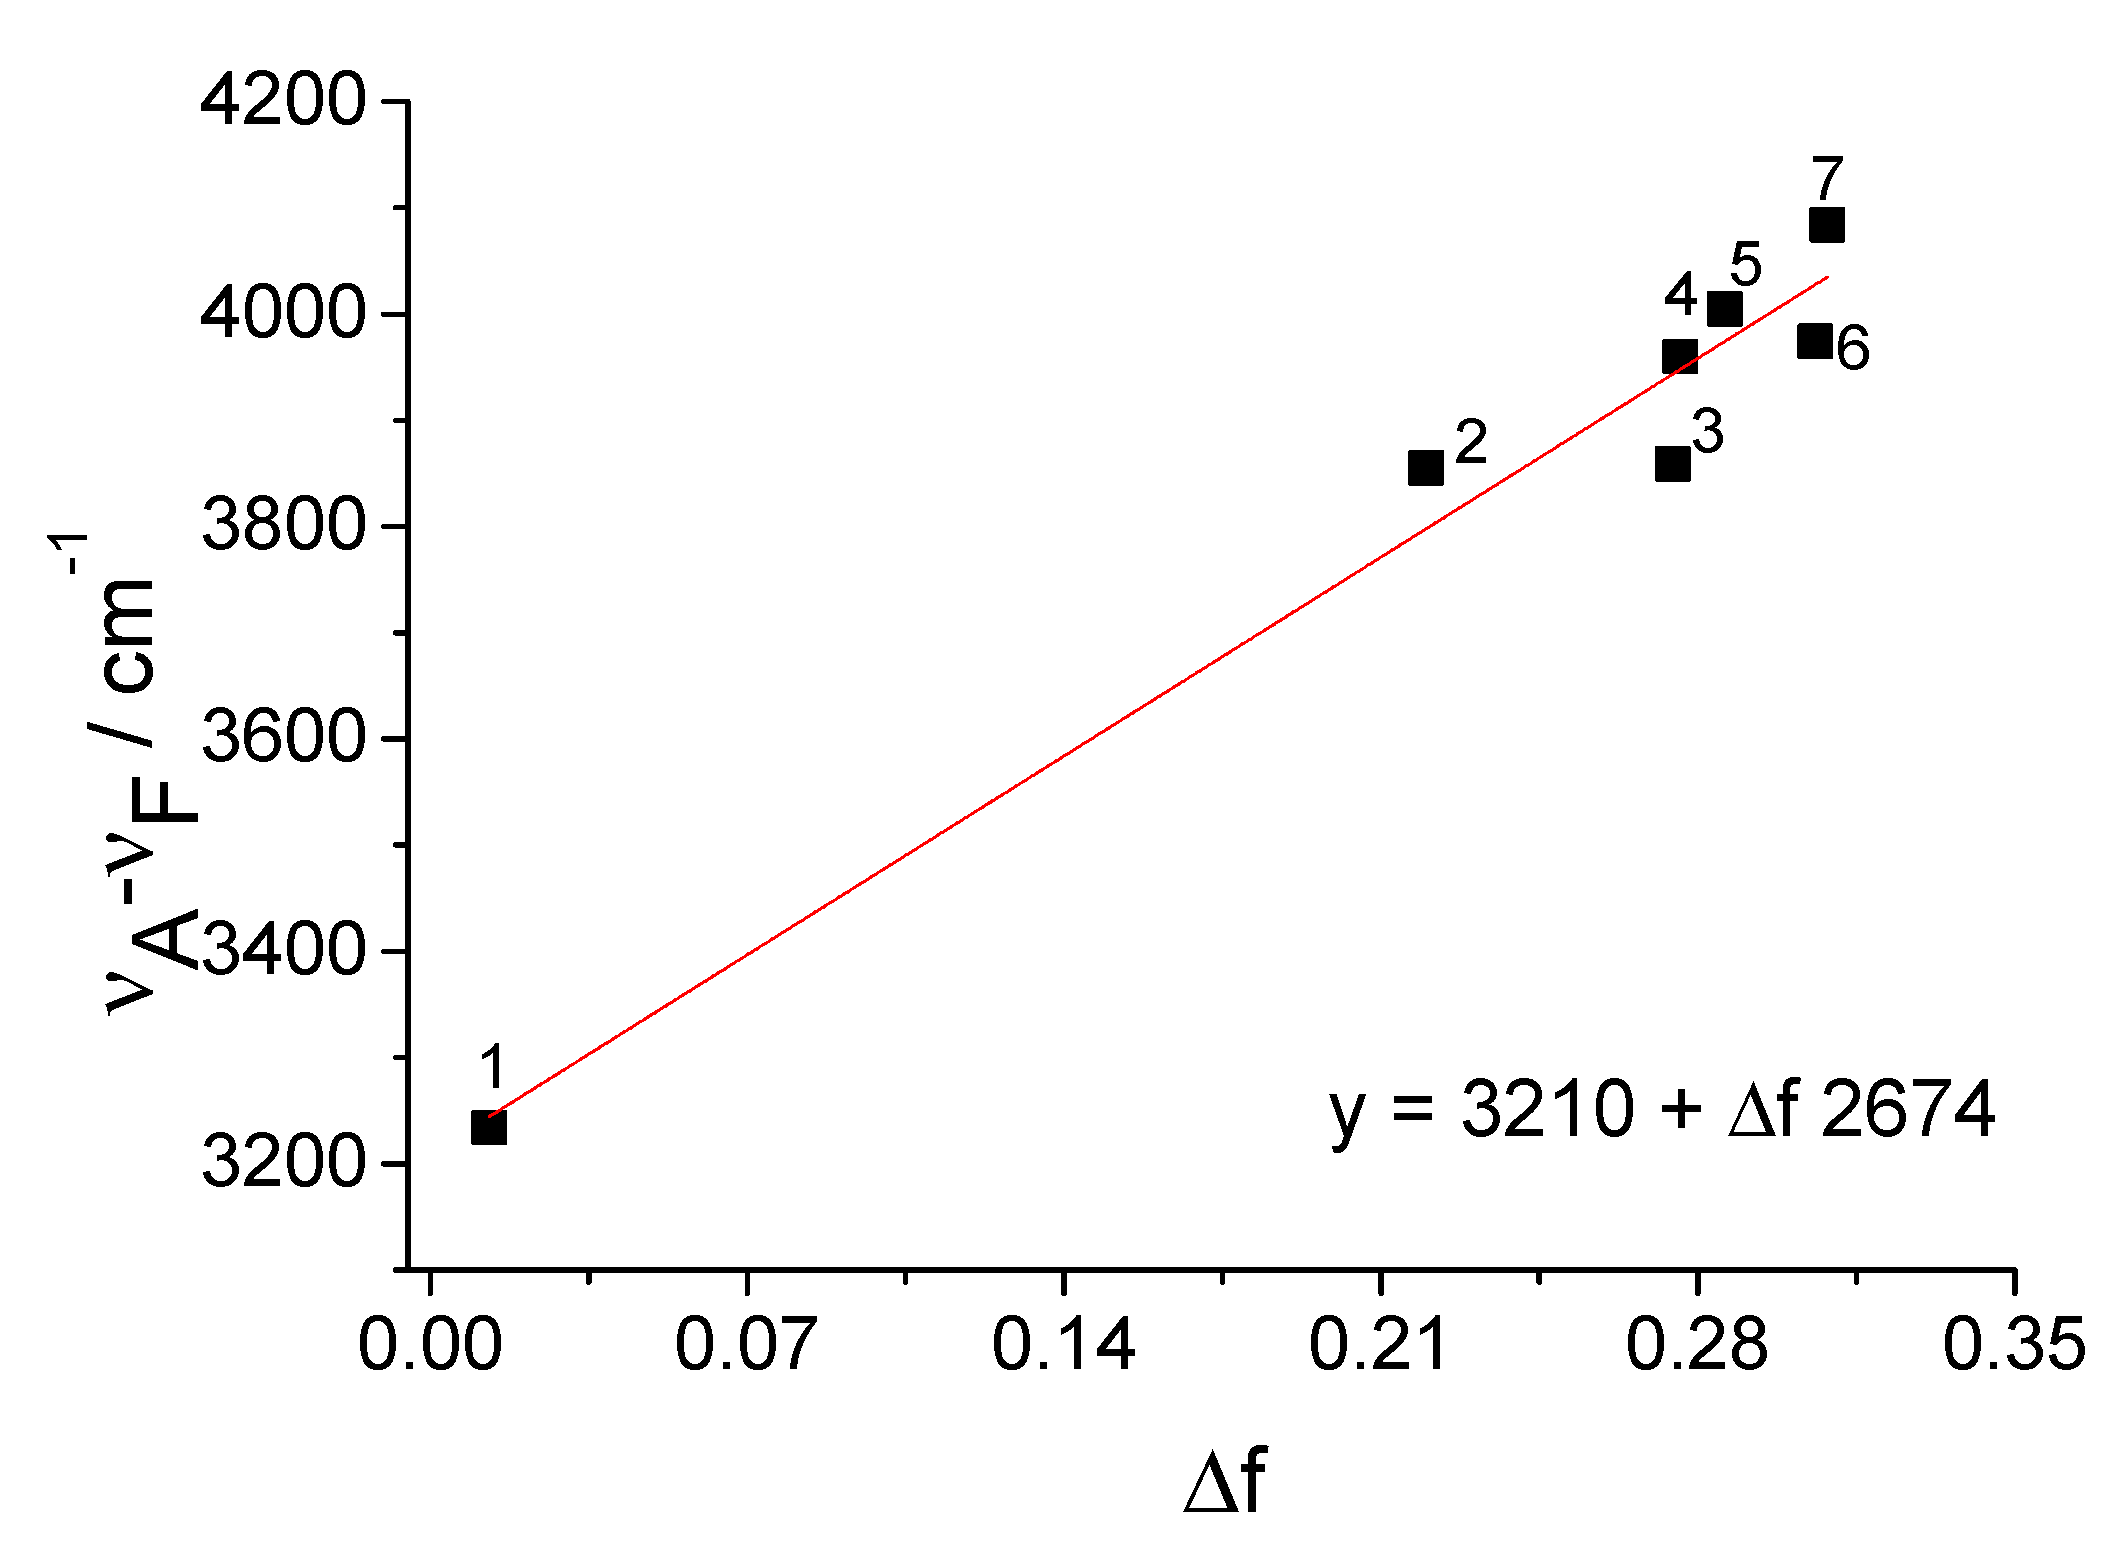
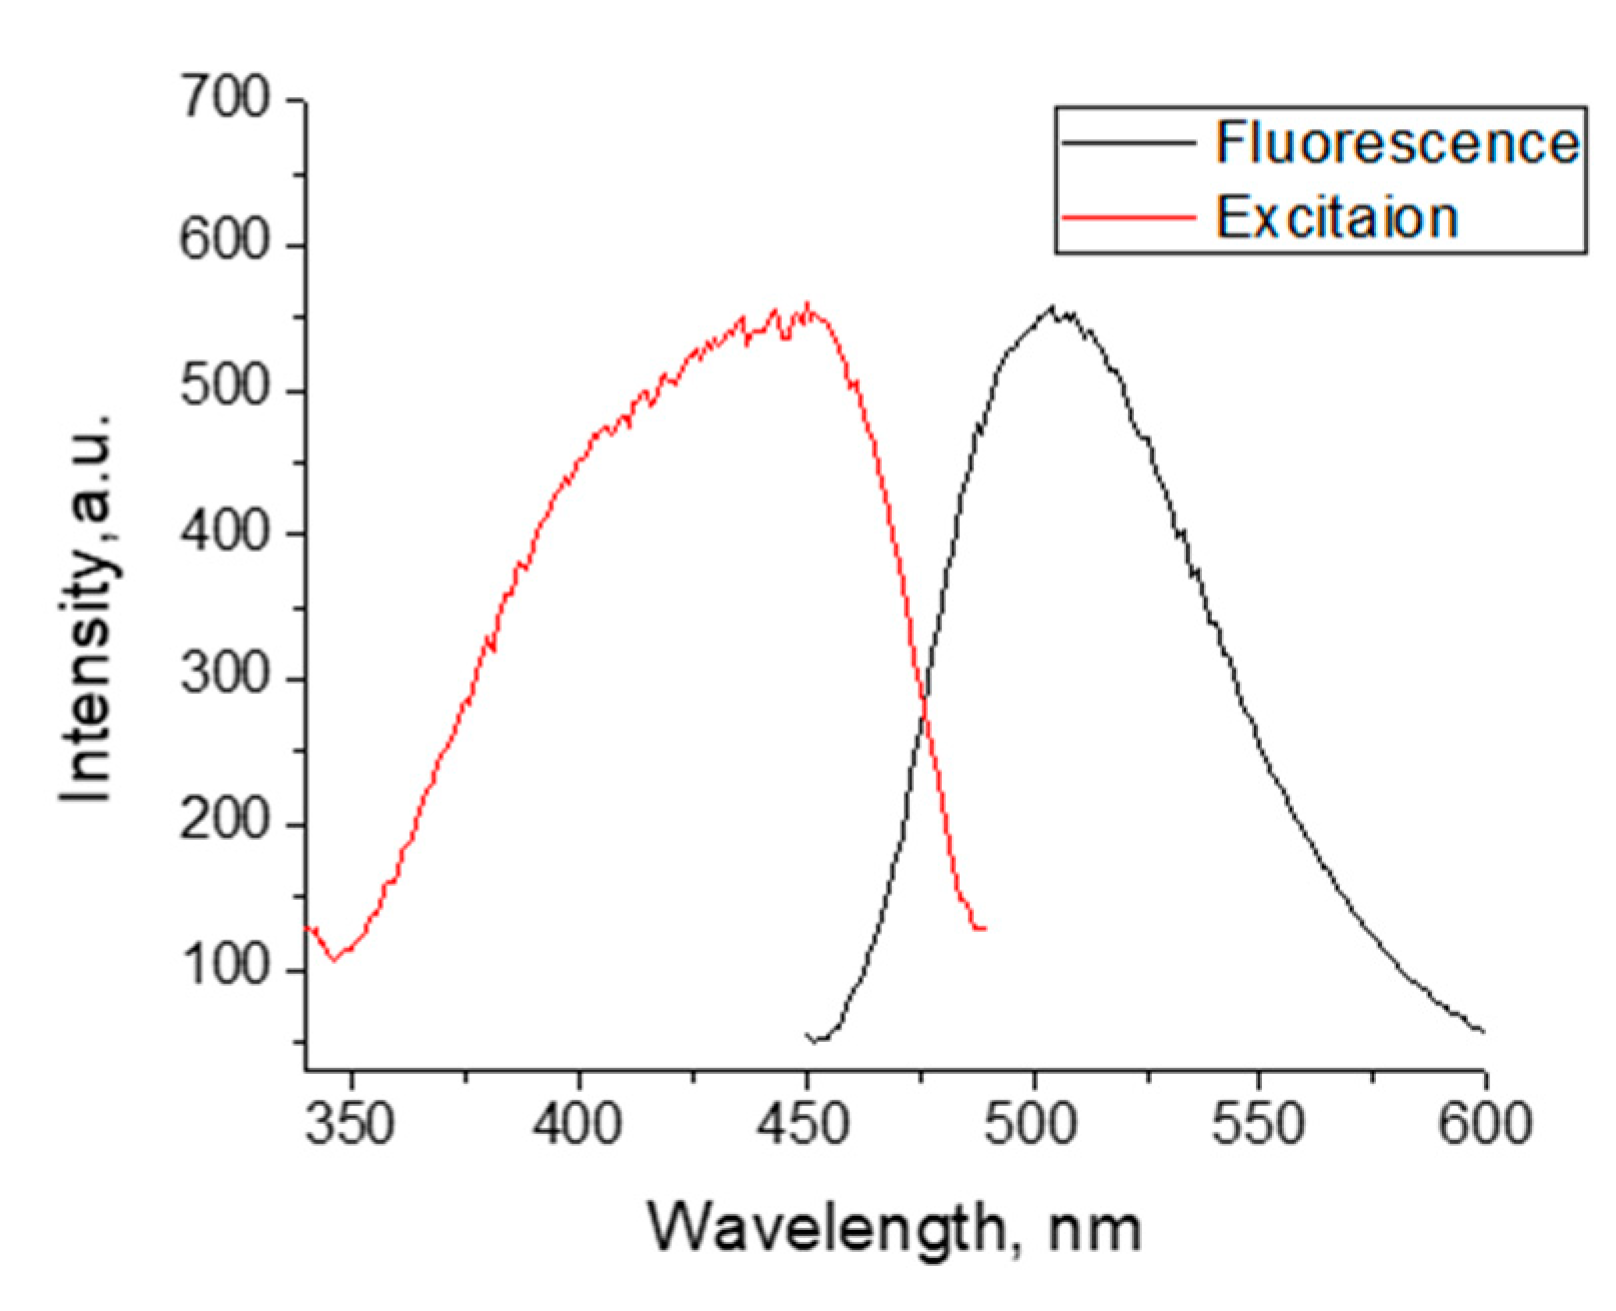
3.2. Spectral Characteristics of NI3 and NI4
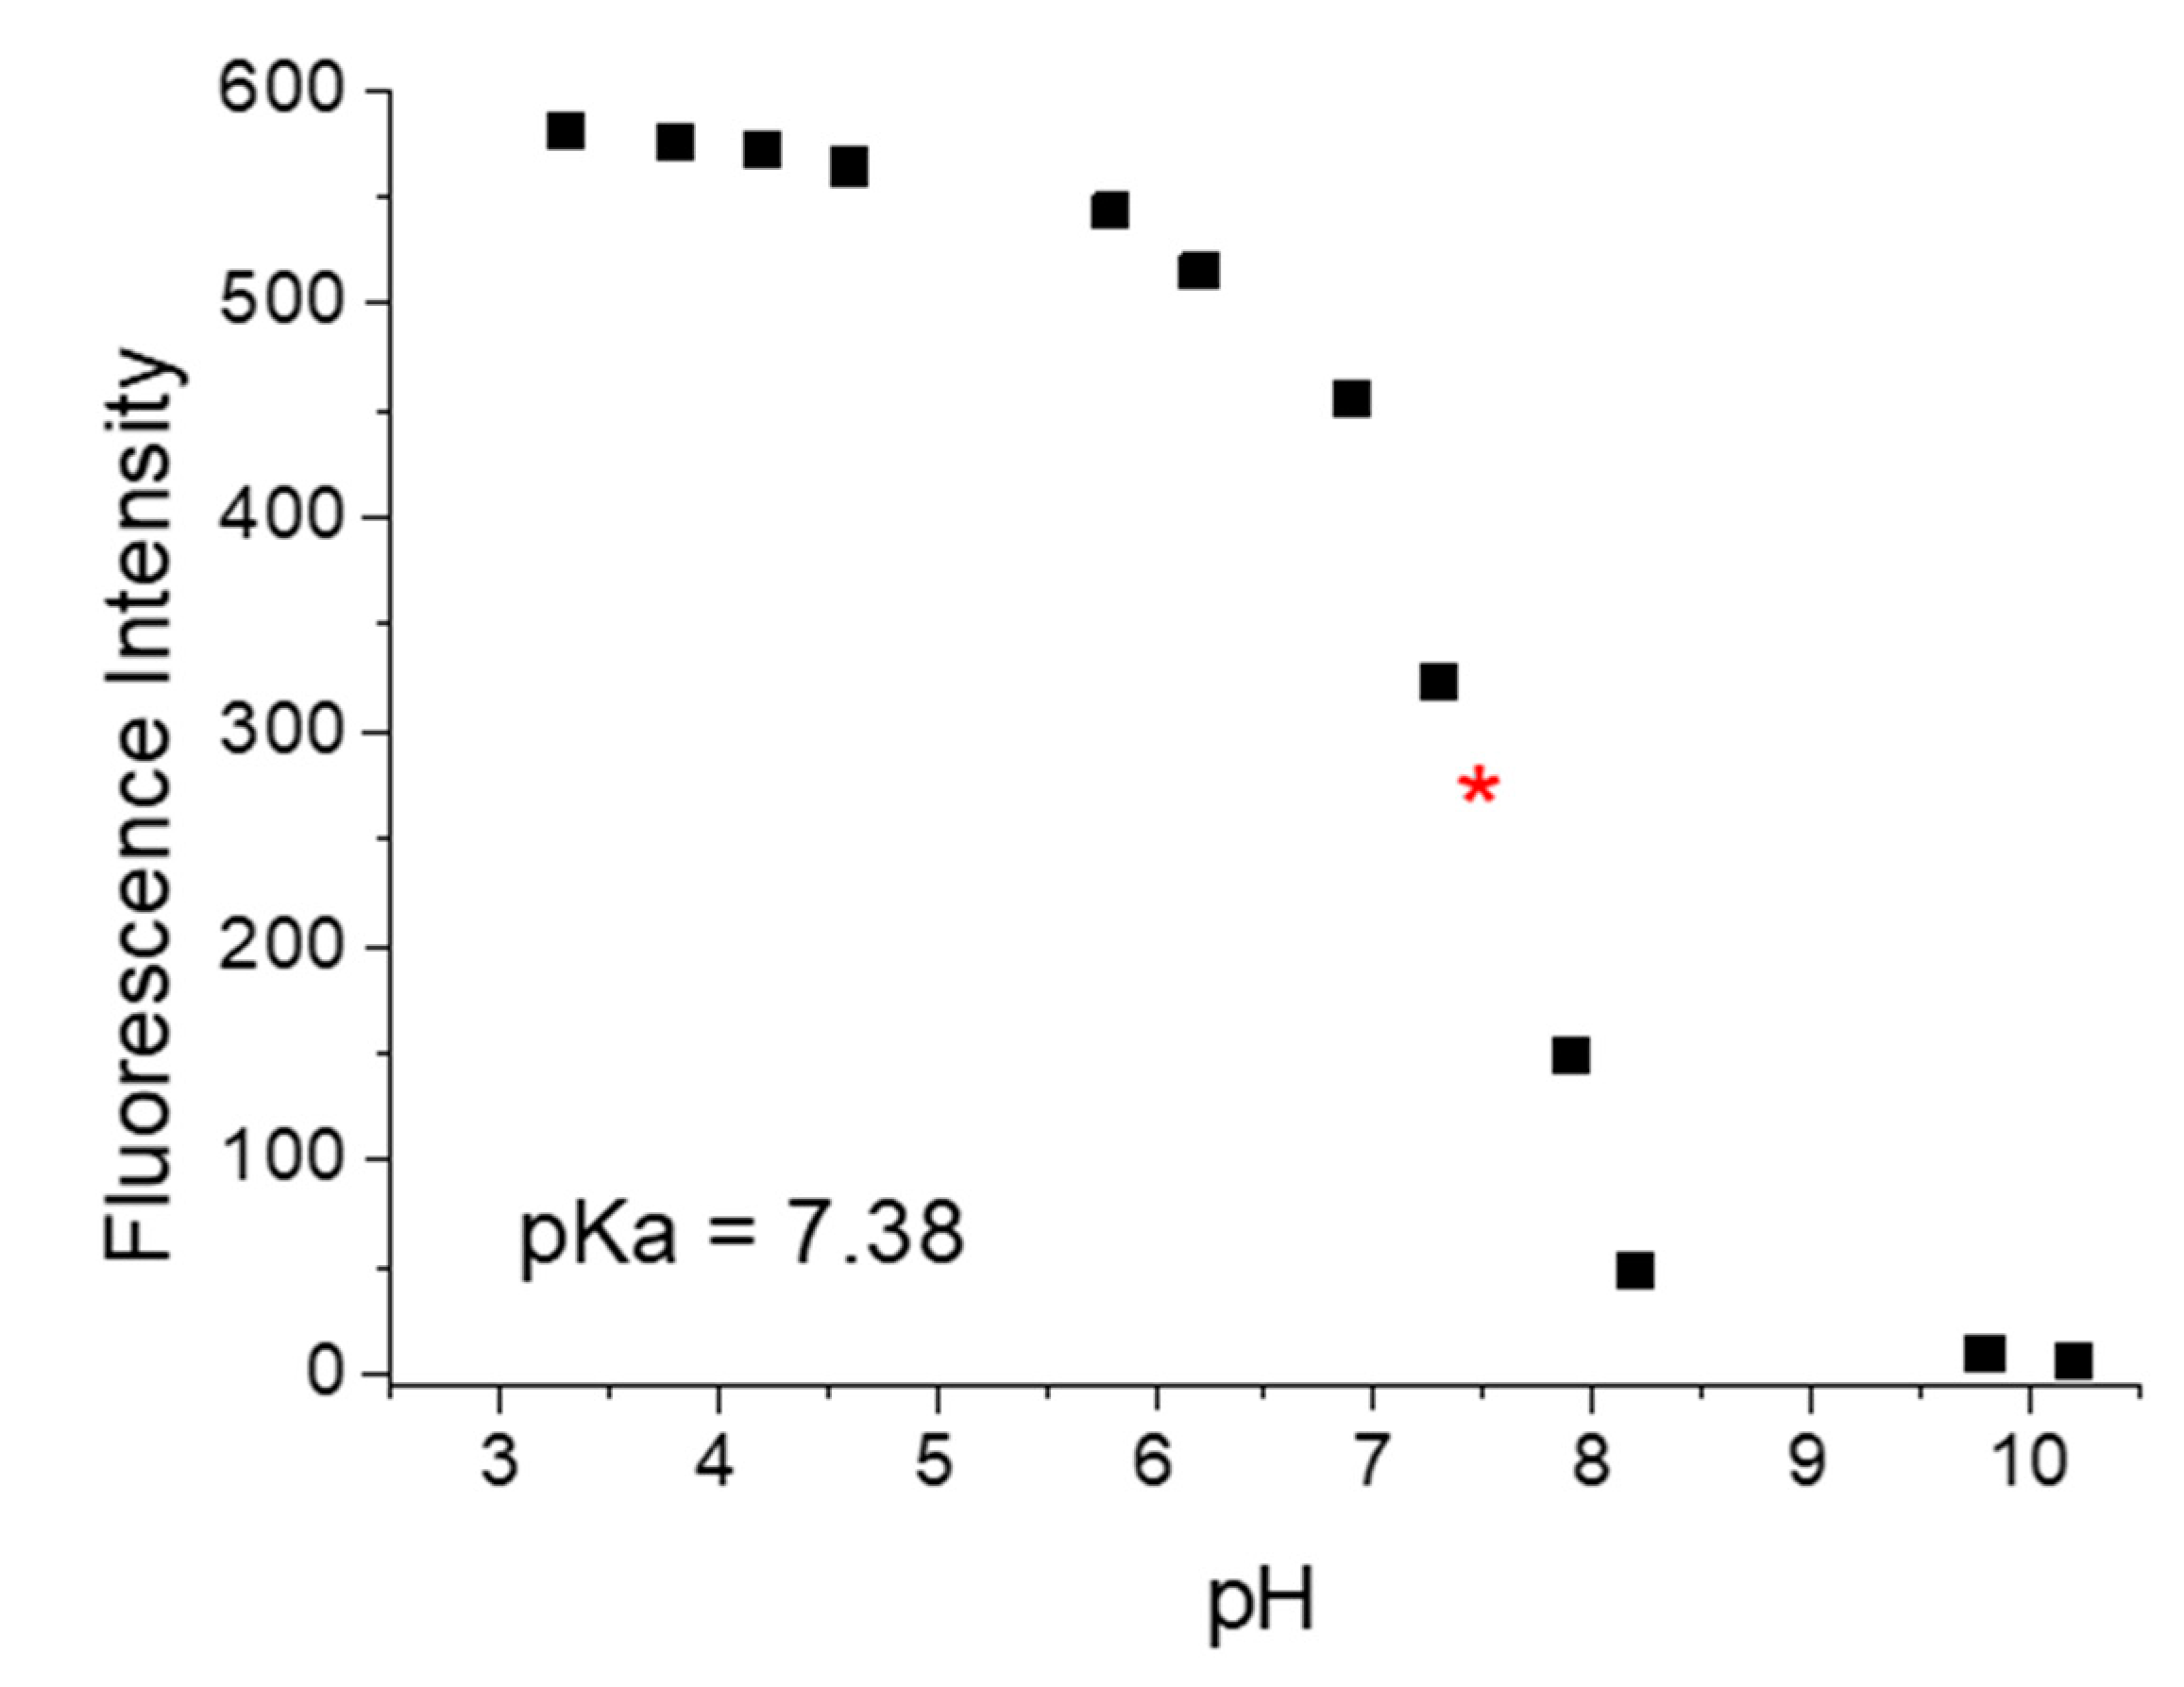
3.3. Influence of pH of the Fluorescent Intensity
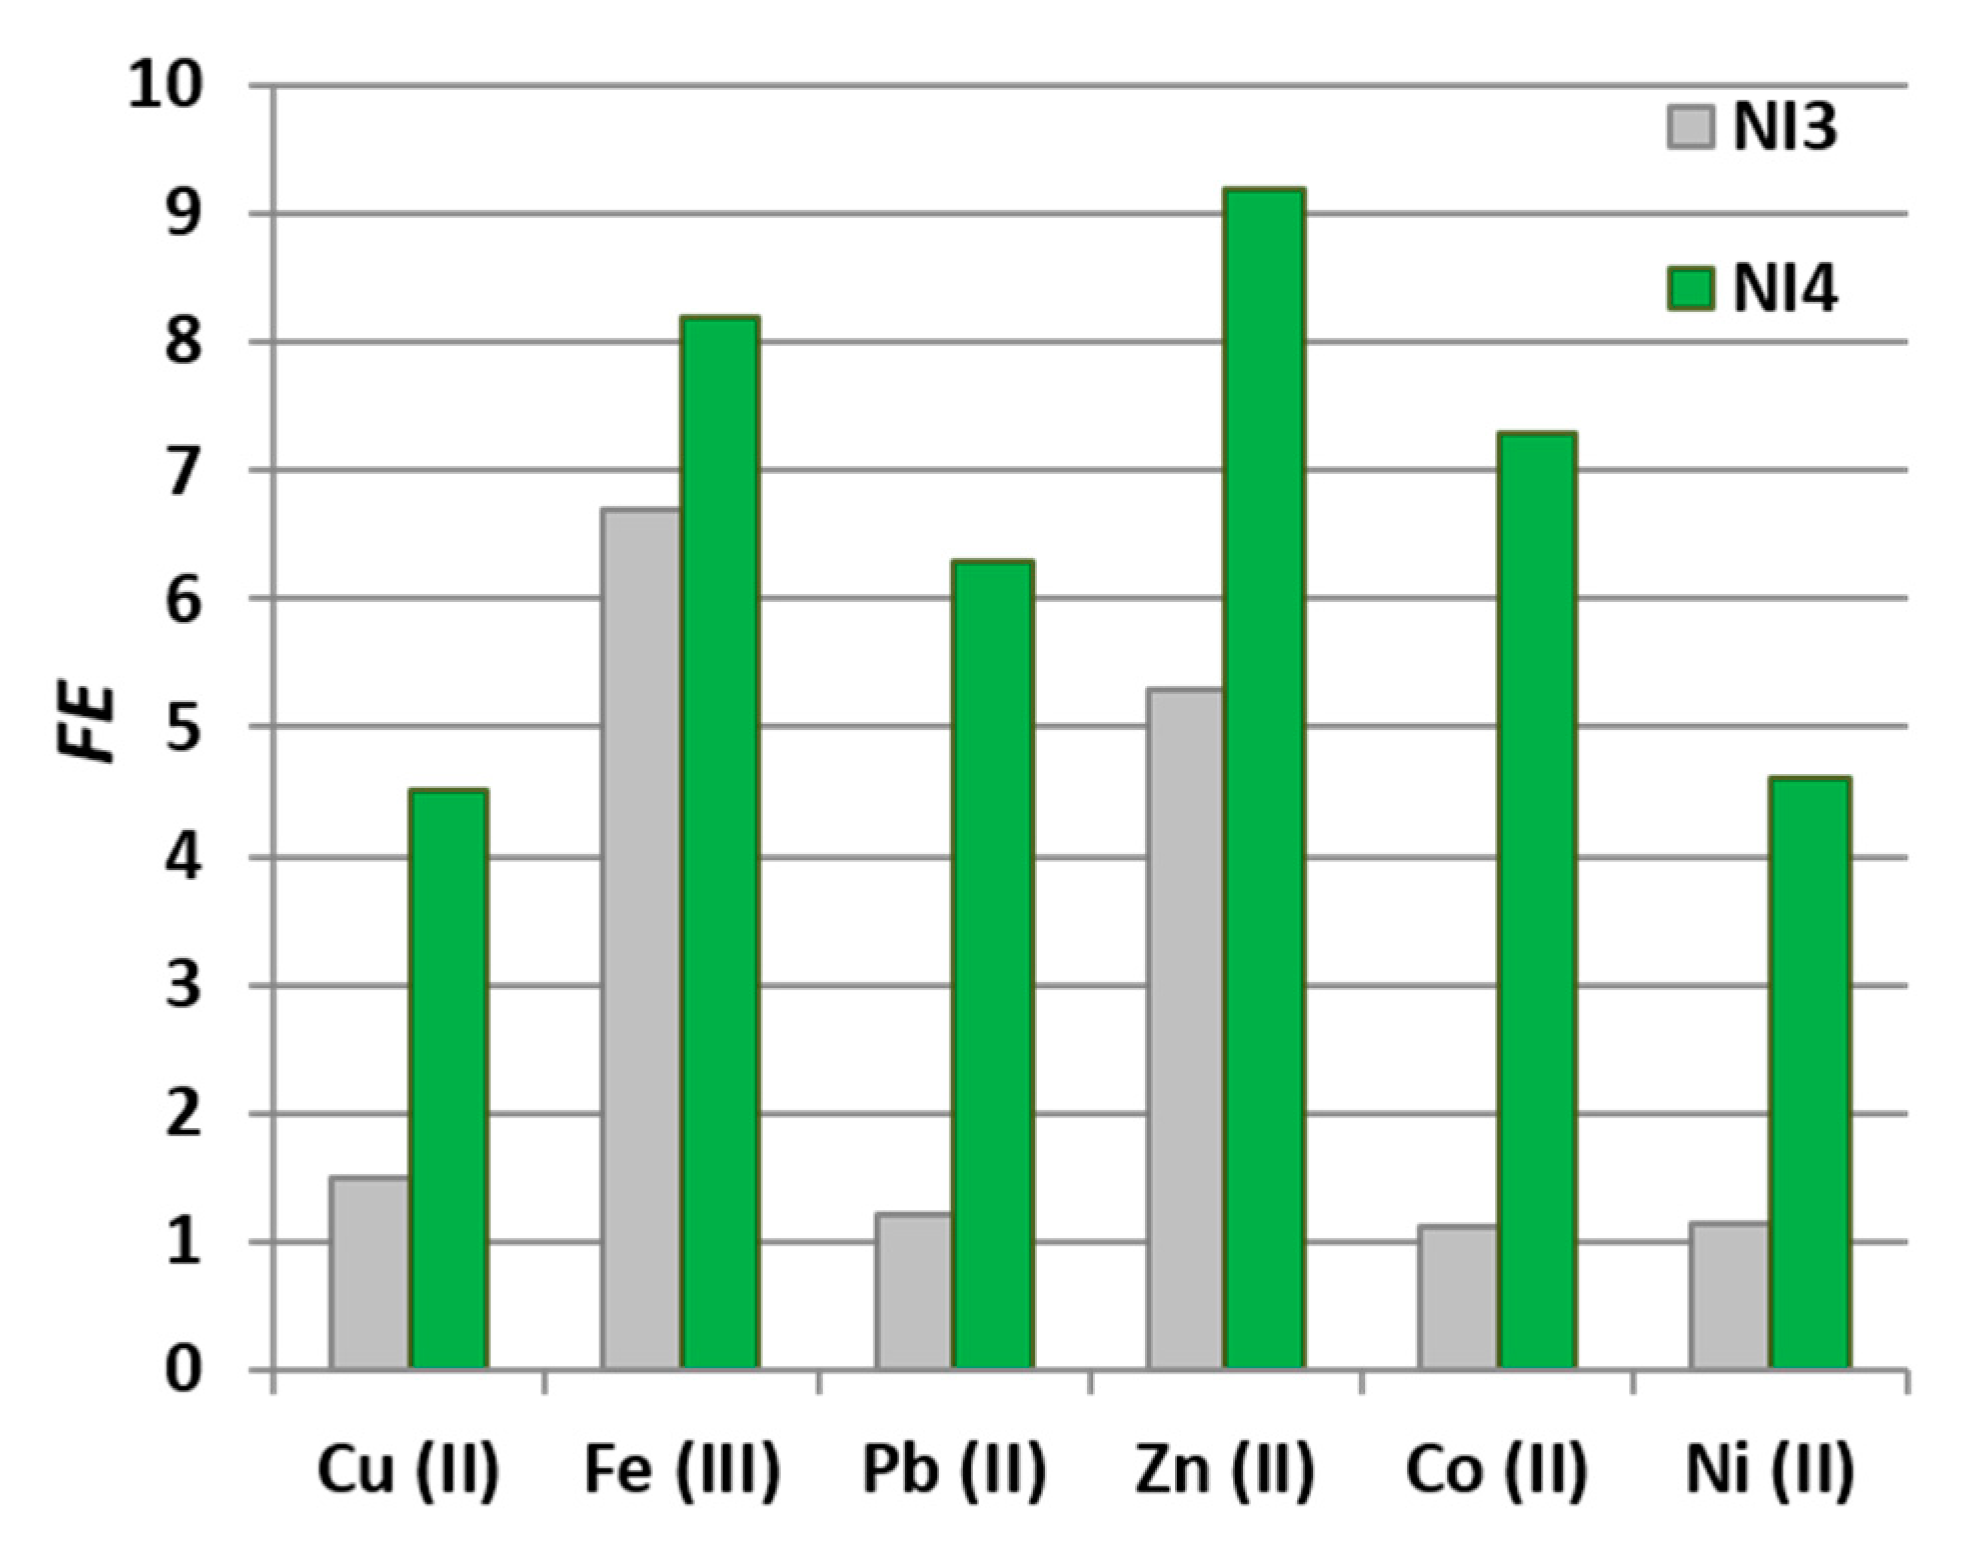
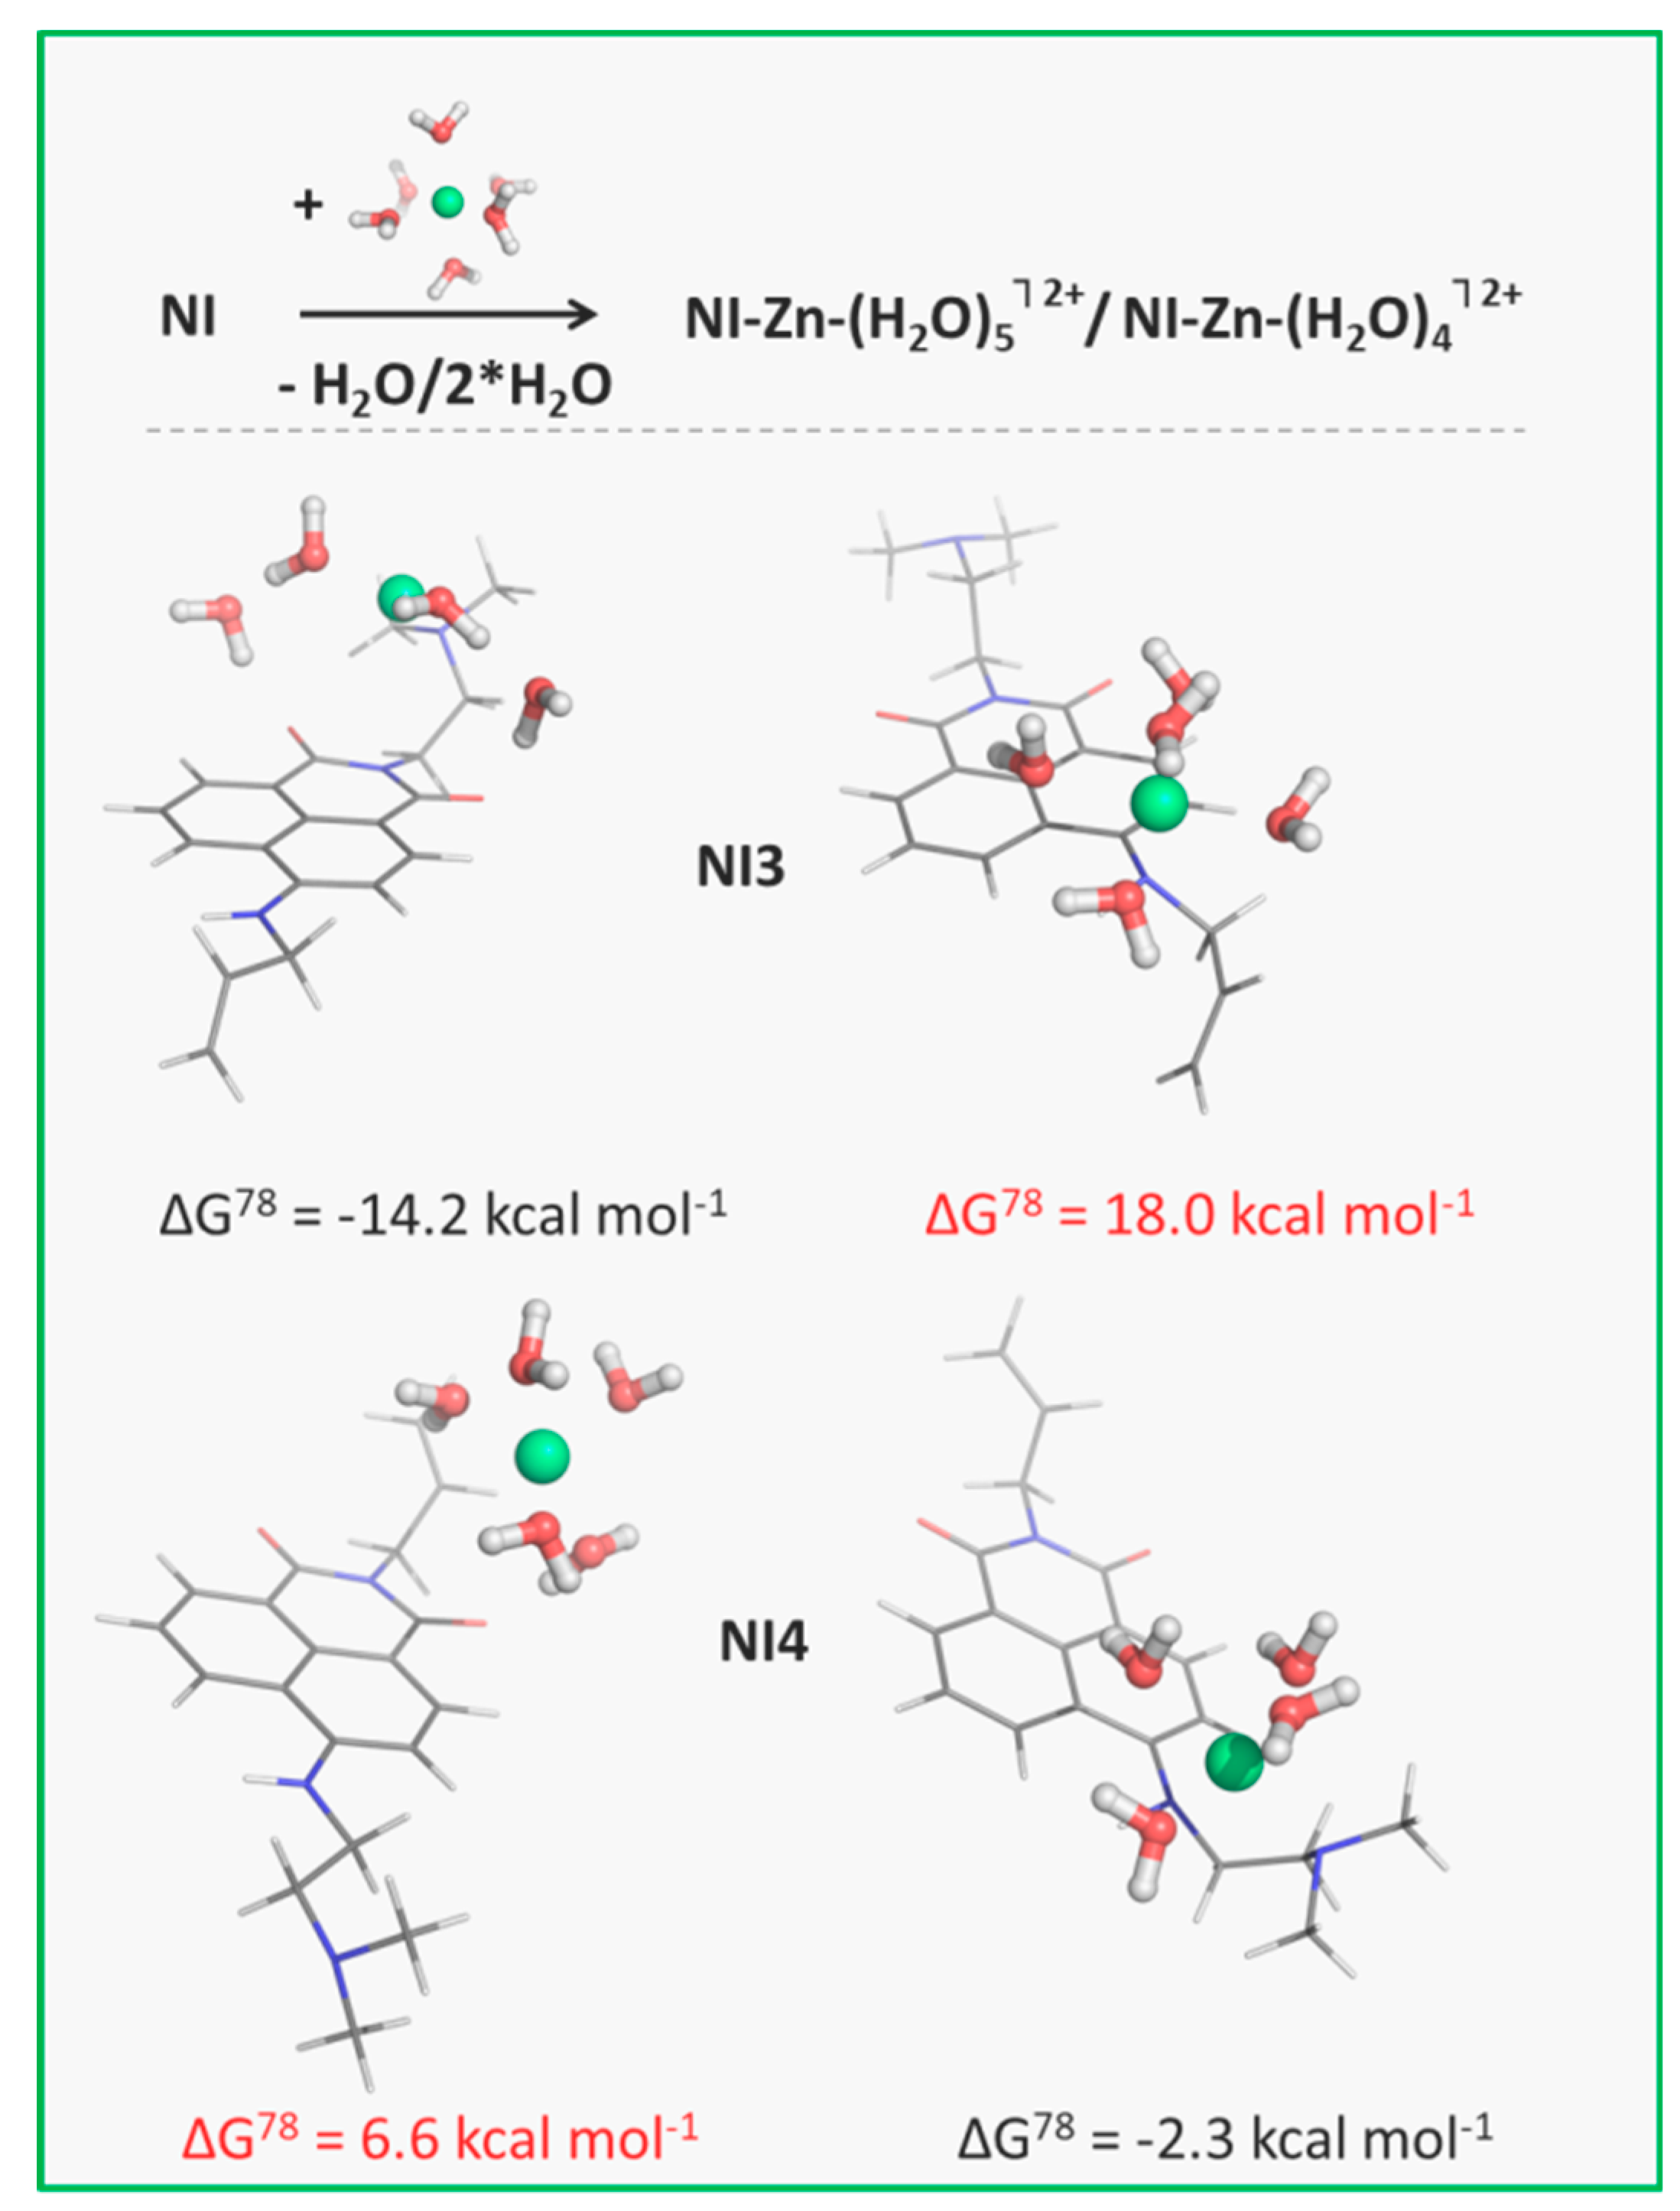
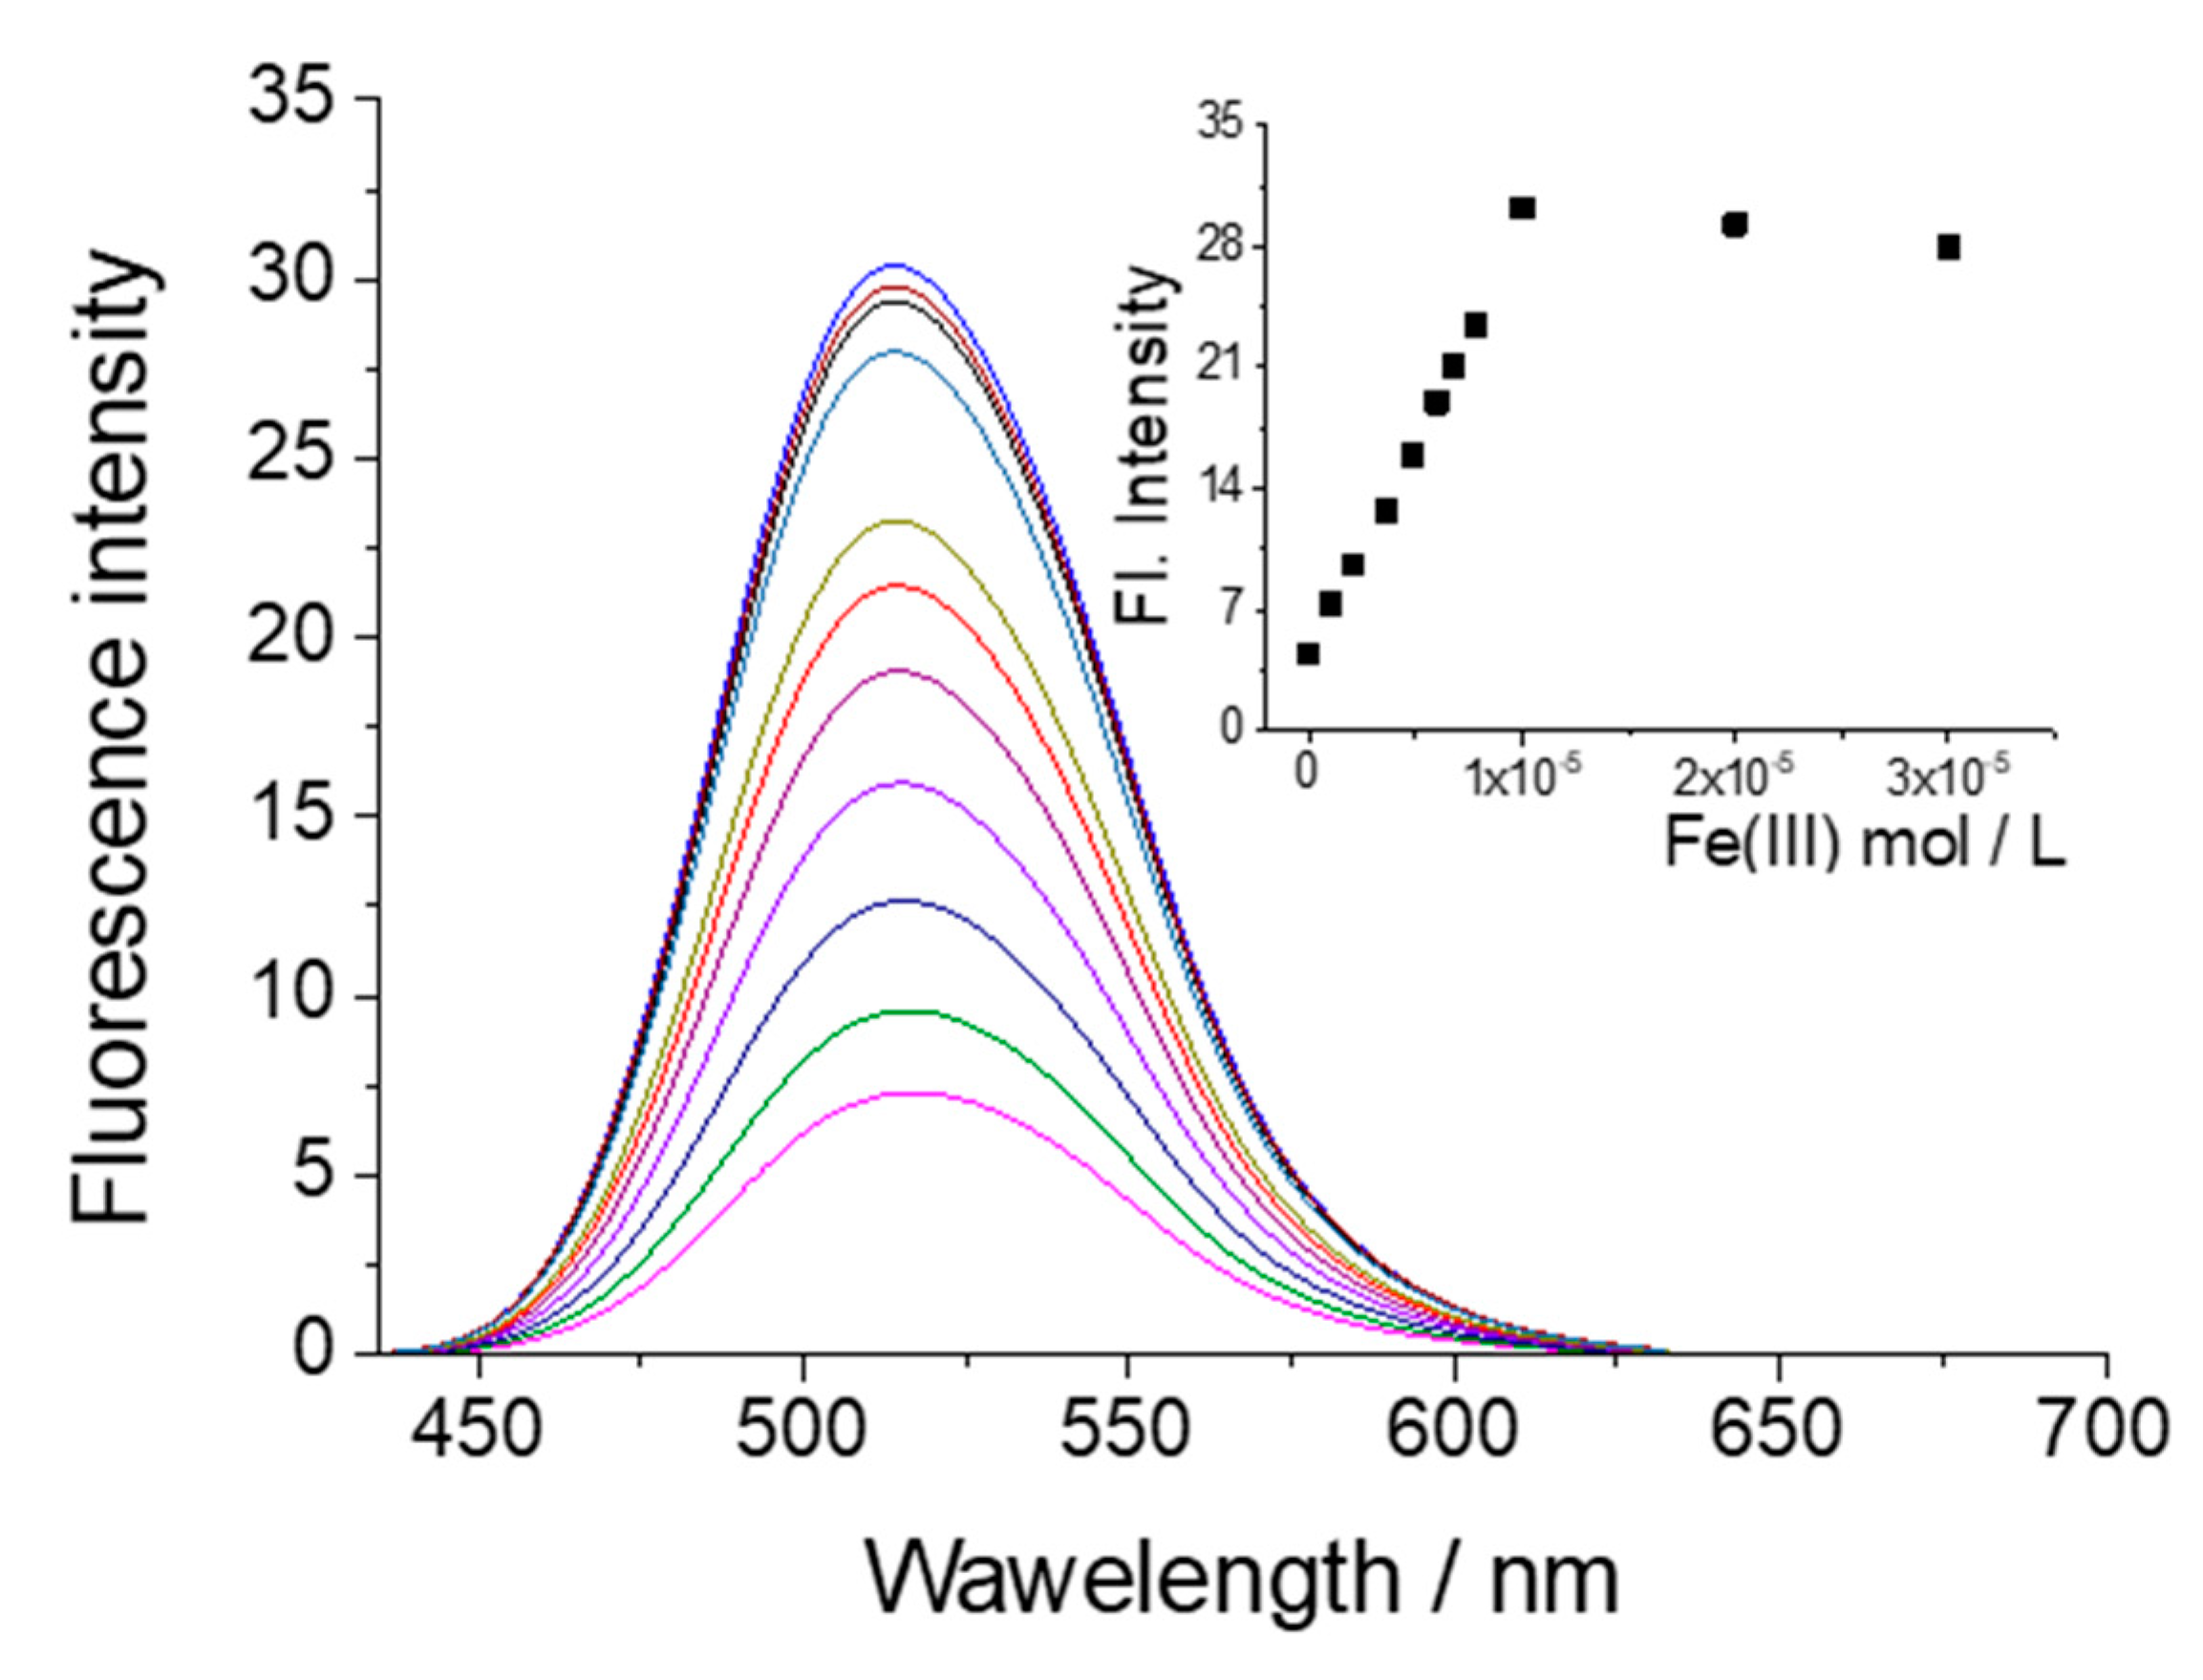
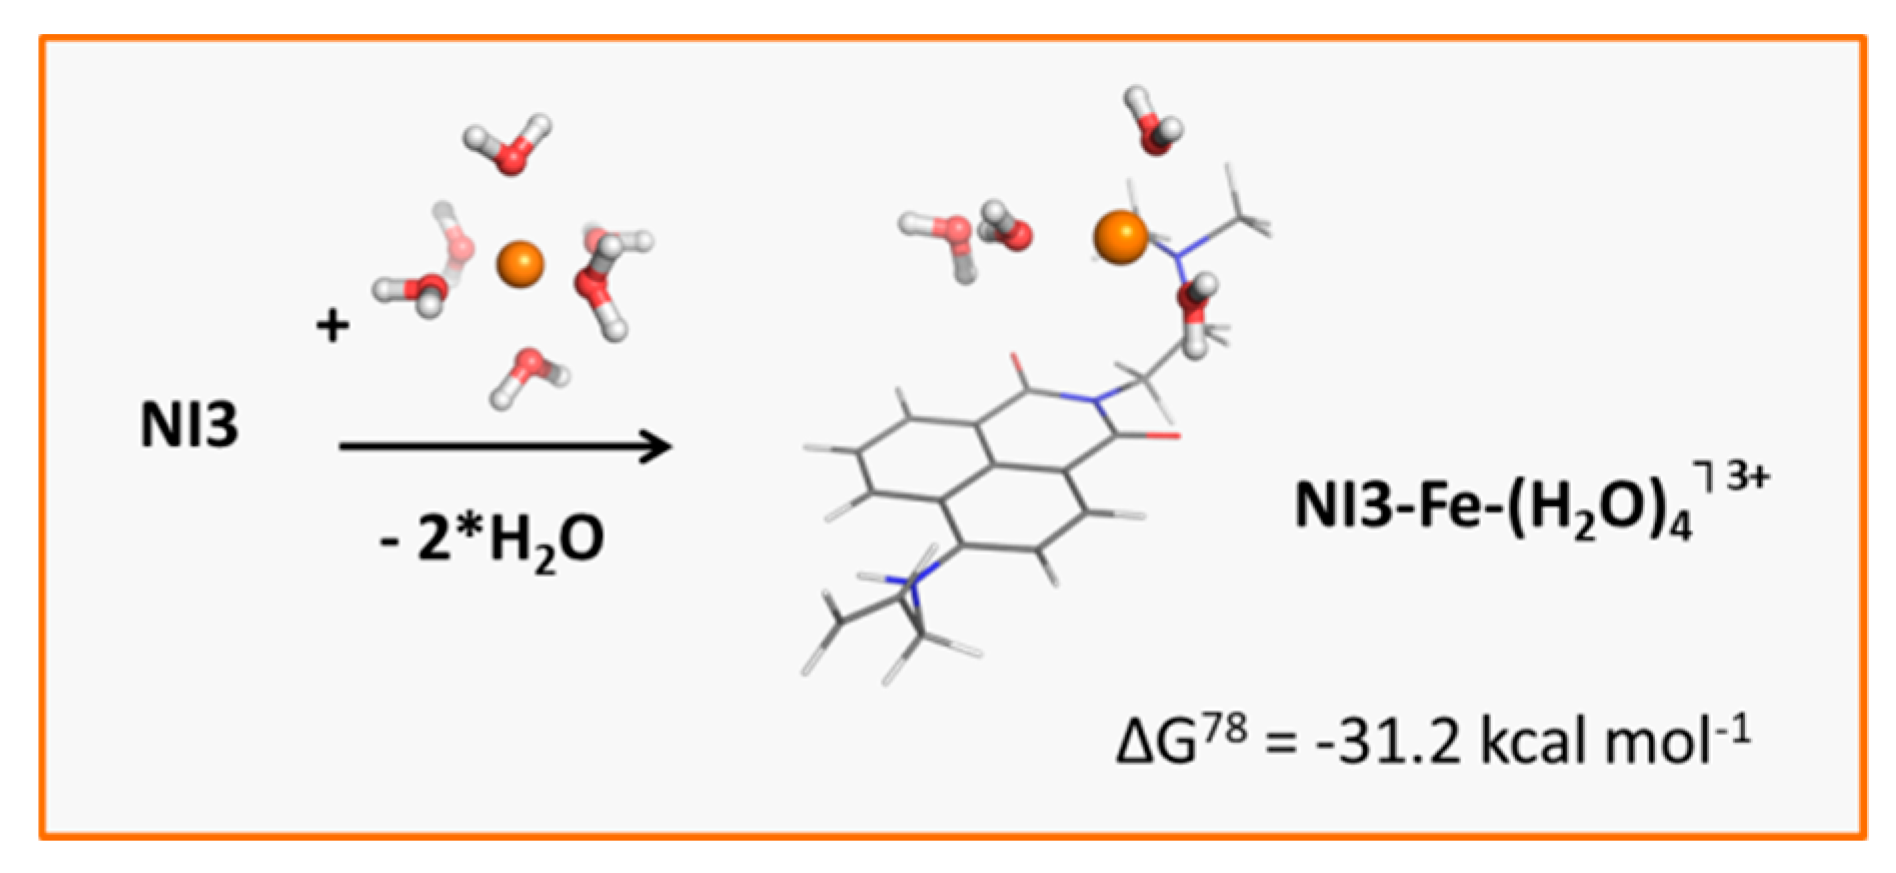
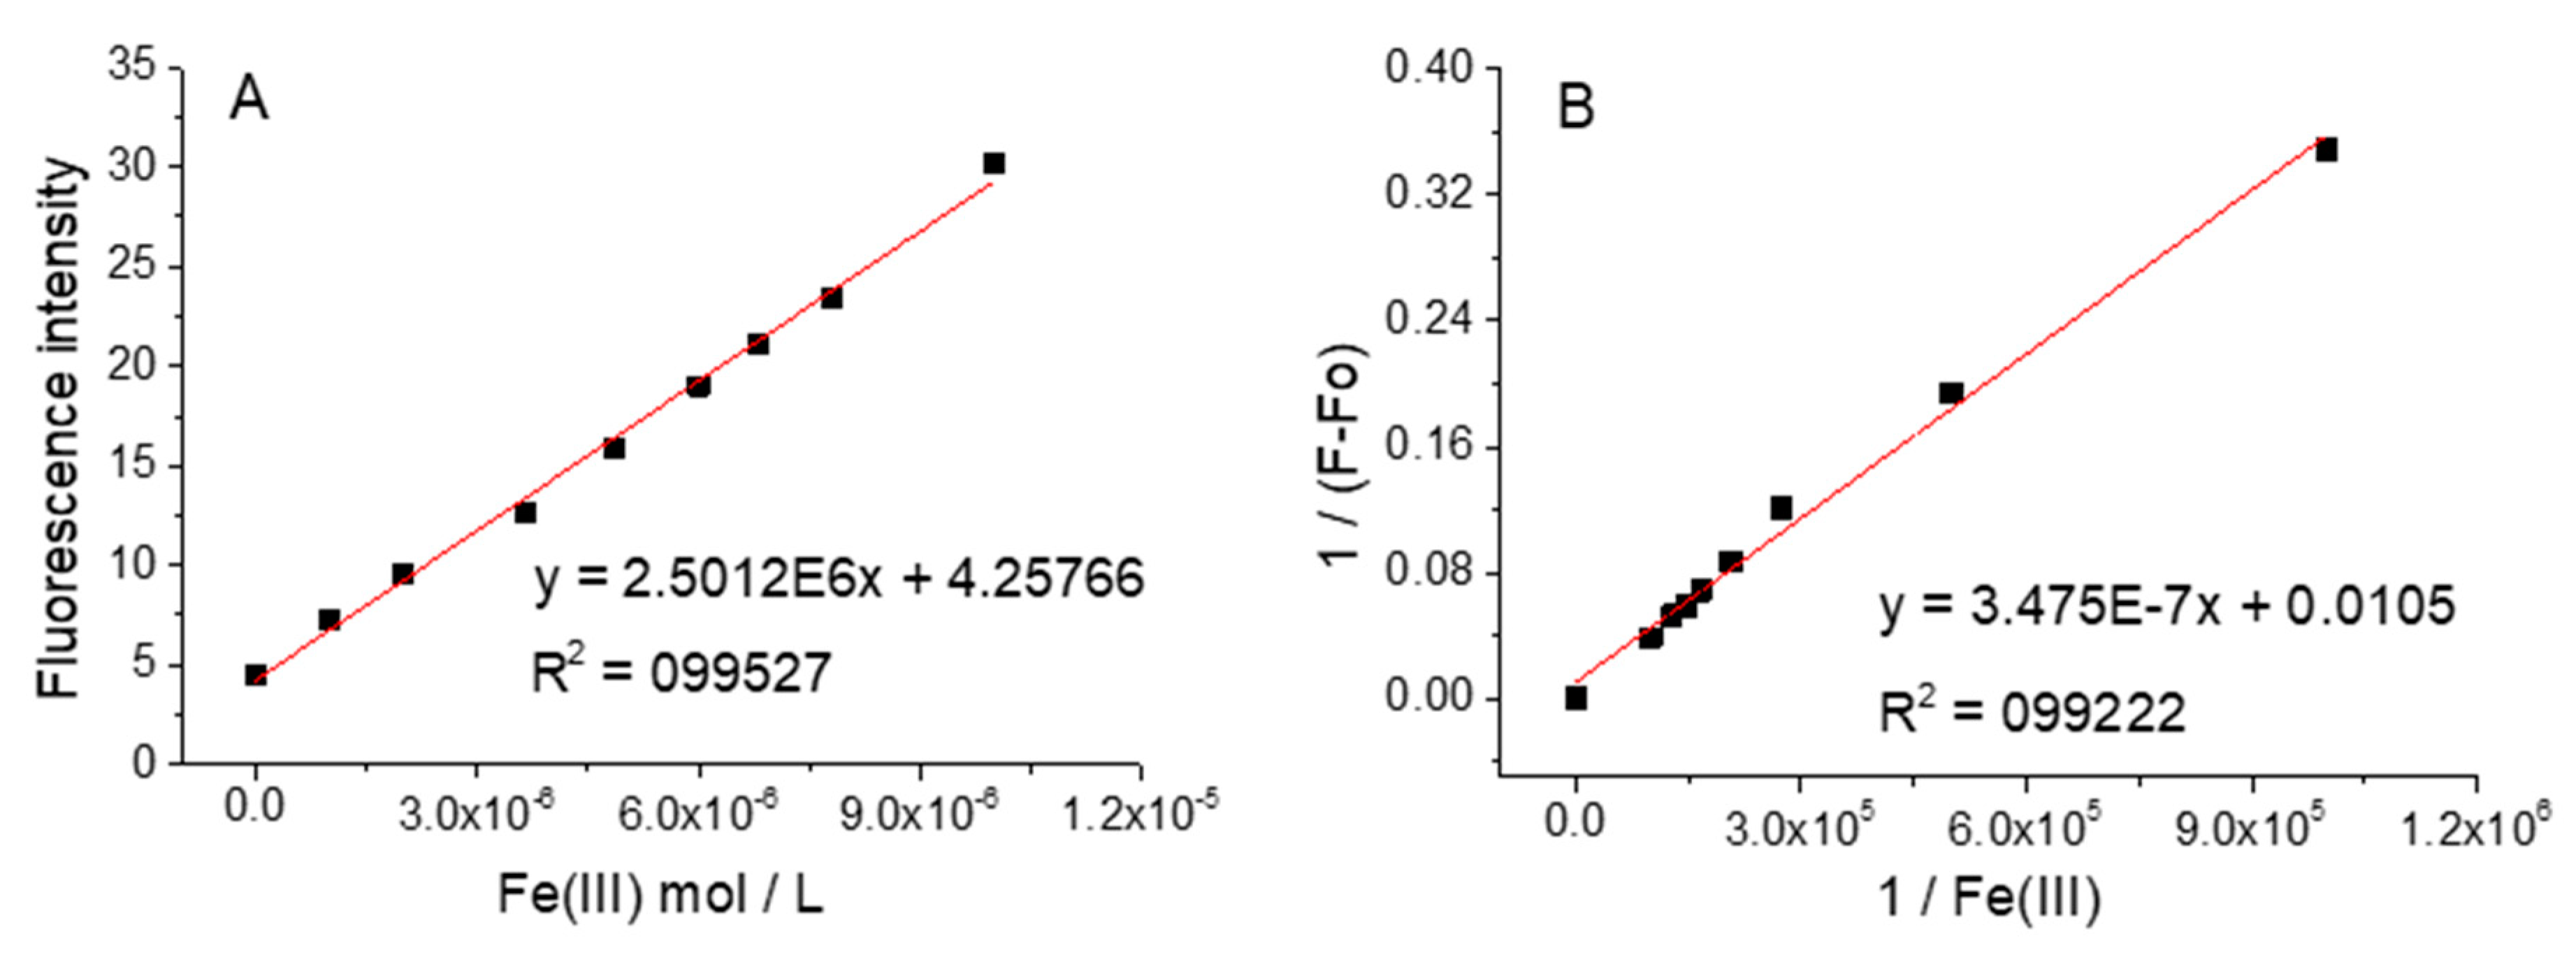
3.4. Influence of Metal Cations on the Fluorescent Intensity of NI3 and NI4
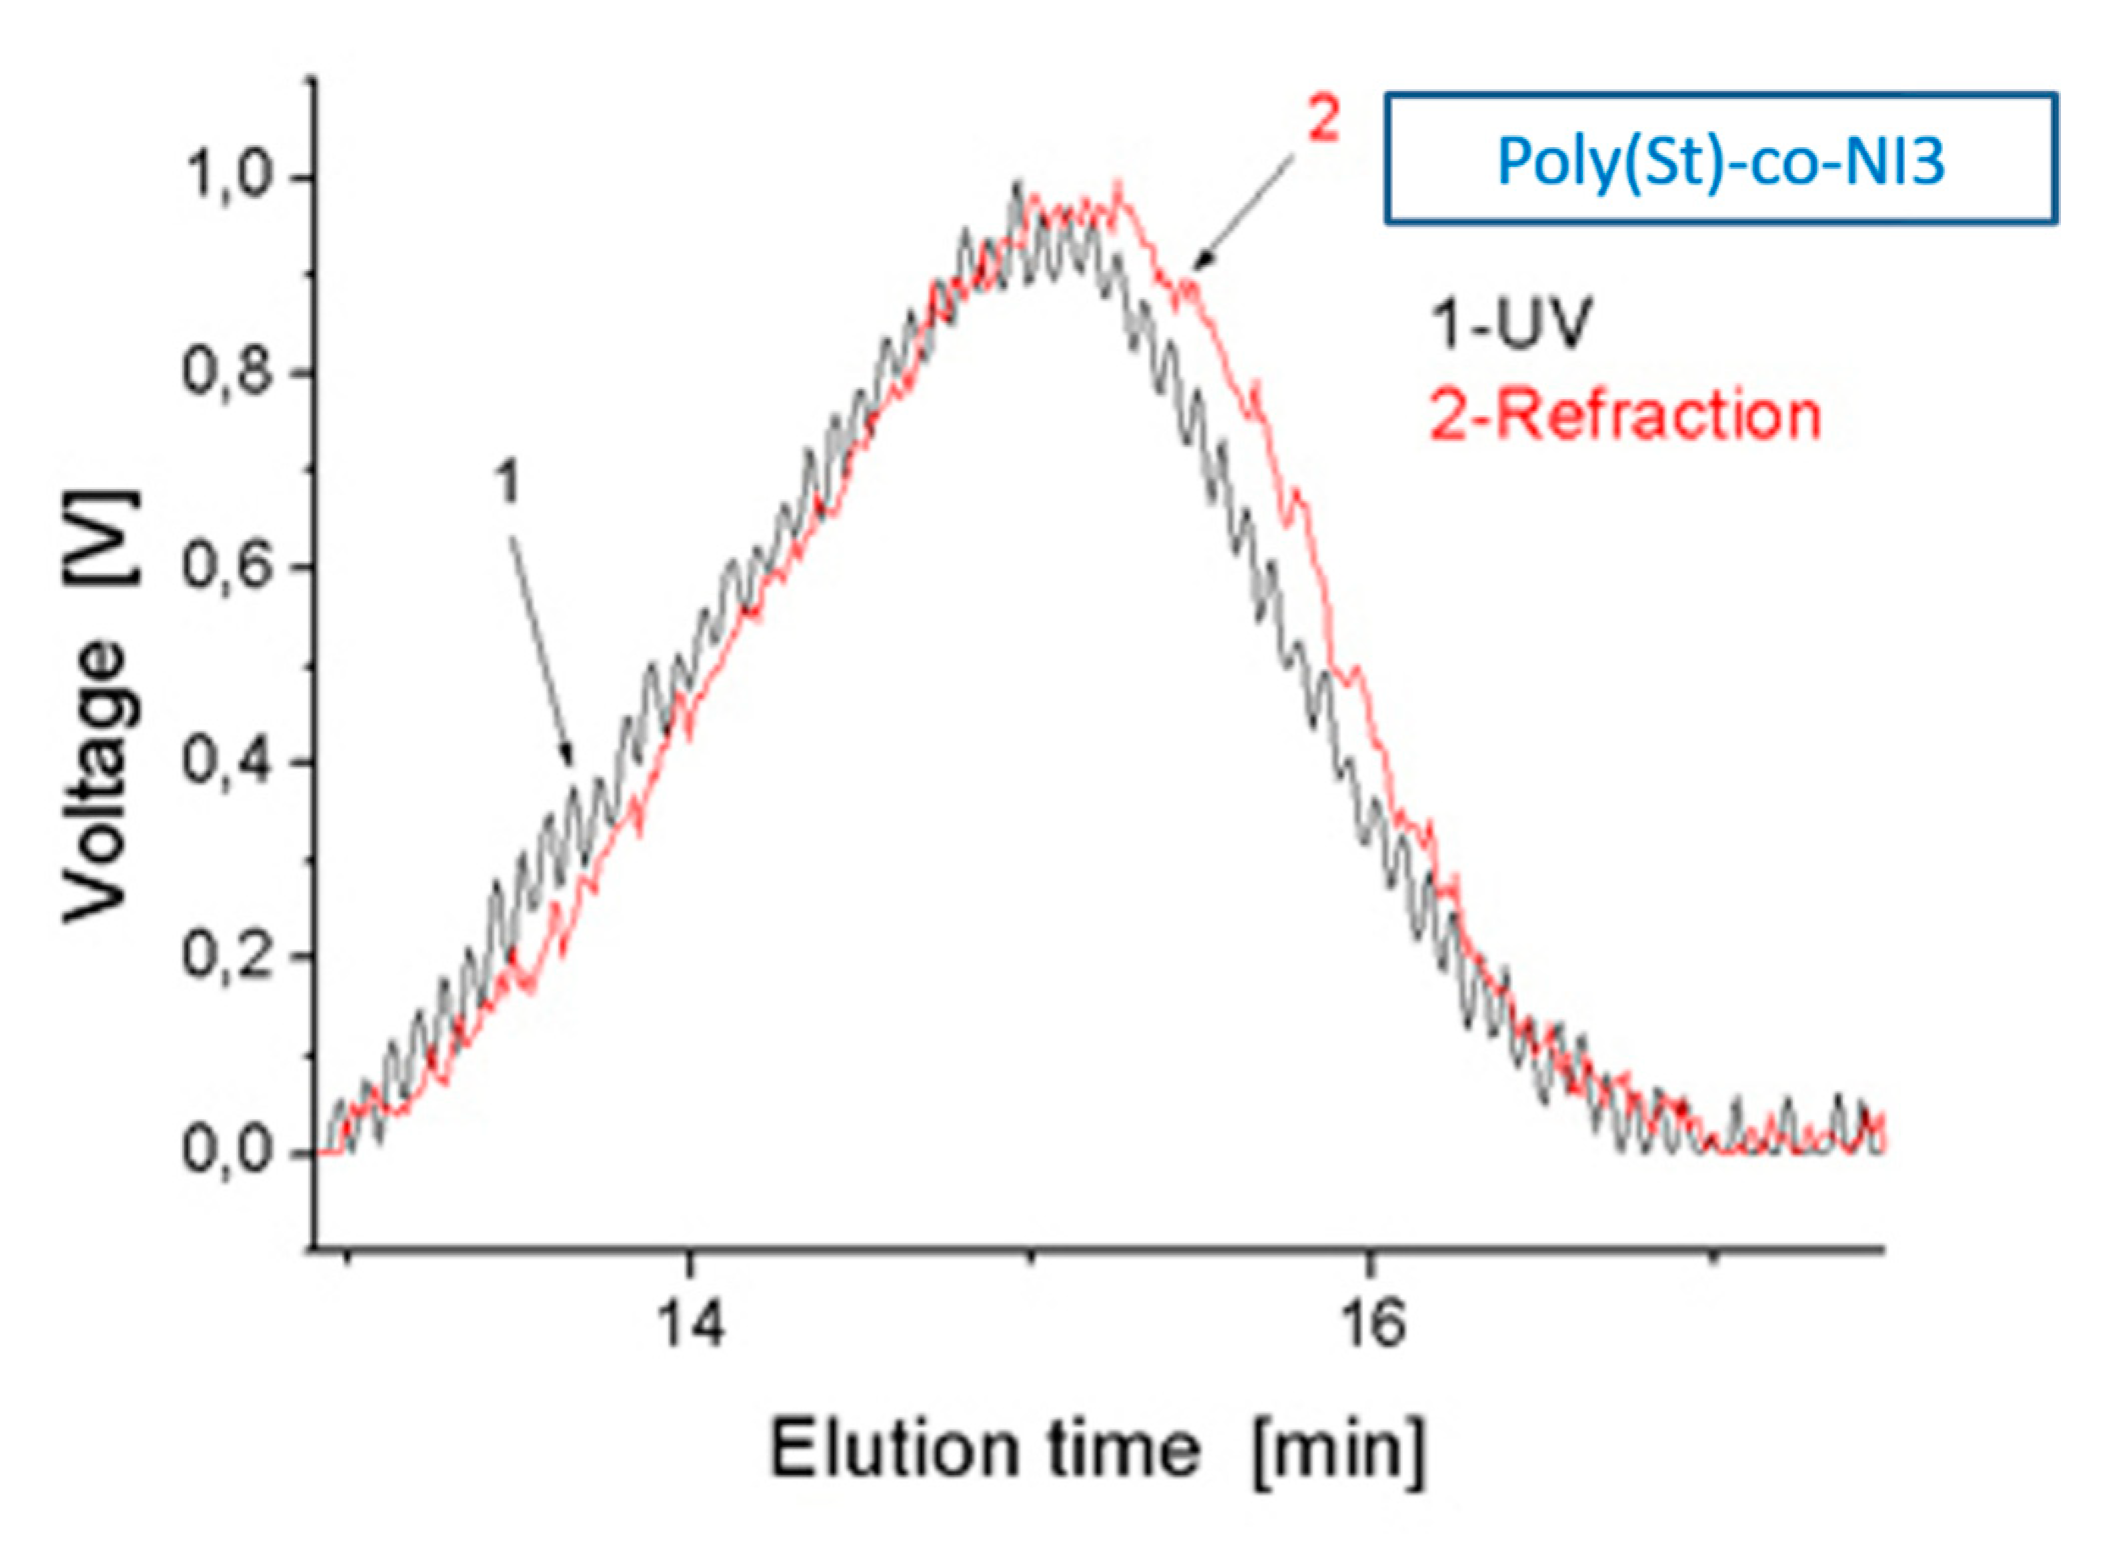
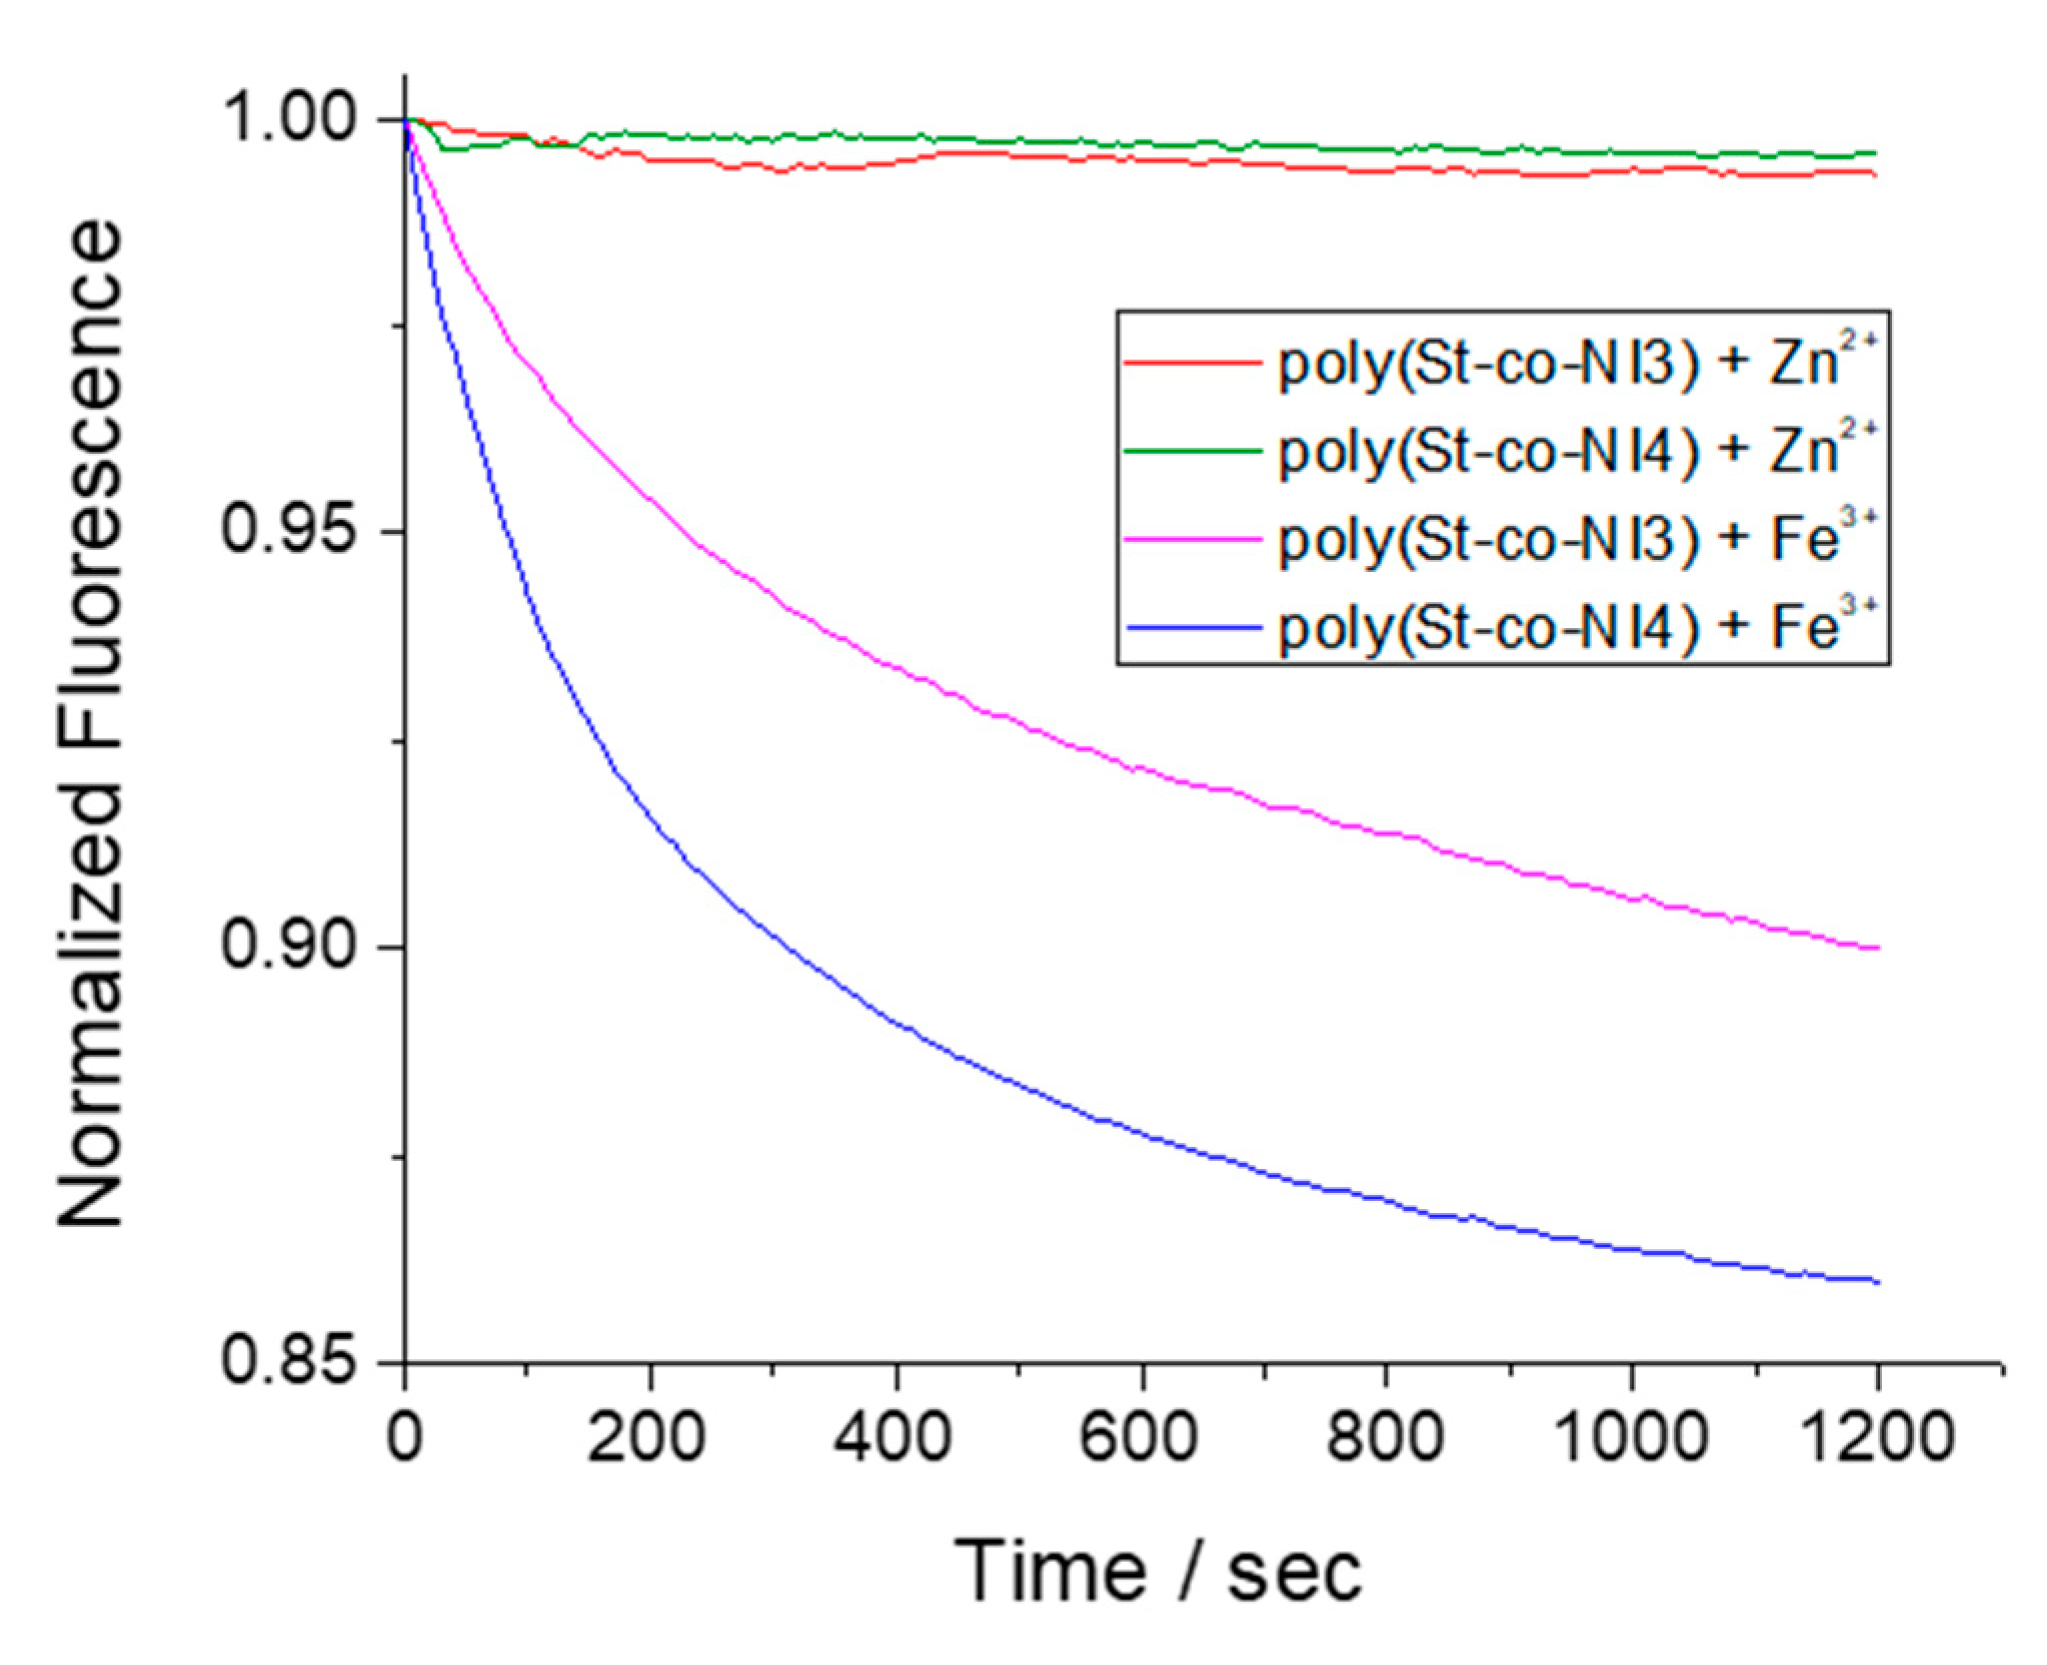
3.5. Detection Ability of Copolymers in Solid State
4. Conclusions
Author Contributions
Funding
Acknowledgments
Conflicts of Interest
References
- Grabchev, I. Photophysical Charactheristics of Polymerizable 1,8-Naphthalimide Dyes and their Copolymers with Styrene or Methylmethacrylate. Dyes Pigment. 1998, 38, 219–226. [Google Scholar] [CrossRef]
- Zhengneng, J.; Jianmei, L.; Qingfeng, X.; Lihua, W.; Xuewei, X. Synthesis and photophysical properties of fluorescent polystyrene containing 1,8-naphthalimide via atom transfer polymerization. Polymers 2007, 7, 6. [Google Scholar] [CrossRef]
- Zhang, J.; Zivic, N.; Dumurb, F.; Xiao, P.; Graff, B.; Fouassier, J.P.; Gigmes, D.; Laleve, J. N-[2-(dimethylamino)ethyl]-1,8-naphthalimide Derivatives as Photoinitiators under LEDs. Polym. Chem. 2018, 9, 994–1003. [Google Scholar] [CrossRef]
- Bonardi, A.-H.; Zahouily, S.; Dietlin, C.; Graff, B.; Morlet-Savary, F.; Ibrahim-Ouali, M.; Gigmes, D.; Hoffmann, N.; Dumur, F.; Laleve, J. New 1,8-Naphthalimide Derivatives as Photoinitiators for Free-Radical Polymerization Upon Visible Light. Catalysts 2019, 9, 637. [Google Scholar] [CrossRef]
- Li, A.M.; Xu, H. Overview of naphthalimide analogs as anticancer agents. Curr. Med. Chem. 2009, 16, 4797–4813. [Google Scholar]
- Ingrassia, L.; Lefranc, F.; Kiss, R.; Mijatovic, T. Naphthalimides and Azonafides as Promising Anti-Cancer Agents. Curr. Med. Chem. 2009, 16, 1192–1213. [Google Scholar] [CrossRef]
- Gong, H.H.; Addla, D.; Lv, J.S.; Zhou, C.H. Heterocyclic naphthalimides as new skeleton structure of compounds with increasingly expanding relational medicinal applications. Curr. Top. Med. Chem. 2016, 16, 3303–3364. [Google Scholar] [CrossRef] [PubMed]
- Vasileva-Tonkova, E.; Grozdanov, P.; Nikolova, I.; Staneva, D.; Bosch, P.; Medel, S.; Grabchev, I. Evaluation of antimicrobial, biofilm inhibitory and cytotoxic activities of a new hiperbranched polymer modified with 1,8-naphthalimide units. Biointerface Res. Appl. Chem. 2018, 8, 3053–3059. [Google Scholar]
- Zhang, Y.Y.; Zhou, C.H. Synthesis and activities of naphthalimide azoles as a new type of antibacterial and antifungal agents. Bioorg. Med. Chem. Lett. 2011, 21, 4349–4352. [Google Scholar] [CrossRef] [PubMed]
- Kamal, A.; Bolla, N.R.; Srikanth, P.S.; Srivastava, A.K. Naphthalimide derivatives with therapeutic characteristics: A patent review. Expert Opin. Ther. Pat. 2013, 23, 299–317. [Google Scholar] [CrossRef]
- Rurack, K. Flipping the light switch ‘ON’-the design of sensor molecules that show cation-induced fluorescence enhancement with heavy and transition metal ions, Spectrochem. Acta Part A 2001, 57, 2161–2195. [Google Scholar] [CrossRef]
- Panchenko, P.A.; Fedorova, O.A.; Fedorov, Y.V. Fluorescent and colorimetric chemosensors for cations based on 1,8-naphthalimide derivatives: Design principles and optical signalling mechanisms. Russ. Chem. Rev. 2014, 83, 155–182. [Google Scholar] [CrossRef]
- Patil, P.; Ingle, R.; Wagalgave, S.; Bhosale, R.; Bhosale, S.; Pawar, R.; Bhosale, S. A Naphthalimide-Benzothiazole Conjugate as Colorimetric and Fluorescent Sensor for Selective Trinitrophenol Detection. Chemosensors 2019, 7, 38. [Google Scholar] [CrossRef]
- Li, J.; Yin, C.; Huo, F. Development of fluorescent zinc chemosensors based on various fluorophores and their applications in zinc recognition. Dye. Pigment. 2016, 131, 100–133. [Google Scholar] [CrossRef]
- Mohr, G. Synthesis of naphthalimide-based indicator dyes with a 2-hydroxyethylsulfonyl function for covalent immobilisation to cellulose. Sens. Actuators B Chem. 2018, 275, 439–445. [Google Scholar] [CrossRef]
- Zakharko, M.A.; Panchenko, P.A.; Ignatov, P.A.; Fedorov, Y.V.; Fedorova, O.A. New conjugate of bis(o-aminophenoxy)ethane-N,N,N’,N’-tetraacetate with naphthalimide as a fluorescent sensor for calcium cations. Mendeleev Commun. 2020, 30, 332–335. [Google Scholar] [CrossRef]
- Callan, D.; de Silva, A.P.; Magri, D.C. Luminescent sensors and switches in the early 21th century. Tetrahedron 2005, 61, 8551–8588. [Google Scholar] [CrossRef]
- Grabchev, I.; Qian, X.; Xiao, Y.; Zhang, R. Novel heterogeneous PET fluorescent sensors selective for transition metal ions or protons: Polymers regularly labelled with naphthalimide. New J. Chem. 2002, 26, 920–926. [Google Scholar] [CrossRef]
- Sali, S.; Guittonneau, S.; Grabchev, I. A novel blue fluorescent chemosensor for metal cations and protons, based on 1,8-naphthalimide and its copolymer with styrene. Polym. Adv. Technol. 2006, 17, 180–185. [Google Scholar] [CrossRef]
- Grabchev, I.; Sali, S.; Betcheva, R.; Gregoriou, V. New green fluorescent polymer sensors for metal cations and protons. Eur. Polym. J. 2007, 43, 4297–4305. [Google Scholar] [CrossRef]
- Fischer, M.; Georges, J. Fluorescence quantum yield of rhodamine 6G in ethanol as a function of concentration using thermal lens spectrometry. Chem. Phys. Lett. 1996, 260, 115–118. [Google Scholar] [CrossRef]
- Rammachandram, B.; Sankaran, N.B.; Karamakar, R.; Saha, S.; Samanta, A. Fluorescence Signalling of Transition Metal Ions by Multi-Component Systems Comprising 4-Chloro-1,8-naphthalimide as Fluorophore. Tetrahedron 2000, 56, 7041–7044. [Google Scholar] [CrossRef]
- Becke, A.D. Density-functional thermochemistry. III. The role of exact exchange. J. Chem. Phys. 1993, 98, 5648–5652. [Google Scholar] [CrossRef]
- Lee, C.; Yang, W.; Parr, R.G. Development of the Colle-Salvetti correlation-energy formula into a functional of the electron density. Phys. Rev. B 1988, 37, 785–789. [Google Scholar] [CrossRef]
- Hehre, W.J.; Ditchfield, R.; Pople, J.A. Self—Consistent Molecular Orbital Methods. XII. Further Extensions of Gaussian—Type Basis Sets for Use in Molecular Orbital Studies of Organic Molecules. J. Chem. Phys. 1972, 56, 2257–2261. [Google Scholar] [CrossRef]
- Clark, T.; Chandrasekhar, J.; Spitznagel, G.W.; Schleyer, P.v.R. Efficient diffuse function-augmented basis sets for anion calculations. III. The 3–21+G basis set for first-row elements, Li–F. J. Comp. Chem. 1983, 4, 294–301. [Google Scholar] [CrossRef]
- Frisch, M.J.; Pople, J.A.; Binkley, J.S. Self-consistent molecular orbital methods 25. Supplementary functions for Gaussian basis sets. J. Chem. Phys. 1984, 80, 3265–3269. [Google Scholar] [CrossRef]
- Tomasi, J.; Mennucci, B.; Cammi, R. Quantum Mechanical Continuum Solvation Models. Chem. Rev. 2005, 105, 2999–3094. [Google Scholar] [CrossRef]
- Frisch, M.J. Gaussian 09, Revision D.01; Gaussian, Inc.: Wallingford, CT, USA, 2013. [Google Scholar]
- The PyMOL. Molecular Graphics System, Version 1.7.6.6; Schrödinger, LLC: New York, NY, USA, 2015. [Google Scholar]
- Martin, E.; Weigand, R.; Pardo, A. Solvent dependence of the inhibition of intramolecular charge-transfer in N-substituted 1,8-naphthalimide derivatives as dye lasers. J. Lumin. 1996, 68, 157. [Google Scholar] [CrossRef]
- Stoyanov, S.; Petrov, P.; Stoyanova, M.; Dangalov, M.; Shivachev, B.; Nikolova, R.; Petkov, I. 4-Amino-3-nitro naphthalimides-structures and spectral properties. J. Photochem. Photobiol. A Chem. 2012, 250, 92–98. [Google Scholar] [CrossRef]
- Alexiou, M.; Tychopoulos, V.; Ghorbanian, S.; Tyman, J.; Brown, R.; Brittain, P. The UV–visible absorption and fluorescence of some substituted 1,8-naphthalimides and naphthalic anhydrides. J. Chem. Soc. Perkin Trans. 1990, 2, 837–842. [Google Scholar] [CrossRef]
- Grabchev, I.; Meallier, P.; Konstantinova, T.; Popova, M. Synthesis of Some Unsaturated 1,8-Naphthalimide Dyes. Dyes Pigment. 1995, 28, 41–46. [Google Scholar] [CrossRef]
- Grabchev, I.; Philipova, T.; Meallier, P. Guittonneau, Influence of Substituents on the Spectroscopic and Photochemical Properties of Naphthalimide Derivatives. Dyes Pigment. 1996, 31, 31–34. [Google Scholar] [CrossRef]
- Grabchev, I.; Chovelon, J.-M.; Qian, X. Copolymer of 4-N,N-dimethylaminoethylene-N-allyl-1,8-Naphthalimide with Methylmethacrilate as Selective Fluorescent Chemosensor in Homogeneous System for Metal Cations. J. Photochem. Photobiol. A Chem. 2003, 158, 37–43. [Google Scholar] [CrossRef]
- Poteau, X.; Brown, A.I.; Brown, R.G.; Holmes, C.; Matthew, D. Fluorescence switching in 4-amino-1,8-naphthalimides: “on-off-on” operation controlled by solvent and cations. Dye. Pigment. 2000, 47, 91–105. [Google Scholar] [CrossRef]
- Eilmes, A. Solvatochromic probe in molecular solvents: Implicit versus explicit solvent model. Theor. Chem. Acc. 2014, 133, 1538. [Google Scholar] [CrossRef]
- Marques, M.A.L.; Maitra, N.T.; Nogueira, F.M.S.; Gross, E.K.U.; Rubio, A. (Eds.) Fundamentals of Time-Dependent Density Functional Theory; Springer: Berlin/Heidelberg, Germany, 2012. [Google Scholar]
- Zhao, S.D.; Swager, T.M. Sensory Responses in Solution vs. Solid State: A Fluorescence Quenching Study of Poly (iptycenebutadiynylene). Macromolecules 2005, 38, 9377–9384. [Google Scholar] [CrossRef]
- Pinnock, S.S.; Malele, C.N.; Che, J.; Jones, W.E. The Role of Intermolecular Interactions in Solid State Fluorescent Conjugated Polymer Chemosensors. J. Fluoresc. 2011, 22, 583–589. [Google Scholar] [CrossRef]
- Gao, Y.; Liu, H.; Liu, Q.; Wang, W. A novel colorimetric and OFF-ON fluorescent chemosensor based on fluorescein derivative for the detection of Fe3+ in aqueous solution and living cells. Tetrahedron Lett. 2016, 57, 1852–1855. [Google Scholar] [CrossRef]
- Bao, X.; Cao, Q.; Wu, X.; Shu, H.; Zhou, B.; Geng, Y.; Zhu, J. Design and synthesis of anew selective fluorescent chemical sensor for Cu2+ based on a Pyrrole moiety and a Fluorescein conjugate. Tetrahedron Lett. 2016, 57, 942–948. [Google Scholar] [CrossRef]
- Wenxuna, G.; Yaqinga, Z.; Botianb, L.; Liming, T. Fluorescent sensor of copper(II) ions based on PMBA microtubes with 4-methoxy-1,8-naphthalimide groups. React. Funct. Polym. 2020, 146, 104400. [Google Scholar] [CrossRef]


| Mw × 105 g/mol | Mn × 105 g/mol | Mw/Mn | Chemically Bound NI % | |
|---|---|---|---|---|
| poly(St-co-NI3) | 0.97 | 0.48 | 2.02 | 0.75 |
| poly(St-co-NI4) [18] | 1.21 | 0.64 | 1.89 | 0.94 |
| Solvents | ET (30) Kcal/mol | λA nm | ε L mol−1 cm−1 | λF nm | υA−υF cm−1 | ΦF |
|---|---|---|---|---|---|---|
| Acetonitrile | 45.6 | 433 | 12,400 | 523 | 3974 | 0.61 |
| DMF | 43.8 | 431 | 13,900 | 517 | 3859 | 0.67 |
| Acetone | 42.2 | 429 | 12,400 | 518 | 4005 | 0.58 |
| Methanol | 55.4 | 435 | 15,900 | 529 | 4084 | 0.51 |
| 2-Propanol | 48.4 | 436 | 13,600 | 527 | 3960 | 0.71 |
| Diethyl ether | 34.5 | 418 | 12,600 | 486 | 3347 | 0.59 |
| Chloroform | 39.1 | 425 | 11,600 | 507 | 3805 | 0.59 |
| Dichloromethane | 39.4 | 422 | 12,300 | 504 | 3855 | 0.53 |
| Tetrahydrofuran | 37.4 | 423 | 13,200 | 497 | 3519 | 0.66 |
| Toluene | 33.9 | 414 | 13,300 | 478 | 3234 | 0.57 |
| Compound | Solvent | ε, D | λmax, nm | f |
|---|---|---|---|---|
| NI3 | Toluene | 2.4 | 404 | 0.32 |
| Methanol | 32.6 | 417 | 0.27 | |
| NI4 | Toluene | 2.4 | 409 | 0.34 |
| Methanol | 32.6 | 417 | 0.33 |
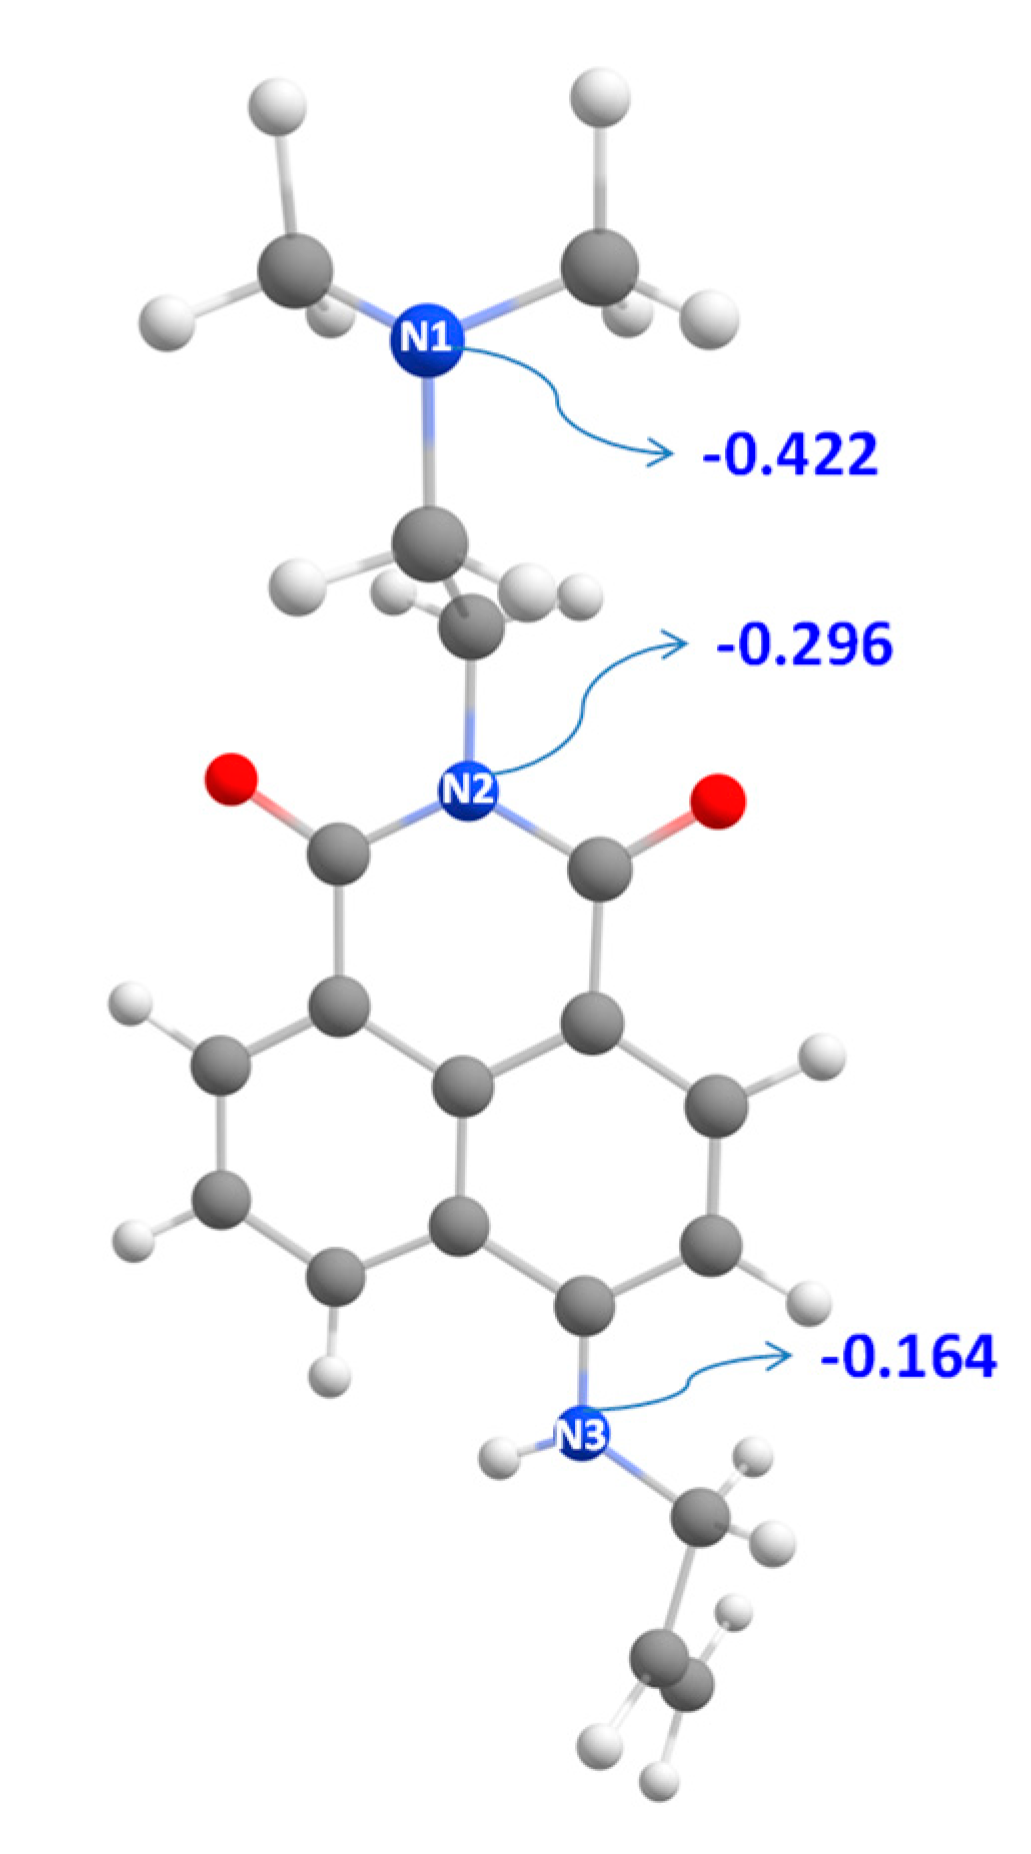
| Structure | ΔG1, kcal mol−1 | ΔG78, kcal mol−1 |
|---|---|---|
| NI3-H+ (N1) | 0.00 | 0.00 |
| NI3-H+ (N2) | 35.69 | 41.53 |
| NI3-H+ (N3) | 27.51 | 21.67 |
© 2020 by the authors. Licensee MDPI, Basel, Switzerland. This article is an open access article distributed under the terms and conditions of the Creative Commons Attribution (CC BY) license (http://creativecommons.org/licenses/by/4.0/).
Share and Cite
Staneva, D.; Angelova, S.; Grabchev, I. Spectral Characteristics and Sensor Ability of a New 1,8-Naphthalimide and Its Copolymer with Styrene. Sensors 2020, 20, 3501. https://doi.org/10.3390/s20123501
Staneva D, Angelova S, Grabchev I. Spectral Characteristics and Sensor Ability of a New 1,8-Naphthalimide and Its Copolymer with Styrene. Sensors. 2020; 20(12):3501. https://doi.org/10.3390/s20123501
Chicago/Turabian StyleStaneva, Desislava, Silvia Angelova, and Ivo Grabchev. 2020. "Spectral Characteristics and Sensor Ability of a New 1,8-Naphthalimide and Its Copolymer with Styrene" Sensors 20, no. 12: 3501. https://doi.org/10.3390/s20123501
APA StyleStaneva, D., Angelova, S., & Grabchev, I. (2020). Spectral Characteristics and Sensor Ability of a New 1,8-Naphthalimide and Its Copolymer with Styrene. Sensors, 20(12), 3501. https://doi.org/10.3390/s20123501