A Null Space-Based Blind Source Separation for Fetal Electrocardiogram Signals


Abstract
1. Introduction
2. Problem Formulation
3. Related FECG Extraction Methods
3.1. PCA Approach
3.2. FastICA Approach
3.3. BSE Based PLP Filter
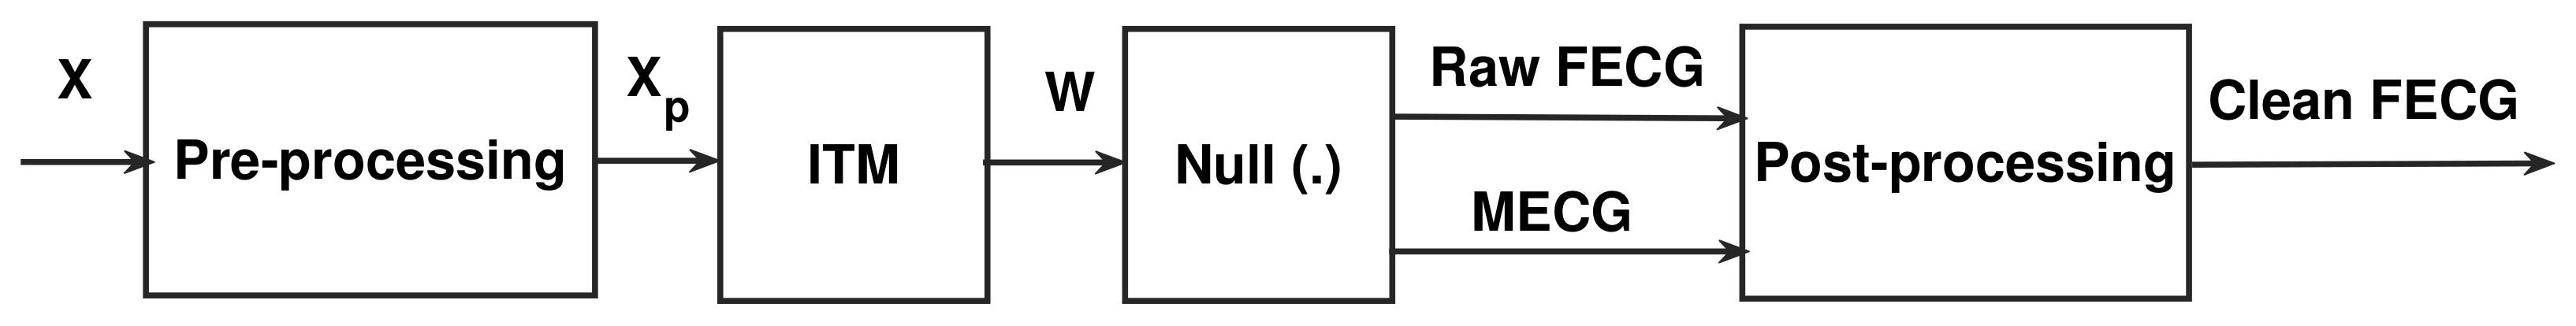
4. The Proposed FECG Extraction System
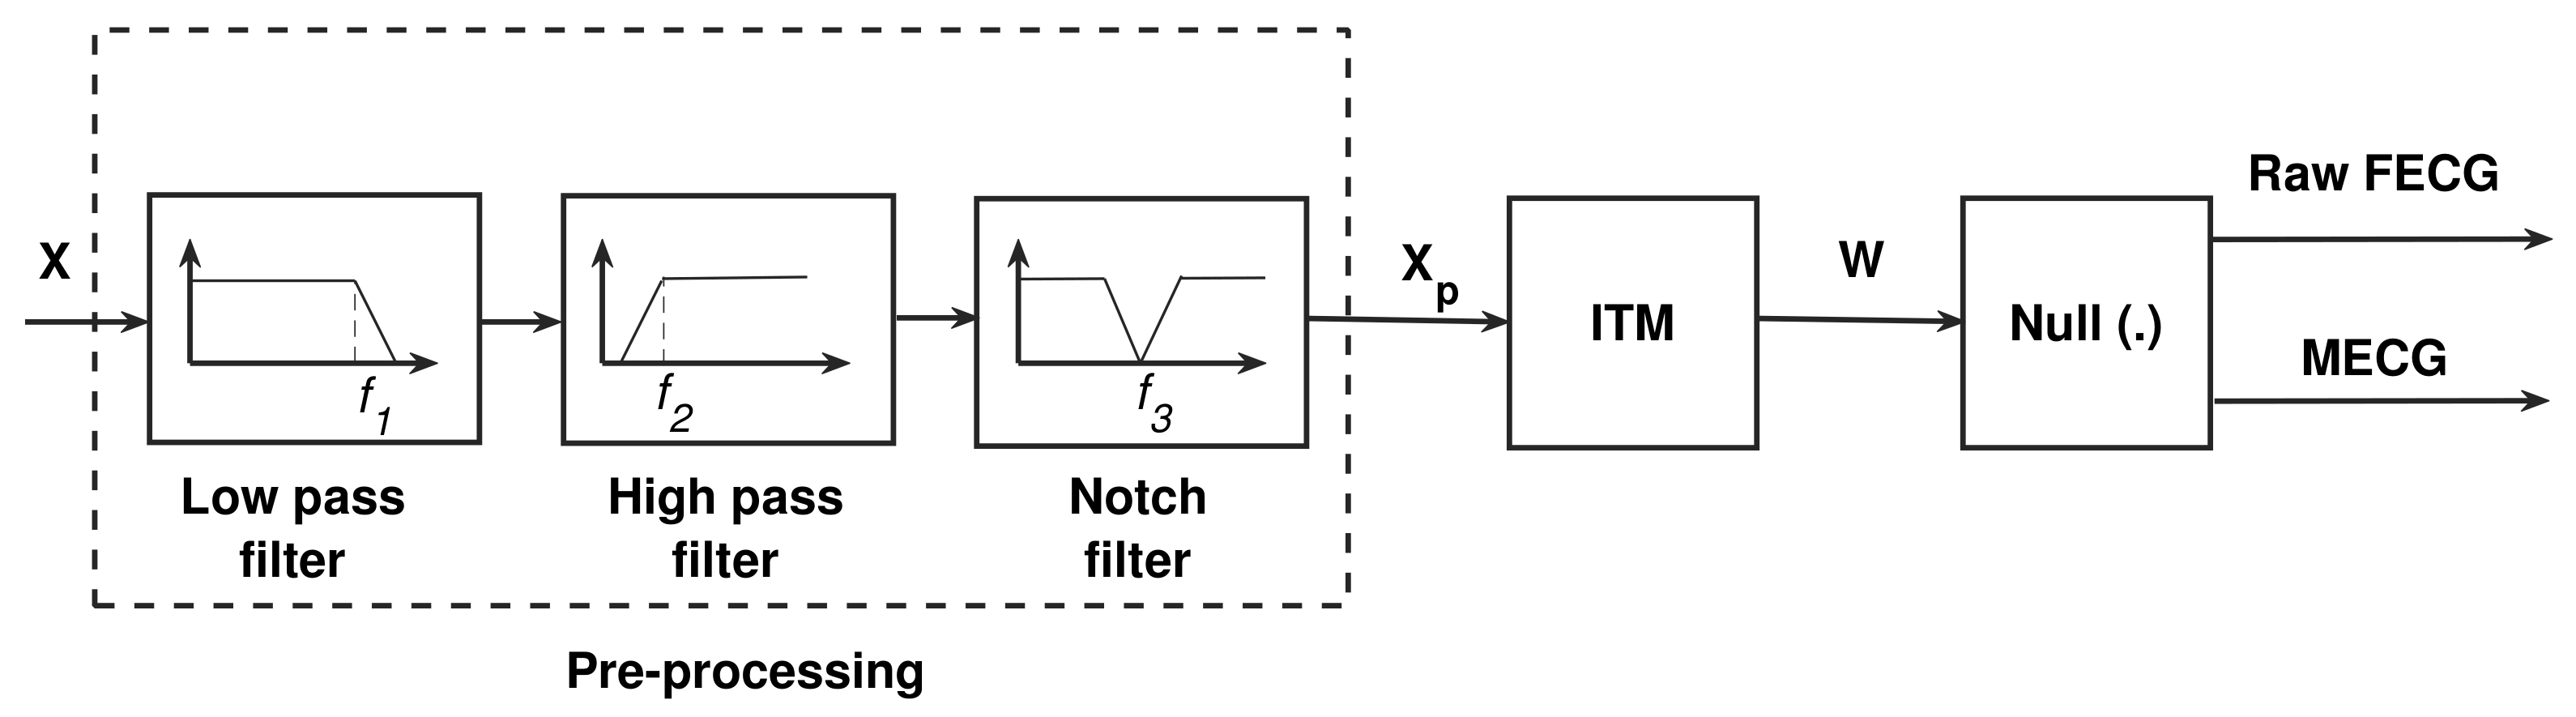
4.1. The Pre-Processing Stage
4.2. The Idempotent Transformation Matrix (ITM)
4.3. The Null Space Solution of W
4.4. The Post-Processing Stage
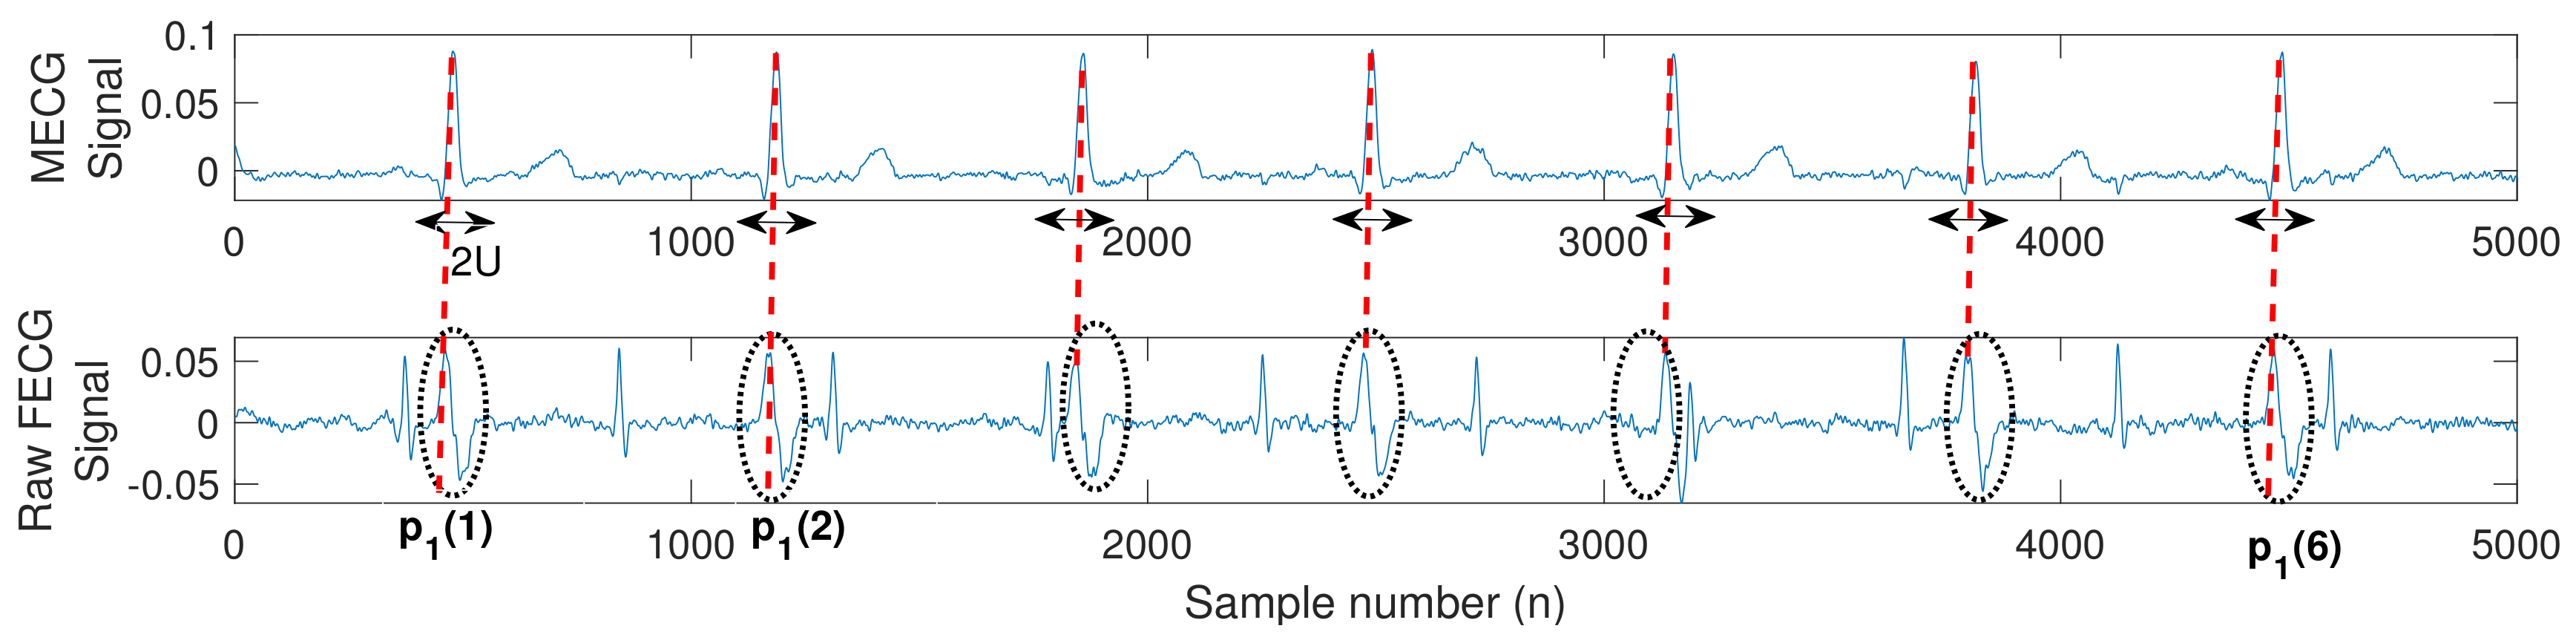
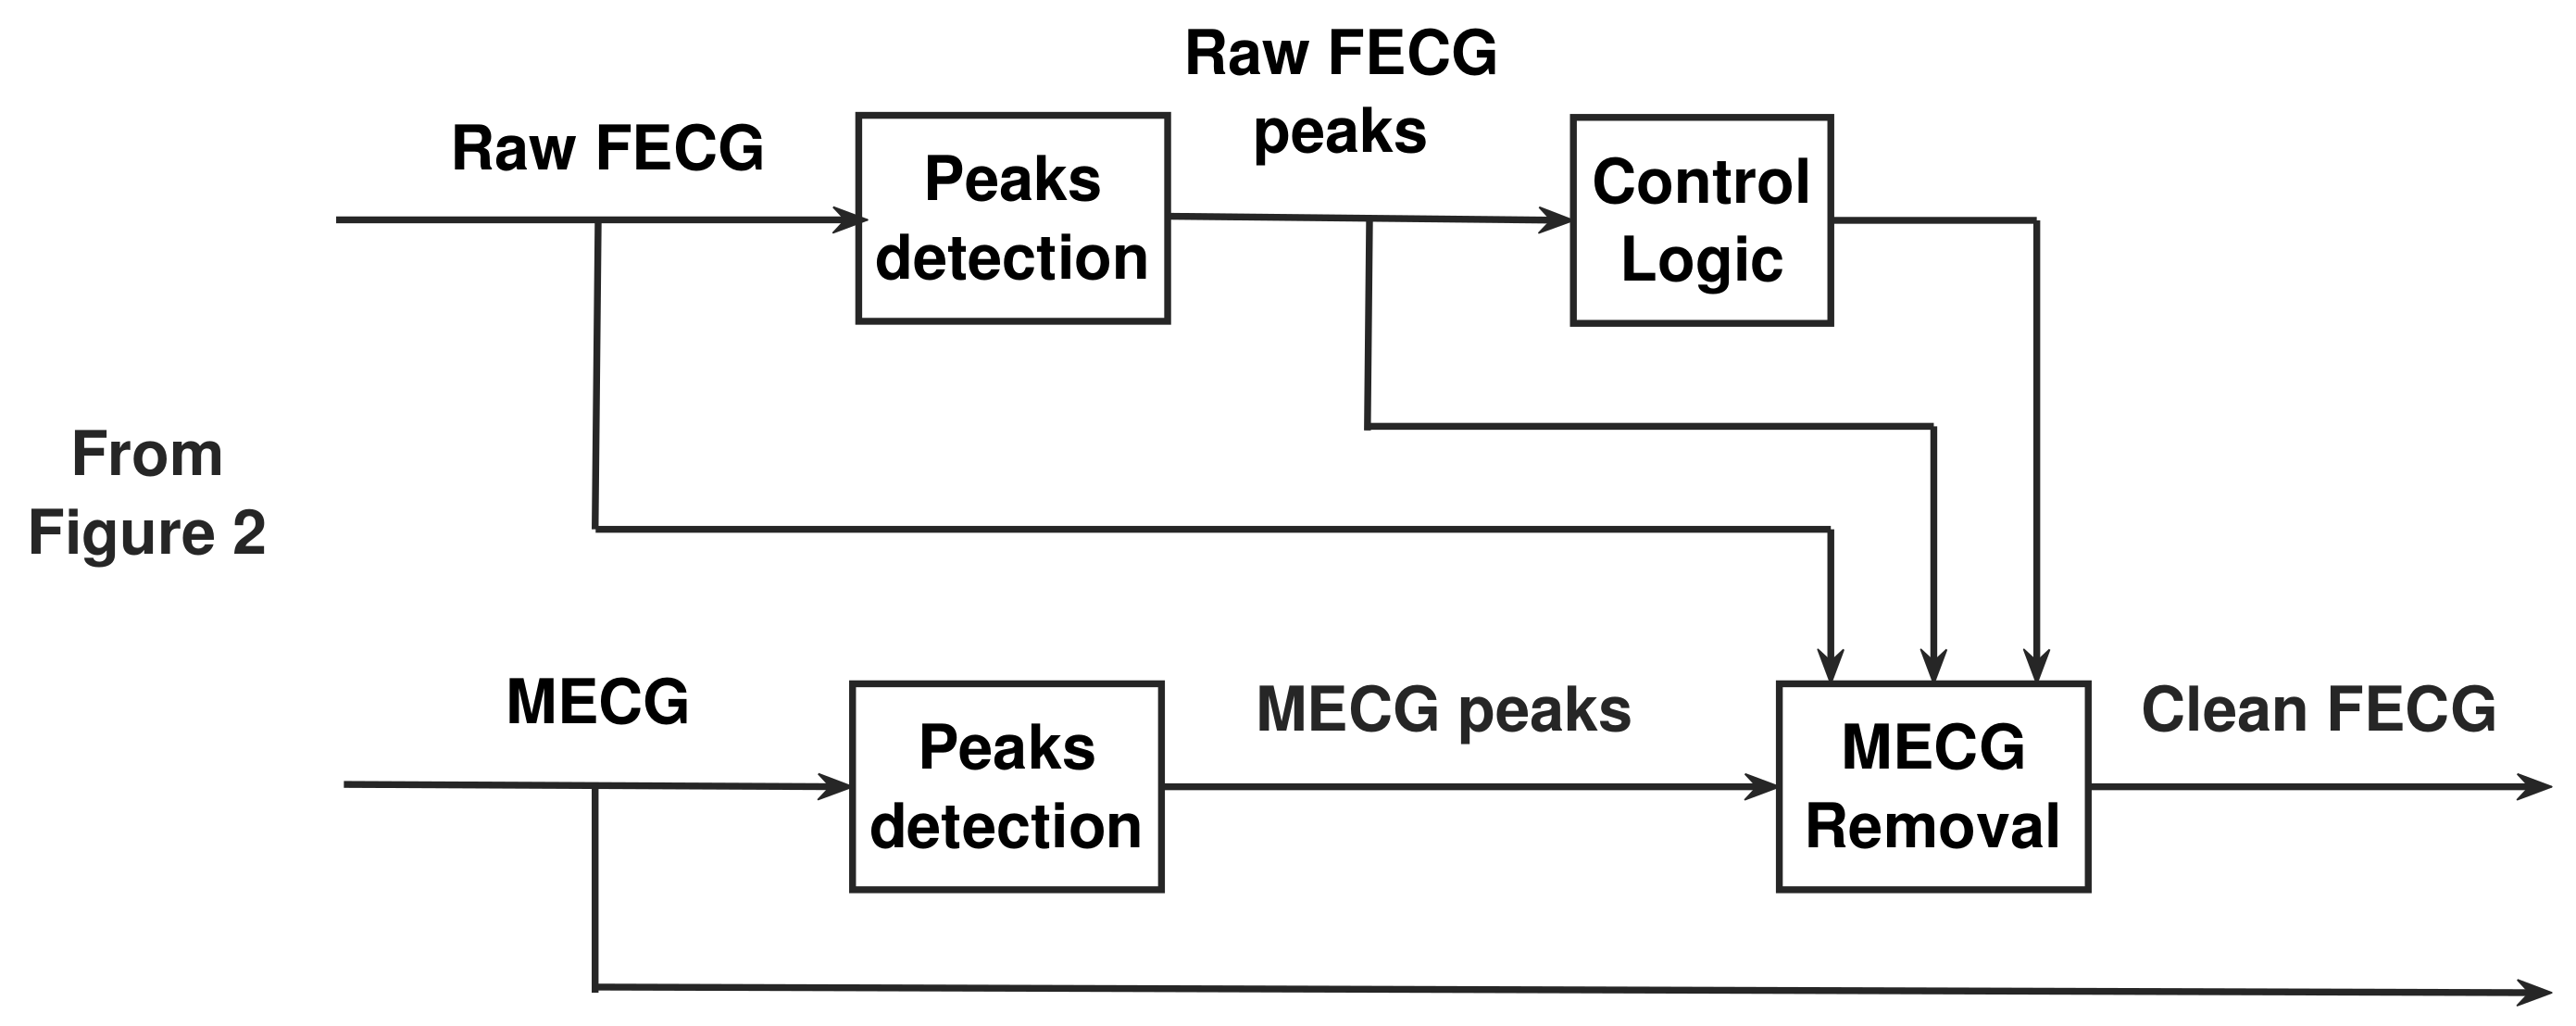
4.4.1. Peaks Detection
4.4.2. Control Logic
4.4.3. MECG Removal
4.5. The Proposed NSITM Algorithm
| Algorithm 1 The proposed NSITM extraction algorithm. |
|
5. Experiments
5.1. Experiment 1: FECG Extraction of Real ECG Data from the DAISY Database
5.2. Experiment 2: FECG Extraction of Real ECG Data from the Physionet Database
5.3. Experiment 3: FECG Extraction Using Synthesized ECG Data
5.4. Experiment 4: FECG Extraction Metrics Based on Fetal-to-Maternal SNR Variations
5.5. Experiment 5: Performance Evaluation Using Statistical Measures
6. Discussions
6.1. Discussion on Experiment 1
- The proposed NSITM algorithm is effective in extracting the FECG and MECG signals from the ECG mixture. The extraction shows some background noise, using the proposed NSITM and all used methods. This requires further investigation and is probably covered in future work.
6.2. Discussion on Experiment 2
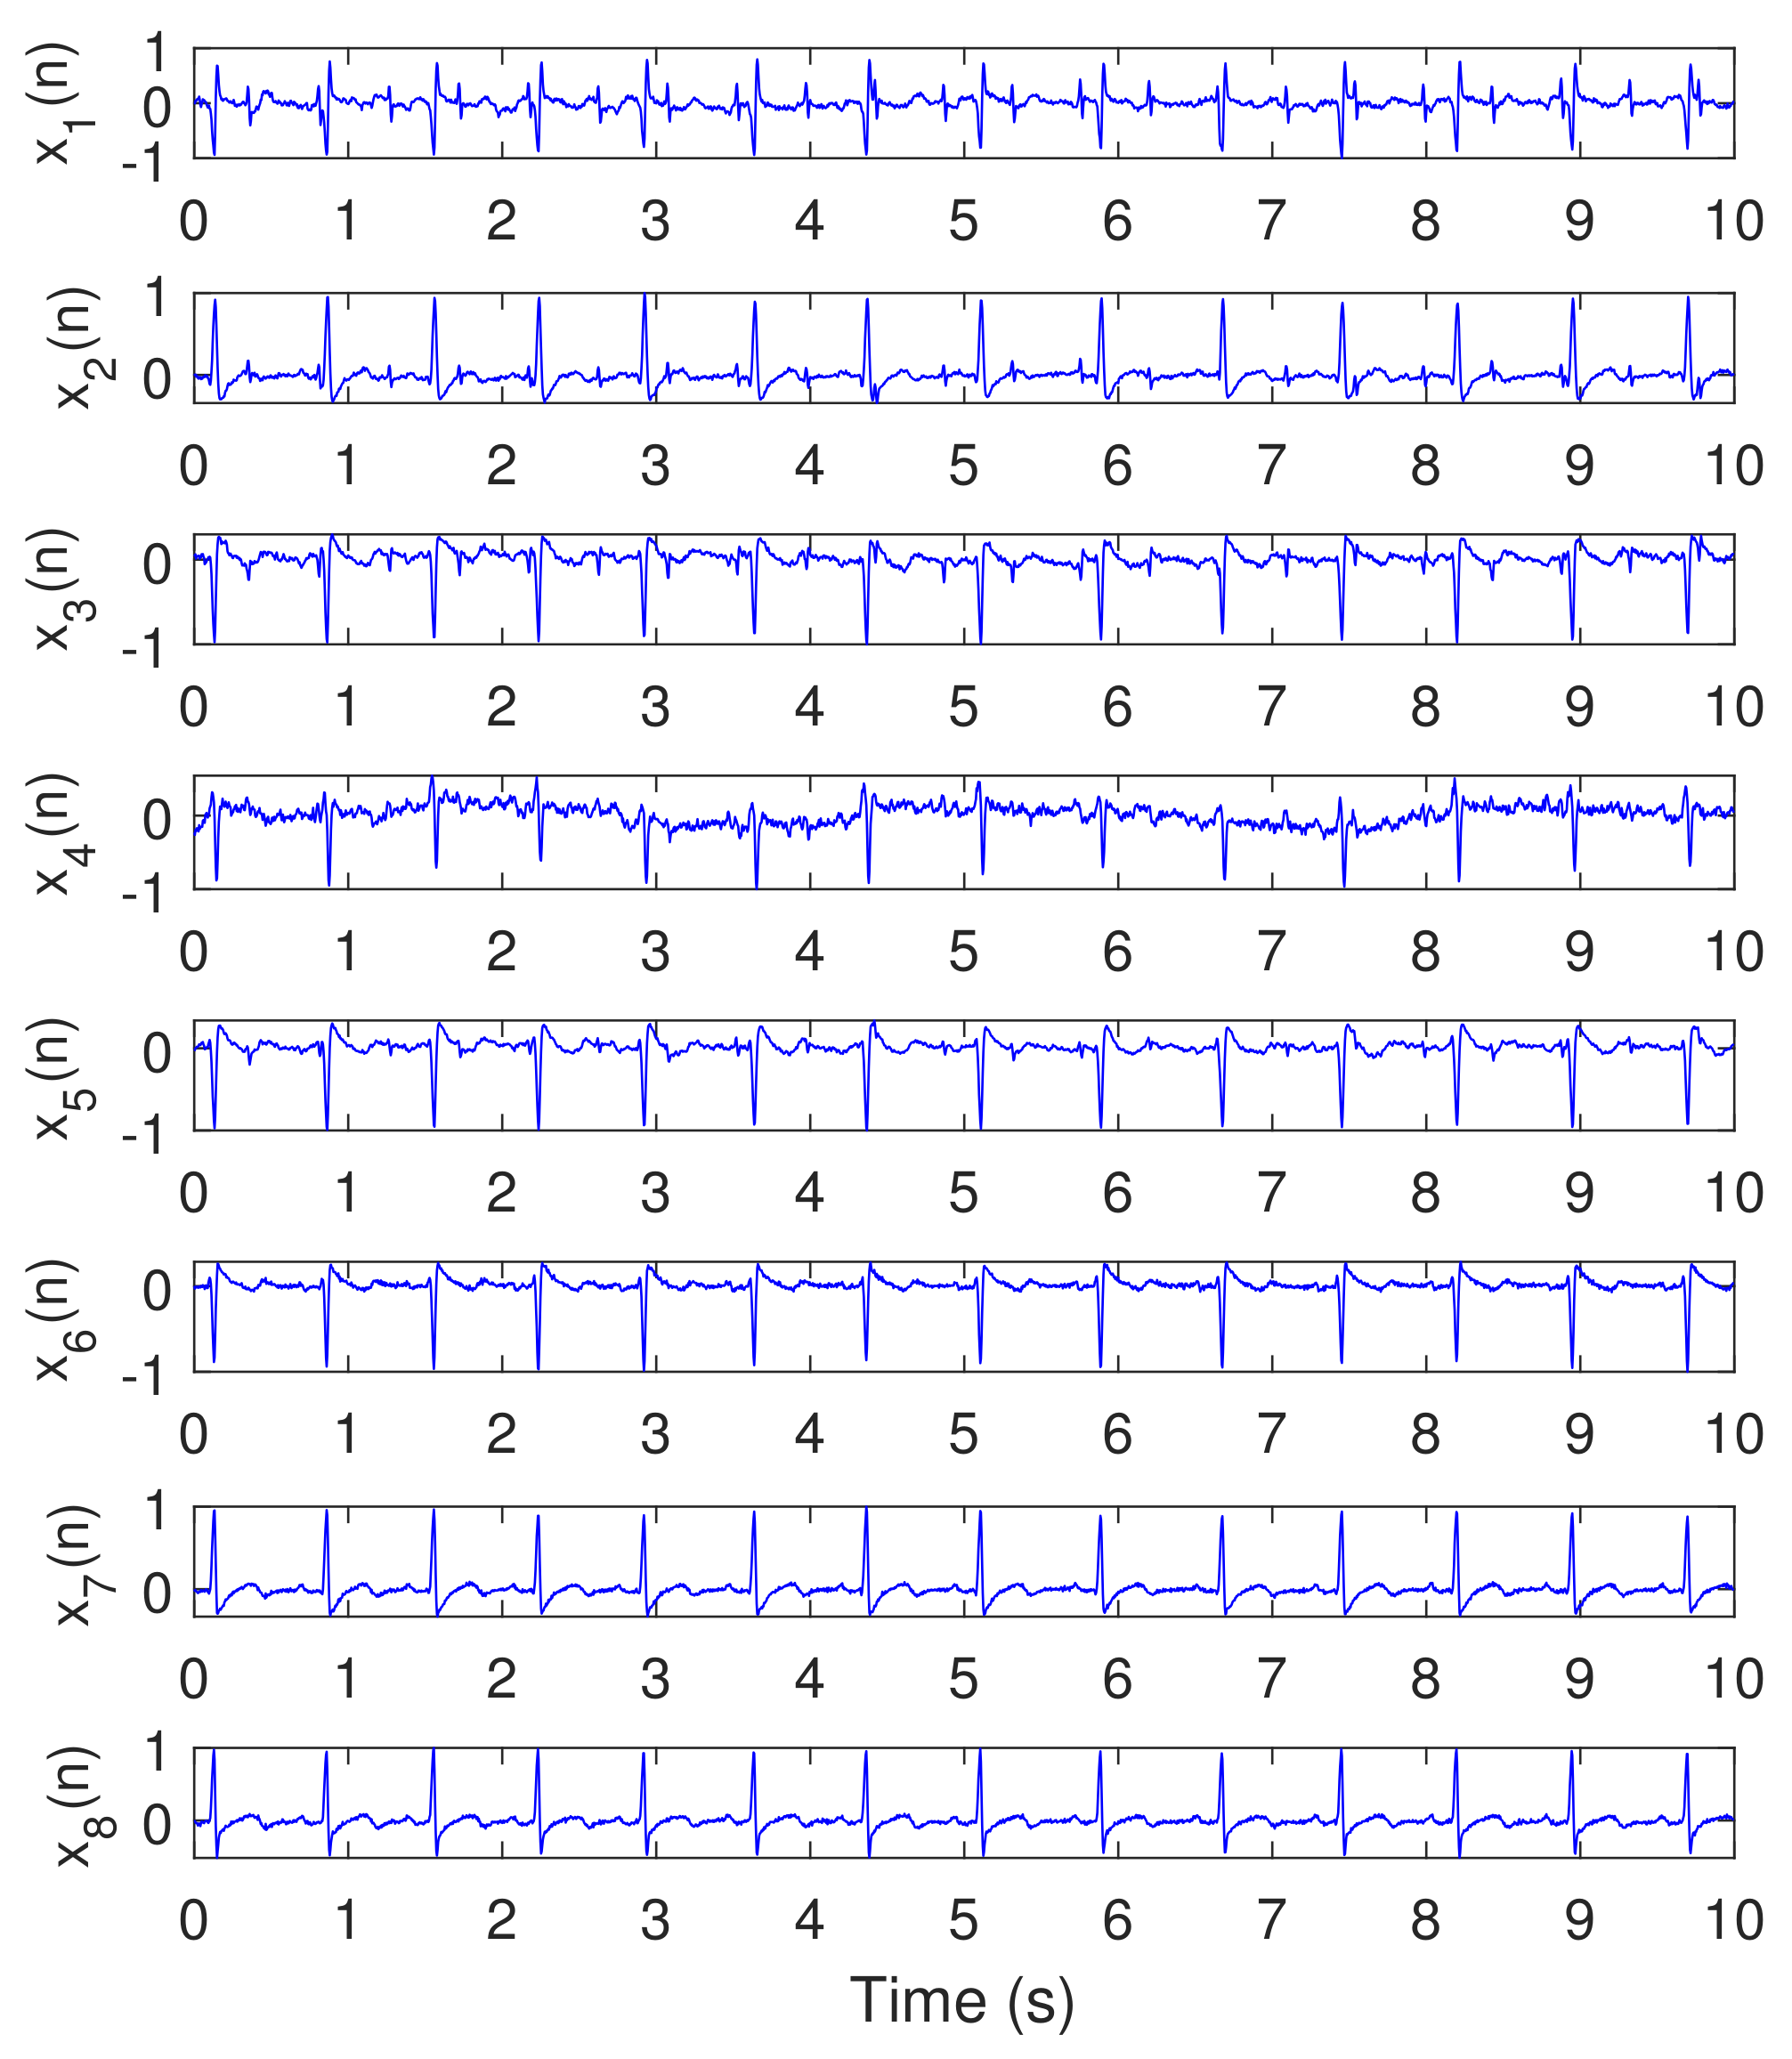
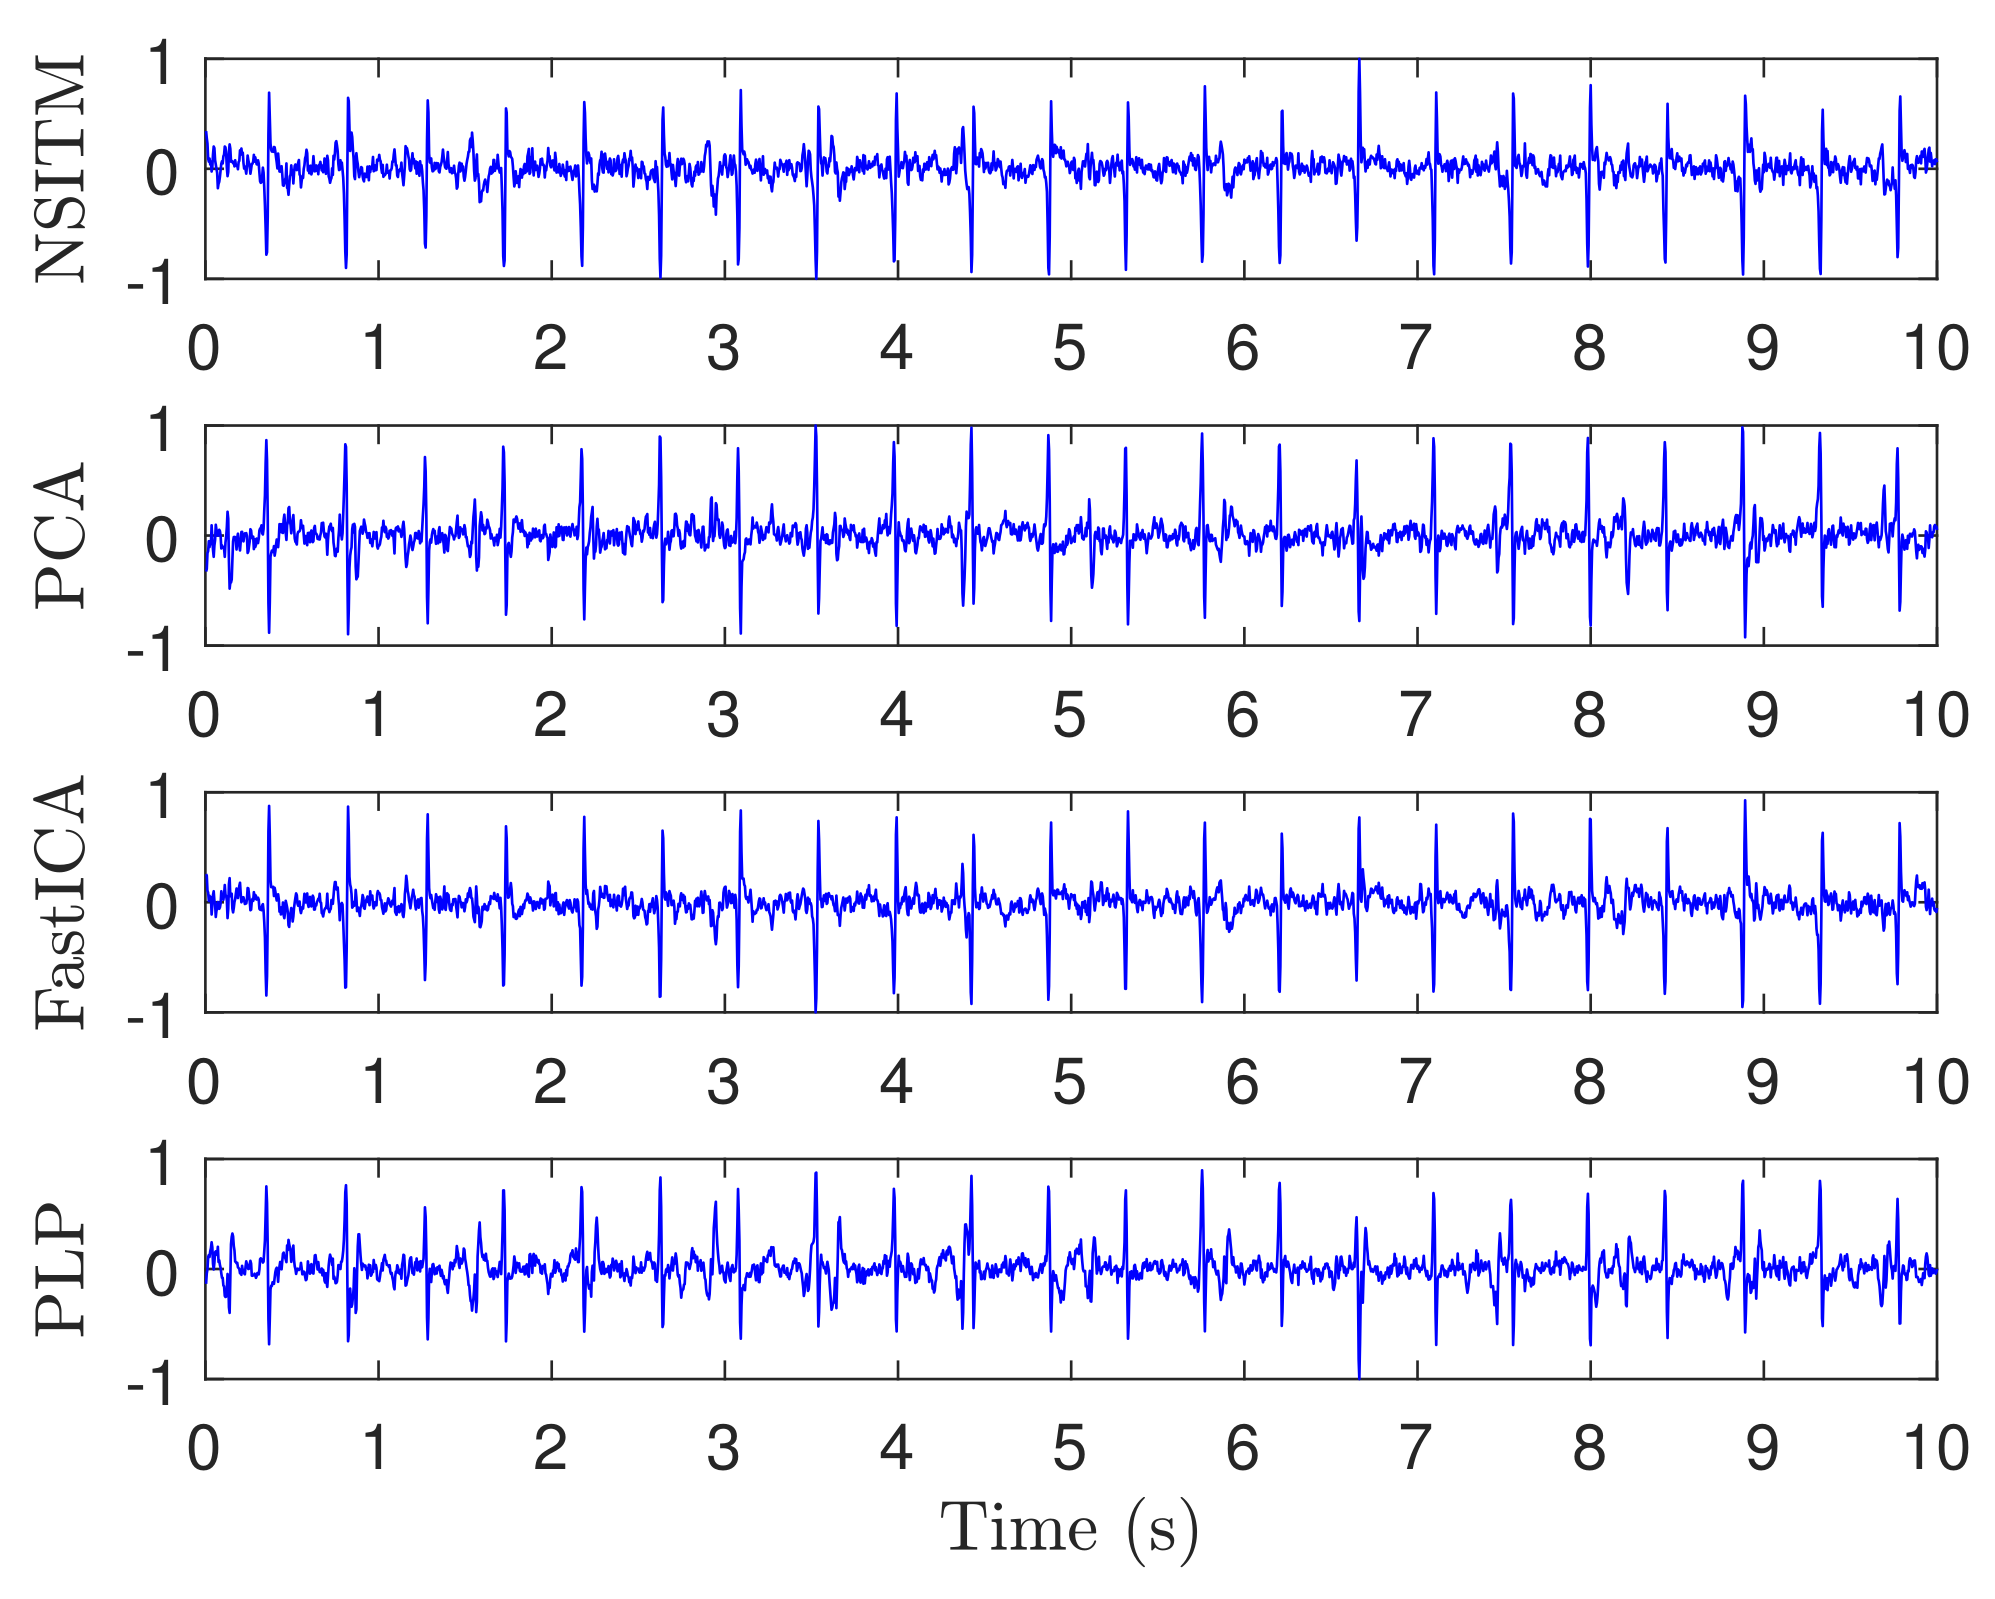
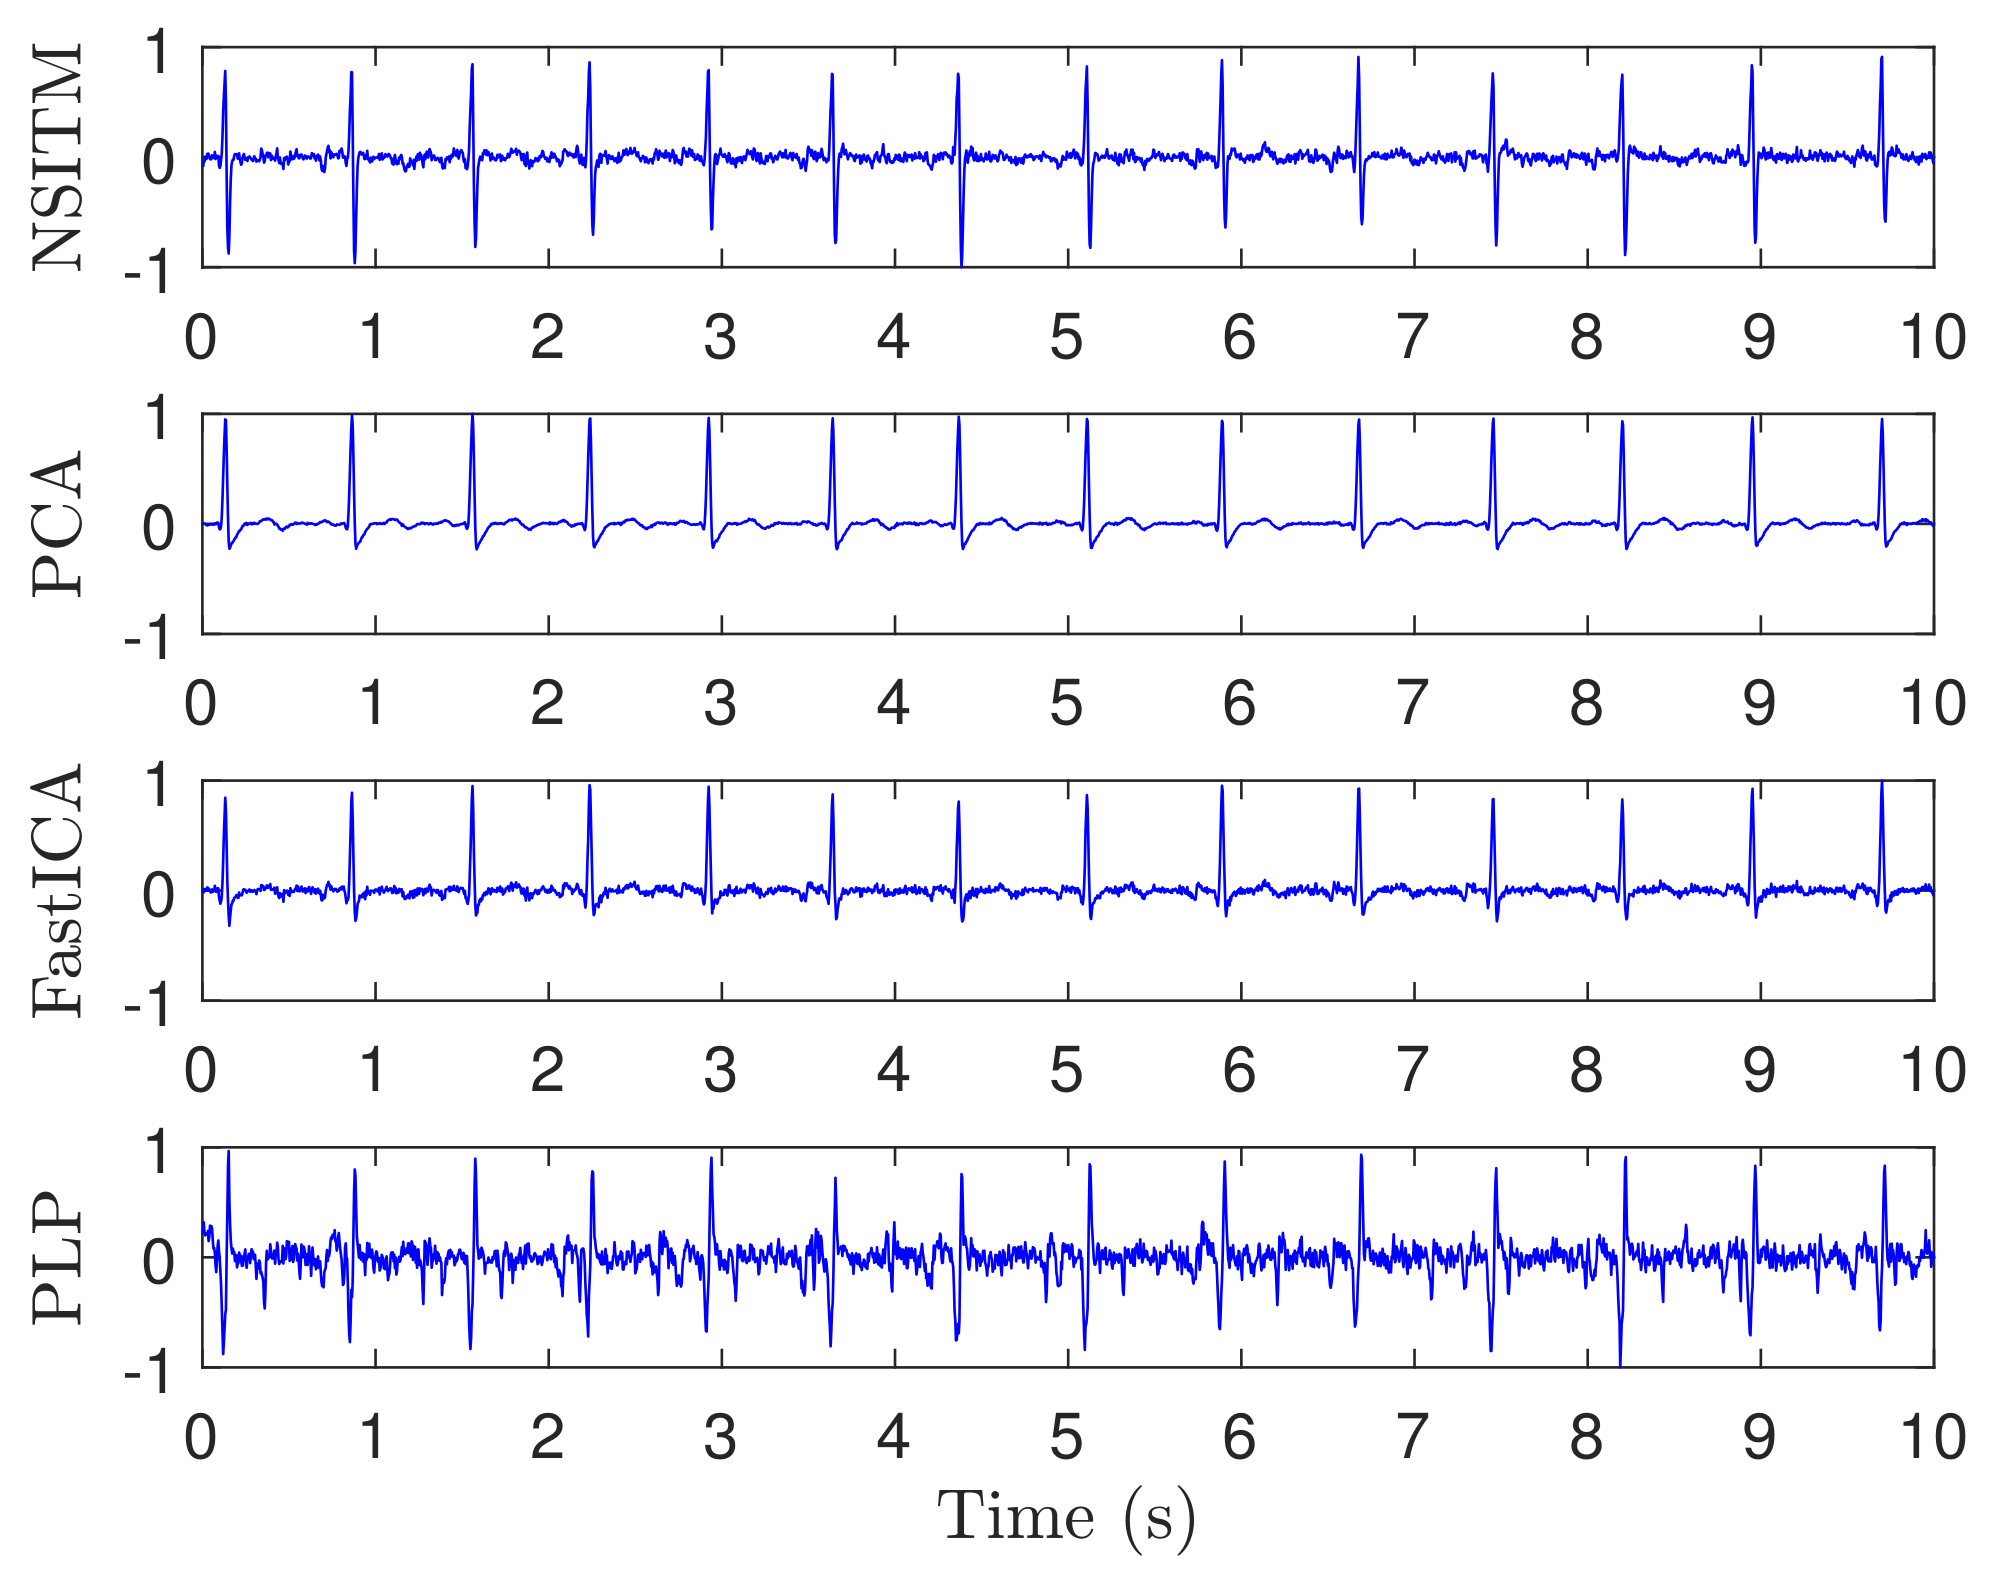
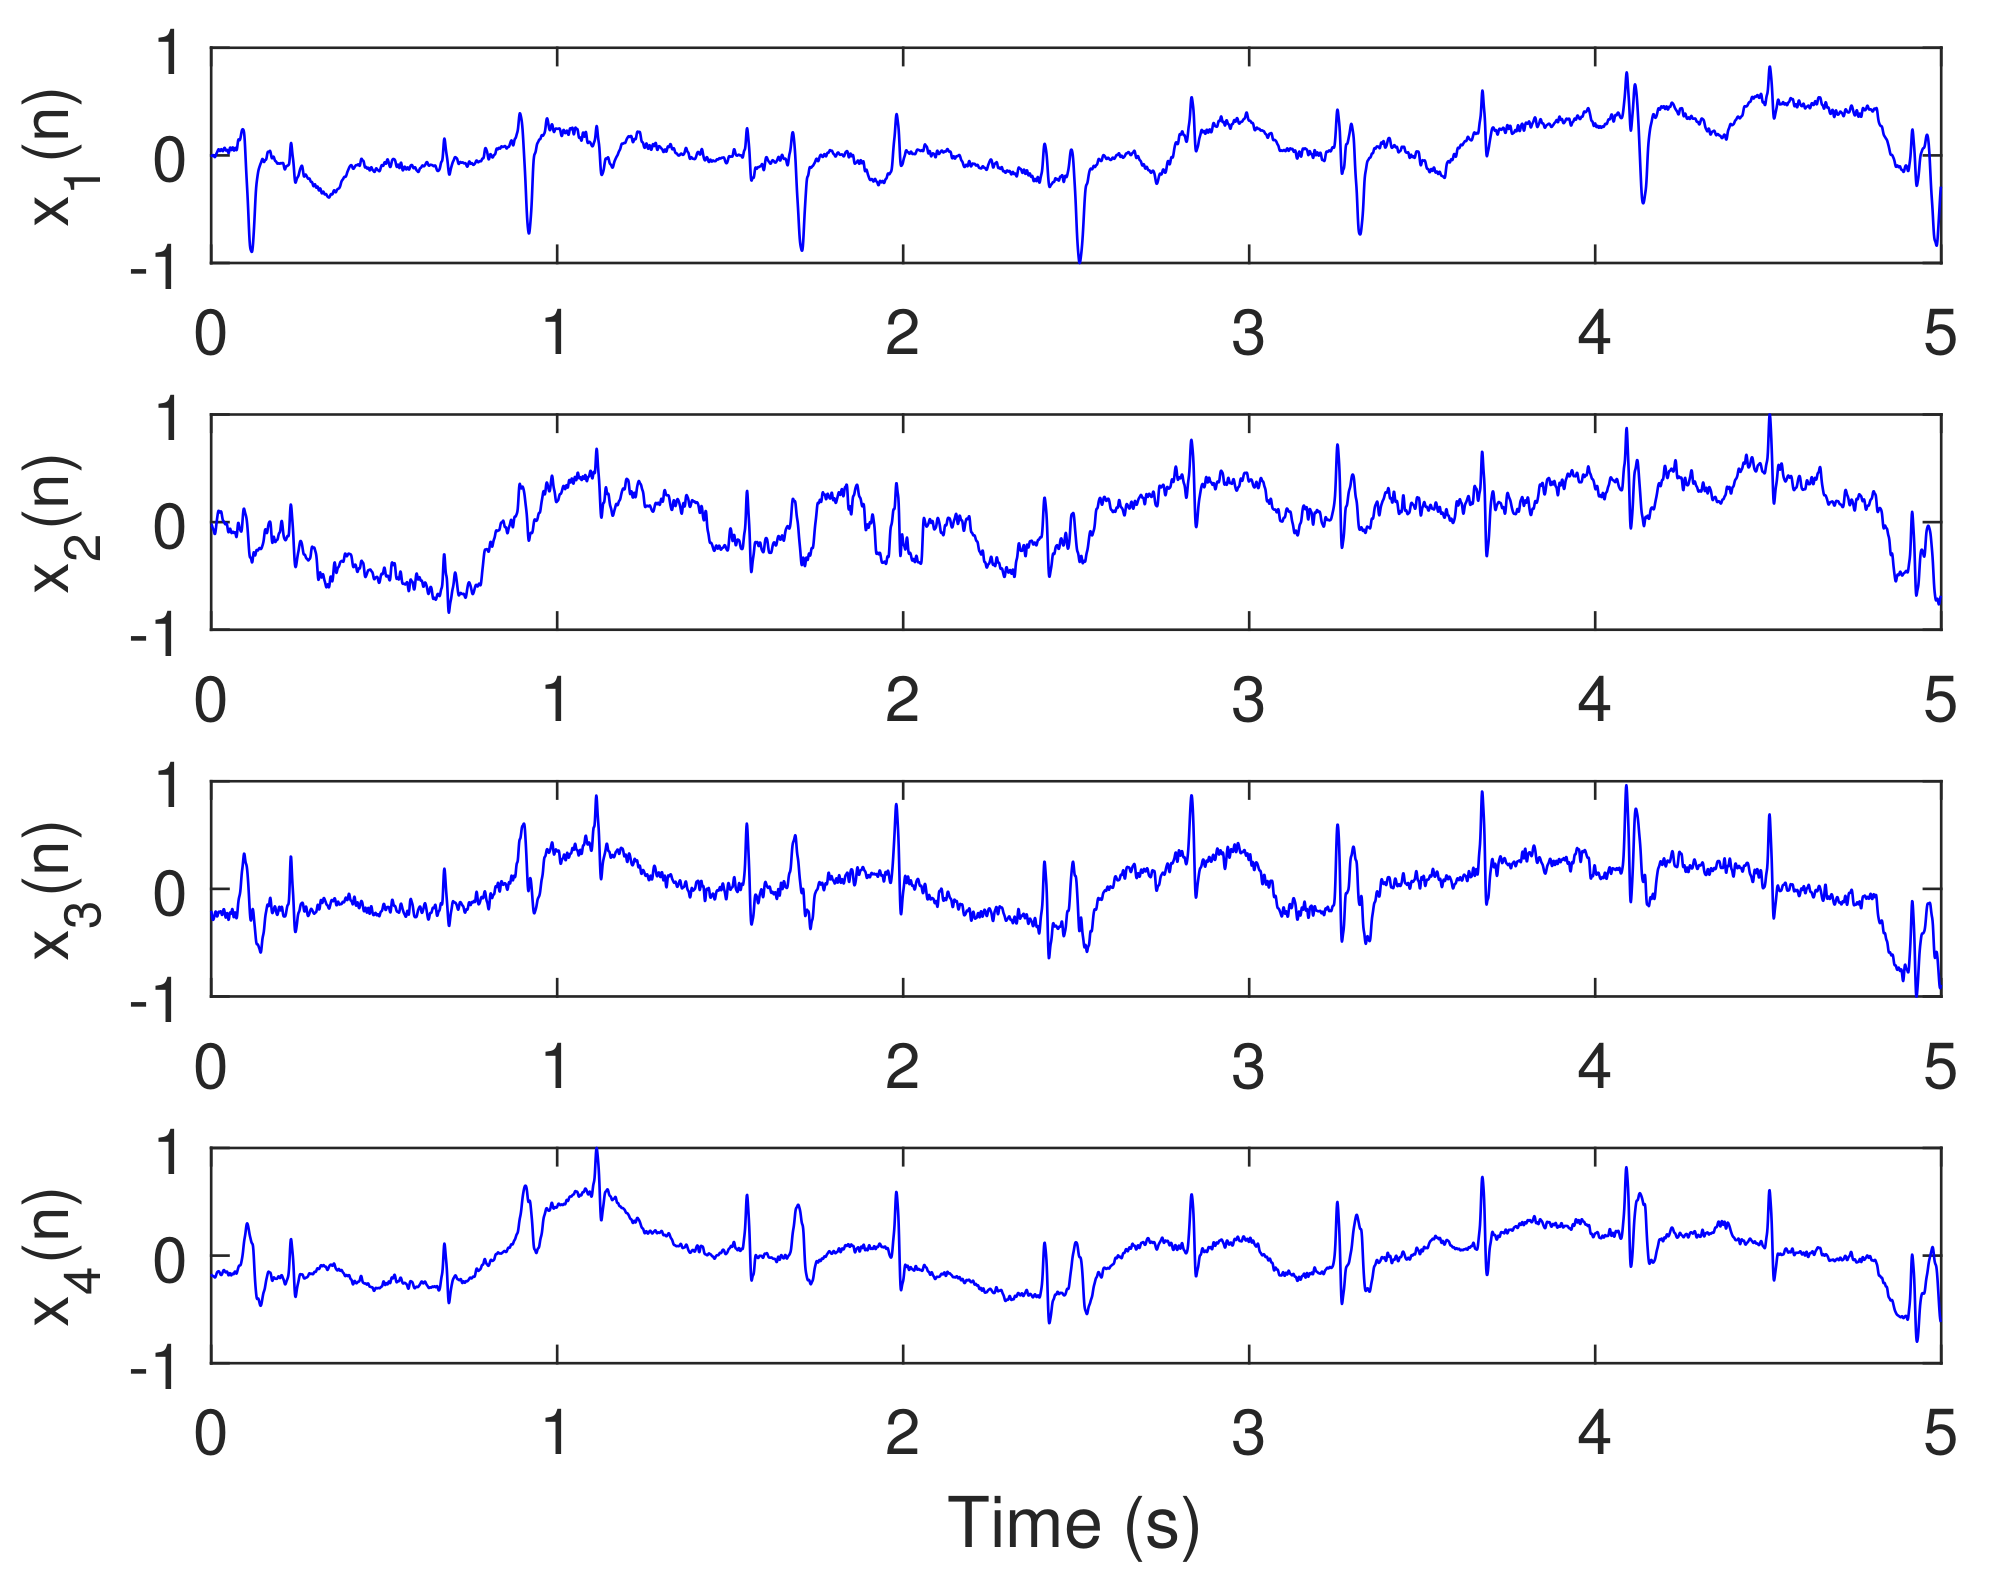
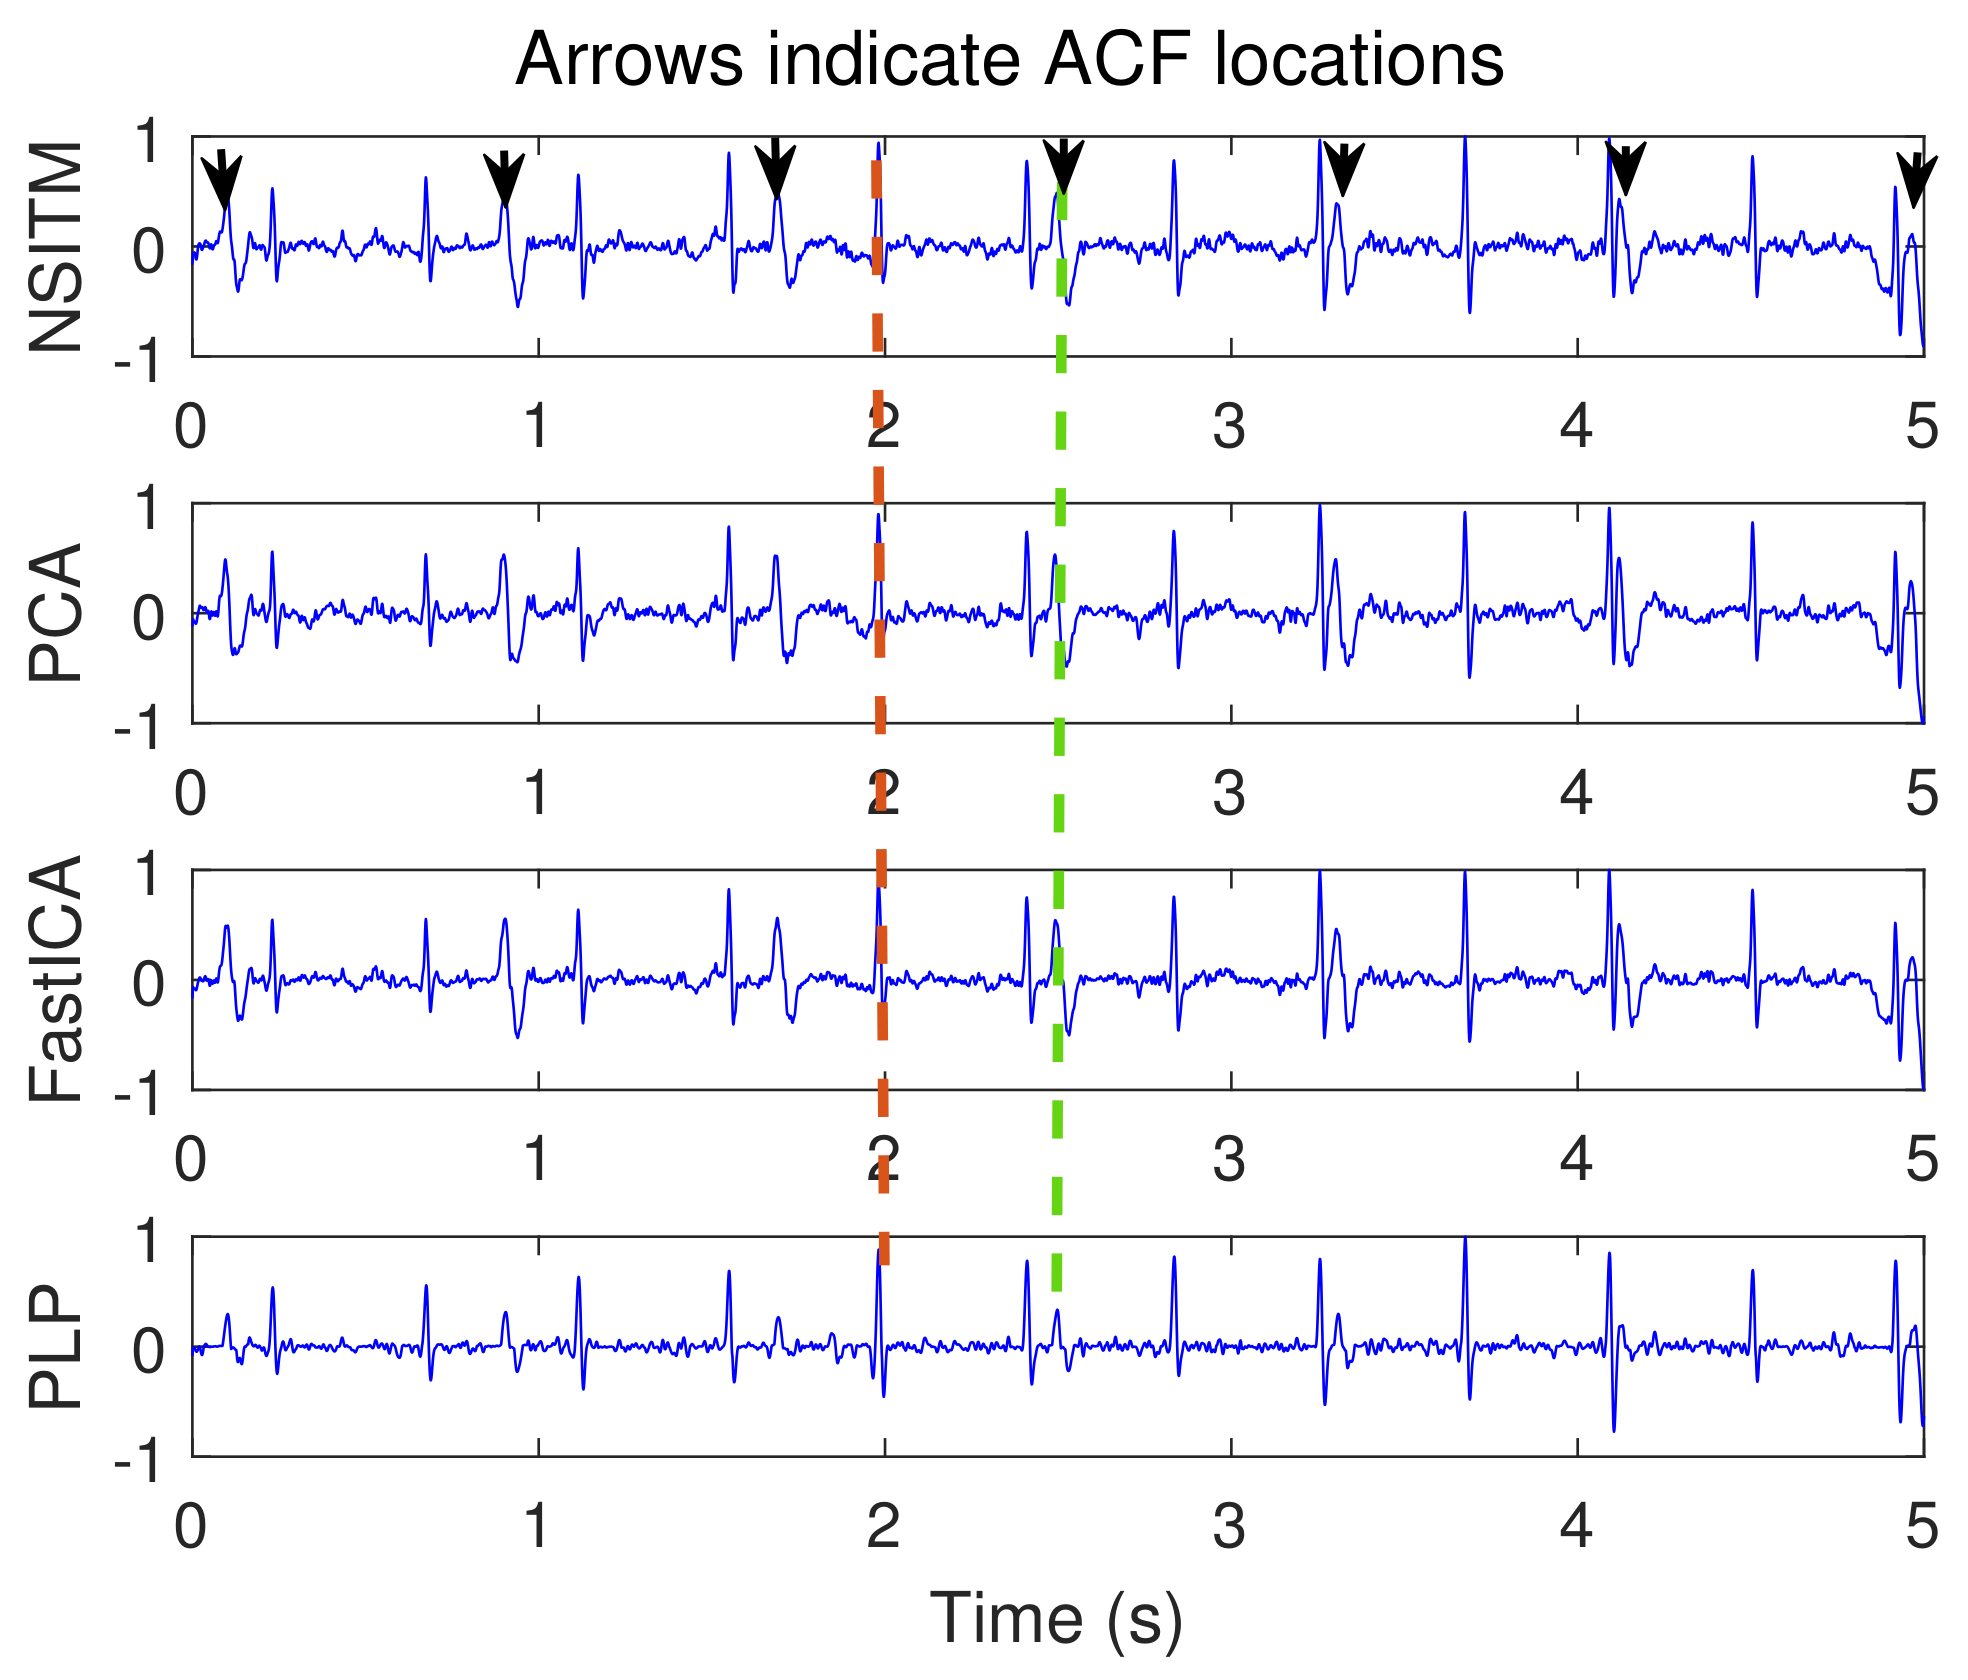
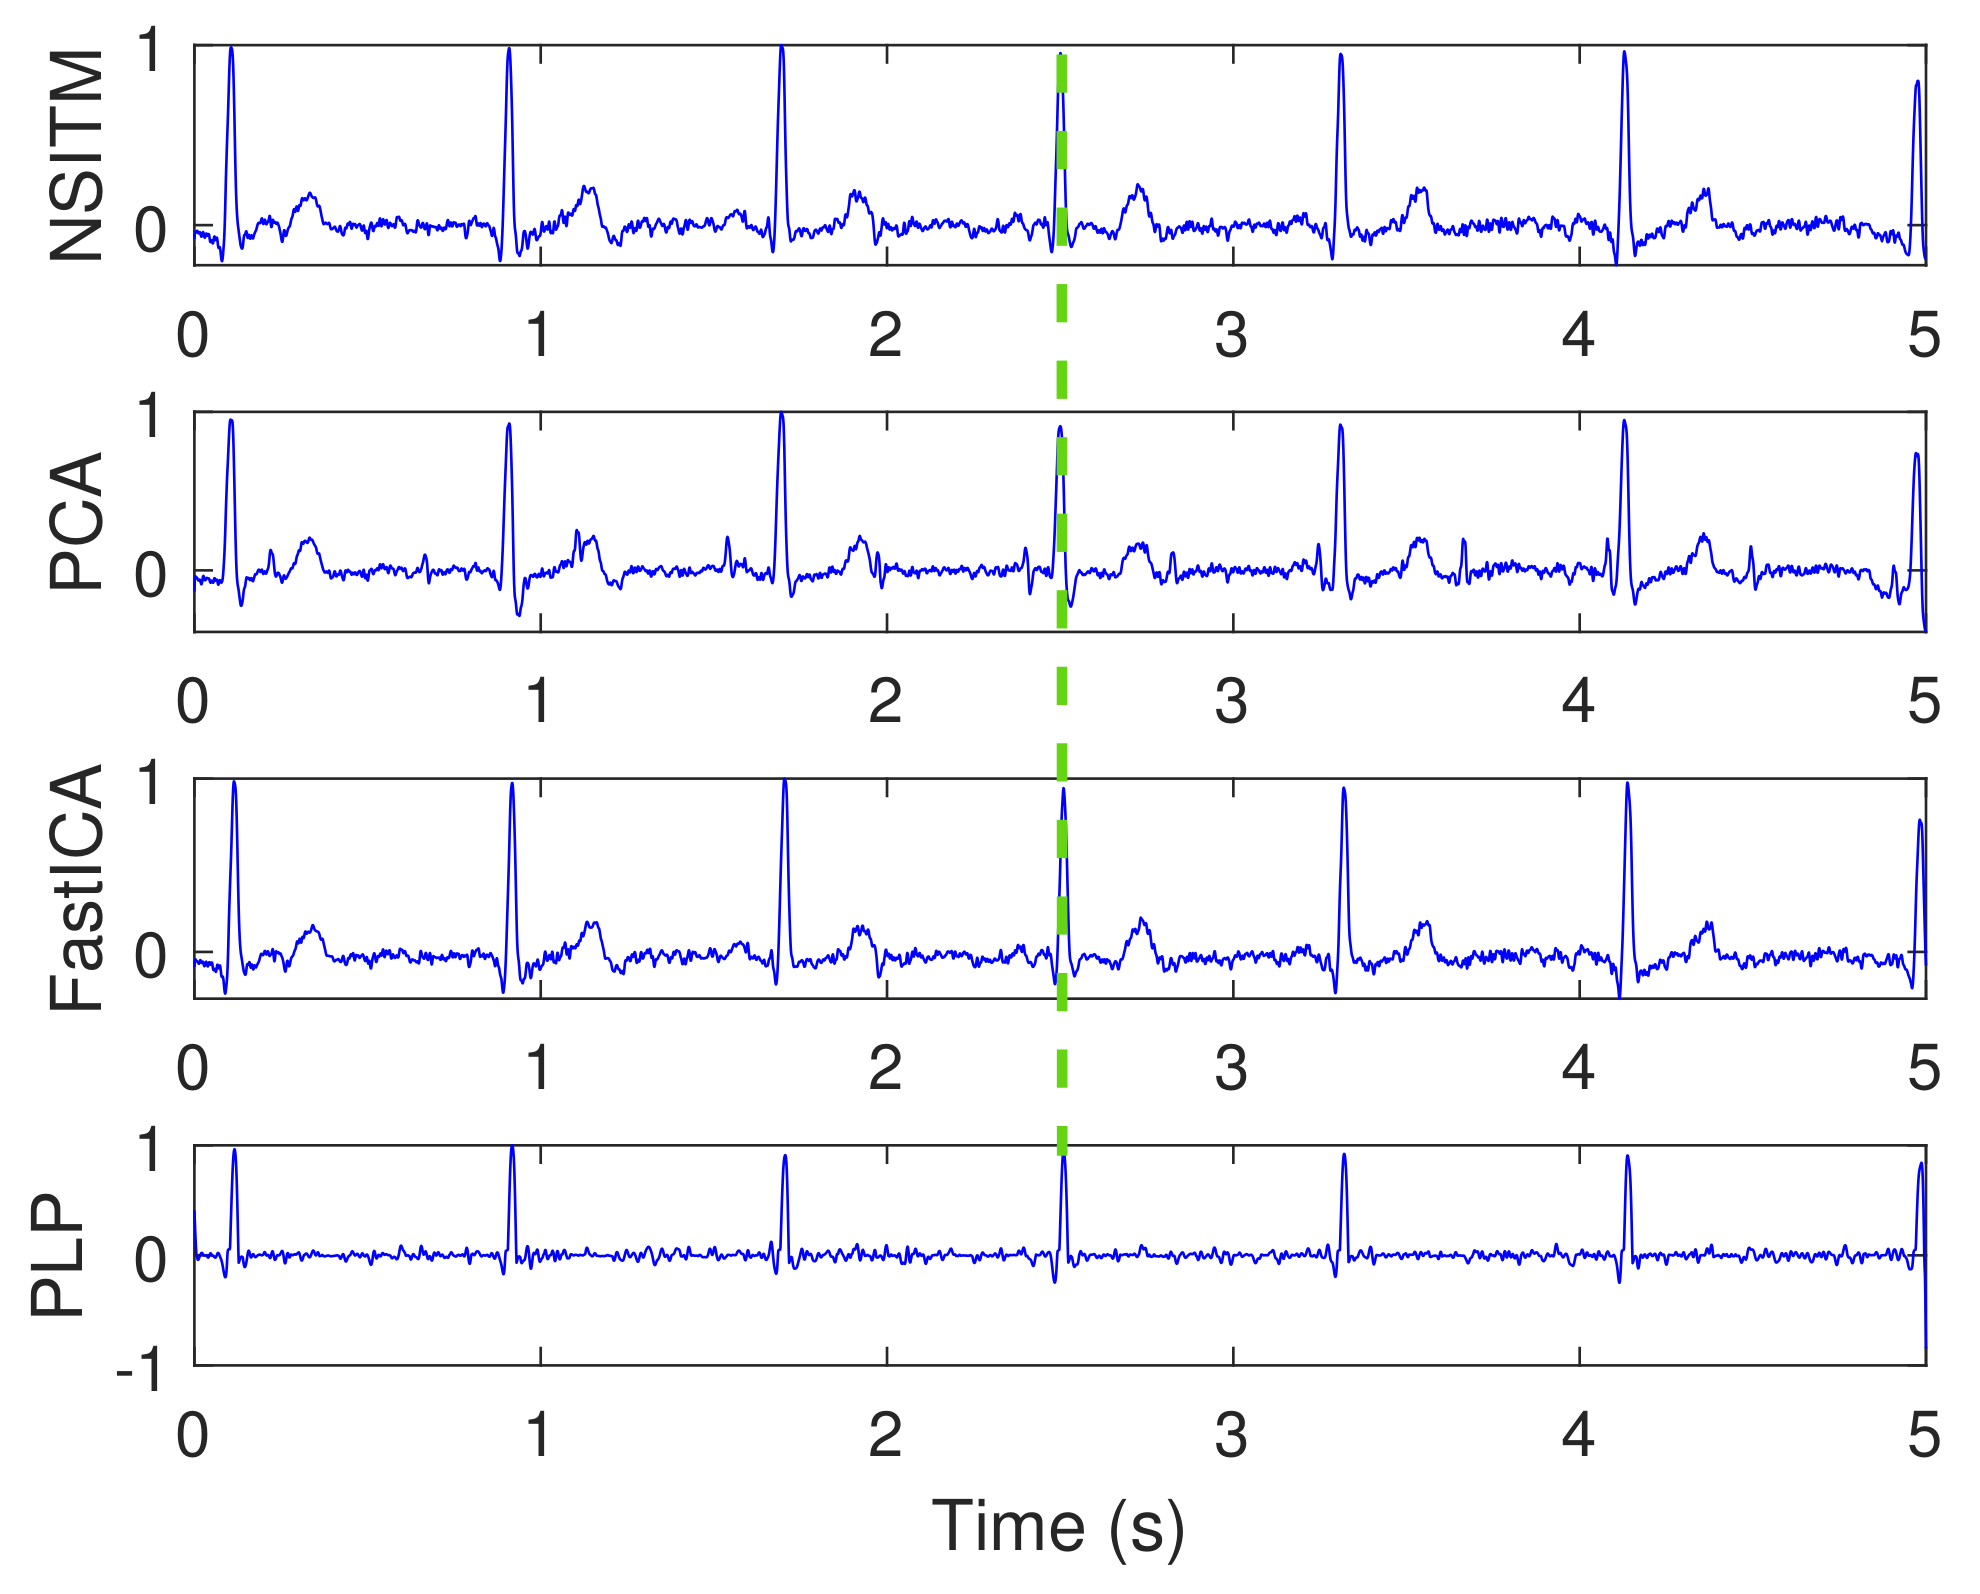
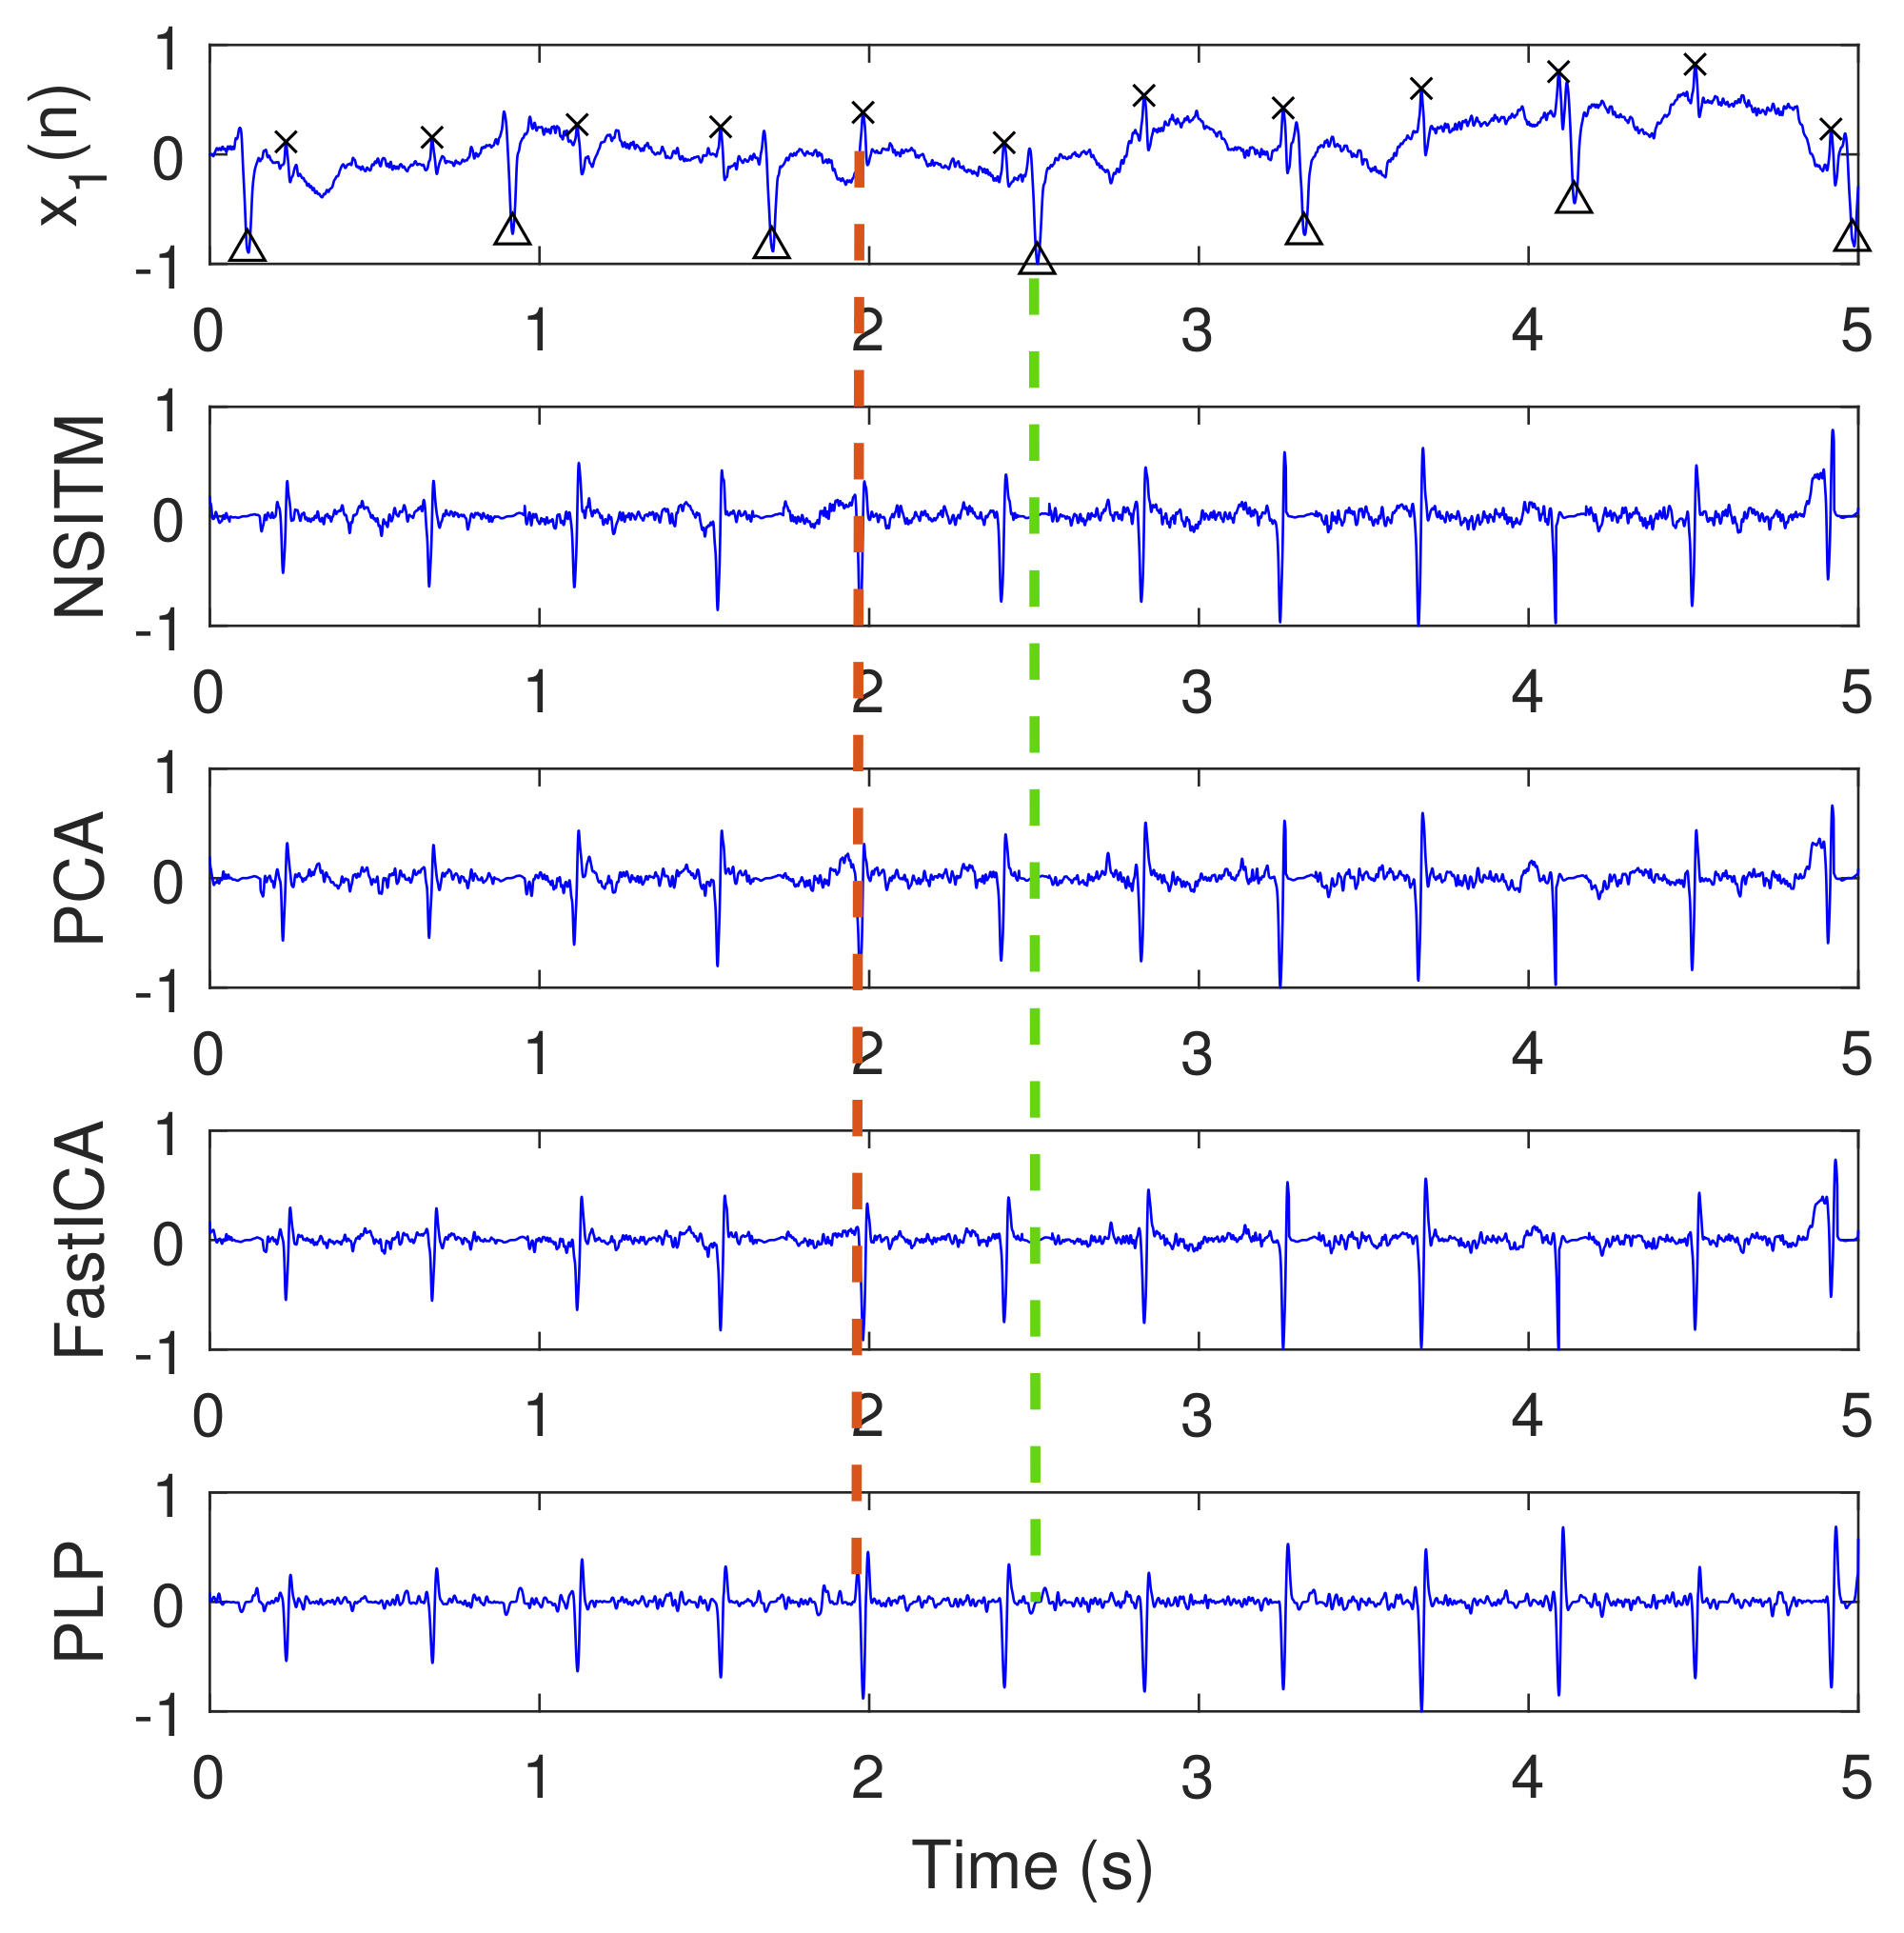
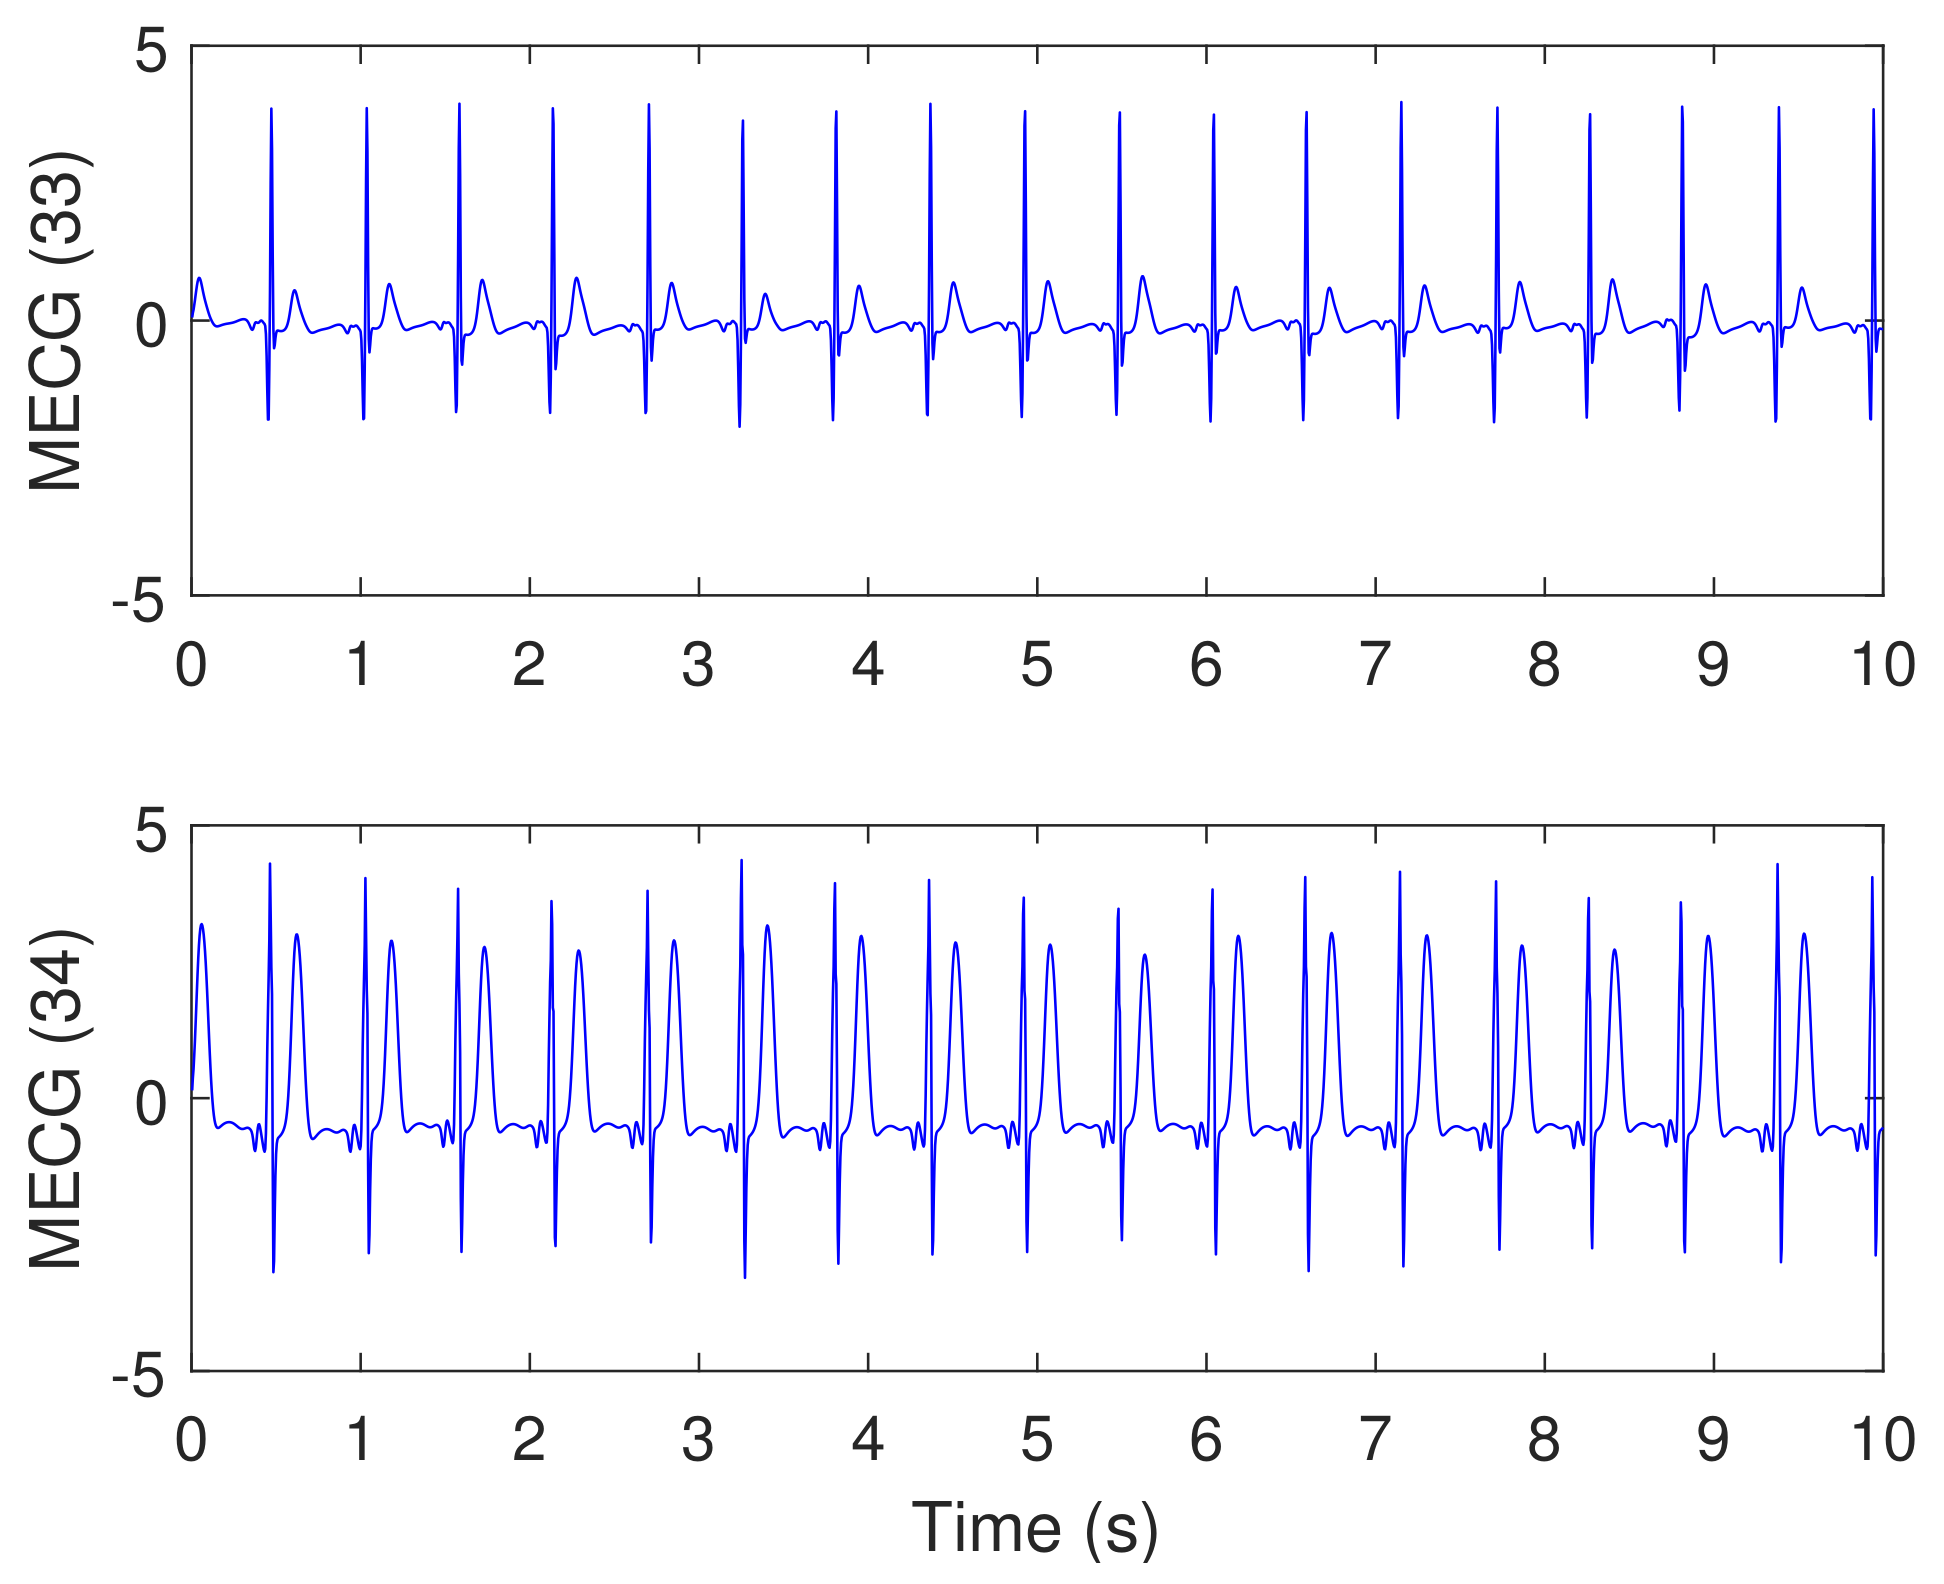
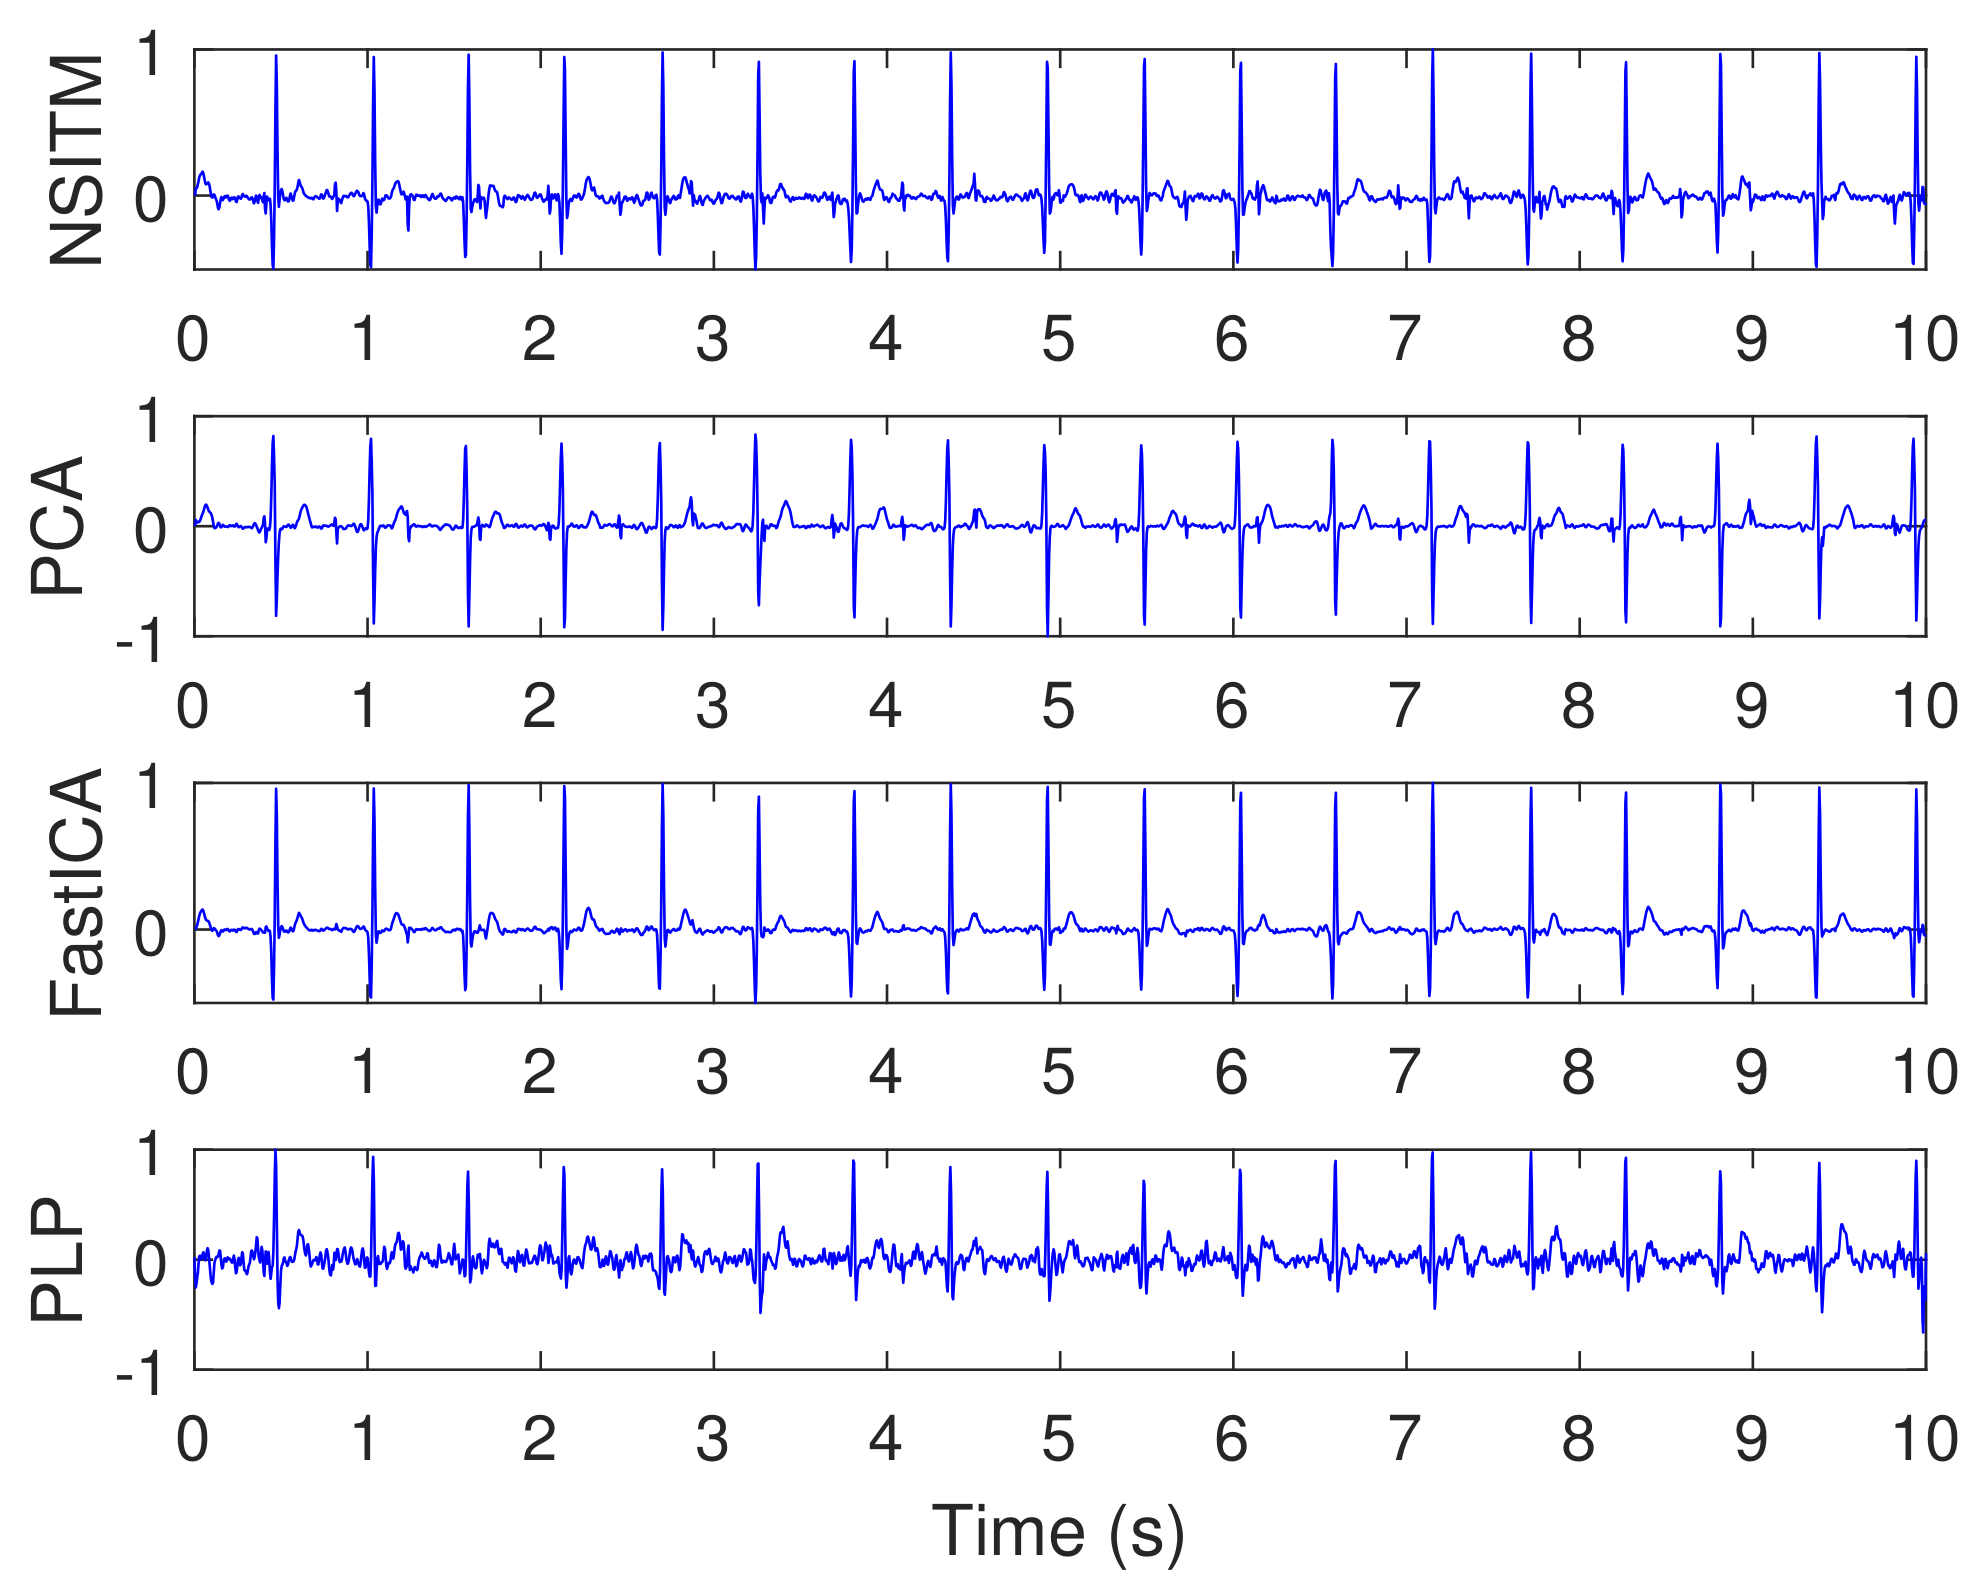
- As the data used in this experiment is noisy, the proposed NSITM algorithm and other algorithms used in this experiment, provide raw FECG signals that contain both FECG and MECG signals, as shown in Figure 10. Thus, the MECG components need to be removed using ACF. First, the MECG signals were extracted as shown in Figure 11. Then, the locations of R peaks in the MECG signal are estimated. These locations are used to adjust the ACF in order to remove the MECG components from the raw FECG signals.
- The extracted FECG and MECG signals, using the proposed NSITM, are better than other extracted FECG and MECG signals using PCA, FastICA, and PLP algorithms.
6.3. Discussion on Experiment 3
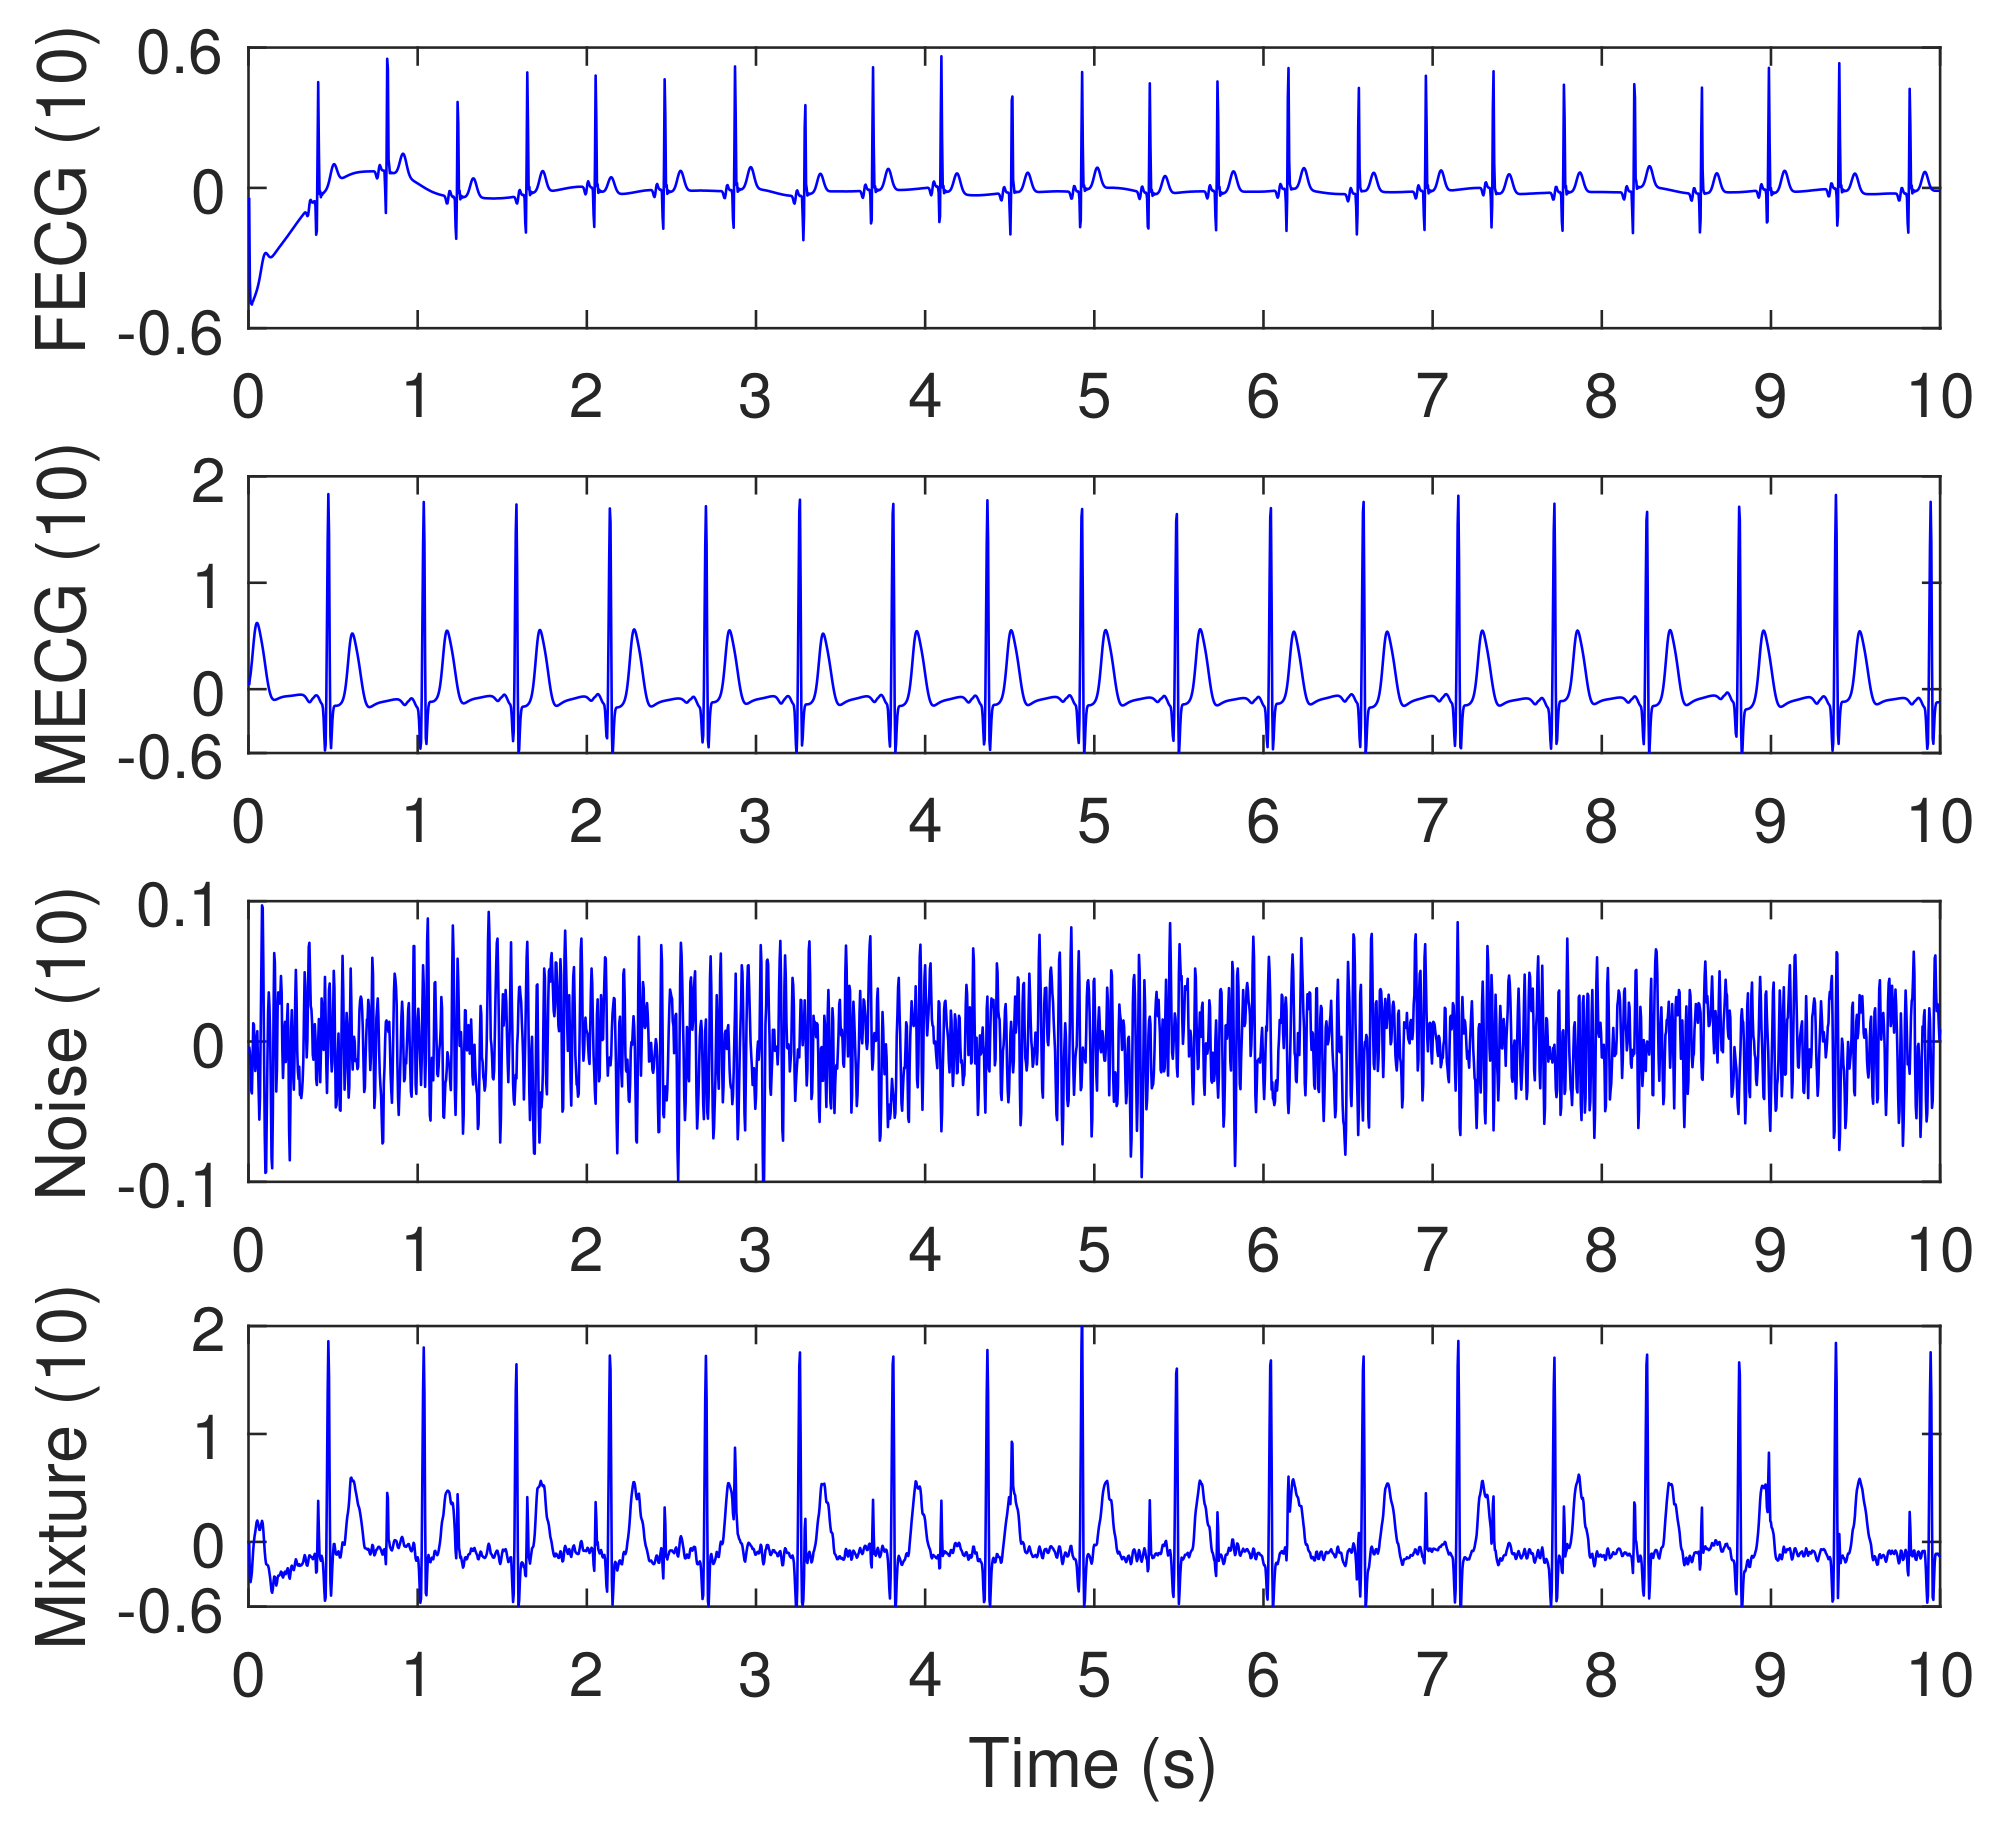
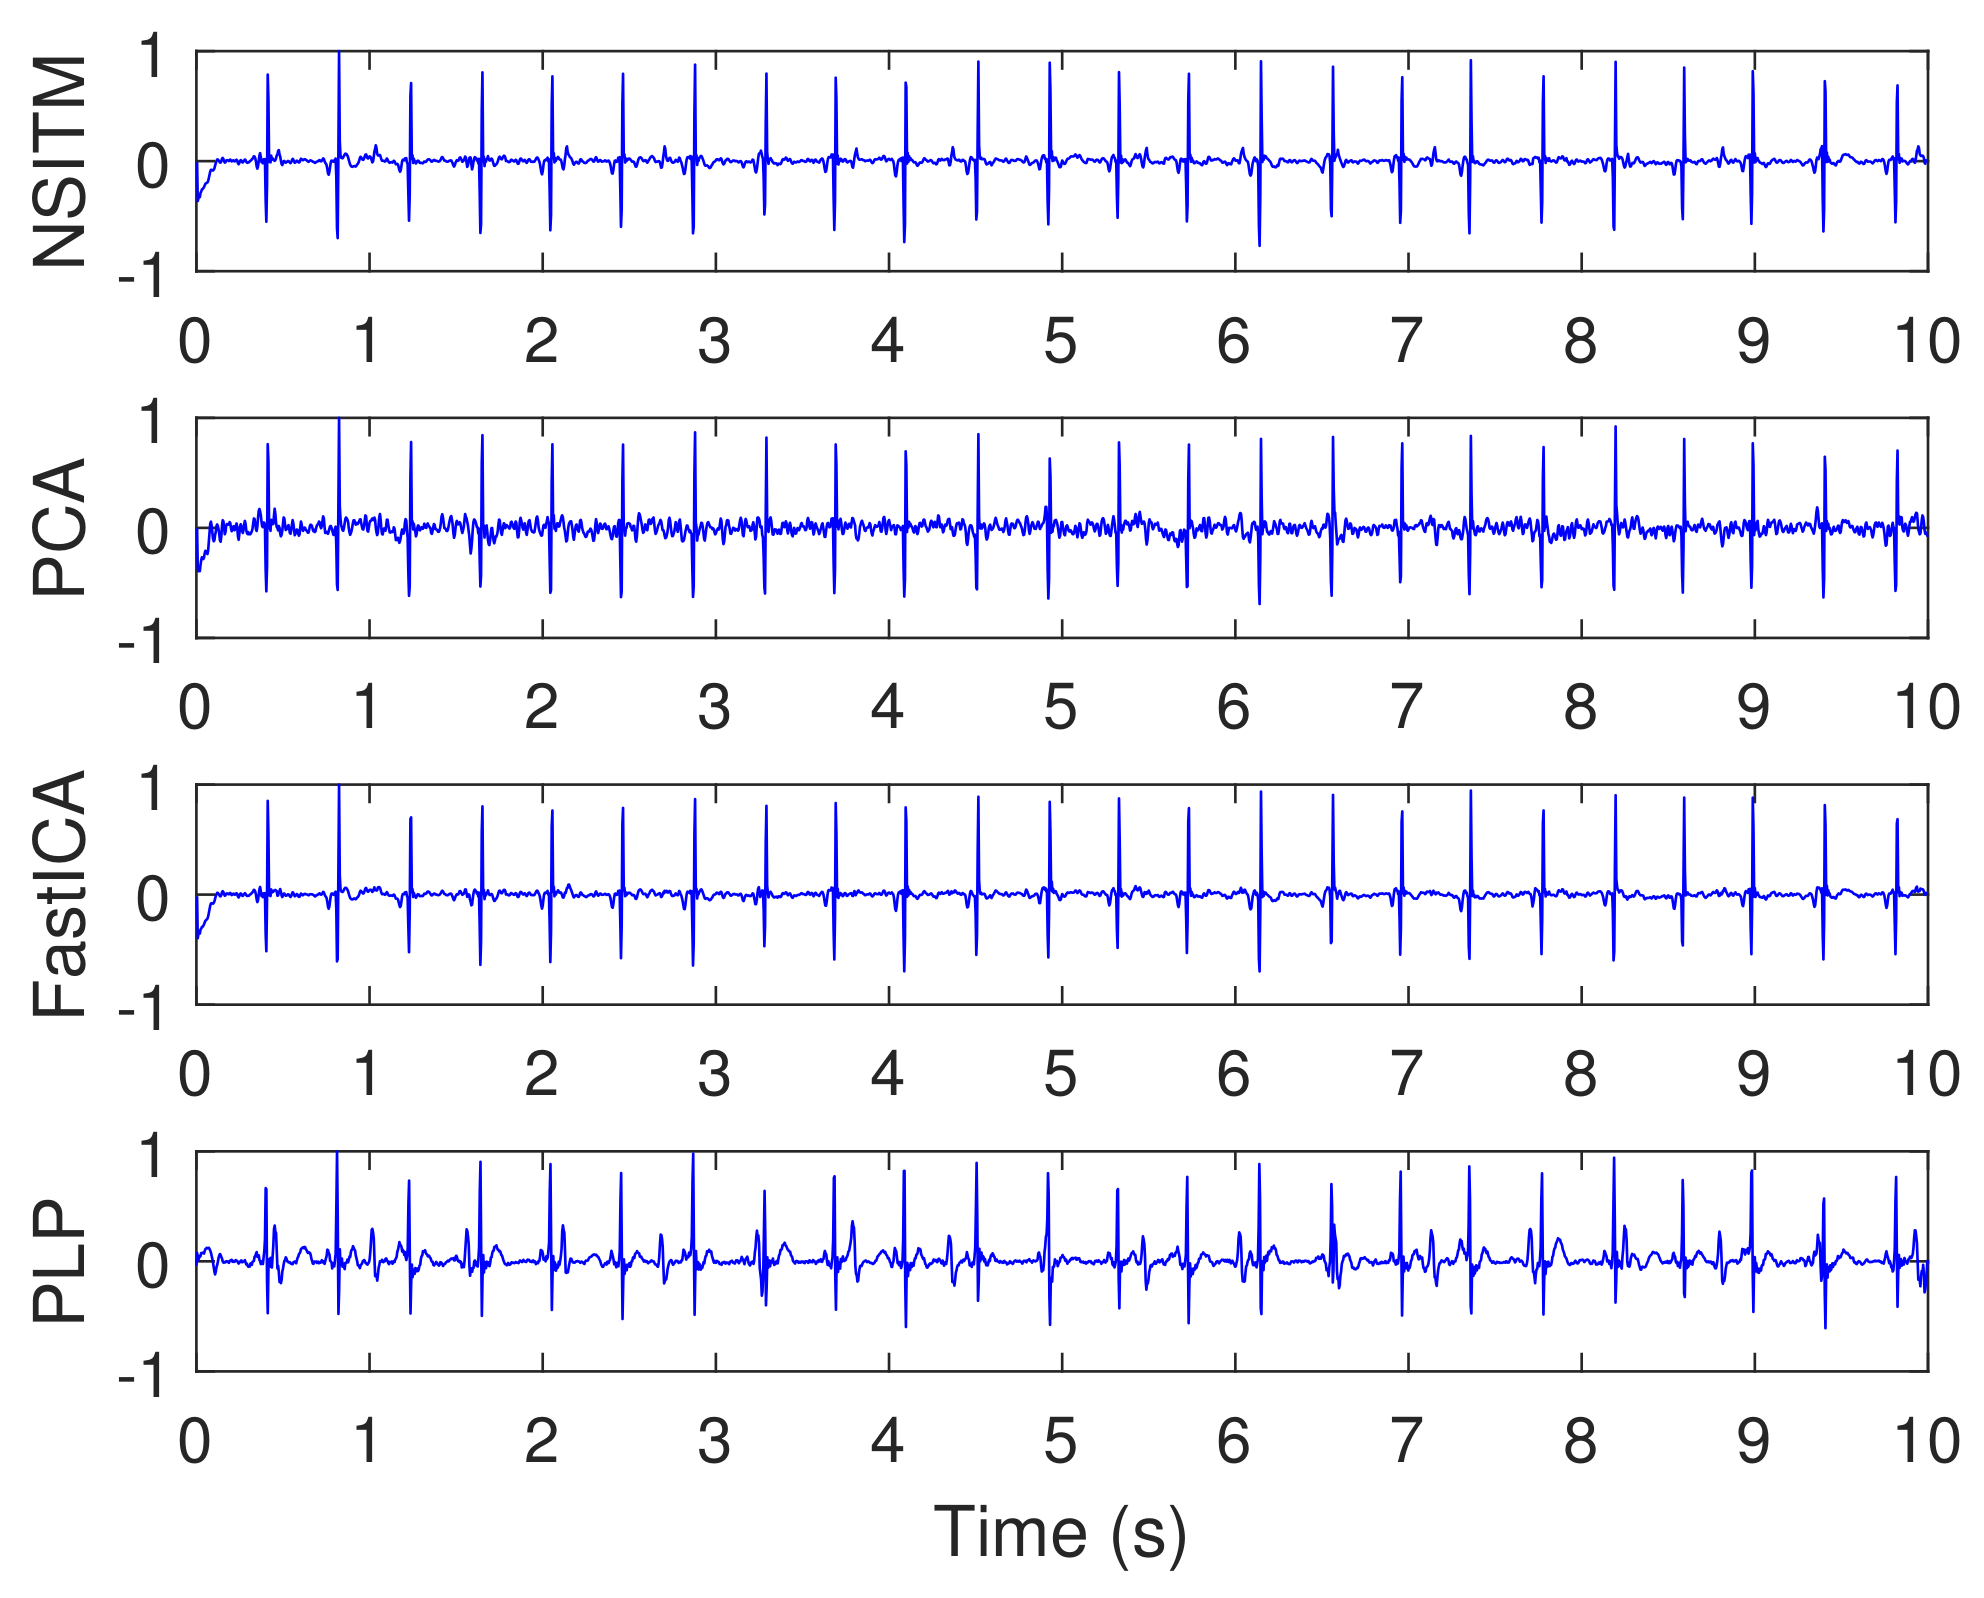
- The proposed NSITM algorithm is effective in extracting the FECG and MECG signals from the ECG mixture. As there were no MECG components in the raw FECG signals, the ACF will be deactivated by the control logic and the raw FECG signal is considered as the extracted FECG signal, as shown in Figure 15.
- As illustrated in Figure 15, the extracted FECG signal using the proposed NSITM is better than other extracted FECG signals using PCA, FastICA, and PLP algorithms.
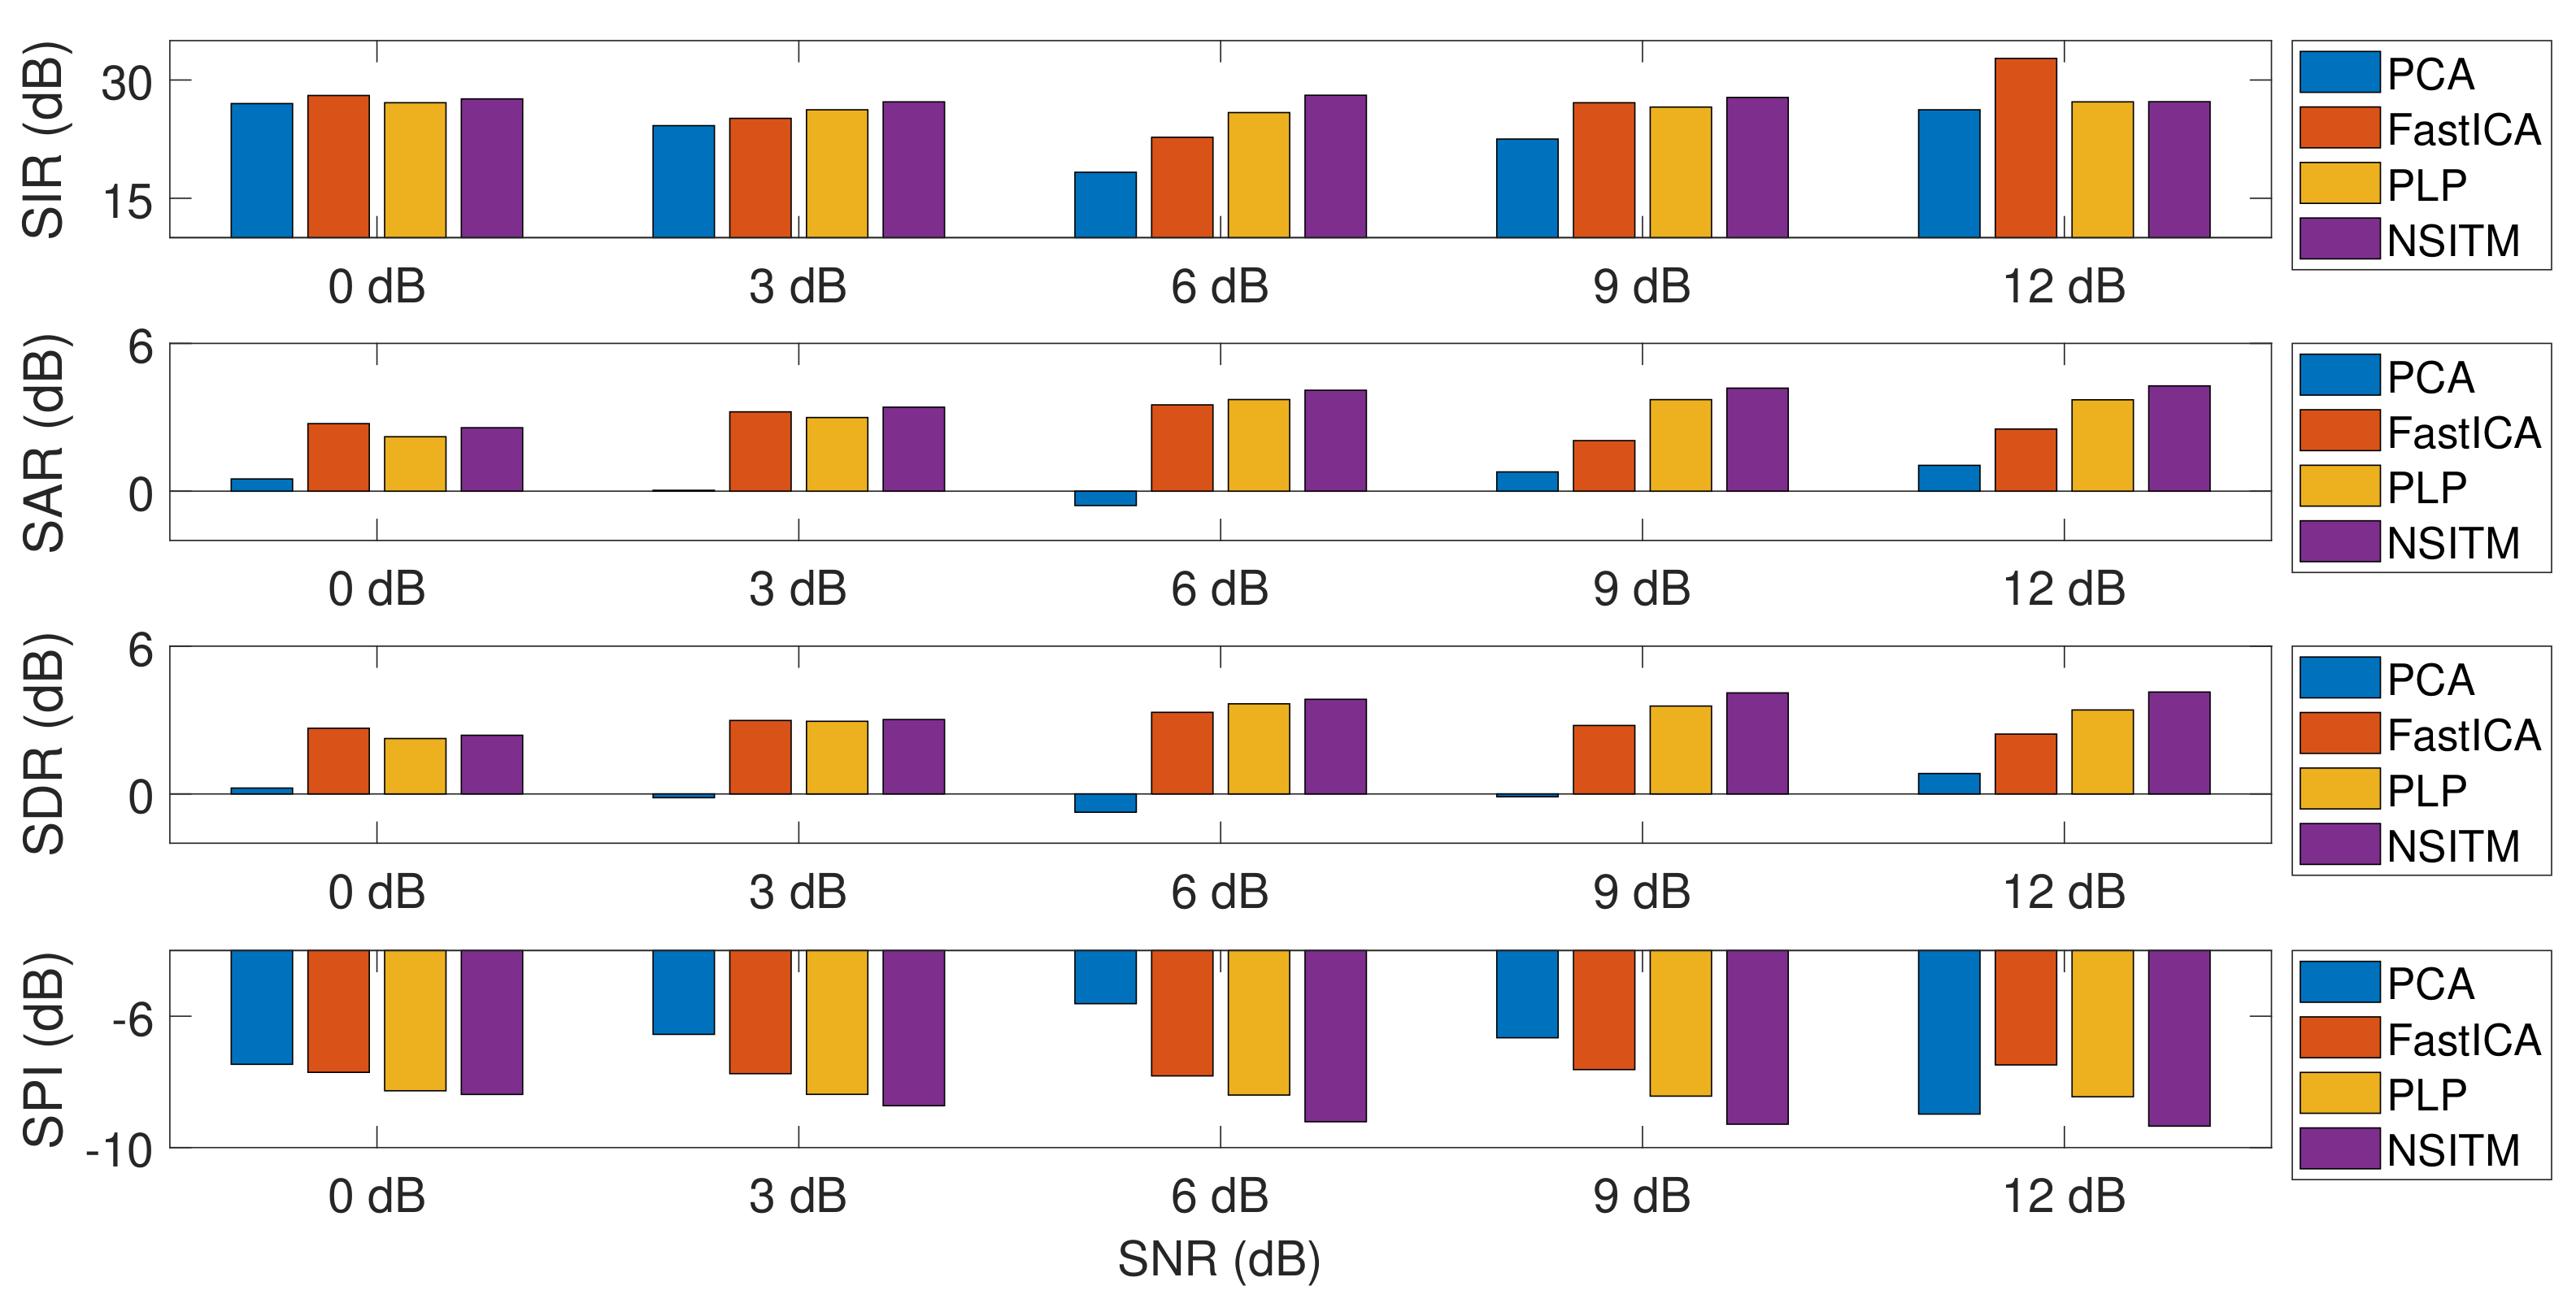
- As illustrated in Figure 17, the average values of the extraction performances SIR, SAR, SDR, and SPI are significantly better for the NSITM algorithm than those results obtained using PCA, FastICA, and PLP algorithms, for SNR equal to 3 dB, 6 dB, 9 dB, and 12 dB. However, for SNR = 0 dB, the FastICA shows a slightly better performance. This is due to limited number of data, i.e., subjects, used in the experiment. An increasing amount of experimental data may show better performances using NSITM, as is the case for 3dB, 6 dB, 9 dB, and 12 dB. We used the available data to run this simulation.
6.4. Discussion on Experiment 4
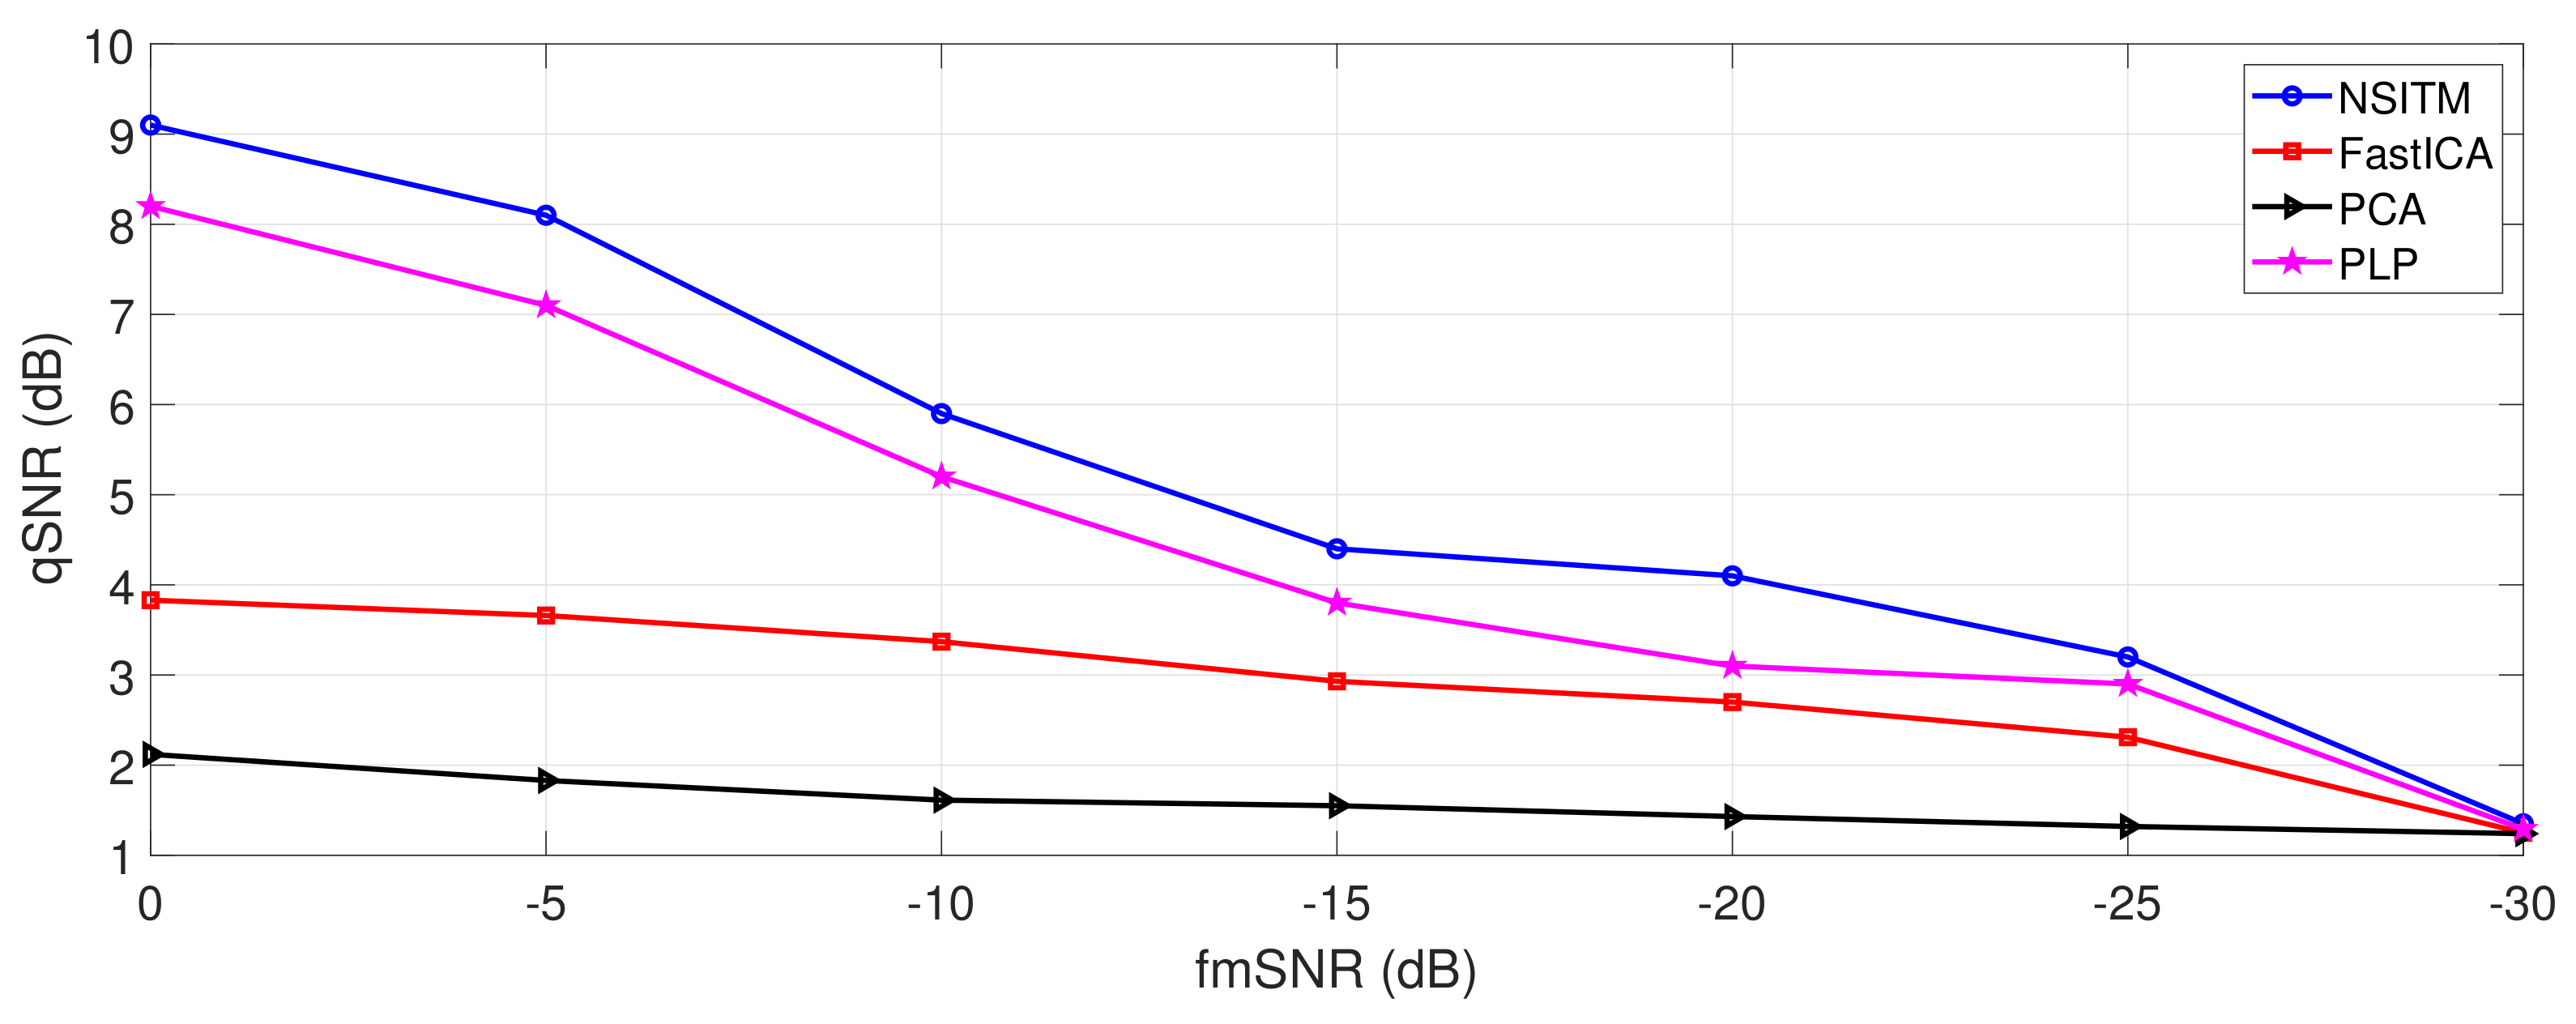
- At very low fmSNR, −30 dB, the proposed NSITM algorithm and other algorithms show the same low level of qSNR, which is equal to 1.29 dB. This is expected from all BSS algorithms at very low SNR.
- As the fmSNR increased, the proposed NSITM shows a considerable qSNR improvement as compared with all other algorithms. The maximum qSNR was recorded to be at 9.1 dB when the fmSNR is 0 dB.
- The next considerable algorithm is the PLP that shows a qSNR value of 8.2 dB at 0 dB fmSNR.
- The FastICA and PCA performance scores for the third and the fourth places with qSNR of 3.83 dB and 2.12 dB, respectively, at fmSNR = 0 dB.
6.5. Discussion on Experiment 5
- The proposed NSITM algorithm scores the highest average SE value (99%) as compared with other algorithms. The next highest scores are (98%, 97.3%, and 96.1%), using the PLP, FastICA, and PCA algorithms, respectively.
- The proposed NSITM algorithm scores the highest average ACC value (97%) as compared with other algorithms. The next highest scores are (95.5%, 93.3%, and 91.9%), using the PLP, FastICA, and PCA algorithms, respectively.
- The proposed NSITM algorithm scores the highest average PPV value (97.9%) as compared with other algorithms. The next highest scores are (97.4%, 95.7%, and 95.4%), using the PLP, FastICA, and PCA algorithms, respectively.
6.6. Future Work
7. Conclusions
Author Contributions
Funding
Conflicts of Interest
References
- Karvounis, E.C.; Tsipouras, M.G.; Fotiadis, D.I. Detection of fetal heart rate through 3D phase space analysis from multivariate abdominal recordings. IEEE Trans. Biomed. Eng. 2009, 56, 1394–1406. [Google Scholar] [CrossRef]
- Sameni, R.; Clifford, G.D. A Review of fetal ECG signal processing; issues and promising directions. NIH Public Access. 2010, 3, 4–20. [Google Scholar] [CrossRef]
- Luo, Z. Fetal electrocardiogram extraction using blind source separation and empirical mode decomposition. J. Comput. Inf. Syst. 2012, 8, 4285–4833. [Google Scholar]
- Sutha, P.; Jayanthi, V.E. Fetal electrocardiogram extraction and analysis using adaptive noise cancellation and wavelet transformation techniques. J. Med. Syst. 2018, 42, 1–18. [Google Scholar] [CrossRef] [PubMed]
- Debals, O.; Barel, M.V.; Lathauwer, L.D. Löwner-based blind signal separation of rational functions with applications. IEEE Trans. Signal Proc. 2016, 64, 1909–1918. [Google Scholar] [CrossRef]
- Shi, Z.; Zhang, C. Blind source extraction using generalized autocorrelations. IEEE Trans. Neural. Net. 2007, 18, 1516–1524. [Google Scholar] [CrossRef] [PubMed]
- Ma, Y.; Xiao, Y.; Wei, G.; Sun, J. Foetal ECG extraction using nonlinear adaptive noise canceller with multiple primary channels. IET Signal Process. 2018, 12, 219–227. [Google Scholar] [CrossRef]
- Zarzoso, V.; Nandi, A.K.; Bacharak, E. Maternal and foetal ECG separation using blind source separation methods. IMA J. Math. Appl. Med. Biol. 1997, 14, 207–225. [Google Scholar] [CrossRef] [PubMed]
- Poian, G.D.; Bernardini, R.; Rinaldo, R. Separation and analysis of fetal ECG signals from compressed sensed abdominal ECG recordings. IEEE Trans. Biomed. Eng. 2016, 63, 1269–1279. [Google Scholar] [CrossRef]
- Ziania, S.; Jbarib, A.; Bellarbic, L.; Farhaouid, Y. Blind maternal-fetal ECG separation based on the time-scale image TSI and SVD–ICA methods. Procedia Comput. Sci. 2018, 134, 322–327. [Google Scholar] [CrossRef]
- Sameni, R.; Christian, J.; Shamsollahi, M.B. Multichannel electrocardiogram decomposition using periodic component analysis. IEEE Trans. Biomed. Eng. 2008, 55, 1935–1940. [Google Scholar] [CrossRef]
- Taha, L.Y.; Abdel-Raheem, E. Efficient blind source extraction of noisy mixture utilizing a class of parallel linear predictor filters. IET Signal Process. 2018, 12, 1009–1016. [Google Scholar] [CrossRef]
- Taha, L.Y.; Abdel-Raheem, E. Extraction of fetal electrocardiogram signals using blind source extraction based parallel linear predictor filter. In Proceedings of the IEEE International Symposium on Signal Processing and Information Technology, Louisville, KY, USA, 6–8 December 2018. [Google Scholar]
- Ungureanu, M.; Bergmans, J.W.M.; Oei, S.G.; Strungaru, R. Fetal ECG extraction during labor using an adaptive maternal beat subtraction technique. Biomed. Tech. 2007, 1, 56–60. [Google Scholar] [CrossRef] [PubMed]
- Rai, H.M.; Trivedi, A.; Shukla, S. ECG signal processing for abnormalities detection using multi-resolution wavelet transform and artificial neural network classifier. Measurement 2013, 46, 3238–3246. [Google Scholar] [CrossRef]
- Wei, Z.; Xiaolong, L.; Xueyun, W.; Hongxing, L. Foetal ECG extraction by support vector regression. Electron. Lett. 2016, 52, 506–507. [Google Scholar] [CrossRef]
- Akhbari, M.; Niknazar, M.; Jutten, C.; Shamsollahi, M.B.; Rivet, B. Fetal electrocardiogram R-peak detection using robust tensor decomposition and extended Kalman filtering. In Computing in Cardiology 2013; IEEE: Piscataway, NJ, USA, 2013; Volume 40, pp. 189–192. [Google Scholar]
- Fatem, M.; Sameni, R. An Online subspace denoising algorithm for maternal ECG removal from fetal ECG signals. Iran. J. Sci. Technol. Trans. Electr. Eng. 2017, 41, 65–79. [Google Scholar] [CrossRef]
- Wei, Z.; Xueyun, W.; Hongxing, L. Noninvasive fetal ECG estimation using adaptive comb filter. Comput. Methods Programs Biomed. 2013, 112, 125–134. [Google Scholar] [CrossRef]
- Hwang, W.L.; Lu, K.S.; Ho, J. Constrained null space component analysis for semiblind source separation problem. IEEE Trans. Neural Netw. Learn. Syst. 2018, 29, 377–391. [Google Scholar] [CrossRef]
- Ye, Y.; Zhang, Z.L.; Zeng, J.; Peng, L. A fast and adaptive ICA algorithm with its application to fetal electrocardiogram extraction. Appl. Math. Comput. 2008, 205, 799–806. [Google Scholar] [CrossRef]
- Shadaydeh, M.; Xiao, Y.; AndWard, R.K. Extraction of fetal ECG using adaptive Volterra filters. In Proceedings of the 2008 16th European Signal Processing Conference, Lausanne, Switzerland, 25–29 August 2008. [Google Scholar]
- Swarnalatha, R.; Prasad, D.V. Maternal ECG cancellation in abdominal signal using ANFIS and wavelets. J. Appl. Sci. 2010, 10, 868–877. [Google Scholar] [CrossRef]
- Niknazar, M.; Rivet, B.; Jutten, C. Fetal ECG extraction by extended state Kalman filtering based on single-channel recordings. IEEE Trans. Biomed. Eng. 2013, 60, 1345–1352. [Google Scholar] [CrossRef] [PubMed]
- Ungureanua, G.M.; Bergmansb, J.W.M.; GuidOeic, S.; Ungureanua, A.; Wolfd, W. The event synchronous canceller algorithm removes maternal ECG from abdominal signals without affecting the fetal ECG. Comput. Biol. Med. 2009, 39, 562–567. [Google Scholar] [CrossRef] [PubMed]
- Ahmadieh, H.; Asl, B.M. Fetal ECG extraction via type-2 adaptive neuro-fuzzy inference systems. Comput. Methods Programs Biomed. 2017, 101–108. [Google Scholar] [CrossRef]
- Azzerboni, B.; Foresta, F.L.; Mammone, N.; Morabito, F.C. A new approach based on Wavelet-ICA algorithms for fetal electrocardiogram extraction. In Proceedings of the 13th European Symposium on Artificial Neural Networks, Bruges, Belgium, 27–29 April 2005. [Google Scholar]
- Kim, C.M.; Park, H.M.; Kim, T.Y.; Choi, K.; Lee, S.Y. FPGA implementation of ICA algorithm for blind signal separation and adaptive noise canceling. IEEE Trans. Neural Netw. 2003, 14, 1038–1046. [Google Scholar] [CrossRef]
- Behar, J.; Andreotti, F.; Zaunseder, S.; Oster, J.; Cliffo, G.D. A practical guide to noninvasive foetal electrocardiogram extraction and analysis. Physiol. Meas. 2016, 37, R1–R35. [Google Scholar] [CrossRef]
- Chena, R.B.; NianWub, Y. A null space method for over-complete blind source separation. Comput. Stat. Data Anal. 2007, 51, 5519–5536. [Google Scholar] [CrossRef]
- Hwang, W.L.; Ho, J. Null space component analysis for noisy blind source separation. Signal Process. 2015, 109, 301–316. [Google Scholar] [CrossRef]
- Taha, L.Y.; Abdel-Raheem, E. A Null space approach for complete and over-complete blind source separation of autoregressive source signals. In Proceedings of the IEEE 30th Canadian Conference on Electrical and Computer Engineering (CCECE), Windsor, ON, Canada, 30 April–3 May 2017. [Google Scholar]
- Taha, L.Y.; Abdel-Raheem, E. A Computationally efficient blind source extraction using idempotent transformation matrix. Circuits Syst. Signal Process. 2019, 38, 2245–2265. [Google Scholar] [CrossRef]
- Javidi, S.; Mandic, D.P.; Cichocki, A. Complex blind source extraction from noisy mixtures using second-order statistics. IEEE Trans. Circuits Syst. Regul. Pap. 2010, 57, 1404–1416. [Google Scholar] [CrossRef]
- Hsu, S.H.; Mullen, T.R.; Jung, T.P.; Cauwenberghs, G. Real-time adaptive EEG source separation using online recursive independent component analysis. IEEE Trans. Neural Syst. Rehabil. Eng. 2016, 24, 1309–1319. [Google Scholar] [CrossRef] [PubMed]
- Martinek, R.; Kahankova, R.; Jezewski, J.; Jaros, R.; Mohylova, J.; Fajkus, M.; Nedoma, J.; Janku, P.; Nazeran, H. Comparative effectiveness of ICA and PCA in extraction of fetal ECG from abdominal signals: Toward non-invasive fetal monitoring. Front. Physiol. 2018, 9, 1–24. [Google Scholar] [CrossRef] [PubMed]
- Hyvärinen, A.; Karhunen, J.; Oja, E. Independent Component Analysis; John Wiley and Sons: New York, NY, USA, 2001. [Google Scholar]
- Kanjilal, P.; Palit, S.; Saha, G. Fetal ECG extraction from single-channel maternal ECG using singular value decomposition. IEEE Trans. Biomed. Eng. 1997, 33, 51–59. [Google Scholar] [CrossRef] [PubMed]
- Haghpanahi, M.; Borkholder, D.A. Fetal ECG extraction from abdominal recordings using array signal processing. In Computing in Cardiology 2013; IEEE: Piscataway, NJ, USA, 2013; Volume 40, pp. 173–176. [Google Scholar]
- Vuksanovic, B.; Alhamdi, M. AR-based method for ECG classification and patient recognition. Int. J. Biom. Bioinform. (IJBB) 2013, 7, 74–92. [Google Scholar]
- Albera, L.; Kachenoura, A.; Comon, P.; Karfoul, A.; Wendling, F.; Senhadji, L.; Merlet, I.; Vuksanovic, B.; Alhamdi, M. ICA-based EEG denoising: A comparative analysis of fifteen methods. Bull. Pol. Acad. Sci. Tech. Sci. 2012, 60, 407–418. [Google Scholar] [CrossRef]
- Pan, J.; Tompkins, W.J. A Real-Time QRS Detection Algorithm. IEEE Trans. Biomed. Eng. 1985, 32, 230–236. [Google Scholar] [CrossRef]
- Sedghamiz, H. Matlab Implementation of Pan Tompkins ECG QRS Detector. Available online: https:///www.researchgate.net/publication/313673153_Matlab_Implementation_of_Pan_Tompkins_ECG_QRS_detector (accessed on 20 October 2019).
- DaISy. Available online: https://homes.esat.kuleuven.be/~smc/daisy/daisydata.html (accessed on 8 November 2019).
- Physionet Noninvasive fetal ECG—The PhysioNet Computing in Cardiology Challenge 2013. Available online: https://Physionet.org/challenge/2013/ (accessed on 20 January 2020).
- Goldberger, A.; Amaral, L.; Glass, L.; Hausdorff, J.; Ivanov, P.; Mark, R.; Mietus, J.; Moody, G.; Peng, C.; Stanley, H. PhysioBank, PhysioToolkit, and PhysioNet: Components of a new research resource for complex physiologic signals. Circ. Electron. Pages 2000, 101, e215–e220. [Google Scholar] [CrossRef]
- Physionet. Fetal ECG Synthetic Database. Available online: https://Physionet.org/physiobank/database/fecgsyndb/ (accessed on 3 February 2020).
- Andreotti, F.; Behar, J.; Zaunseder, S.; Oster, J.; Clifford, G. An open-source framework for stress-testing non-invasive foetal ECG extraction algorithms. Physiol. Meas. 2016, 5, 627–648. [Google Scholar] [CrossRef]
- Behar, J.; Andreotti, F.; Zaunseder, S.; Li, Q.; Oster, J.; Clifford, G. An ECG simulator for generating maternal-foetal activity mixtures on abdominal ECG recordings. Physiol. Meas. 2014, 35, 1537. [Google Scholar] [CrossRef]
- Vincent, E.; Gribonval, R.; Févotte, C. Performance measurement in blind audio source separation. IEEE Trans. Audio Speech Lang. Process. 2006, 14, 1462–1469. [Google Scholar] [CrossRef]
- Yueyue, N.A.; Chai, B. Performance Evaluation for Frequency Domain Blind Source Separation Algorithms. J. Comput. Inf. Syst. 2013, 9, 7369–7379. [Google Scholar] [CrossRef]
- Walters-Williams, J.; Li, Y. BMICA-independent component analysis based on B-spline mutual information estimation for EEG signals. Can. J. Biomed. Eng. Technol. 2012, 2, 63–80. [Google Scholar]
- Gribonval, R.; Févotte, C.; Vincent, E. BSS EVAL toolbox user guide. IRISA Tech. Rep. 2005, 1706, 1–19. Available online: https://hal.inria.fr/inria-00564760/document (accessed on 20 February 2020).
- Slama, A.B.; Lentka, Ł.; Mouelhi, A.; Diouani, M.F.; Sayadi, M.; Smulko, J. Application of statistical features and multilayer neural network to automatic diagnosis of arrhythmia by ECG signals. Metrol. Meas. Syst. 2018, 25, 87–101. [Google Scholar] [CrossRef]


| Simulated Pregnancy Number | SNR | Type of | File Name Used Synthesised Signal in the Paper | File Name Downloaded from [47] |
|---|---|---|---|---|
| FECG | F0100 | sub01/snr00dB/sub01_snr00dB_l1_fecg1 | ||
| 01 | 0 dB | MECG | M0100 | sub01/snr00dB/sub01_snr00dB_l1_MECG |
| Noise | N0100 | sub01/snr00dB/sub01_snr00dB_l1_noise1 | ||
| FECG | F0506 | sub05/snr06dB/sub05_snr06dB_l1_fecg1 | ||
| 05 | 6 dB | MECG | M0506 | sub05/snr06dB/sub05_snr06dB_l1_MECG |
| Noise | N0506 | sub05/snr06dB/sub05_snr06dB_l1_noise1 | ||
| FECG | F1012 | sub10/snr12dB/sub105_snr12dB_l1_fecg1 | ||
| 10 | 12 dB | MECG | M1012 | sub10/snr12dB/sub10_snr12dB_l1_MECG |
| Noise | N1012 | sub10/snr12dB/sub10_snr12dB_l1_noise1 |
| Paper File Names | ||||||||||
|---|---|---|---|---|---|---|---|---|---|---|
| Extraction Metric | Algorithm | F0100 | F0200 | F0300 | F0600 | F0700 | F0800 | F0900 | F1000 | Average |
| M0100 | M0200 | M0300 | M0600 | M0700 | M0800 | M0900 | F1000 | |||
| N0100 | N0200 | N0300 | N0600 | N0700 | N0800 | N0900 | N1000 | |||
| PCA | 14.57 | 25.42 | 39.81 | 27.61 | 28.18 | 34.37 | 28.39 | 17.74 | 27.01 | |
| SIR | FastICA | 22.73 | 26.41 | 29.26 | 31.71 | 27.19 | 39.38 | 24.33 | 23.26 | 28.03 |
| (dB) | PLP | 22.94 | 27.35 | 28.85 | 32.33 | 21.54 | 35.45 | 32.39 | 16.12 | 27.12 |
| NSITM | 24.51 | 28.11 | 29.08 | 32.69 | 21.63 | 35.71 | 33.04 | 16.14 | 27.61 | |
| PCA | −11.91 | −0.33 | 8.86 | 12.59 | 3.98 | 2.81 | −12.38 | 0.36 | 0.49 | |
| SAR | FastICA | −2.41 | 6.44 | 5.92 | 2.57 | 4.41 | 2.47 | −0.56 | 3.13 | 2.74 |
| (dB) | PLP | −2.33 | 6.45 | 6.11 | 4.52 | −4.02 | 2.35 | 1.25 | 3.37 | 2.21 |
| NSITM | −2.24 | 6.48 | 6.43 | 6.47 | −3.91 | 2.57 | 1.57 | 3.52 | 2.57 | |
| PCA | −12.73 | −0.38 | 8.81 | 12.38 | 3.82 | 2.82 | −13.01 | 0.22 | 0.24 | |
| SDR | FastICA | −2.43 | 6.42 | 5.81 | 2.55 | 4.07 | 2.41 | −0.52 | 3.03 | 2.66 |
| (dB) | PLP | −2.39 | 6.11 | 5.76 | 6.12 | −4.12 | 2.17 | 1.44 | 2.96 | 2.25 |
| NSITM | −2.41 | 6.41 | 6.09 | 6.16 | −4.11 | 2.24 | 1.57 | 3.12 | 2.38 | |
| PCA | −1.28 | −6.57 | −12.56 | −10.16 | −8.61 | −8.01 | −6.86 | −5.51 | −7.40 | |
| SPI | FastICA | −5.14 | −10.37 | −9.71 | −7.20 | −8.56 | −7.58 | −5.82 | −7.29 | −7.70 |
| (dB) | PLP | −5.21 | −10.73 | −10.22 | −9.61 | −6.92 | −7.94 | −8.27 | −7.32 | −8.27 |
| NSITM | −5.22 | −11.03 | −10.59 | −10.68 | −4.12 | −6.48 | −11.33 | −7.61 | −8.38 | |
| Paper File Names | ||||||||||
|---|---|---|---|---|---|---|---|---|---|---|
| Extraction Metric | Algorithm | F0103 | F0203 | F0303 | F0603 | F0703 | F0803 | F0903 | F1000 | Average |
| M0103 | M0203 | M0303 | M0603 | M0703 | M0803 | M0903 | F1030 | |||
| N0103 | N0203 | N0303 | N0603 | N0703 | N0803 | N0903 | N1030 | |||
| PCA | 17.56 | 19.81 | 15.62 | 12.37 | 25.33 | 16.41 | 19.23 | 20.12 | 18.31 | |
| SIR | FastICA | 8.14 | 27.24 | 19.33 | 26.12 | 26.38 | 20.93 | 22.11 | 21.79 | 21.51 |
| (dB) | PLP | 12.41 | 32.25 | 19.52 | 29.91 | 30.24 | 21.03 | 38.77 | 22.83 | 25.87 |
| NSITM | 14.56 | 36.71 | 18.91 | 33.13 | 32.49 | 22.18 | 41.74 | 24.82 | 28.07 | |
| PCA | −13.81 | −0.96 | 3.07 | 7.24 | 5.82 | −3.31 | −1.89 | −0.83 | −0.58 | |
| SAR | FastICA | 1.92 | 4.56 | 5.08 | 2.39 | 5.88 | 3.62 | 5.52 | −0.93 | 3.51 |
| (dB) | PLP | −2.03 | 4.36 | 4.93 | 4.37 | 6.26 | 4.15 | 6.52 | 1.22 | 3.72 |
| (dB) | NSITM | −2.17 | 4.23 | 4.22 | 6.31 | 6.77 | 5.06 | 6.92 | 1.47 | 4.10 |
| PCA | −13.77 | −1.62 | 3.05 | 7.11 | 5.77 | −3.53 | −2.12 | −0.84 | −0.74 | |
| SDR | FastICA | 1.12 | 4.55 | 5.09 | 2.35 | 5.81 | 3.28 | 5.24 | −0.92 | 3.31 |
| (dB) | PLP | −1.23 | 4.44 | 3.59 | 4.71 | 6.15 | 4.27 | 6.15 | 1.24 | 3.66 |
| NSITM | −3.17 | 4.23 | 3.67 | 6.19 | 6.75 | 4.81 | 6.82 | 1.41 | 3.84 | |
| PCA | −1.67 | −6.43 | −7.91 | −9.29 | −10.11 | −3.39 | −4.07 | −2.12 | −5.62 | |
| SPI | FastICA | −6.22 | −9.21 | −9.58 | −7.01 | −9.62 | −8.36 | −9.47 | −3.11 | −7.82 |
| (dB) | PLP | −5.46 | −9.31 | −9.42 | −9.55 | −10.32 | −8.89 | −10.84 | −3.44 | − 8.40 |
| (dB) | NSITM | −4.59 | −9.52 | −9.32 | −11.49 | −10.72 | −10.77 | −13.69 | −3.61 | −9.21 |
| Paper File Names | ||||||||||
|---|---|---|---|---|---|---|---|---|---|---|
| Extraction Metric | Algorithm | F0112 | F0212 | F0312 | F0612 | F0712 | F0812 | F0912 | F1012 | Average |
| M0112 | M0212 | M0312 | M0612 | M0712 | M0812 | M0912 | F1012 | |||
| N0112 | N0212 | N0312 | N0612 | N0712 | N0812 | N0912 | N1012 | |||
| PCA | 16.09 | 22.78 | 33.43 | 19.81 | 27.28 | 41.57 | 22.53 | 26.34 | 26.23 | |
| SIR | FastICA | 25.66 | 39.81 | 33.41 | 49.47 | 36.31 | 28.67 | 15.51 | 33.12 | 32.74 |
| (dB) | PLP | 3.42 | 32.37 | 28.11 | 36.52 | 24.35 | 18.34 | 24.31 | 20.42 | 27.23 |
| NSITM | 36.56 | 30.87 | 29.81 | 28.93 | 26.91 | 18.68 | 24.91 | 21.32 | 27.25 | |
| PCA | −10.24 | −0.64 | 3.01 | 10.84 | 7.03 | 7.02 | −11.76 | 2.78 | 1.05 | |
| SAR | FastICA | 0.24 | 6.51 | 7.93 | 4.97 | 5.67 | 0.23 | −6.51 | 1.11 | 2.52 |
| (dB) | PLP | 0.12 | 6.03 | 8.13 | 7.63 | 5.57 | 0.46 | −1.53 | 3.27 | 3.71 |
| NSITM | 0.099 | 5.97 | 8.33 | 9.66 | 5.59 | 0.58 | −0.39 | 4.35 | 4.27 | |
| PCA | −10.34 | −0.66 | 2.99 | 9.9 | 7.12 | 7.01 | −12.11 | 2.73 | 0.83 | |
| SDR | FastICA | 0.21 | 6.49 | 7.91 | 4.97 | 5.68 | 0.15 | −7.07 | 1.13 | 2.43 |
| (dB) | PLP | 0.15 | 6.12 | 8.32 | 6.49 | 5.51 | 0.27 | −2.62 | 3.08 | 3.41 |
| NSITM | 0.089 | 5.91 | 8.23 | 9.51 | 5.43 | 0.38 | −0.62 | 4.18 | 4.14 | |
| PCA | −1.62 | −6.35 | −11.41 | −13.81 | −11.01 | −10.78 | −9.72 | −7.18 | −8.98 | |
| SPI | FastICA | −2.16 | −10.62 | −11.43 | −8.93 | −9.49 | −7.07 | −4.28 | −5.93 | −7.48 |
| (dB) | PLP | 3.94 | −10.62 | −11.61 | −12.78 | −9.51 | −5.69 | −6.15 | −7.32 | −8.45 |
| NSITM | −5.92 | −10.61 | −12.61 | −14.21 | −9.57 | −5.71 | −7.07 | −9.11 | −9.35 | |
| Algorithm | File Number | Detected Peaks | TP | FP | FN | SE (%) | ACC (%) | PPV (%) |
|---|---|---|---|---|---|---|---|---|
| a04 | 131 | 126 | 5 | 4 | 96.9 | 93.3 | 96.2 | |
| a08 | 130 | 122 | 7 | 6 | 95.3 | 90.4 | 94.6 | |
| PCA | a14 | 131 | 124 | 7 | 6 | 95.4 | 90.5 | 94.7 |
| a15 | 131 | 125 | 6 | 5 | 96.2 | 91.9 | 95.4 | |
| a25 | 131 | 126 | 5 | 4 | 96.9 | 93.3 | 96.2 | |
| Mean values | → | 96.1 | 91.9 | 95.4 | ||||
| a04 | 130 | 126 | 4 | 3 | 97.7 | 94.7 | 96.9 | |
| a08 | 130 | 123 | 7 | 4 | 96.9 | 91.8 | 94.6 | |
| FastICA | a14 | 130 | 124 | 6 | 3 | 97.6 | 93.2 | 95.4 |
| a15 | 130 | 124 | 6 | 4 | 96.9 | 92.5 | 95.4 | |
| a25 | 131 | 126 | 5 | 3 | 97.7 | 94.0 | 96.2 | |
| Mean values | → | 97.3 | 93.3 | 95.7 | ||||
| a04 | 130 | 127 | 3 | 3 | 97.7 | 95.5 | 97.7 | |
| a08 | 130 | 126 | 4 | 4 | 96.9 | 94.0 | 96.9 | |
| PLP | a14 | 130 | 128 | 2 | 1 | 99.2 | 97.7 | 98.5 |
| a15 | 130 | 127 | 3 | 2 | 98.4 | 96.2 | 97.7 | |
| a25 | 131 | 126 | 5 | 3 | 97.7 | 94.0 | 96.2 | |
| Mean values | → | 98.0 | 95.5 | 97.4 | ||||
| a04 | 130 | 127 | 3 | 2 | 98.4 | 96.2 | 97.7 | |
| a08 | 131 | 128 | 3 | 2 | 98.5 | 96.2 | 97.7 | |
| NSITM | a14 | 130 | 129 | 1 | 0 | 100 | 99.2 | 99.2 |
| a15 | 130 | 127 | 3 | 1 | 99.2 | 96.9 | 97.7 | |
| a25 | 131 | 127 | 4 | 1 | 99.2 | 96.2 | 96.9 | |
| Mean values | → | 99.1 | 97.0 | 97.9 |
© 2020 by the authors. Licensee MDPI, Basel, Switzerland. This article is an open access article distributed under the terms and conditions of the Creative Commons Attribution (CC BY) license (http://creativecommons.org/licenses/by/4.0/).
Share and Cite
Taha, L.; Abdel-Raheem, E. A Null Space-Based Blind Source Separation for Fetal Electrocardiogram Signals. Sensors 2020, 20, 3536. https://doi.org/10.3390/s20123536
Taha L, Abdel-Raheem E. A Null Space-Based Blind Source Separation for Fetal Electrocardiogram Signals. Sensors. 2020; 20(12):3536. https://doi.org/10.3390/s20123536
Chicago/Turabian StyleTaha, Luay, and Esam Abdel-Raheem. 2020. "A Null Space-Based Blind Source Separation for Fetal Electrocardiogram Signals" Sensors 20, no. 12: 3536. https://doi.org/10.3390/s20123536
APA StyleTaha, L., & Abdel-Raheem, E. (2020). A Null Space-Based Blind Source Separation for Fetal Electrocardiogram Signals. Sensors, 20(12), 3536. https://doi.org/10.3390/s20123536