Low-Cost Automated Vectors and Modular Environmental Sensors for Plant Phenotyping

 ,
,
Abstract
1. Introduction
2. Automated Vectors
2.1. Thermal Imager
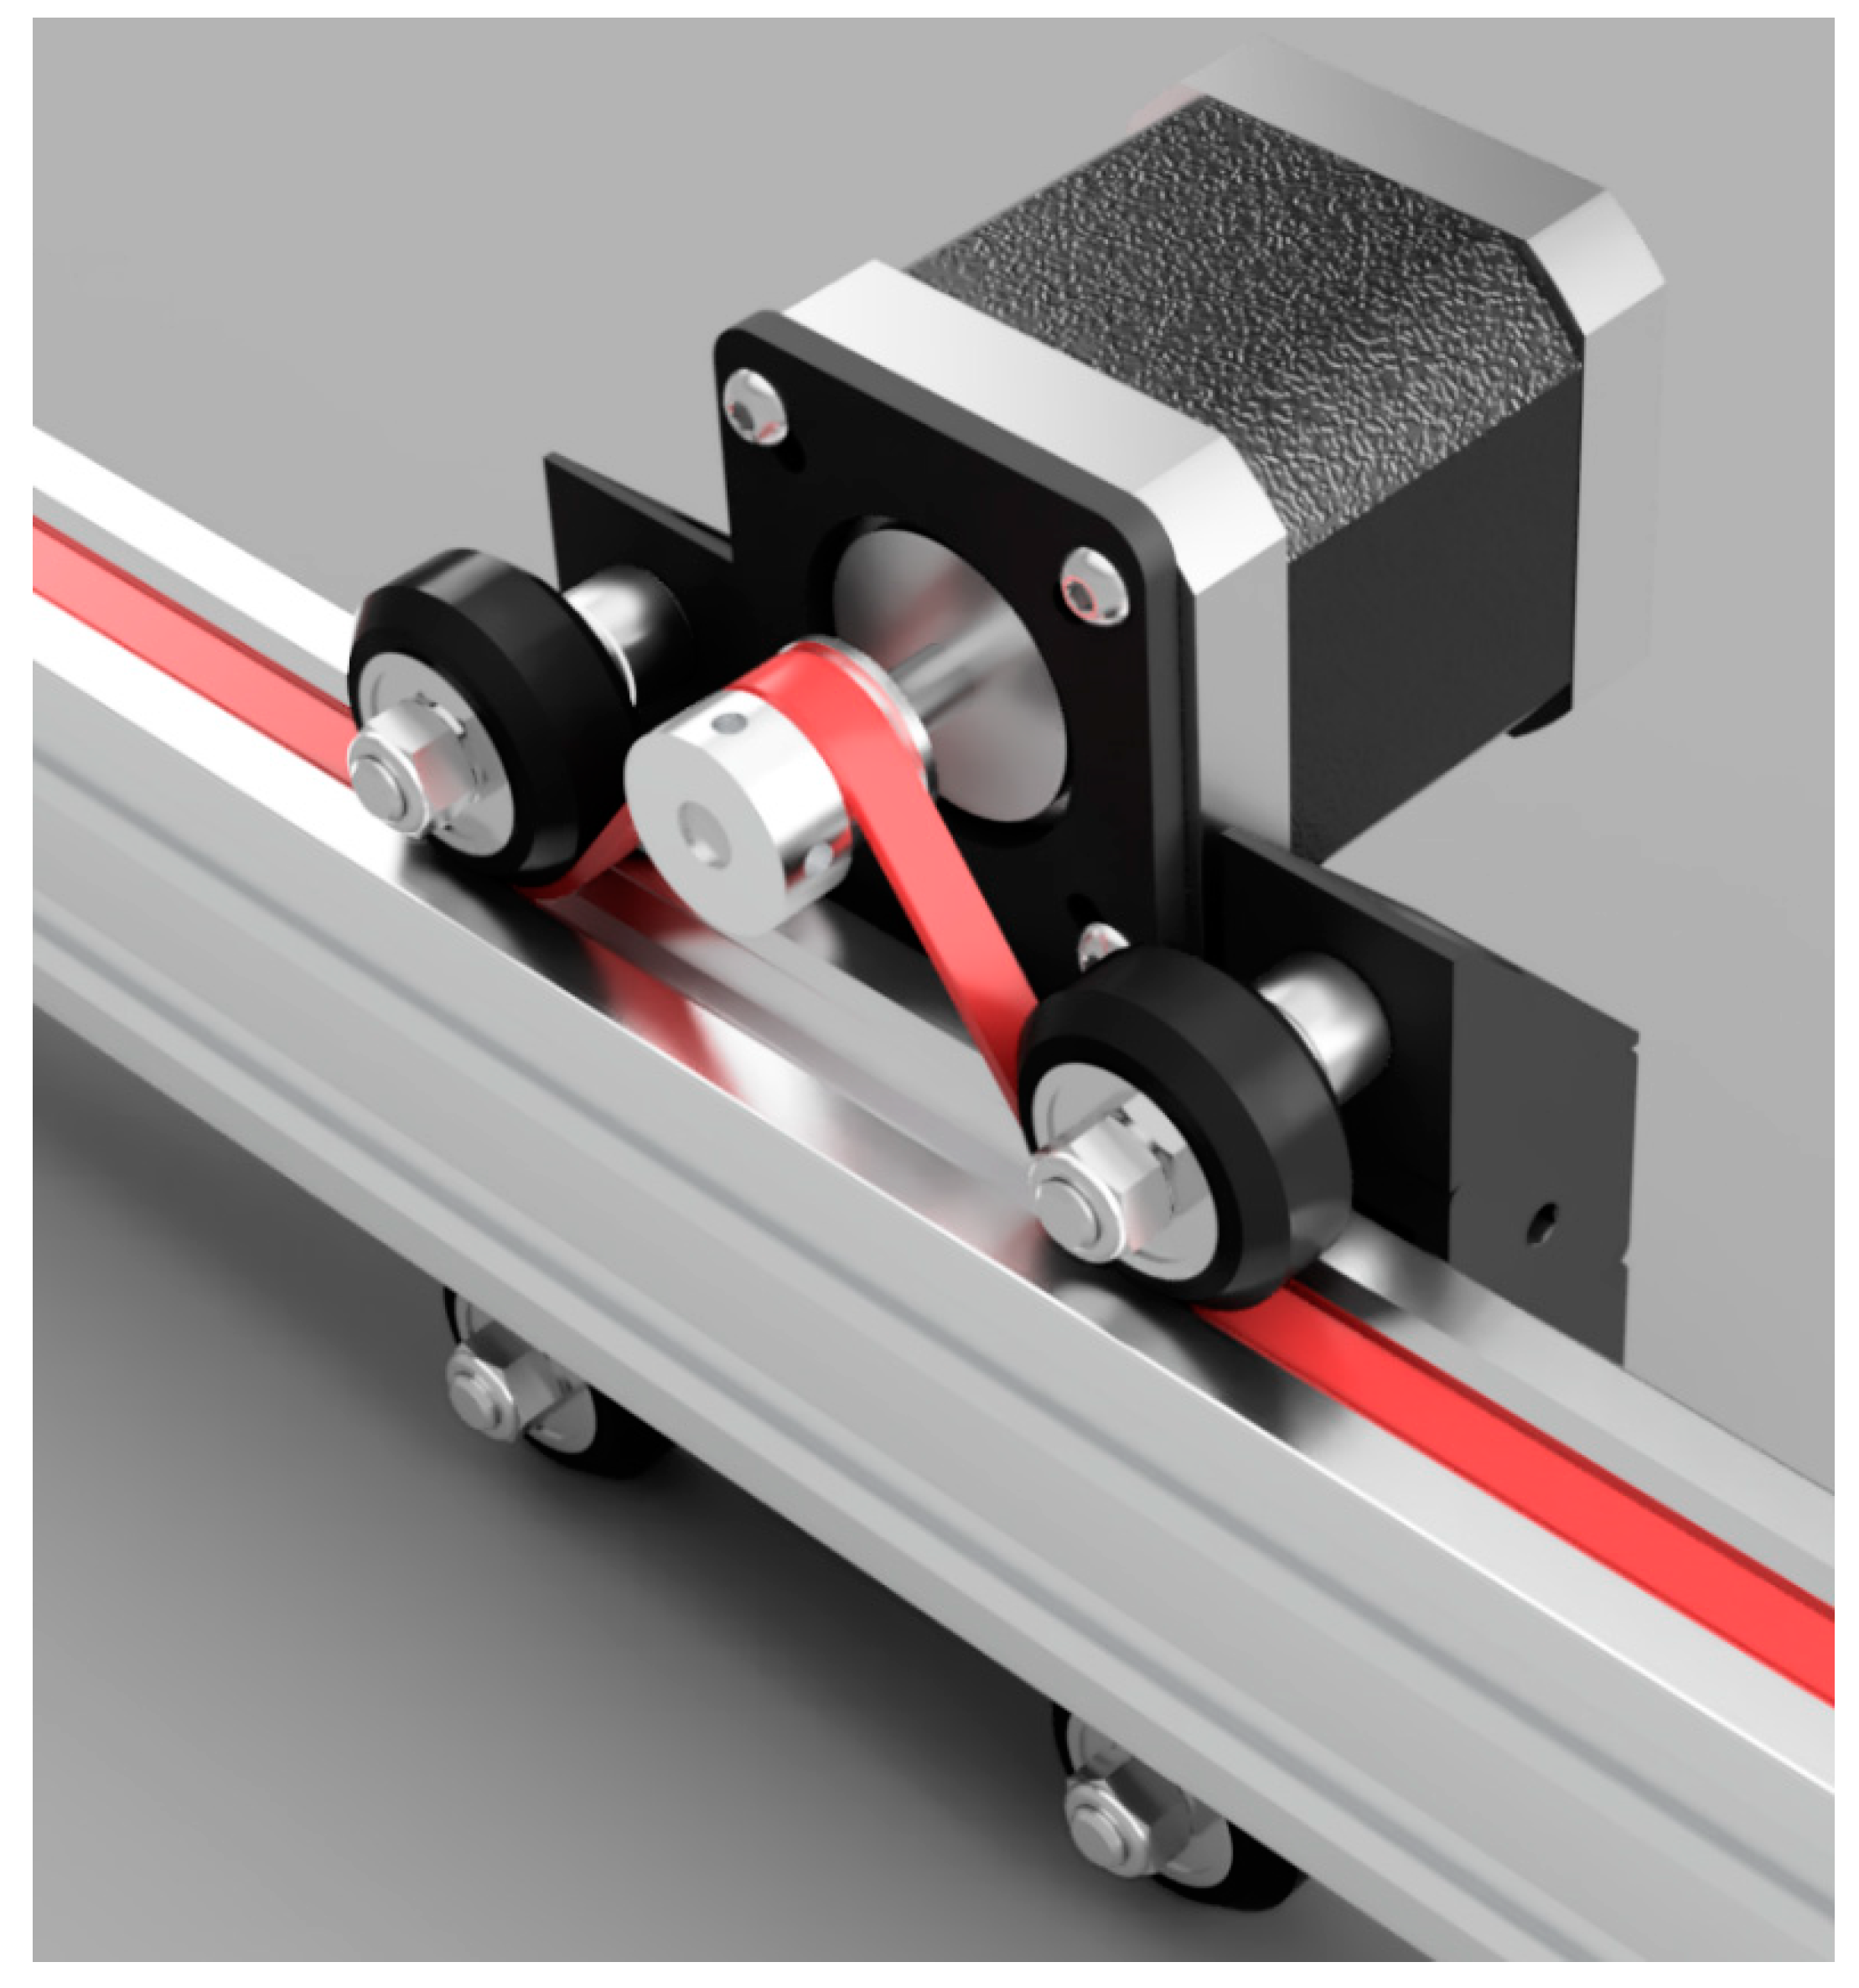
2.1.1. Mechanical Components
2.1.2. Electrical/Control Components
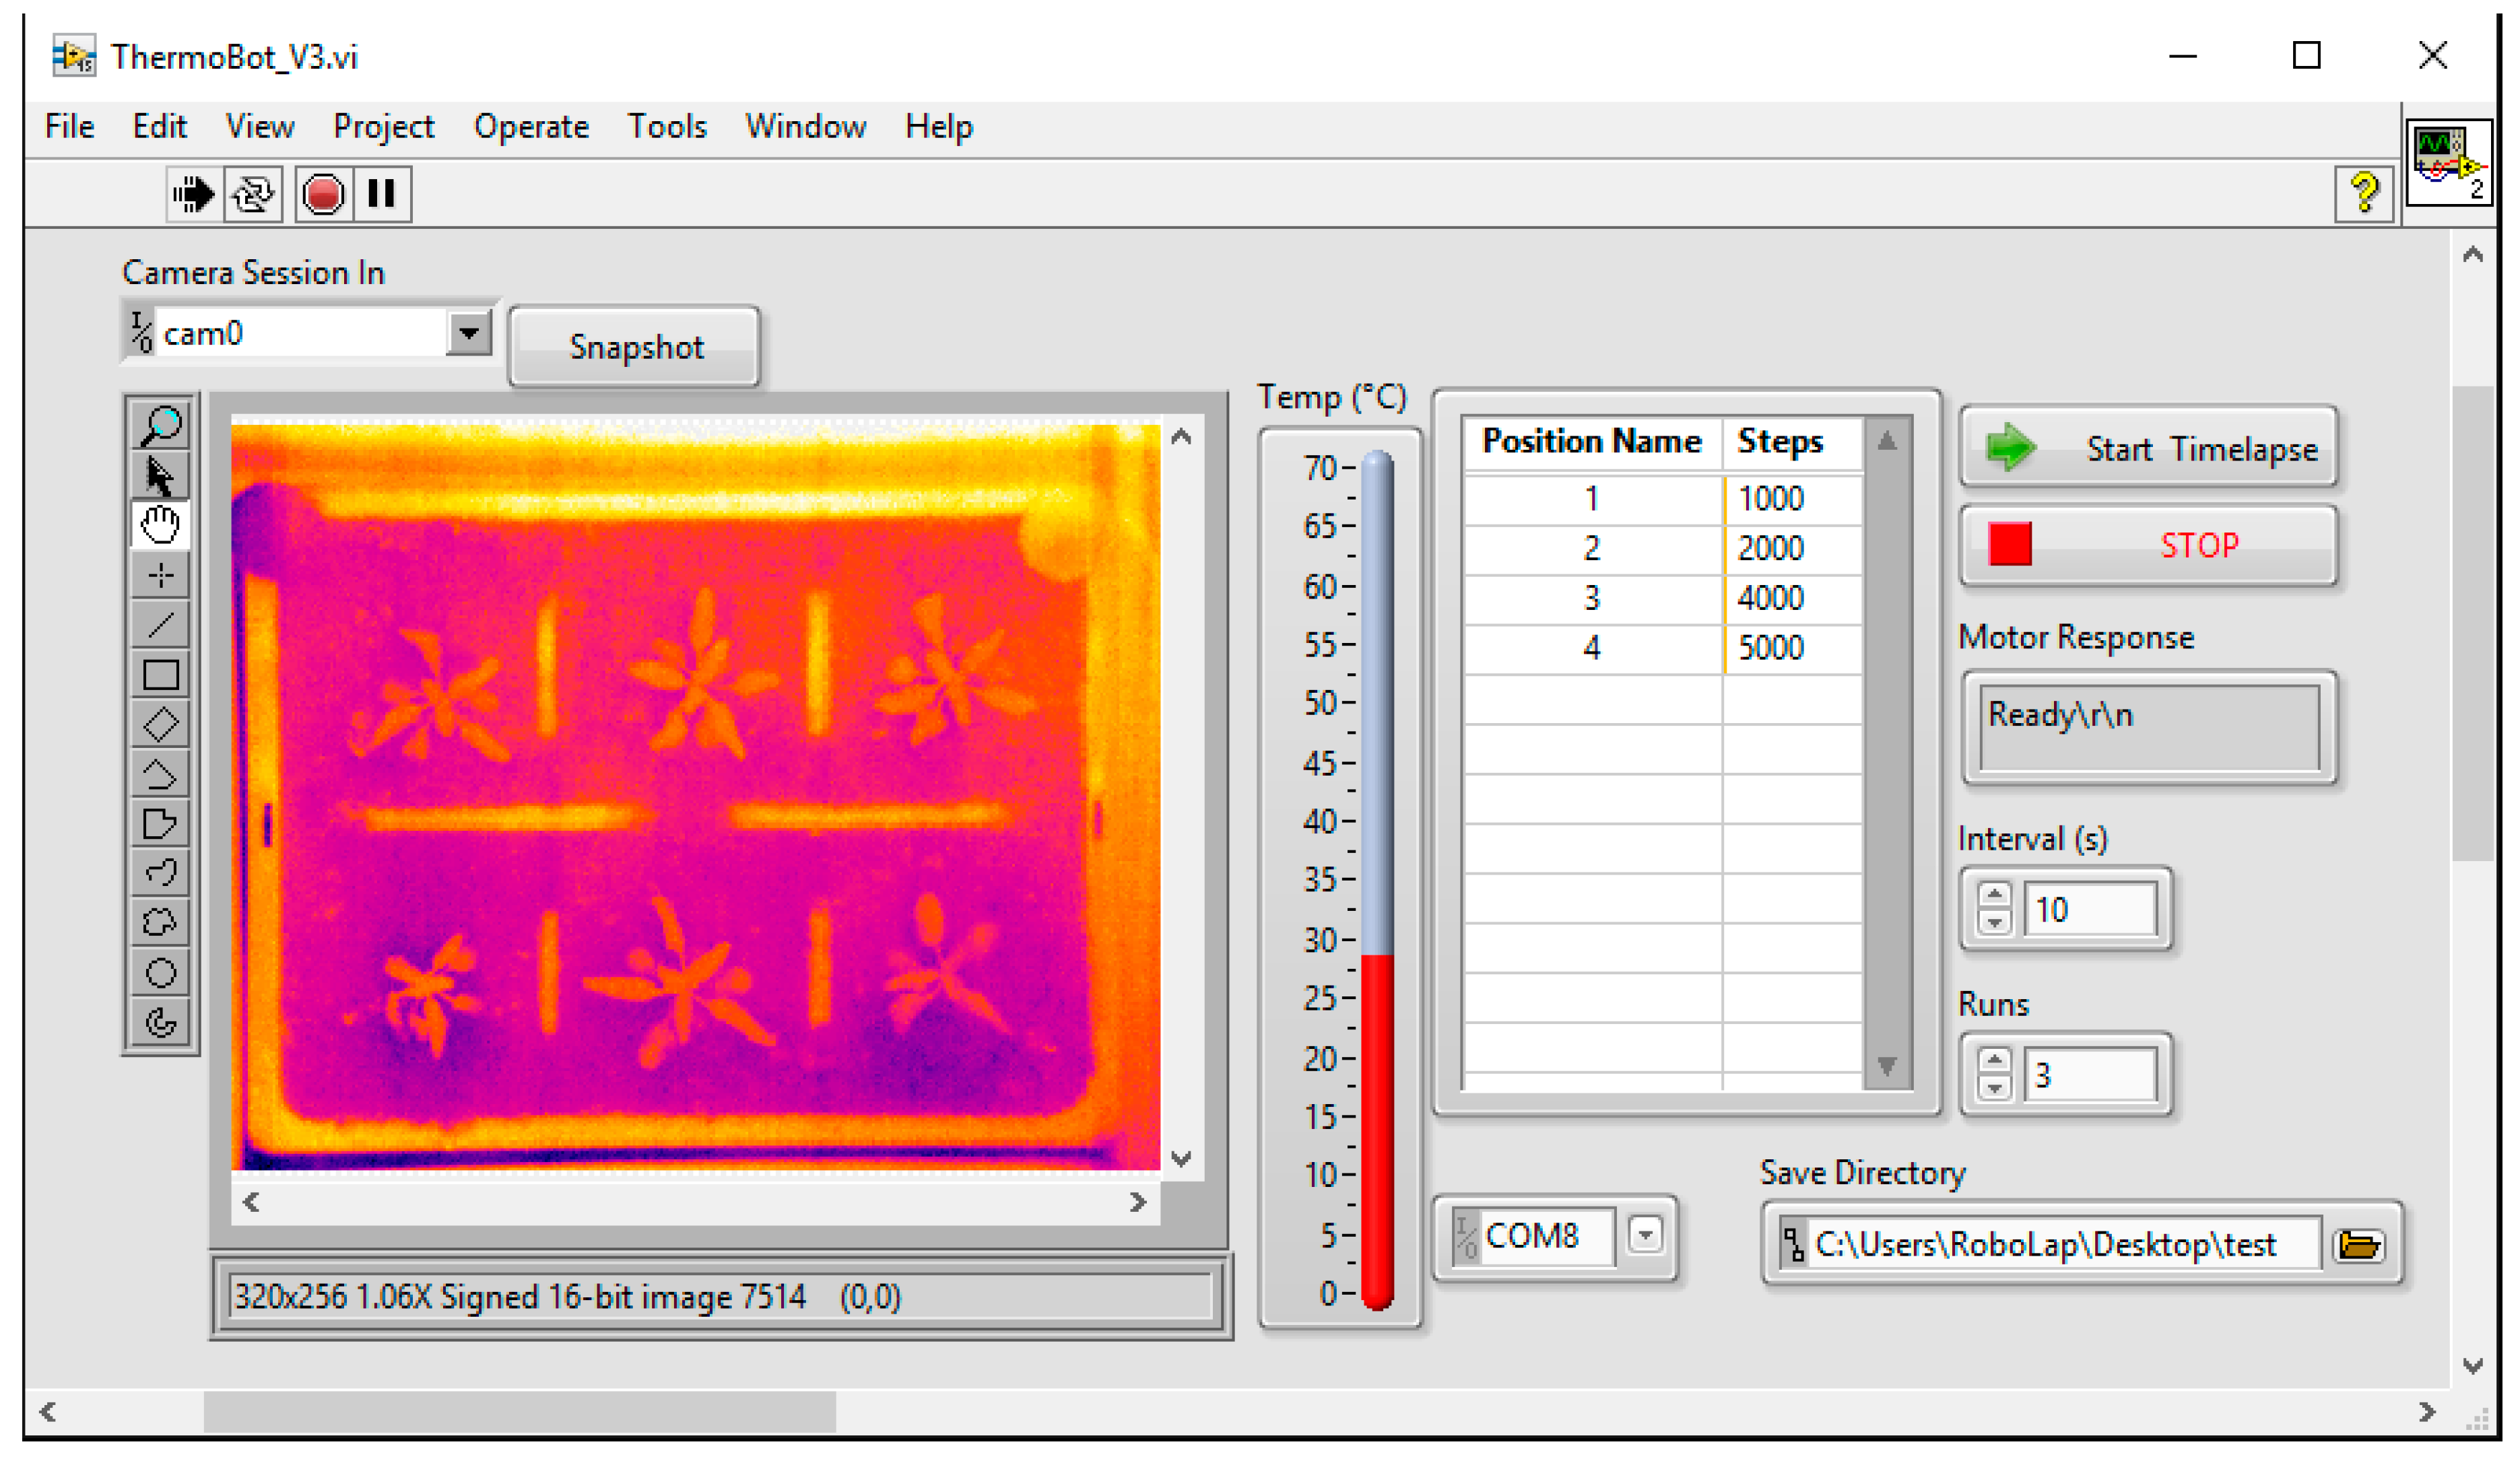
2.1.3. Software
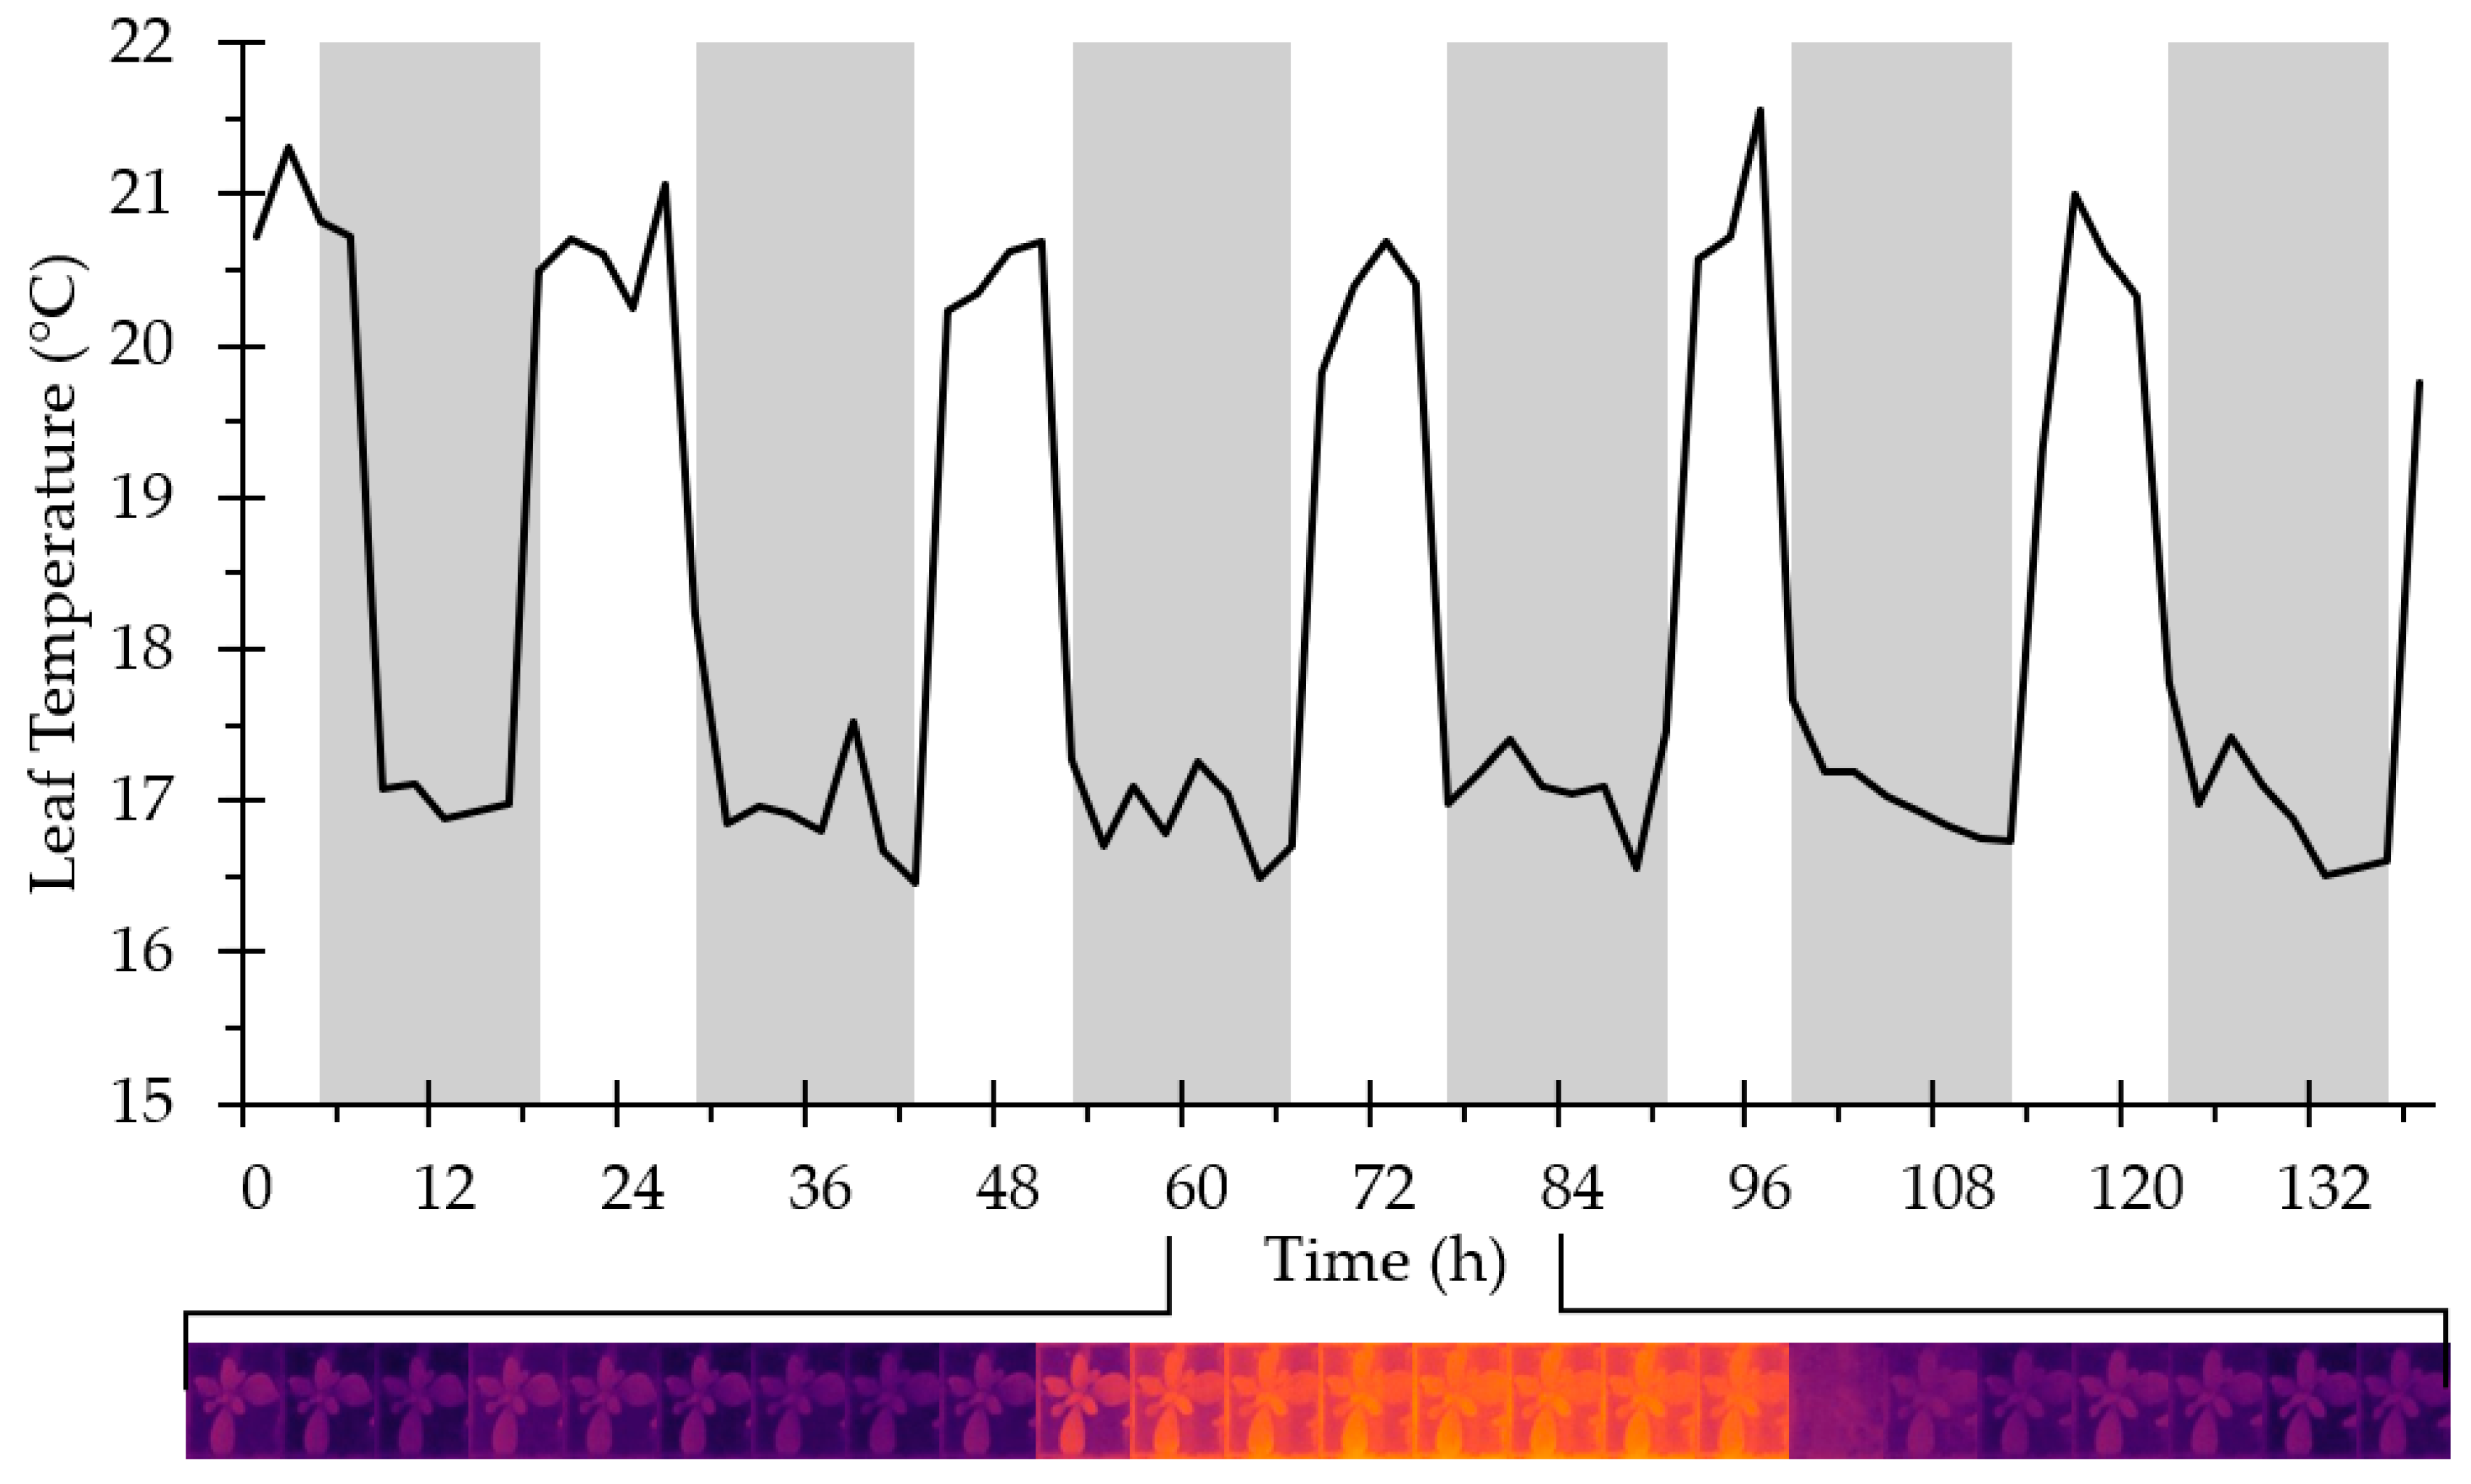
2.1.4. Performance and Results
2.2. Plate Imager
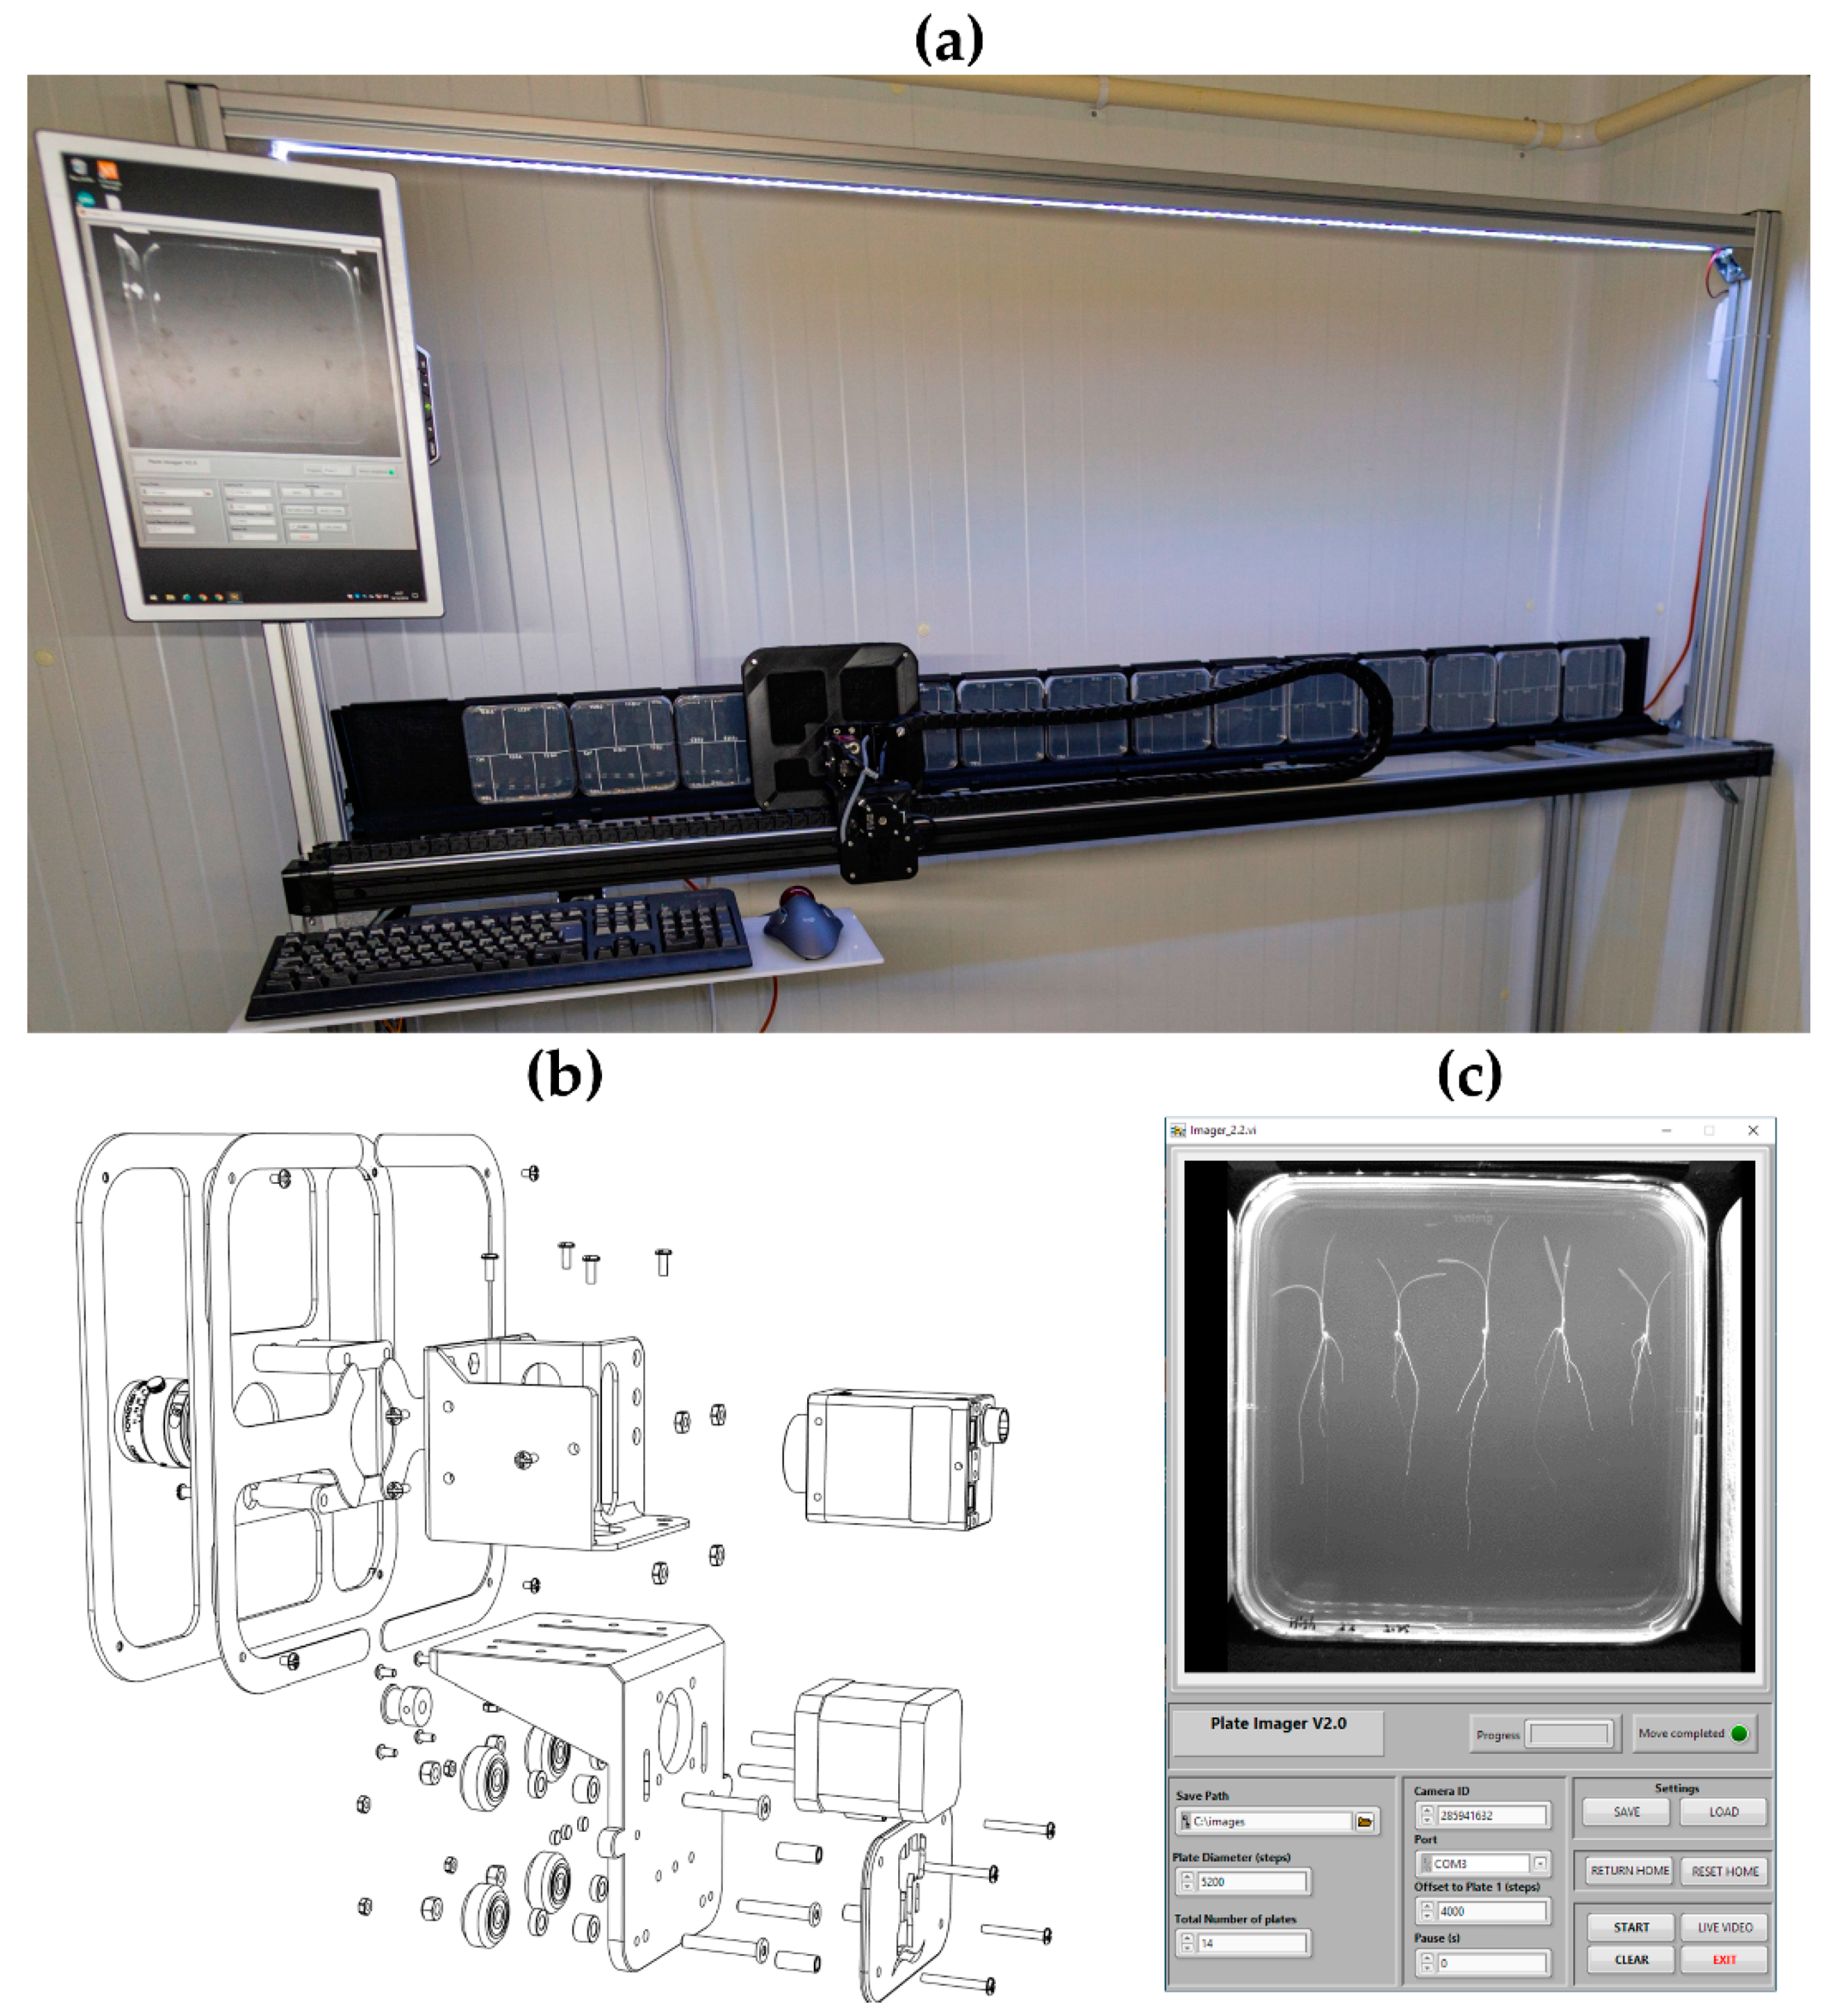
2.2.1. Mechanical Components
2.2.2. Electrical/Control Components
2.2.3. Software
2.2.4. Performance
3. IoT Environmental Sensor Logger
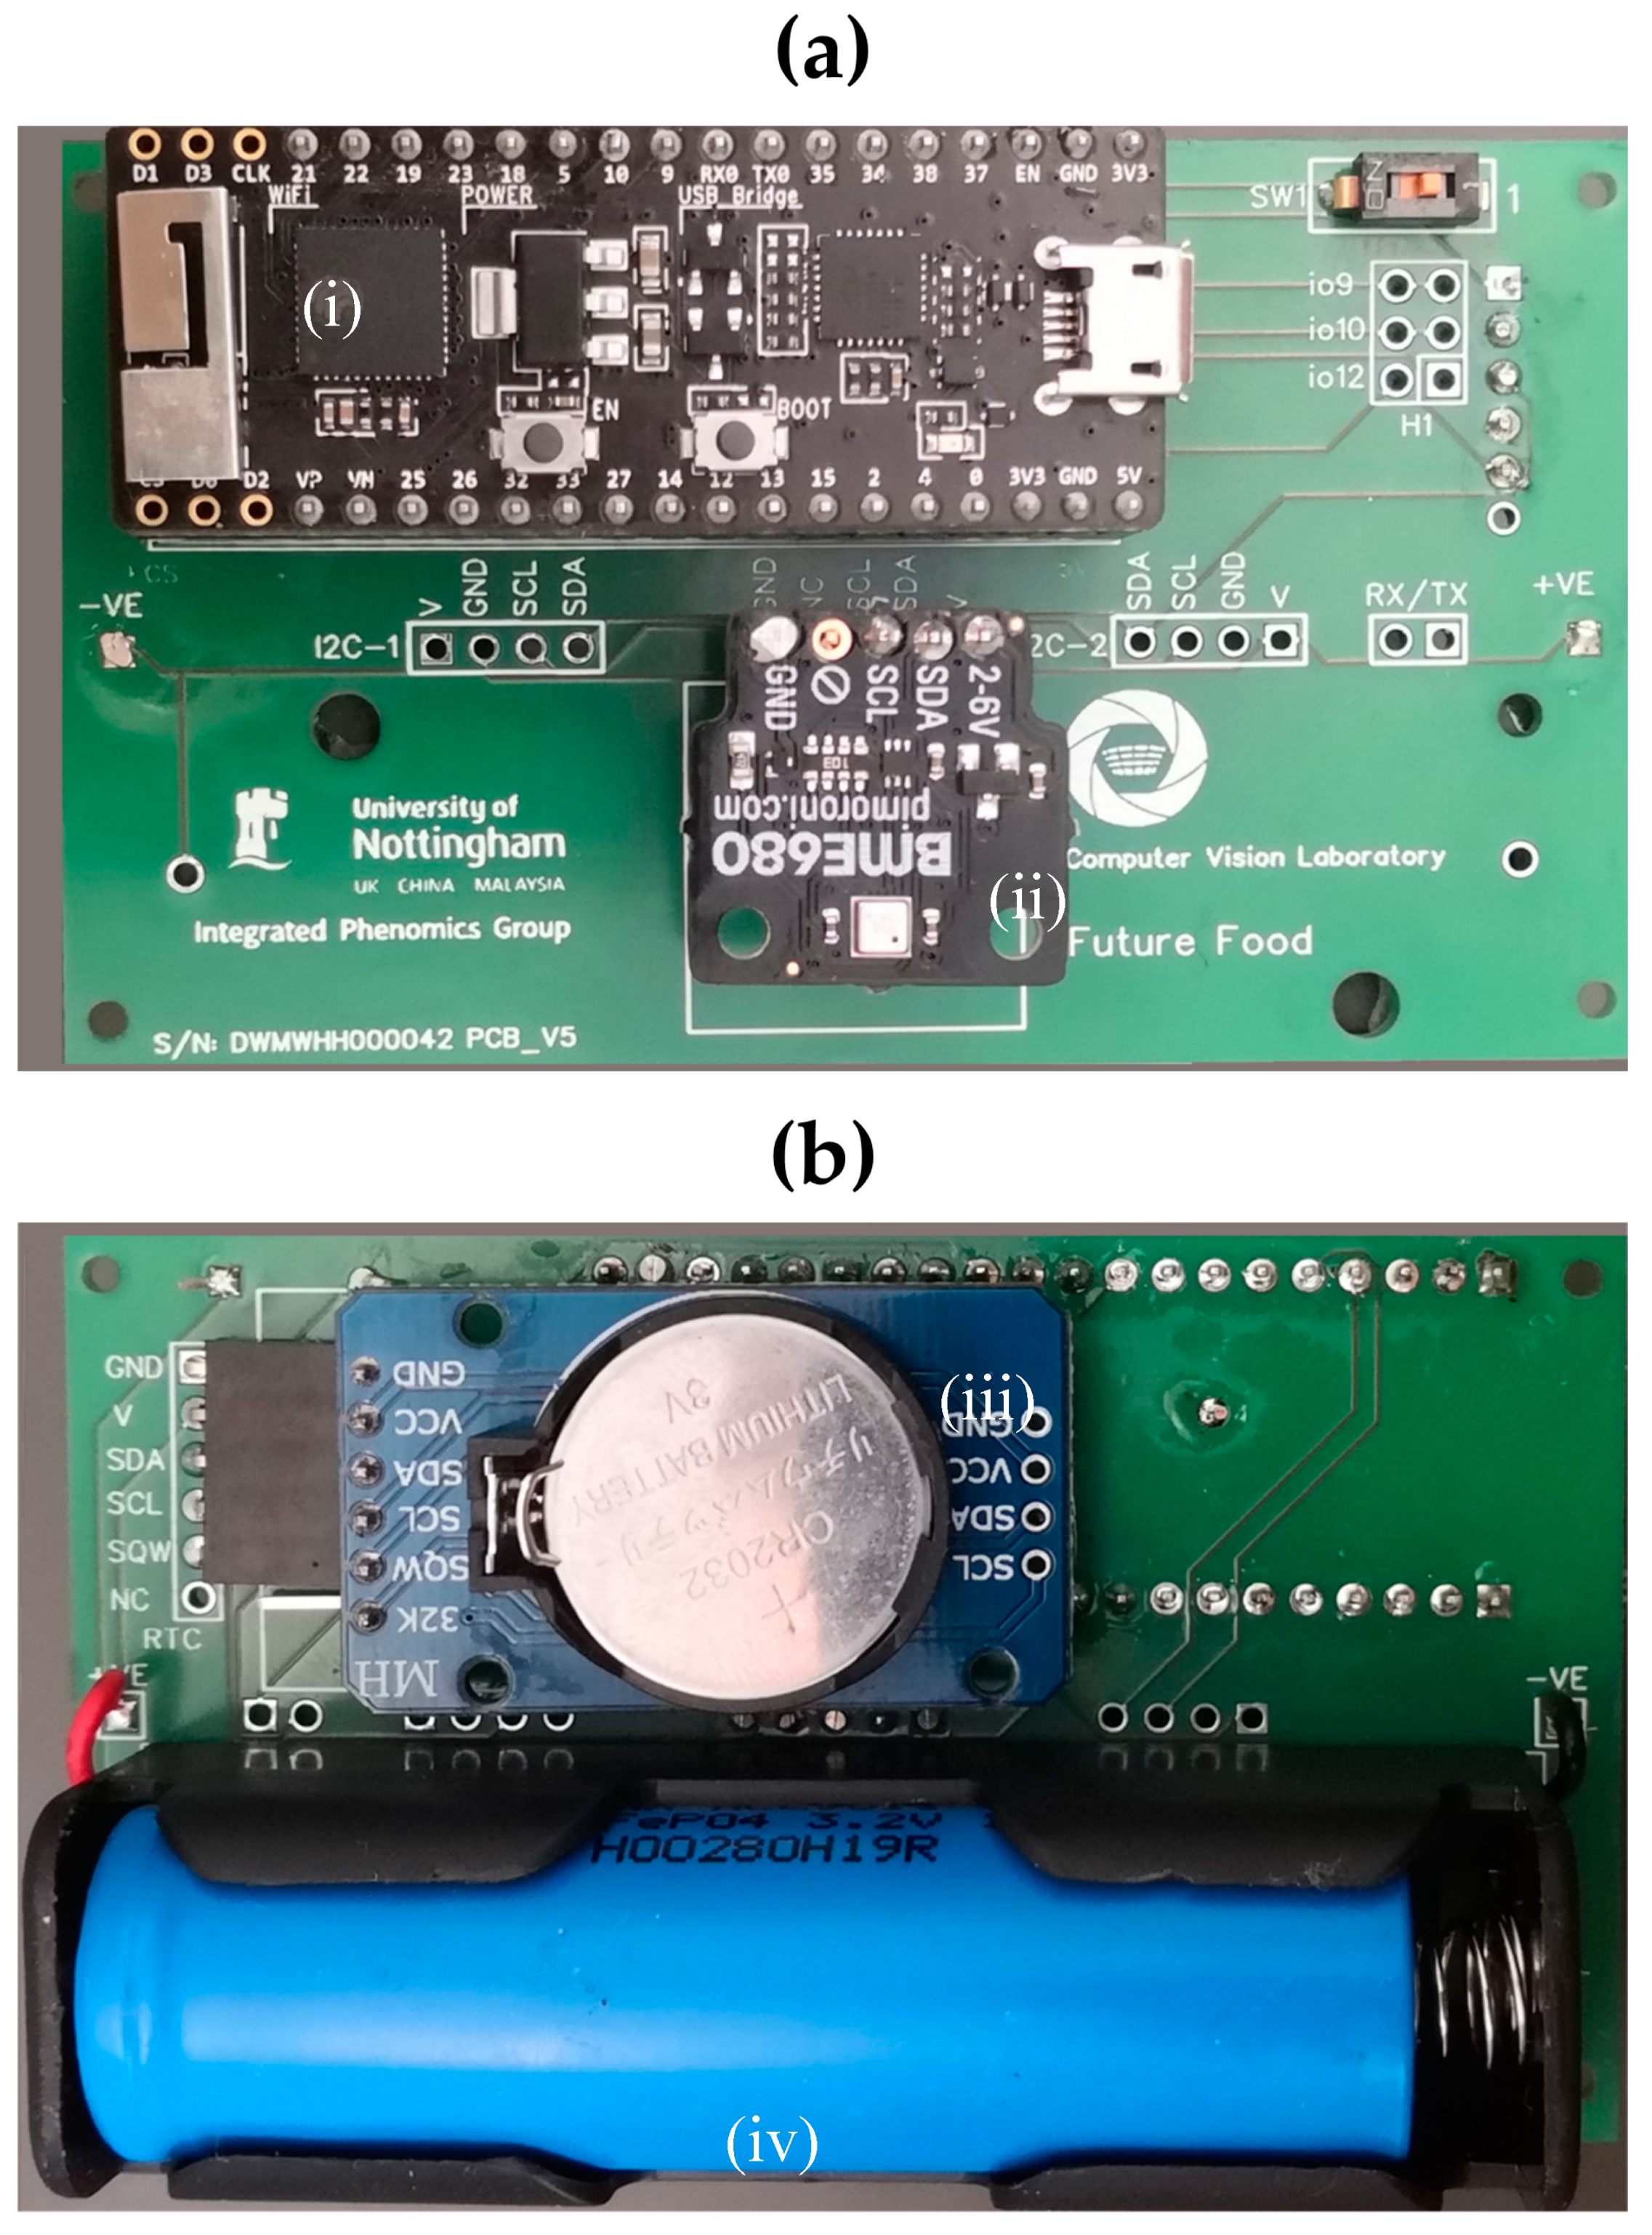
3.1. Hardware
3.2. Software
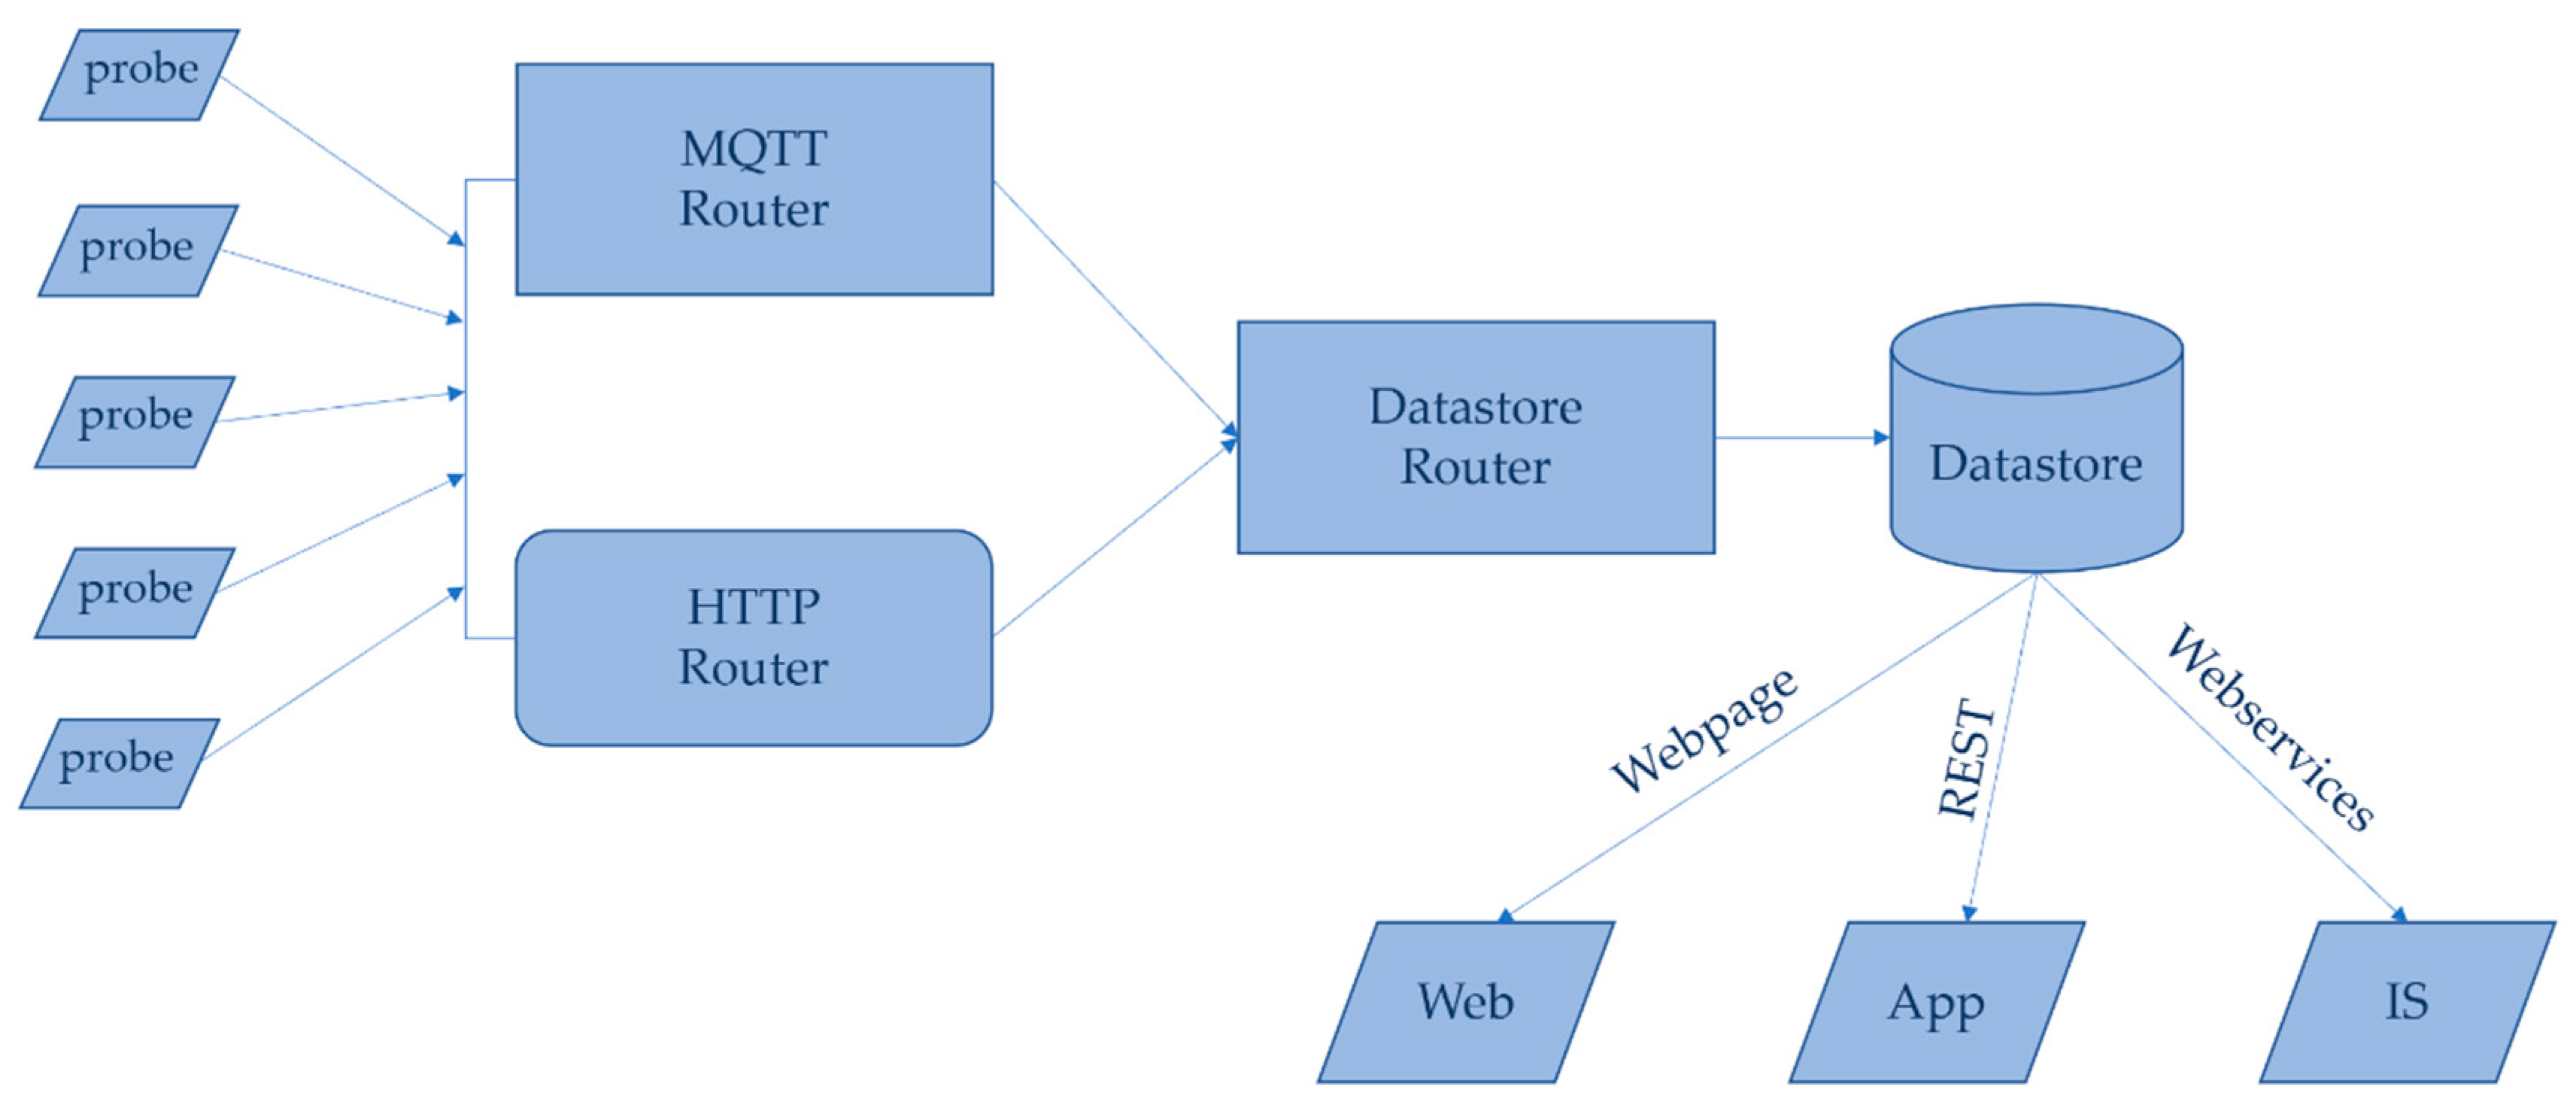
3.3. Network
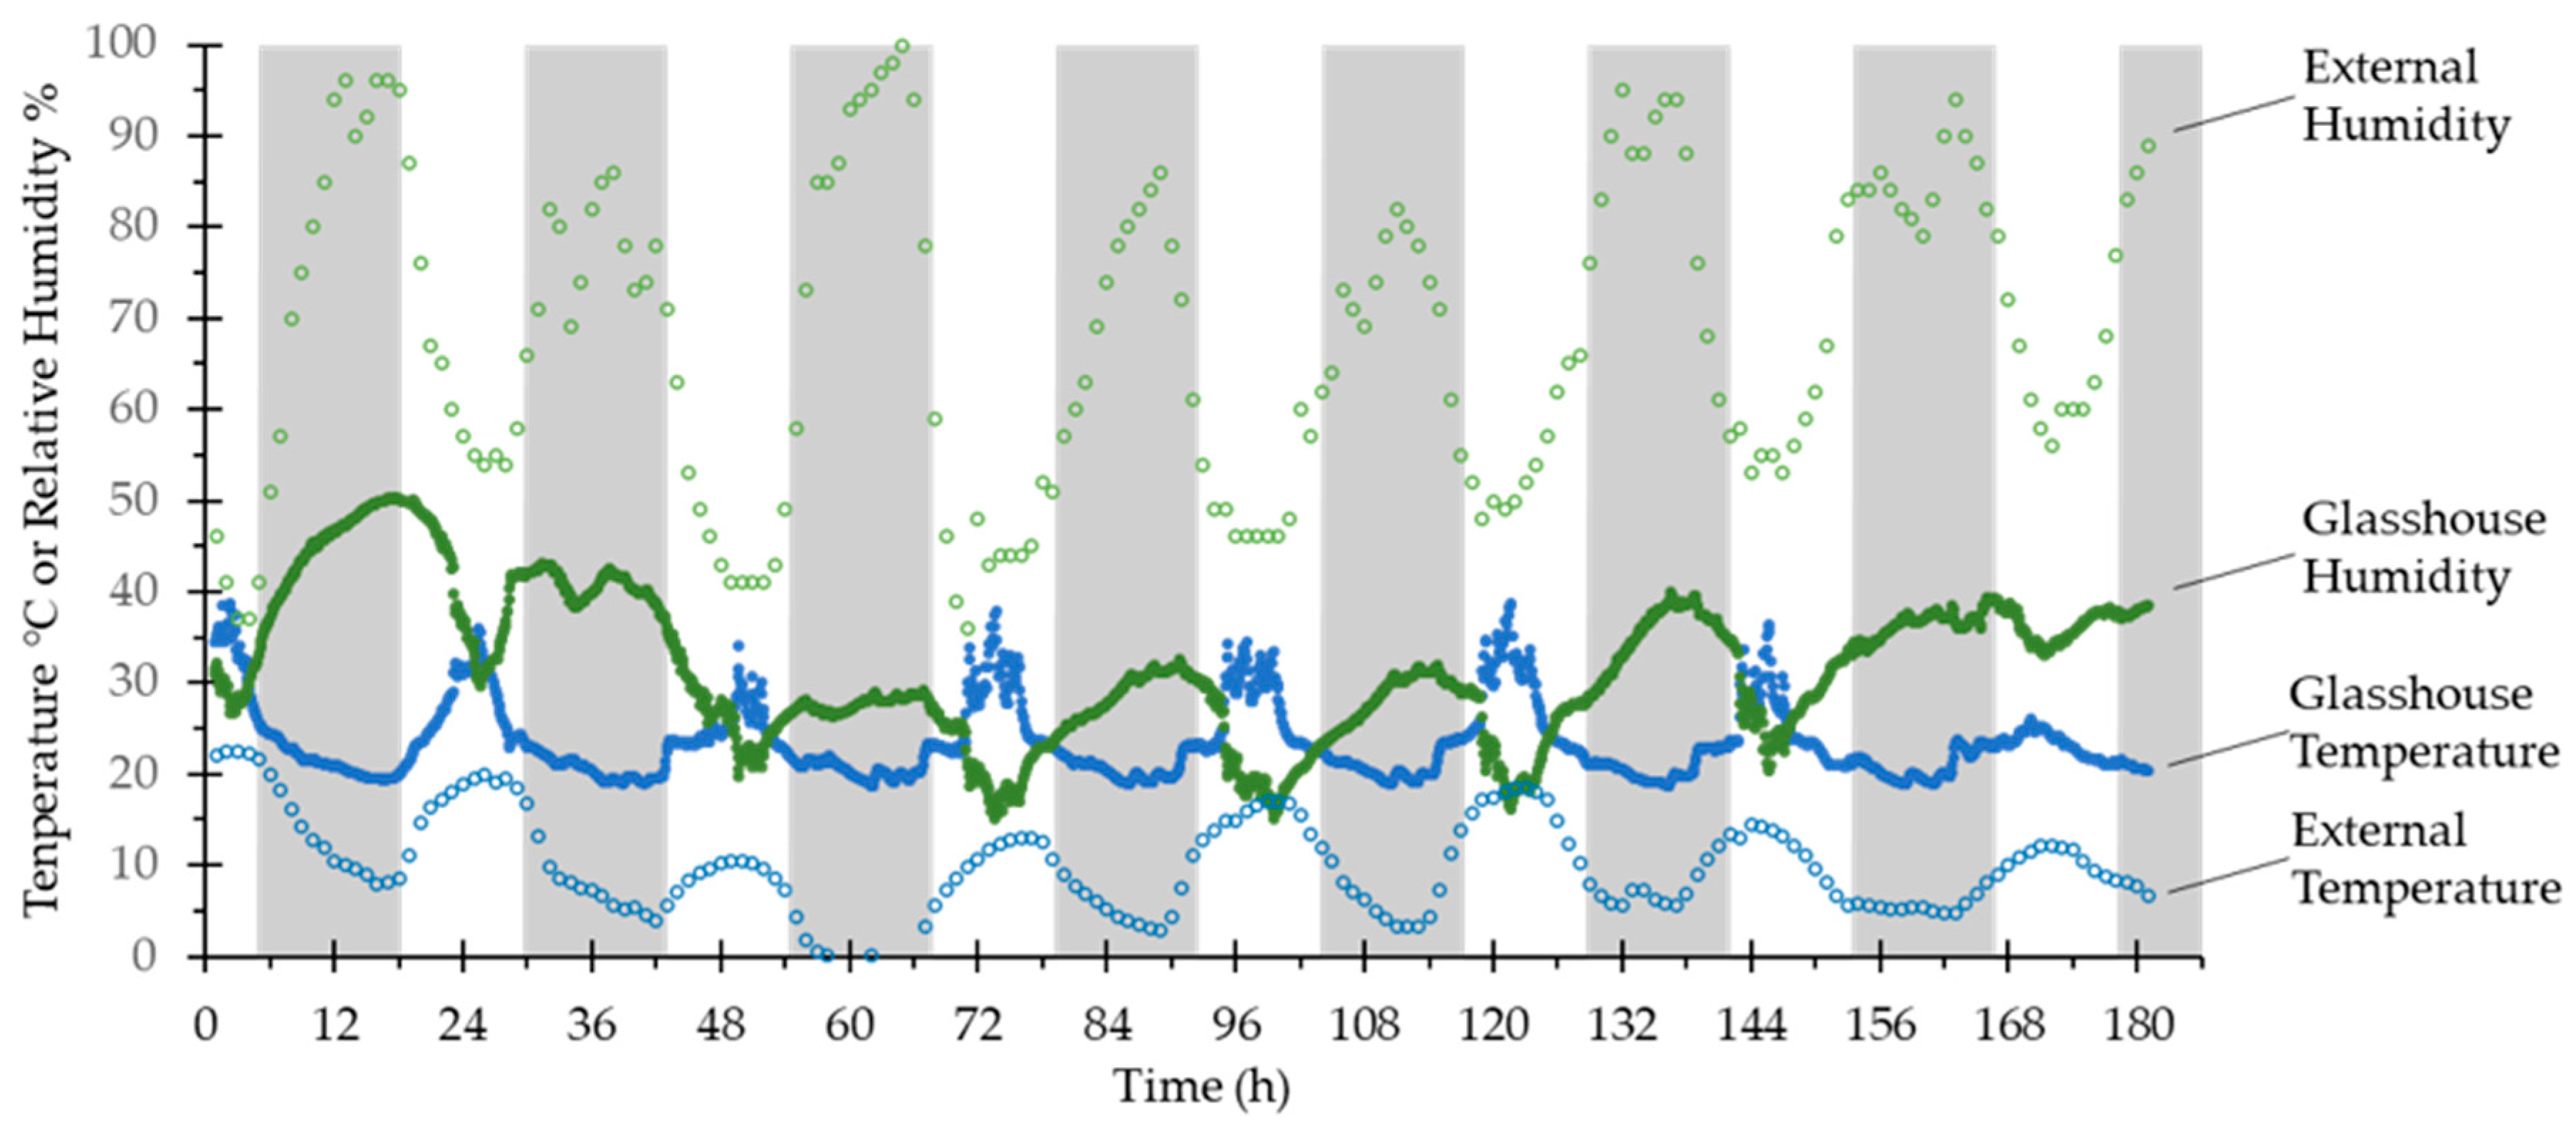
3.4. Performance
4. Discussion
Supplementary Materials
Author Contributions
Funding
Acknowledgments
Conflicts of Interest
References
- Pieruschka, R.; Poorter, H. Phenotyping plants: Genes, phenes and machines. Funct. Plant. Biol. 2012, 39, 813–820. [Google Scholar] [CrossRef] [PubMed]
- Pieruschka, R.; Schurr, U. Plant Phenotyping: Past, Present, and Future. Available online: https://spj.sciencemag.org/plantphenomics/2019/7507131/ (accessed on 28 May 2020).
- Großkinsky, D.K.; Svensgaard, J.; Christensen, S.; Roitsch, T. Plant phenomics and the need for physiological phenotyping across scales to narrow the genotype-to-phenotype knowledge gap. J. Exp. Bot. 2015, 66, 5429–5440. [Google Scholar] [CrossRef] [PubMed]
- Atkinson, J.A.; Jackson, R.J.; Bentley, A.R.; Ober, E.; Wells, D.M. Field Phenotyping for the future. In Annual Plant Reviews Online; American Cancer Society: Atlanta, GA, USA, 2018; pp. 719–736. ISBN 978-1-119-31299-4. [Google Scholar]
- Walter, A.; Liebisch, F.; Hund, A. Plant phenotyping: From bean weighing to image analysis. Plant. Methods 2015, 11, 14. [Google Scholar] [CrossRef] [PubMed]
- Reynolds, D.; Baret, F.; Welcker, C.; Bostrom, A.; Ball, J.; Cellini, F.; Lorence, A.; Chawade, A.; Khafif, M.; Noshita, K.; et al. What is cost-efficient phenotyping? Optimizing costs for different scenarios. Plant. Sci. 2019, 282, 14–22. [Google Scholar] [CrossRef]
- Minervini, M.; Giuffrida, V.; Perata, P.; Tsaftaris, S.A. Phenotiki: An open software and hardware platform for affordable and easy image-based phenotyping of rosette-shaped plants. Plant. J. 2017, 90, 204–216. [Google Scholar] [CrossRef] [PubMed]
- Fahlgren, N.; Gehan, M.A.; Baxter, I. Lights, camera, action: High-throughput plant phenotyping is ready for a close-up. Curr. Opin. Plant. Biol. 2015, 24, 93–99. [Google Scholar] [CrossRef]
- Fiorani, F.; Schurr, U. Future scenarios for plant Phenotyping. Annu. Rev. Plant. Biol. 2013, 64, 267–291. [Google Scholar] [CrossRef]
- V-SlotTM Belt & Pinion Example Build. Available online: https://openbuilds.com/builds/v-slot%E2%84%A2-belt-pinion-example-build.97/ (accessed on 19 December 2019).
- Tessmer, O.L.; Jiao, Y.; Cruz, J.A.; Kramer, D.M.; Chen, J. Functional approach to high-throughput plant growth analysis. BMC Syst. Biol. 2013, 7, S17. [Google Scholar] [CrossRef]
- Sirault, X.; James, R.; Furbank, R.T. A new screening method for osmotic component of salinity tolerance in cereals using infrared thermography. Funct. Plant. Biol. 2009, 36, 970–977. [Google Scholar] [CrossRef]
- Mahlein, A.-K.; Oerke, E.-C.; Steiner, U.; Dehne, H.-W. Recent advances in sensing plant diseases for precision crop protection. Eur. J. Plant. Pathol. 2012, 133, 197–209. [Google Scholar] [CrossRef]
- Badamasi, Y.A. The working principle of an Arduino. In Proceedings of the 2014 11th International Conference on Electronics, Computer and Computation (ICECCO), Abuja, Nigeria, 29 September–1 October 2014; pp. 1–4. [Google Scholar]
- StepStick—RepRap. Available online: https://reprap.org/wiki/StepStick (accessed on 19 December 2019).
- Arduino—Software. Available online: https://www.arduino.cc/en/main/software (accessed on 19 December 2019).
- AccelStepper: AccelStepper Library for Arduino. Available online: https://www.airspayce.com/mikem/arduino/AccelStepper/index.html (accessed on 19 December 2019).
- Travis, J.; Kring, J. LabVIEW for Everyone: Graphical Programming Made Easy and Fun; Prentice Hall: Upper Saddle River, NJ, USA, 2007; ISBN 978-0-13-185672-1. [Google Scholar]
- Schindelin, J.; Rueden, C.T.; Hiner, M.C.; Eliceiri, K.W. The ImageJ ecosystem: An open platform for biomedical image analysis. Mol. Reprod. Dev. 2015, 82, 518–529. [Google Scholar] [CrossRef]
- Schindelin, J.; Arganda-Carreras, I.; Frise, E.; Kaynig, V.; Longair, M.; Pietzsch, T.; Preibisch, S.; Rueden, C.; Saalfeld, S.; Schmid, B.; et al. Fiji: An open-source platform for biological-image analysis. Nat. Methods 2012, 9, 676–682. [Google Scholar] [CrossRef]
- French, A.P.; Wells, D.M.; Everitt, N.M.; Pridmore, T.P. High-throughput quantification of root growth. In Measuring Roots: An Updated Approach; Springer: Berlin/Heidelberg, Germany, 2012; pp. 109–126. ISBN 978-3-642-22066-1. [Google Scholar]
- Naeem, A.; French, A.P.; Wells, D.M.; Pridmore, T.P. High-throughput feature counting and measurement of roots. Bioinformatics 2011, 27, 1337–1338. [Google Scholar] [CrossRef] [PubMed]
- Pound, M.P.; French, A.P.; Atkinson, J.A.; Wells, D.M.; Bennett, M.J.; Pridmore, T.P. RootNav: Navigating images of complex root architectures. Plant. Physiol. 2013, 162, 1802–1814. [Google Scholar] [CrossRef]
- Yasrab, R.; Atkinson, J.A.; Wells, D.M.; French, A.P.; Pridmore, T.P.; Pound, M.P. RootNav 2.0: Deep learning for automatic navigation of complex plant root architectures. GigaScience 2019, 8, 8. [Google Scholar] [CrossRef]
- Niggl, L. TeensyStep. Available online: https://luni64.github.io/TeensyStep/ (accessed on 20 December 2019).
- Wells, D.M.; French, A.P.; Naeem, A.; Ishaq, O.; Traini, R.; Hijazi, H.; Bennett, M.J.; Pridmore, T.P. Recovering the dynamics of root growth and development using novel image acquisition and analysis methods. Philos. Trans. R. Soc. B Biol. Sci. 2012, 367, 1517–1524. [Google Scholar] [CrossRef]
- Haase, J.; Alahmad, M.; Nishi, H.; Ploennigs, J.; Tsang, K.-F. The IOT mediated built environment: A brief survey. In Proceedings of the 2016 IEEE 14th International Conference on Industrial Informatics (INDIN), Poitiers, France, 18–21 July 2016; pp. 1065–1068. [Google Scholar]
- Tzounis, A.; Katsoulas, N.; Bartzanas, T.; Kittas, C. Internet of things in agriculture, recent advances and future challenges. Biosyst. Eng. 2017, 164, 31–48. [Google Scholar] [CrossRef]
- Stankovic, J.A. Research directions for the internet of things. IEEE Internet Things J. 2014, 1, 3–9. [Google Scholar] [CrossRef]
- Maier, A.; Sharp, A.; Vagapov, Y. Comparative analysis and practical implementation of the ESP32 microcontroller module for the internet of things. Internet Technol. Appl. 2017, 143–148. [Google Scholar] [CrossRef]
- BME680. Available online: https://www.bosch-sensortec.com/products/environmental-sensors/gas-sensors-bme680/ (accessed on 7 May 2020).
- BME280. Available online: https://www.bosch-sensortec.com/products/environmental-sensors/humidity-sensors-bme280/ (accessed on 2 June 2020).
- Temperature and Humidity Wireless Data Logger. Available online: https://www.omega.co.uk/pptst/om-el-wifi_series.html (accessed on 2 June 2020).
- Neveu, P.; Tireau, A.; Hilgert, N.; Nègre, V.; Mineau-Cesari, J.; Brichet, N.; Chapuis, R.; Sanchez, I.; Pommier, C.; Charnomordic, B.; et al. Dealing with multi-source and multi-scale information in plant phenomics: The ontology-driven Phenotyping Hybrid Information System. New Phytol. 2018, 221, 588–601. [Google Scholar] [CrossRef] [PubMed]
- Coppens, F.; Wuyts, N.; Inzé, D.; Dhondt, S. Unlocking the potential of plant phenotyping data through integration and data-driven approaches. Curr. Opin. Syst. Biol. 2017, 4, 58–63. [Google Scholar] [CrossRef]
- Ferdoush, S.; Li, X. Wireless sensor network system design using raspberry Pi and arduino for environmental monitoring applications. Procedia Comput. Sci. 2014, 34, 103–110. [Google Scholar] [CrossRef]


| Component | Specifications | Model/Filename | Manufacturer |
|---|---|---|---|
| Thermal Imager | |||
| Stepper motor | Bipolar, 1.8° step angle, 1.68 A/phase | MT-1704HS168A | Motec |
| Microcontroller | 16 MHz ATmega328P | Arduino Uno R3 | Arduino |
| Driver carrier | Arduino shield for removable drivers | CNC Shield V3 | Various |
| Stepper driver | Max 32 microsteps, 2.5 A, 12−40 V | DRV8825 | Texas Instruments |
| Drive belt | 7 mm width; 2 mm pitch | GT2-2M | OpenBuilds |
| Timing pulley | 20 teeth; 2 mm pitch | GT2-2M | OpenBuilds |
| Carriage rail | V-slot profile | 40 × 20 | OpenBuilds |
| Carriage wheels | 15.2 mm outside diameter (OD), Delrin | Mini V Wheel | OpenBuilds |
| Carriage plate | 3D printed | therm_cm.stl 1, therm_cps.stl | UoN 2 |
| Sensor holder | 3D printed | therm_s_flir.stl | UoN |
| Electronics box | 3D printed | therm_case.stl | UoN |
| Limit switches | Hall-effect sensor, unipolar, 4.5−24 V | MP101402 | Cherry |
| Sensor | Thermal camera 19 mm lens, 24° field of view | A35 (60 Hz) | FLIR |
| Plate Imager | |||
| Stepper motor | Bipolar, 1.8° step angle, 1.68 A/phase | MT-1704HS168A | Motec |
| Microcontroller | 72 MHz Cortex-M4 | Teensy 3.2 | PJRC |
| Stepper driver | Max 32 microsteps, 3.5 A, 8–45 V | TB6600 | Toshiba |
| Drive belt | 7 mm width; 2 mm pitch | GT2-2M | OpenBuilds |
| Timing pulley | 20 teeth; 2 mm pitch | GT2-2M | Openbuilds |
| Carriage rail | V-slot profile | 40 × 20 | OpenBuilds |
| Carriage wheels | 15.2 OD, Delrin | Mini V Wheel | OpenBuilds |
| Carriage plate | 3D printed | plate_carriage.stl 3 | UoN |
| Sensor holder | 3D printed | plate_sm.stl | UoN |
| Light baffle | 3D printed | plate_baffle(1−3).stl | UoN |
| Electronics box | 3D printed | plate_case(1−3).stl | UoN |
| Limit switches | Hall-effect sensor, omnipolar, 2.5−5 V | AH180 | Diodes Inc. |
| Sensor | FireWire camera, 8 mm lens | Stingray | AVT |
| Specification | Thermal Imager | CPIB Imaging Robot [21] | Commercial Actuator 1 |
|---|---|---|---|
| Drive | Belt and pinion | Toothed belt | Toothed belt |
| Travel | 1.2 m | 1.8 m | 1.2 m |
| Step size | 200 µm | 300 µm | 600 µm |
| Microstep size (minimum) | 6.25 µm (32 microsteps) | 300 µm (n/a) | 9.4 µm (64 microsteps) |
| Maximum speed | 125 mm/s | 30 mm/s | 5 m/s |
| Repeatability | ~5 µm | 0.5 mm | 200 µm |
| Temporal resolution | ~40 s/run | ~2 min/run | ~8 s/run |
| Cost 2 | €235 | €1060 | €3475 |
| Specification | Plate Imager | CPIB Imaging Platform [26] | Commercial Actuator 1 |
|---|---|---|---|
| Drive | Belt and pinion | Leadscrew | Toothed belt |
| Travel | 1.5 m | 1.5 m | 1.495 m |
| Step size | 200 µm | 31.75 µm | 270 µm |
| Microstep size (minimum) | 6.25 µm (32 microsteps) | 0.5µm (64 microsteps) | 4.2 µm (64 microsteps) |
| Maximum speed | 300 mm/s | 60 mm/s | 2000 mm/s |
| Repeatability | ~5 µm | <2 µm | <20 µm |
| Temporal resolution | 68 s/run | ~5 mins/run | ~20 s/run |
| Cost 2 | €780 | €4560 | €2904 |
| Specification | BME680 | BME280 [32] | TinyTag Ultra 2 | WiFi Logger 1 [33] |
|---|---|---|---|---|
| Humidity range | 0–100% rh | 20−80% rh | 0 to 95% rh | 0–100% rh |
| Humidity accuracy | ±3% rh | ±3% rh | ±3% rh | ±4.0% rh |
| Humidity response time | 8 s | 1 s | ~10 s | n/a |
| Temperature range | −40 to 85 °C | −40 to 85 °C | −25 to +85 °C | −20 to 60 °C |
| Temperature accuracy (25 °C) | ±0.5 °C | ±0.5 °C | ±0.4 °C | ±0.8 °C |
| Minimum time between readings | 102 s | 1 s | 10 s | |
| Maximum readings | 250,000 3 | 32,000 | 500,000 | |
| Battery life | 1 month 4 | 1 year | 1 year | |
| Online reporting | yes | no | yes | |
| Cost | €19 | €11 | €135 | €133 |
© 2020 by the authors. Licensee MDPI, Basel, Switzerland. This article is an open access article distributed under the terms and conditions of the Creative Commons Attribution (CC BY) license (http://creativecommons.org/licenses/by/4.0/).
Share and Cite
Bagley, S.A.; Atkinson, J.A.; Hunt, H.; Wilson, M.H.; Pridmore, T.P.; Wells, D.M. Low-Cost Automated Vectors and Modular Environmental Sensors for Plant Phenotyping. Sensors 2020, 20, 3319. https://doi.org/10.3390/s20113319
Bagley SA, Atkinson JA, Hunt H, Wilson MH, Pridmore TP, Wells DM. Low-Cost Automated Vectors and Modular Environmental Sensors for Plant Phenotyping. Sensors. 2020; 20(11):3319. https://doi.org/10.3390/s20113319
Chicago/Turabian StyleBagley, Stuart A., Jonathan A. Atkinson, Henry Hunt, Michael H. Wilson, Tony P. Pridmore, and Darren M. Wells. 2020. "Low-Cost Automated Vectors and Modular Environmental Sensors for Plant Phenotyping" Sensors 20, no. 11: 3319. https://doi.org/10.3390/s20113319
APA StyleBagley, S. A., Atkinson, J. A., Hunt, H., Wilson, M. H., Pridmore, T. P., & Wells, D. M. (2020). Low-Cost Automated Vectors and Modular Environmental Sensors for Plant Phenotyping. Sensors, 20(11), 3319. https://doi.org/10.3390/s20113319