Estimation of Heart Rate and Respiratory Rate from PPG Signal Using Complementary Ensemble Empirical Mode Decomposition with both Independent Component Analysis and Non-Negative Matrix Factorization


Abstract
1. Introduction
2. Proposed Methods
2.1. Reviews on the Existing Methods
2.1.1. Complementary Ensemble Empirical Mode Decomposition
- Step 1
- Let N be the total number of the white noises. Denote a set of positive valued white noise sequences as and the corresponding negative valued white noise sequences as for i = 1, 2, …, N. Let be the original signal. Let a be the gain multiplied to the white noises. Add and to for i = 1, 2, …, N. Denote the sequences corrupted by and as and for i = 1, 2, …, N, respectively. That is:and
- Step 2
- Decompose both and using the empirical mode decomposition. Let and be the intrinsic mode function of and , respectively.
- Step 3
- Let be the intrinsic mode function of the reconstructed signal. Here, is reconstructed by averaging and together. That is:
- Step 4
- Let p be the total number of the intrinsic mode functions used for the reconstruction. Let be the residue based on the reconstruction of the signal using these p intrinsic mode functions. That is:
2.1.2. Independent Component Analysis
2.1.3. Non-Negative Matrix Factorization
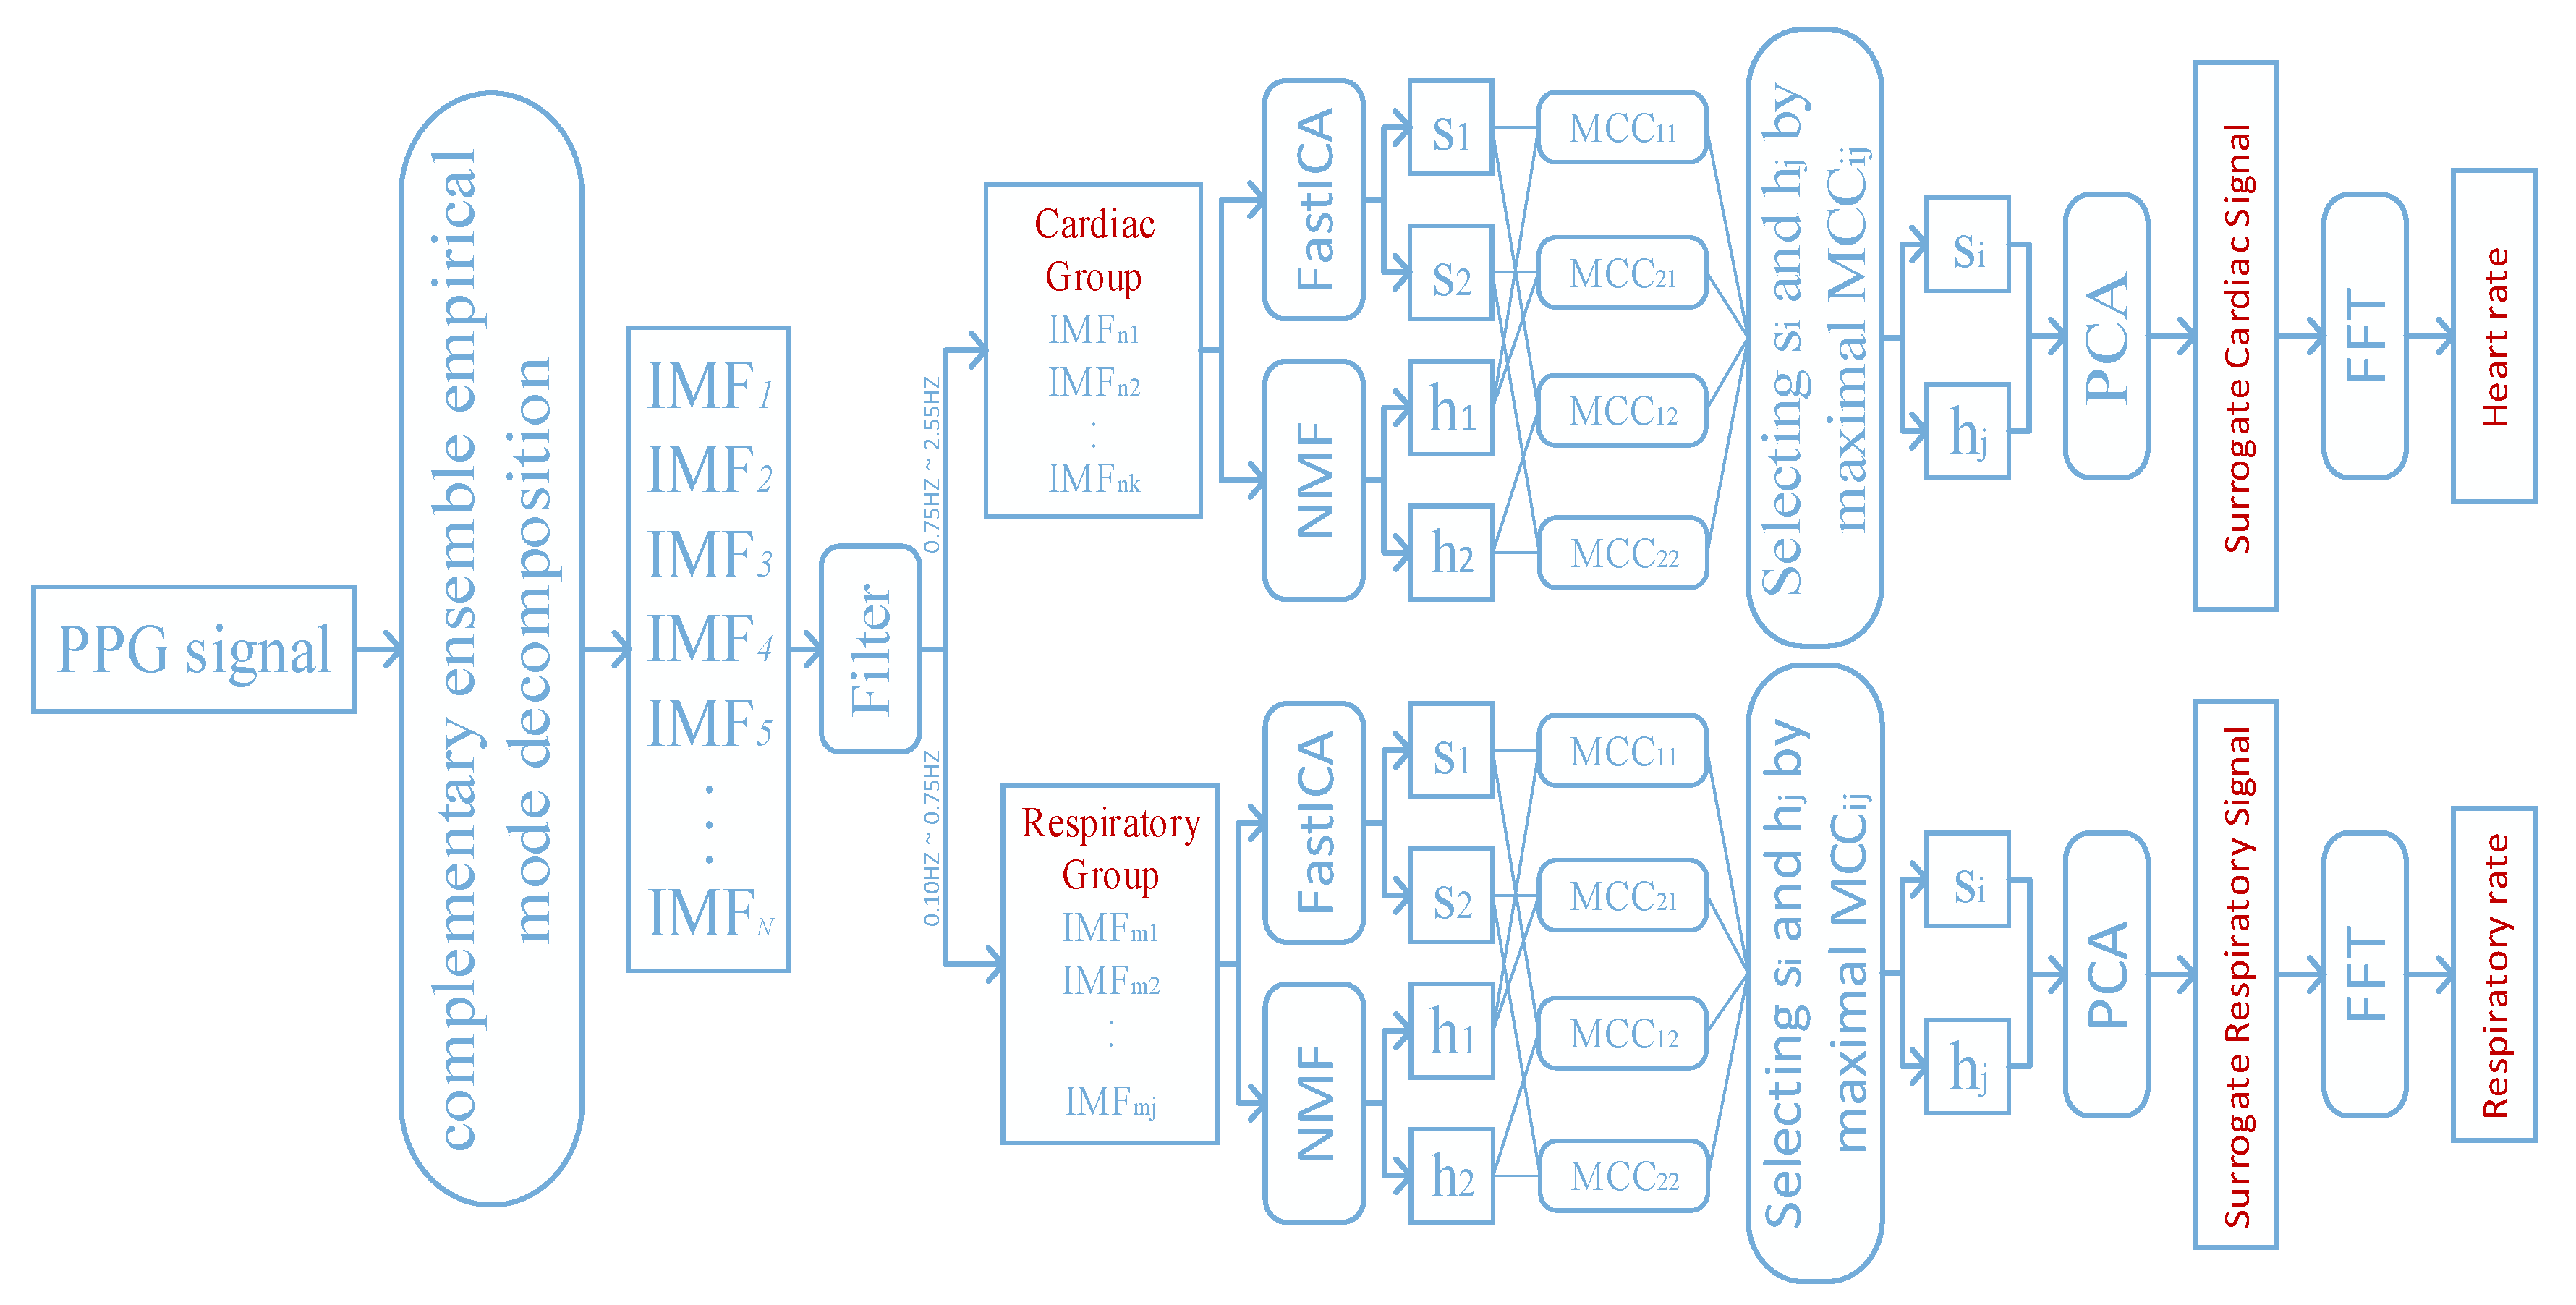
2.2. Our Proposed Framework for Extracting the Cardiorespiratory Activity from the PPG Signal
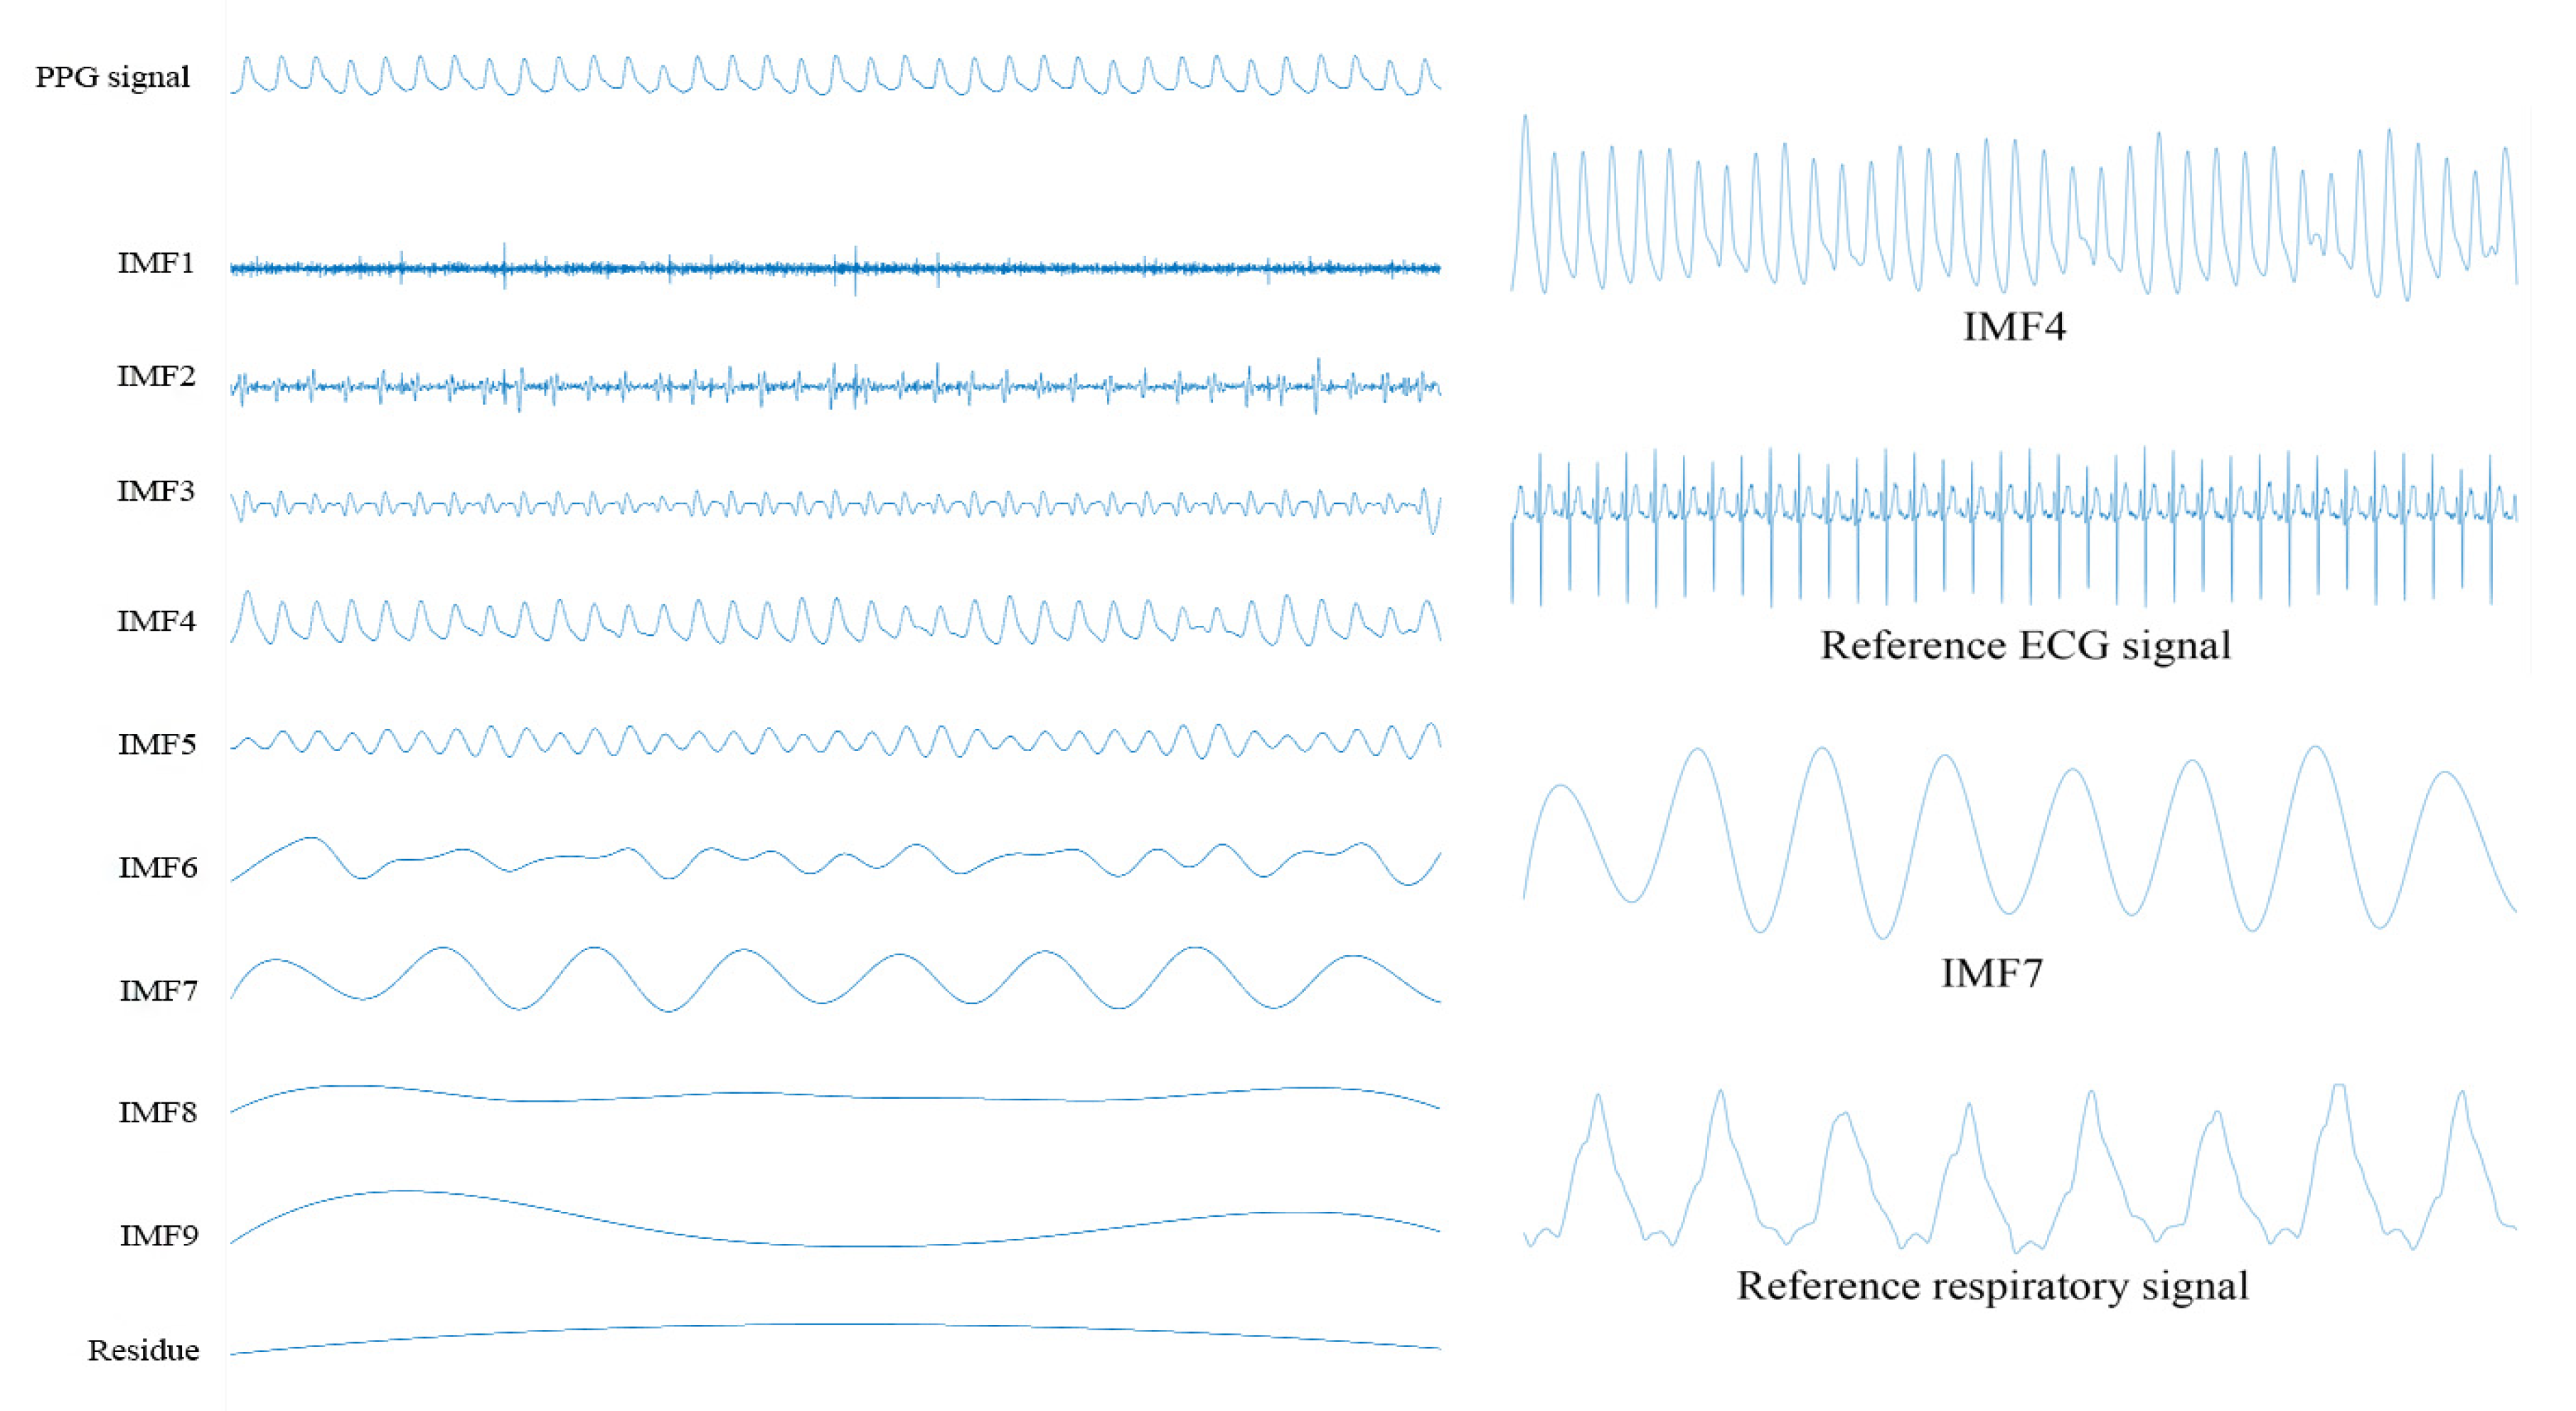
2.2.1. Decomposition of the PPG Signal Using the Complementary Ensemble Empirical Mode Decomposition
2.2.2. Filtering on the Intrinsic Mode Functions
2.2.3. Performing both the Independent Component Analysis and the Non-Negative Matrix Factorization on the Intrinsic Mode Functions
2.2.4. Performing the Principal Component Analysis on the Selected Pairs of Source Signals
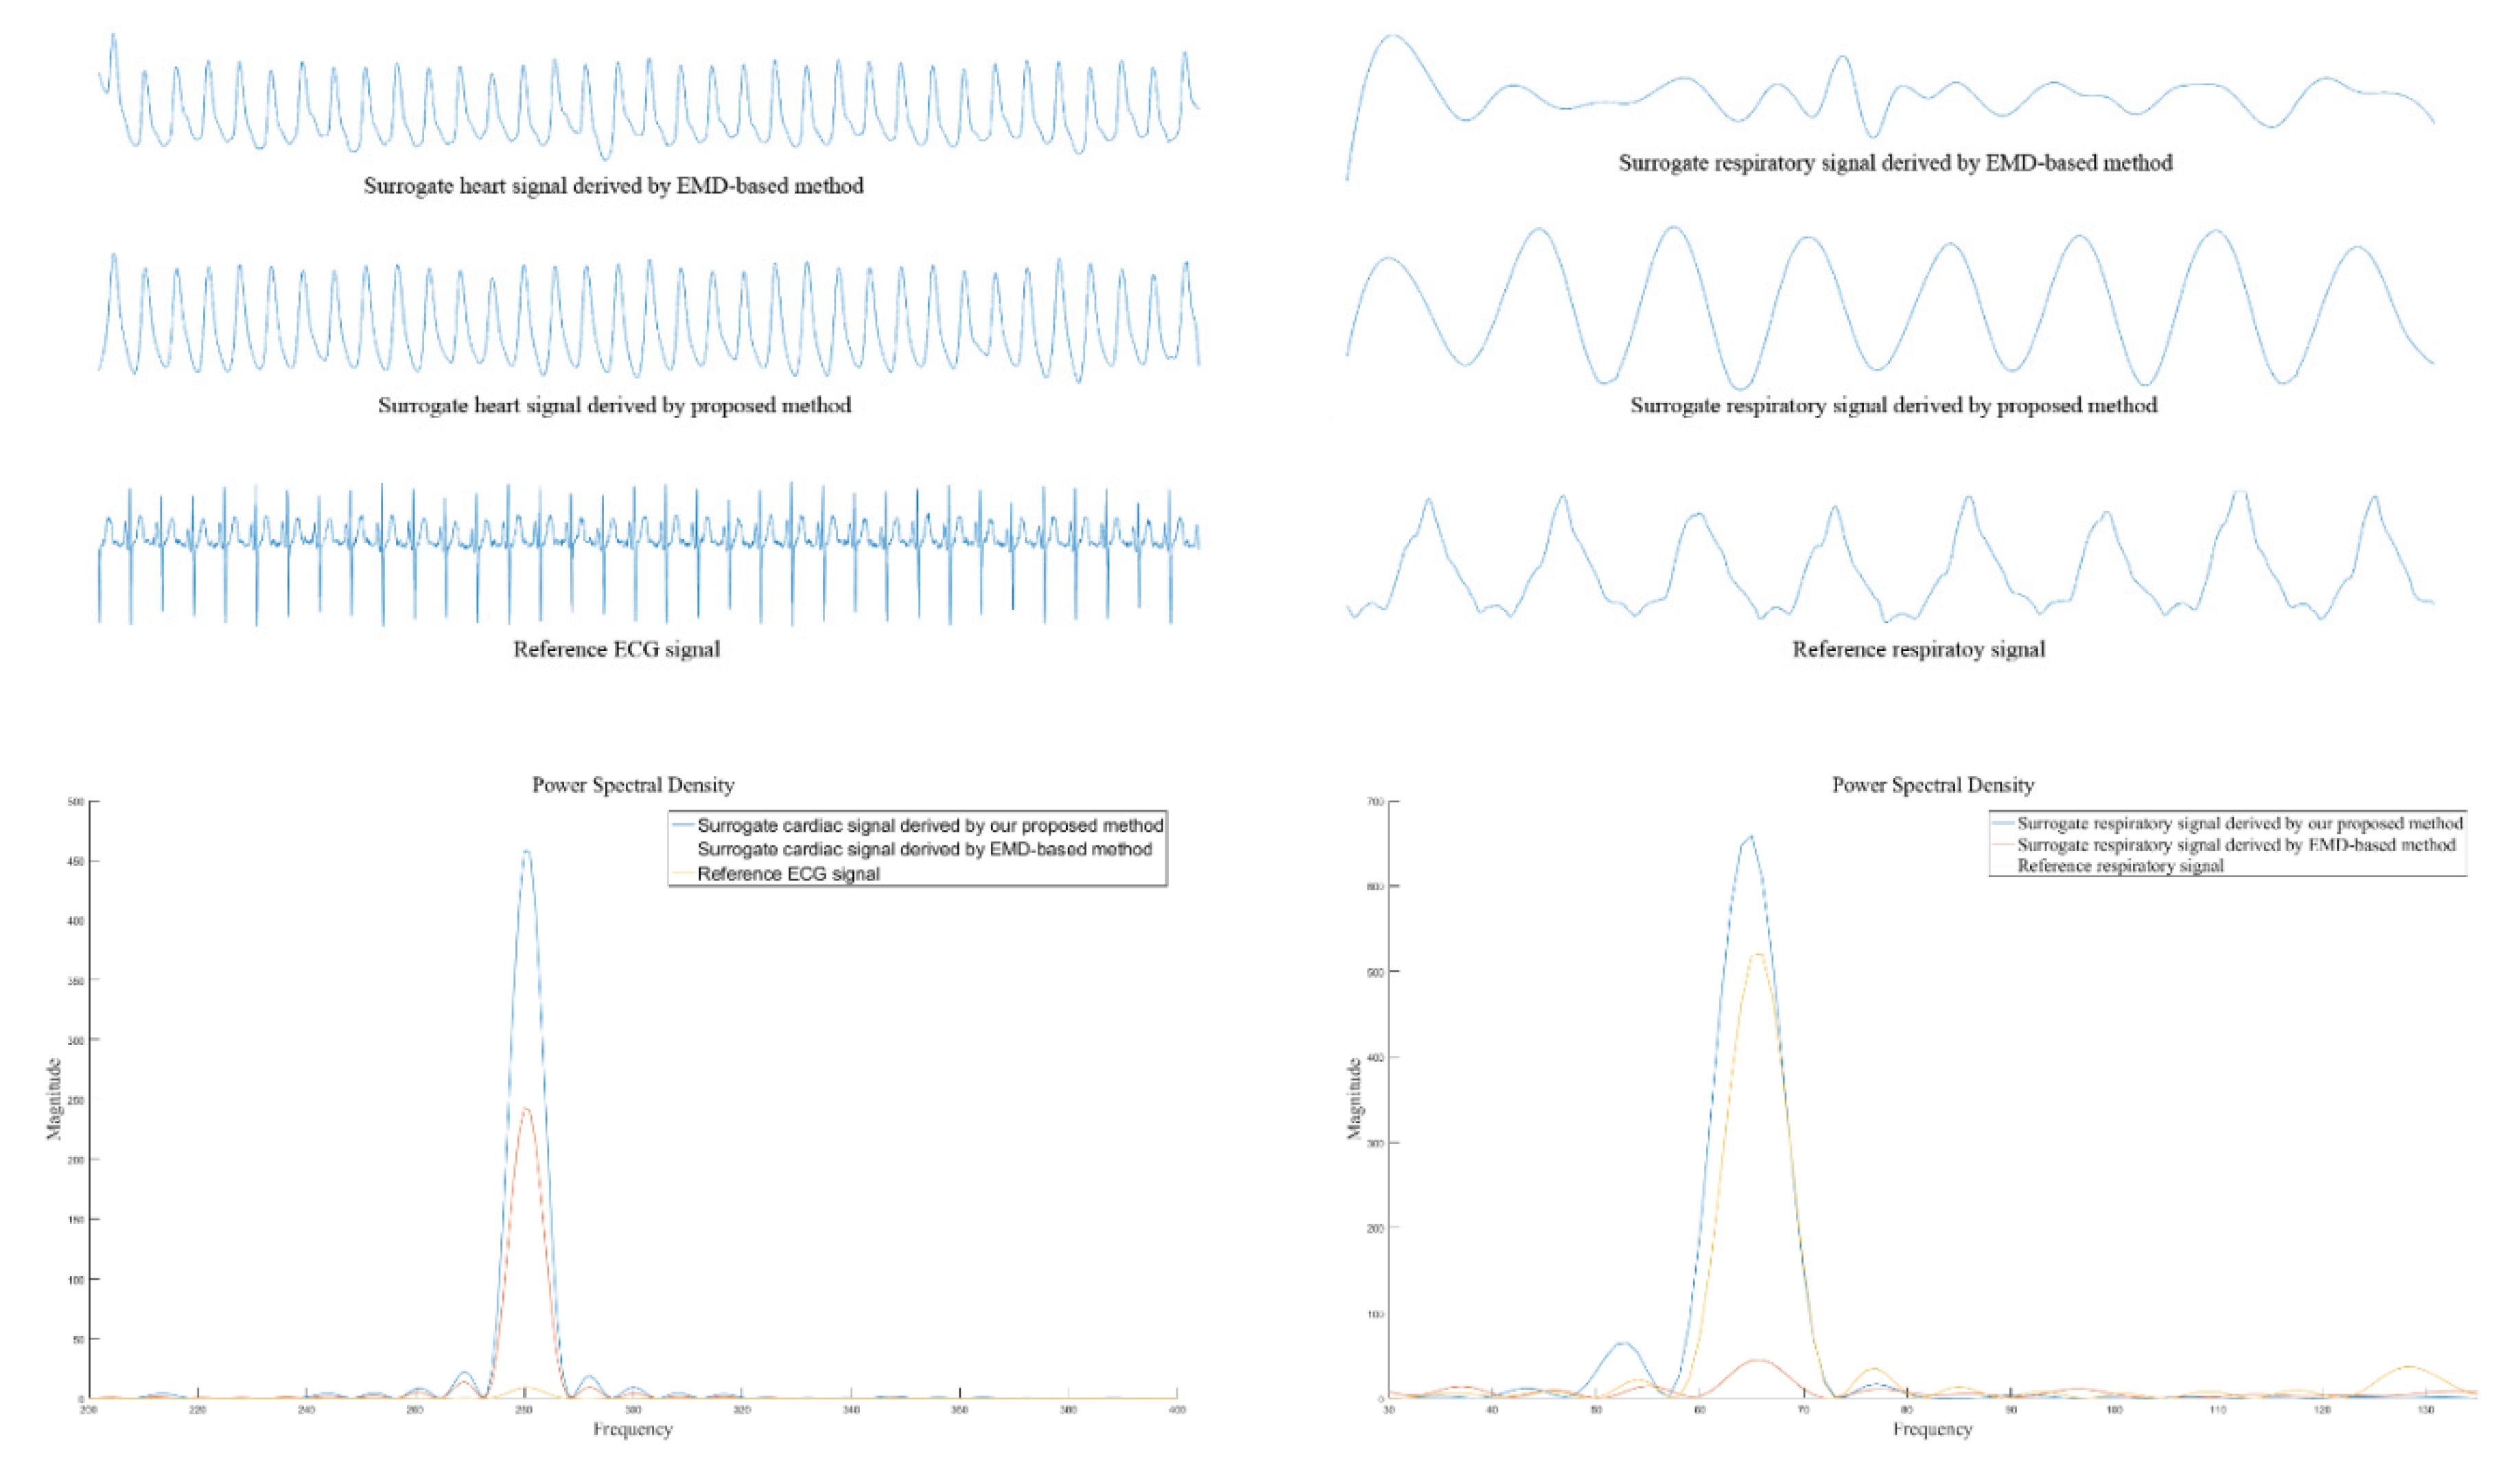
2.2.5. Estimation of Both the Heart Rate and the Respiratory Rate Using the Surrogate Signals
3. Computer Numerical Simulation Results
3.1. Database
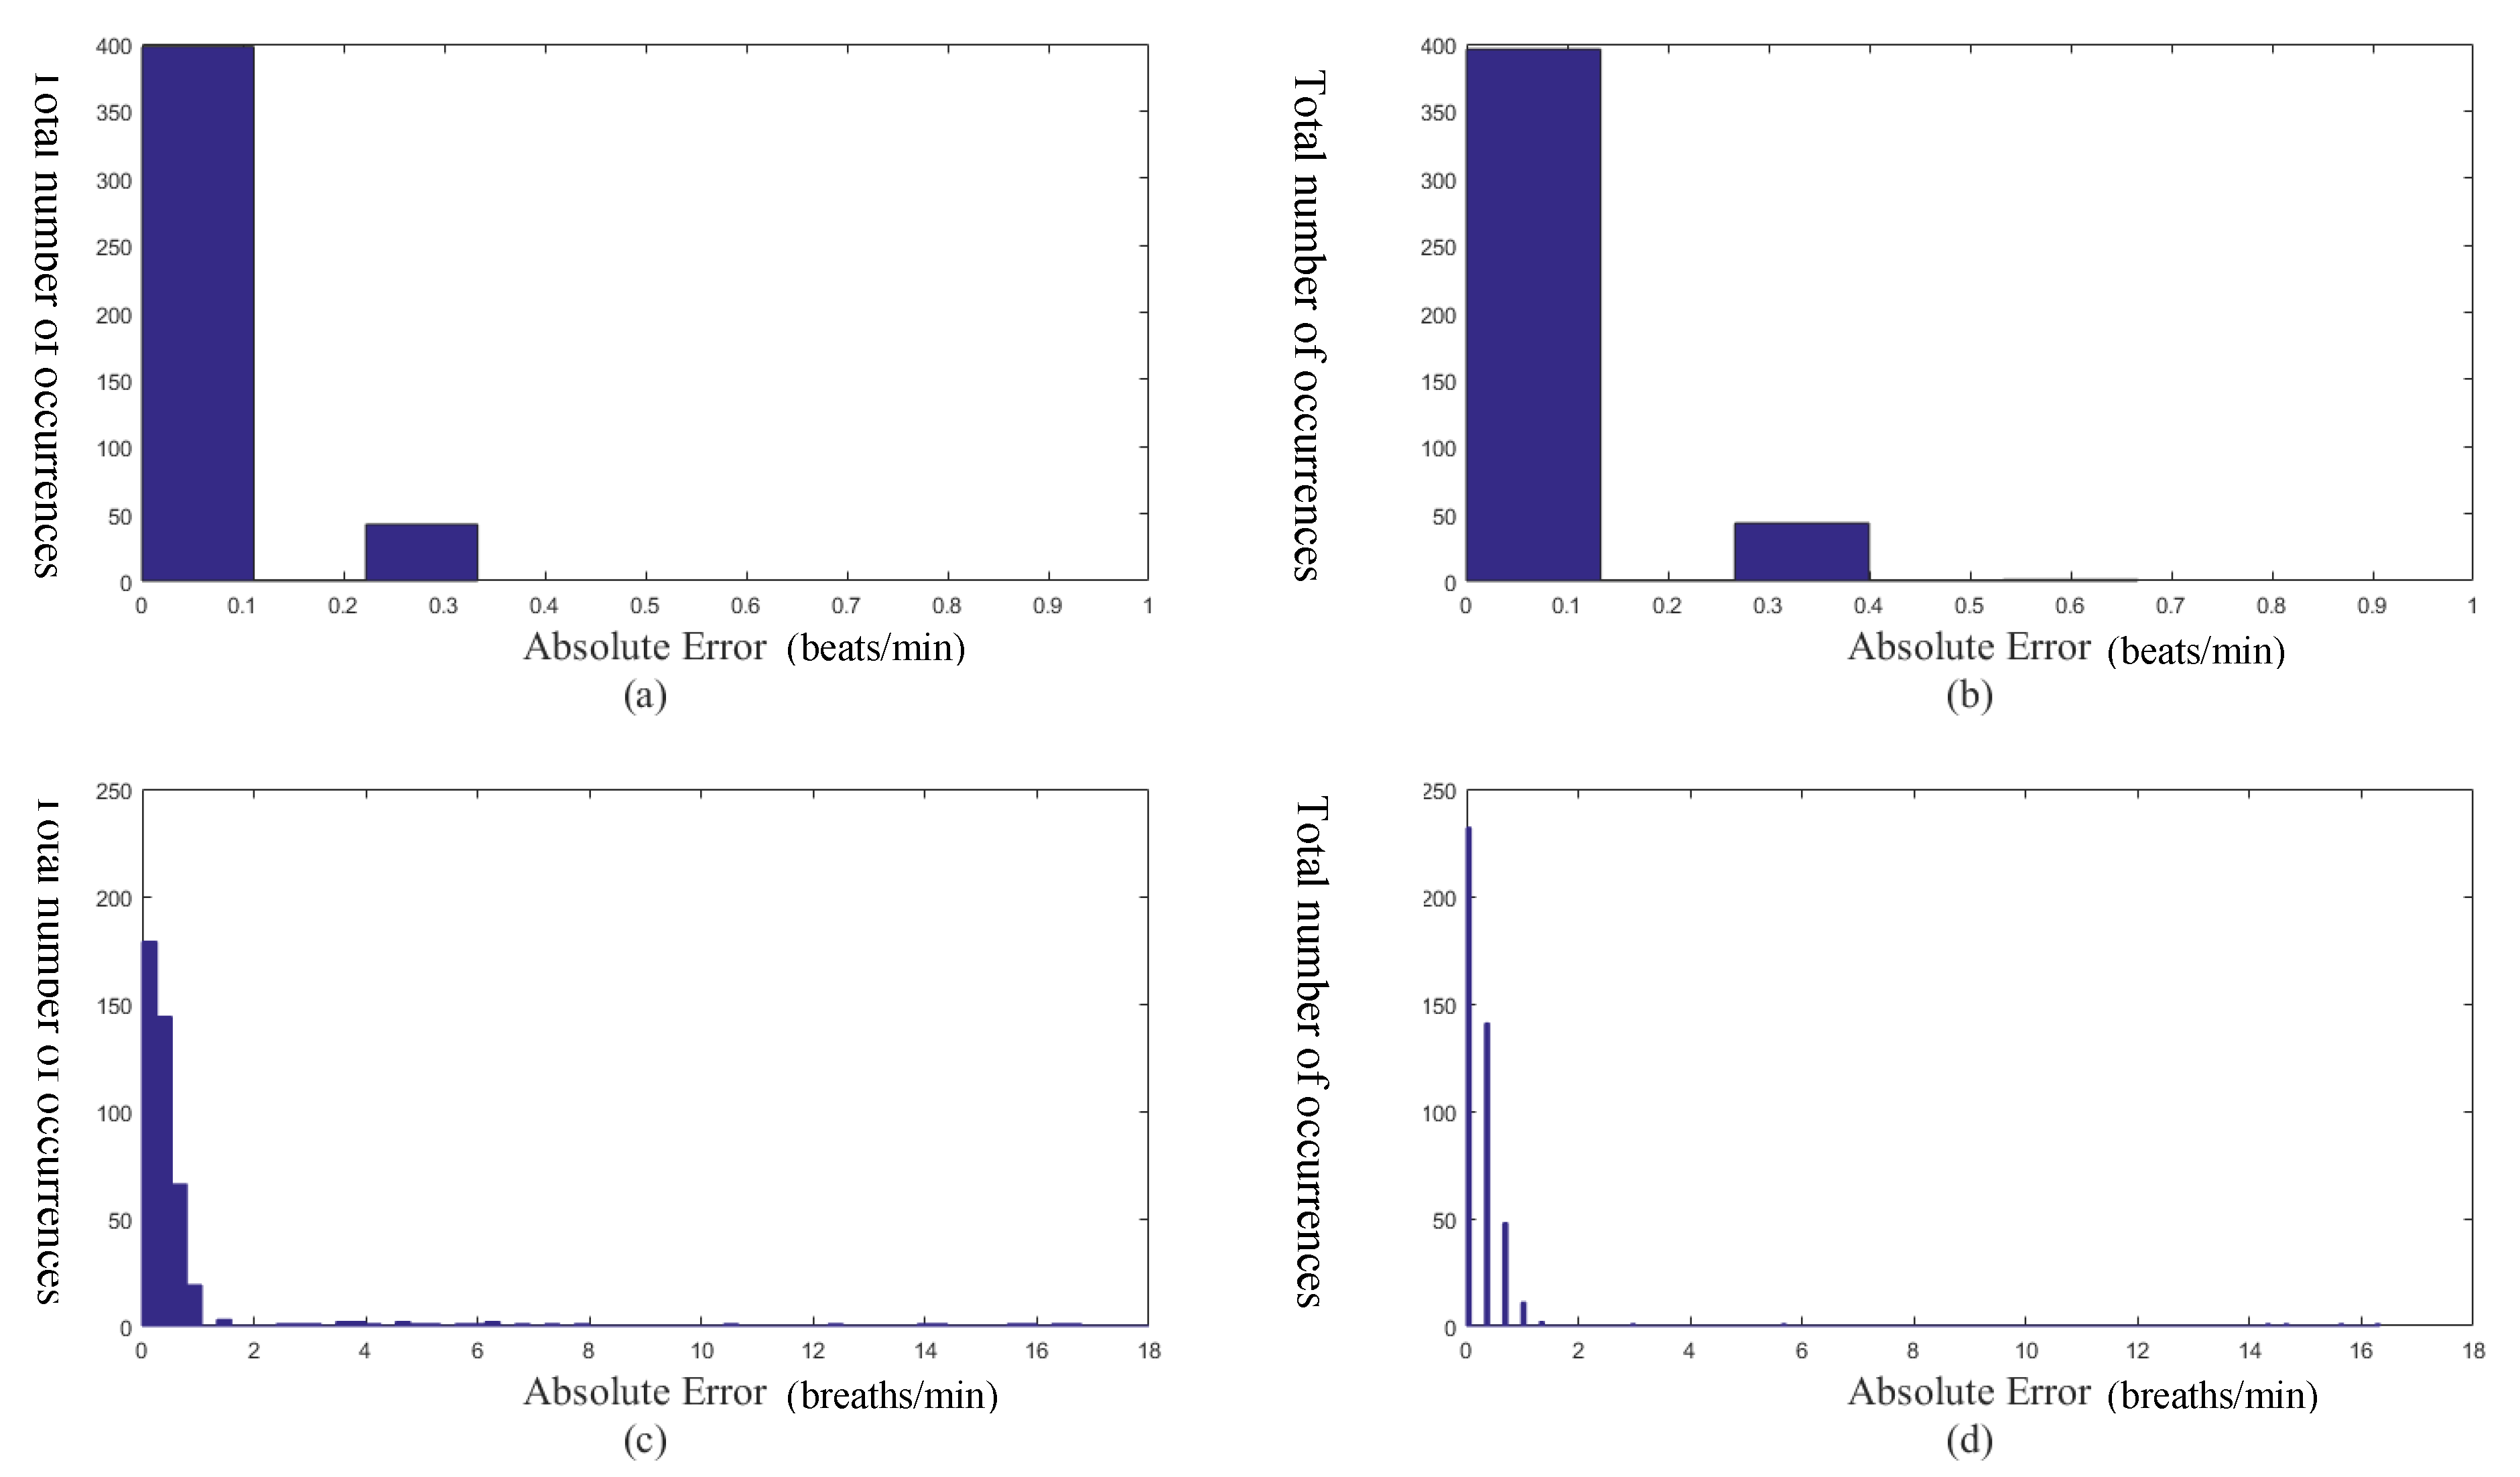
3.2. Performances
4. Conclusions
Author Contributions
Funding
Conflicts of Interest
References
- Pinto, S.P.; Pinto, G.M. Preoperative evaluation of the patient with cardiorespiratory diseases. Surgey (Oxford) 2019, 37, 662–669. [Google Scholar] [CrossRef]
- Gehlbach, B.K.; Sainju, R.K.; Tadlock, D.K.; Dragon, D.N.; Granner, M.A.; Richerson, G.B. Tolerability of a comprehensive cardiorespiratory monitoring protocol in an epilepsy monitoing unit. Epilepsy Behav. 2018, 85, 173–176. [Google Scholar] [CrossRef] [PubMed]
- Ibrahim, M.; Chandler, P. Is NEWS2 old news? A review of physiological deterioration prior to adult cardiac arrest at an acute NHS Trust in Essex, UK. Resuscitation 2019, 142, e100. [Google Scholar] [CrossRef]
- Li, G.; Hu, R.; Gu, X. A close-up on COVID-19 and cardiovascular diseases. Nutr. Metab. Cardiovasc. Dis. 2020, in press. [Google Scholar] [CrossRef] [PubMed]
- Jung, C.-C.; Hsia, Y.-F.; Hsu, N.-Y.; Wang, Y.-C.; Su, H.-J. Cumulative effect of indoor temperature on cardiovascular disease-related emergency departmnt visits among older adults in Taiwan. Sci. Total Environ. 2020, 731, 138958. [Google Scholar] [CrossRef]
- Atalan, N.; Sevim, M.E.; Akgün, S.; Fazlıoğulları, O.; Başaran, C. Morphine is a reasonable alternative to haloperidol in the treatment of postoperative hyperactive-type delirium after cardiac surgery. J. Cardiothorac. Vasc. Anesth. 2013, 27, 933–938. [Google Scholar] [CrossRef]
- Dickins, K.A.; Braun, L.T. Promotion of physical activity and cardiac rehabilitation for the management of cardiovascular disease. J. Nurse Pract. 2017, 13, 47–53. [Google Scholar] [CrossRef]
- See, V.Y.; Kwong, H.J. Wearing your heart on your wrist: How wearable smart devices are shaping the landscape of early cardiac arrhythmia detection. JACC Case Rep. 2020, 2, 434–443. [Google Scholar]
- Mesin, L. Heartbeat monitoring from adaptively down-sampled electrocardiogram. Coputers Biol. Med. 2017, 84, 217–225. [Google Scholar] [CrossRef]
- Verginis, N.; Davey, M.J.; Horne, R.S.C. Scoring respiratory events in paediatric patients: Evaluation of nasal pressure and thermistor recordings separately and in combination. Sleep Med. 2010, 11, 400–405. [Google Scholar] [CrossRef]
- Addison, P.S.; Watson, J.N.; Mestek, M.L.; Mecca, R.S. Developing an algorithm for pulse oximetry derived respiratory rate (RRoxi): A healthy volunteer study. J. Clin. Monit. Comput. 2012, 26, 45–51. [Google Scholar] [CrossRef] [PubMed]
- Nilsson, L.; Johansson, A.; Kalman, S. Monitoring of respiratory rate in postoperative care using a new photoplethysmographic technique. J. Clin. Monit. Comput. 2000, 16, 309–315. [Google Scholar] [CrossRef] [PubMed]
- Nakajima, K.; Tamura, T.; Miike, H. Monitoring of heart and respiratory rates by photoplethysmography using a digital filtering technique. Med. Eng. Phys. 1996, 18, 365–372. [Google Scholar] [CrossRef]
- Nakajima, K.; Tamura, T.; Ohta, T.; Miike, H.; Oberg, P.A. Photoplethysmographic measurement of heart and respiratory rates using digital filters. In Proceedings of the 15th Annual International Conference of the IEEE Engineering in Medicine and Biology Societ, San Diego, CA, USA, 31 October 1993; Volume 18, pp. 1006–1007. [Google Scholar]
- Chon, K.H.; Dash, S.; Ju, K. Estimation of respiratory rate from photoplethysmogram data using time-frequency spectral estimation. IEEE Trans. Biomed. Eng. 2009, 56, 2054–2063. [Google Scholar] [CrossRef] [PubMed]
- Garde, A.; Karlen, W.; Ansermino, J.M.; Dumont, G.A. Estimating respiratory and heart rates from the correntropy spectral density of the photoplethysmogram. PLoS ONE 2014, 9, e86427. [Google Scholar] [CrossRef] [PubMed]
- Leonard, P.A.; Beattie, T.F.; Addison, P.S.; Watson, J.N. Standard pulse oximeters can be used to monitor respiratory rate. Emerg. Med. J. 2003, 20, 524–525. [Google Scholar] [CrossRef]
- Leonard, P.A.; Clifton, D.; Addison, P.S.; Watson, J.N.; Beattie, T.F. An automated algorithm for determining respiratory rate by photoplethysmogram in children. Acta Paediatr. 2006, 95, 1124–1128. [Google Scholar] [CrossRef]
- Leonard, P.A.; Douglas, J.G.; Grubb, N.R.; Clifton, D.; Addison, P.S.; Watson, J.N. A fully automated algorithm for the determination of respiratory rate from the photoplethysmogram. J. Clin. Monit. Comput. 2006, 20, 33–36. [Google Scholar] [CrossRef]
- Leonard, P.A.; Grubb, N.R.; Addison, P.S.; Clifton, D.; Watson, J.N. An algorithm for the detection of individual breaths from the pulse oximeter waveform. J. Clin. Monit. Comput. 2004, 18, 309–312. [Google Scholar] [CrossRef]
- Huang, N.E.; Shen, Z.; Long, S.R.; Wu, M.C.; Shih, H.H.; Zheng, Q.; Yen, N.C.; Tung, C.C.; Liu, H.H. The empirical mode decomposition and the Hilbert spectrum for nonlinear and non-stationary time series analysis. Proc. R. Soc. Lond. A Math. Phys. Eng. Sci. 1998, 454, 903–995. [Google Scholar] [CrossRef]
- Ambekar, M.R.; Prabhu, S. A novel algorithm to obtain respiratory rate from the PPG signal. Int. J. Comput. Appl. 2015, 126, 975–8887. [Google Scholar]
- Garde, A.; Karlen, W.; Dehkordi, P.; Ansermino, J.M.; Dumont, G.A. Empirical mode decomposition for respiratory and heart rate estimation from the photoplethysmogram. Comput. Cardiol. Conf. 2013, 40, 799–802. [Google Scholar]
- Labate, D.; La Foresta, F.; Occhiuto, G.; Morabito, F.C.; Lay-Ekuakille, A.; Vergallo, P. Empirical mode decomposition vs. wavelet decomposition for the extraction of respiratory signal from single-channel ECG: A comparison. IEEE Sens. J. 2013, 13, 2666–2674. [Google Scholar] [CrossRef]
- Prathyusha, B.; Rao, T.S.; Asha, D. Extraction of respiratory rate from PPG signals using PCA and EMD. Int. J. Res. Eng. Technol. 2012, 1, 164–184. [Google Scholar]
- Wu, Z.; Huang, N.E. Ensemble empirical mode decomposition: A noise-assisted data analysis method. Adv. Adapt. Data Anal. 2009, 1, 1–41. [Google Scholar] [CrossRef]
- Orphanidou, C. Derivation of respiration rate from ambulatory ECG and PPG using ensemble empirical mode decomposition: Comparison and fusion. Comput. Biol. Med. 2017, 81, 45–54. [Google Scholar] [CrossRef]
- Motin, M.A.; Karmakar, C.K.; Palaniswami, M. Ensemble empirical mode decomposition with principal component analysis: A novel approach for extracting respiratory rate and heart rate from photoplethysmographic signal. IEEE J. Biomed. Health Inform. 2018, 22, 766–774. [Google Scholar] [CrossRef]
- Yeh, J.; Shieh, J.; Huang, N.E. Complementary ensemble empirical mode decomposition: A novel noise enhanced data analysis method. Adv. Adapt. Data Anal. 2010, 2, 135–156. [Google Scholar] [CrossRef]
- Comon, P. Independent component analysis, a new concept? Signal Process. 1994, 36, 287–314. [Google Scholar] [CrossRef]
- Hyvarinen, A. Fast and robust fixed-point algorithms for independent component analysis. IEEE Trans. Neural Netw. 1999, 10, 626–634. [Google Scholar] [CrossRef] [PubMed]
- Lee, D.D.; Seung, H.S. Algorithms for non-negative matrix factorization. Adv. Neural Inf. Process. Syst. 2001, 1, 556–562. [Google Scholar]
- Lee, D.D.; Seung, H.S. Learning the parts of objects by non-negative matrix factorization. Nature 1999, 401, 788–791. [Google Scholar] [CrossRef] [PubMed]
- Mijović, B.; de Vos, M.; Gligorijević, I.; Taelman, J.; van Huffel, S. Source separation from single-channel recordings by combining empirical-mode decomposition and independent component analysis. IEEE Trans. Biomed. Eng. 2010, 57, 2188–2196. [Google Scholar] [CrossRef]
- He, P.; Chen, X. A method for extracting fetal ECG based on EMD-NMF single channel blind source separation algorithm. Technol. Health Care 2016, 24, S17–S26. [Google Scholar] [CrossRef]
- Hoyer, P.O. Non-negative matrix factorization with sparseness constraints. J. Mach. Learn. Res. 2004, 5, 1457–1469. [Google Scholar]
- Fleming, S.; Thompson, M.; Stevens, R.; Heneghan, C.; Plüddemann, A.; MacOnochie, I.; Tarassenko, L.; Mant, D. Normal ranges of heart rate and respiratory rate in children from birth to 18 years of age: A systematic review of observational studies. Lancet 2011, 377, 1011–1018. [Google Scholar] [CrossRef]
- Moody, G.B.; Mark, R.G. A database to support development and evaluation of intelligent intensive care monitoring. Comput. Cardiol. 1996, 657–660. [Google Scholar]


| Methods | 055m | 212m | 220m | 408m | ||||
|---|---|---|---|---|---|---|---|---|
| Our proposed method | 99.96% | 95.95% | 99.97% | 99.82% | 99.90% | 96.54% | 99.96% | 98.79% |
| Empirical mode decomposition based method [23] | 99.96% | 88.01% | 99.98% | 98.79% | 99.93% | 85.81% | 99.85% | 95.02% |
| Digital filtering approach [13] | 92.34% | 87.41% | 92.41% | 88.12% | 91.78% | 84.19% | 92.31% | 84.24% |
| Methods | Means | Variance | ||
|---|---|---|---|---|
| Our proposed method | 99.95% | 97.78% | 0.0010% | 3.3560% |
| Empirical mode decomposition based method [23] | 99.93% | 91.91% | 0.0033% | 36.4755% |
| Digital filtering approach [13] | 92.01% | 85.12% | 2.41% | 25.12% |
© 2020 by the authors. Licensee MDPI, Basel, Switzerland. This article is an open access article distributed under the terms and conditions of the Creative Commons Attribution (CC BY) license (http://creativecommons.org/licenses/by/4.0/).
Share and Cite
Lei, R.; Ling, B.W.-K.; Feng, P.; Chen, J. Estimation of Heart Rate and Respiratory Rate from PPG Signal Using Complementary Ensemble Empirical Mode Decomposition with both Independent Component Analysis and Non-Negative Matrix Factorization. Sensors 2020, 20, 3238. https://doi.org/10.3390/s20113238
Lei R, Ling BW-K, Feng P, Chen J. Estimation of Heart Rate and Respiratory Rate from PPG Signal Using Complementary Ensemble Empirical Mode Decomposition with both Independent Component Analysis and Non-Negative Matrix Factorization. Sensors. 2020; 20(11):3238. https://doi.org/10.3390/s20113238
Chicago/Turabian StyleLei, Ruisheng, Bingo Wing-Kuen Ling, Peihua Feng, and Jinrong Chen. 2020. "Estimation of Heart Rate and Respiratory Rate from PPG Signal Using Complementary Ensemble Empirical Mode Decomposition with both Independent Component Analysis and Non-Negative Matrix Factorization" Sensors 20, no. 11: 3238. https://doi.org/10.3390/s20113238
APA StyleLei, R., Ling, B. W.-K., Feng, P., & Chen, J. (2020). Estimation of Heart Rate and Respiratory Rate from PPG Signal Using Complementary Ensemble Empirical Mode Decomposition with both Independent Component Analysis and Non-Negative Matrix Factorization. Sensors, 20(11), 3238. https://doi.org/10.3390/s20113238