Electrical Resistance Sensing of Epoxy Curing Using an Embedded Carbon Nanotube Yarn


Abstract
1. Introduction
2. Materials and Methods
2.1. Materials
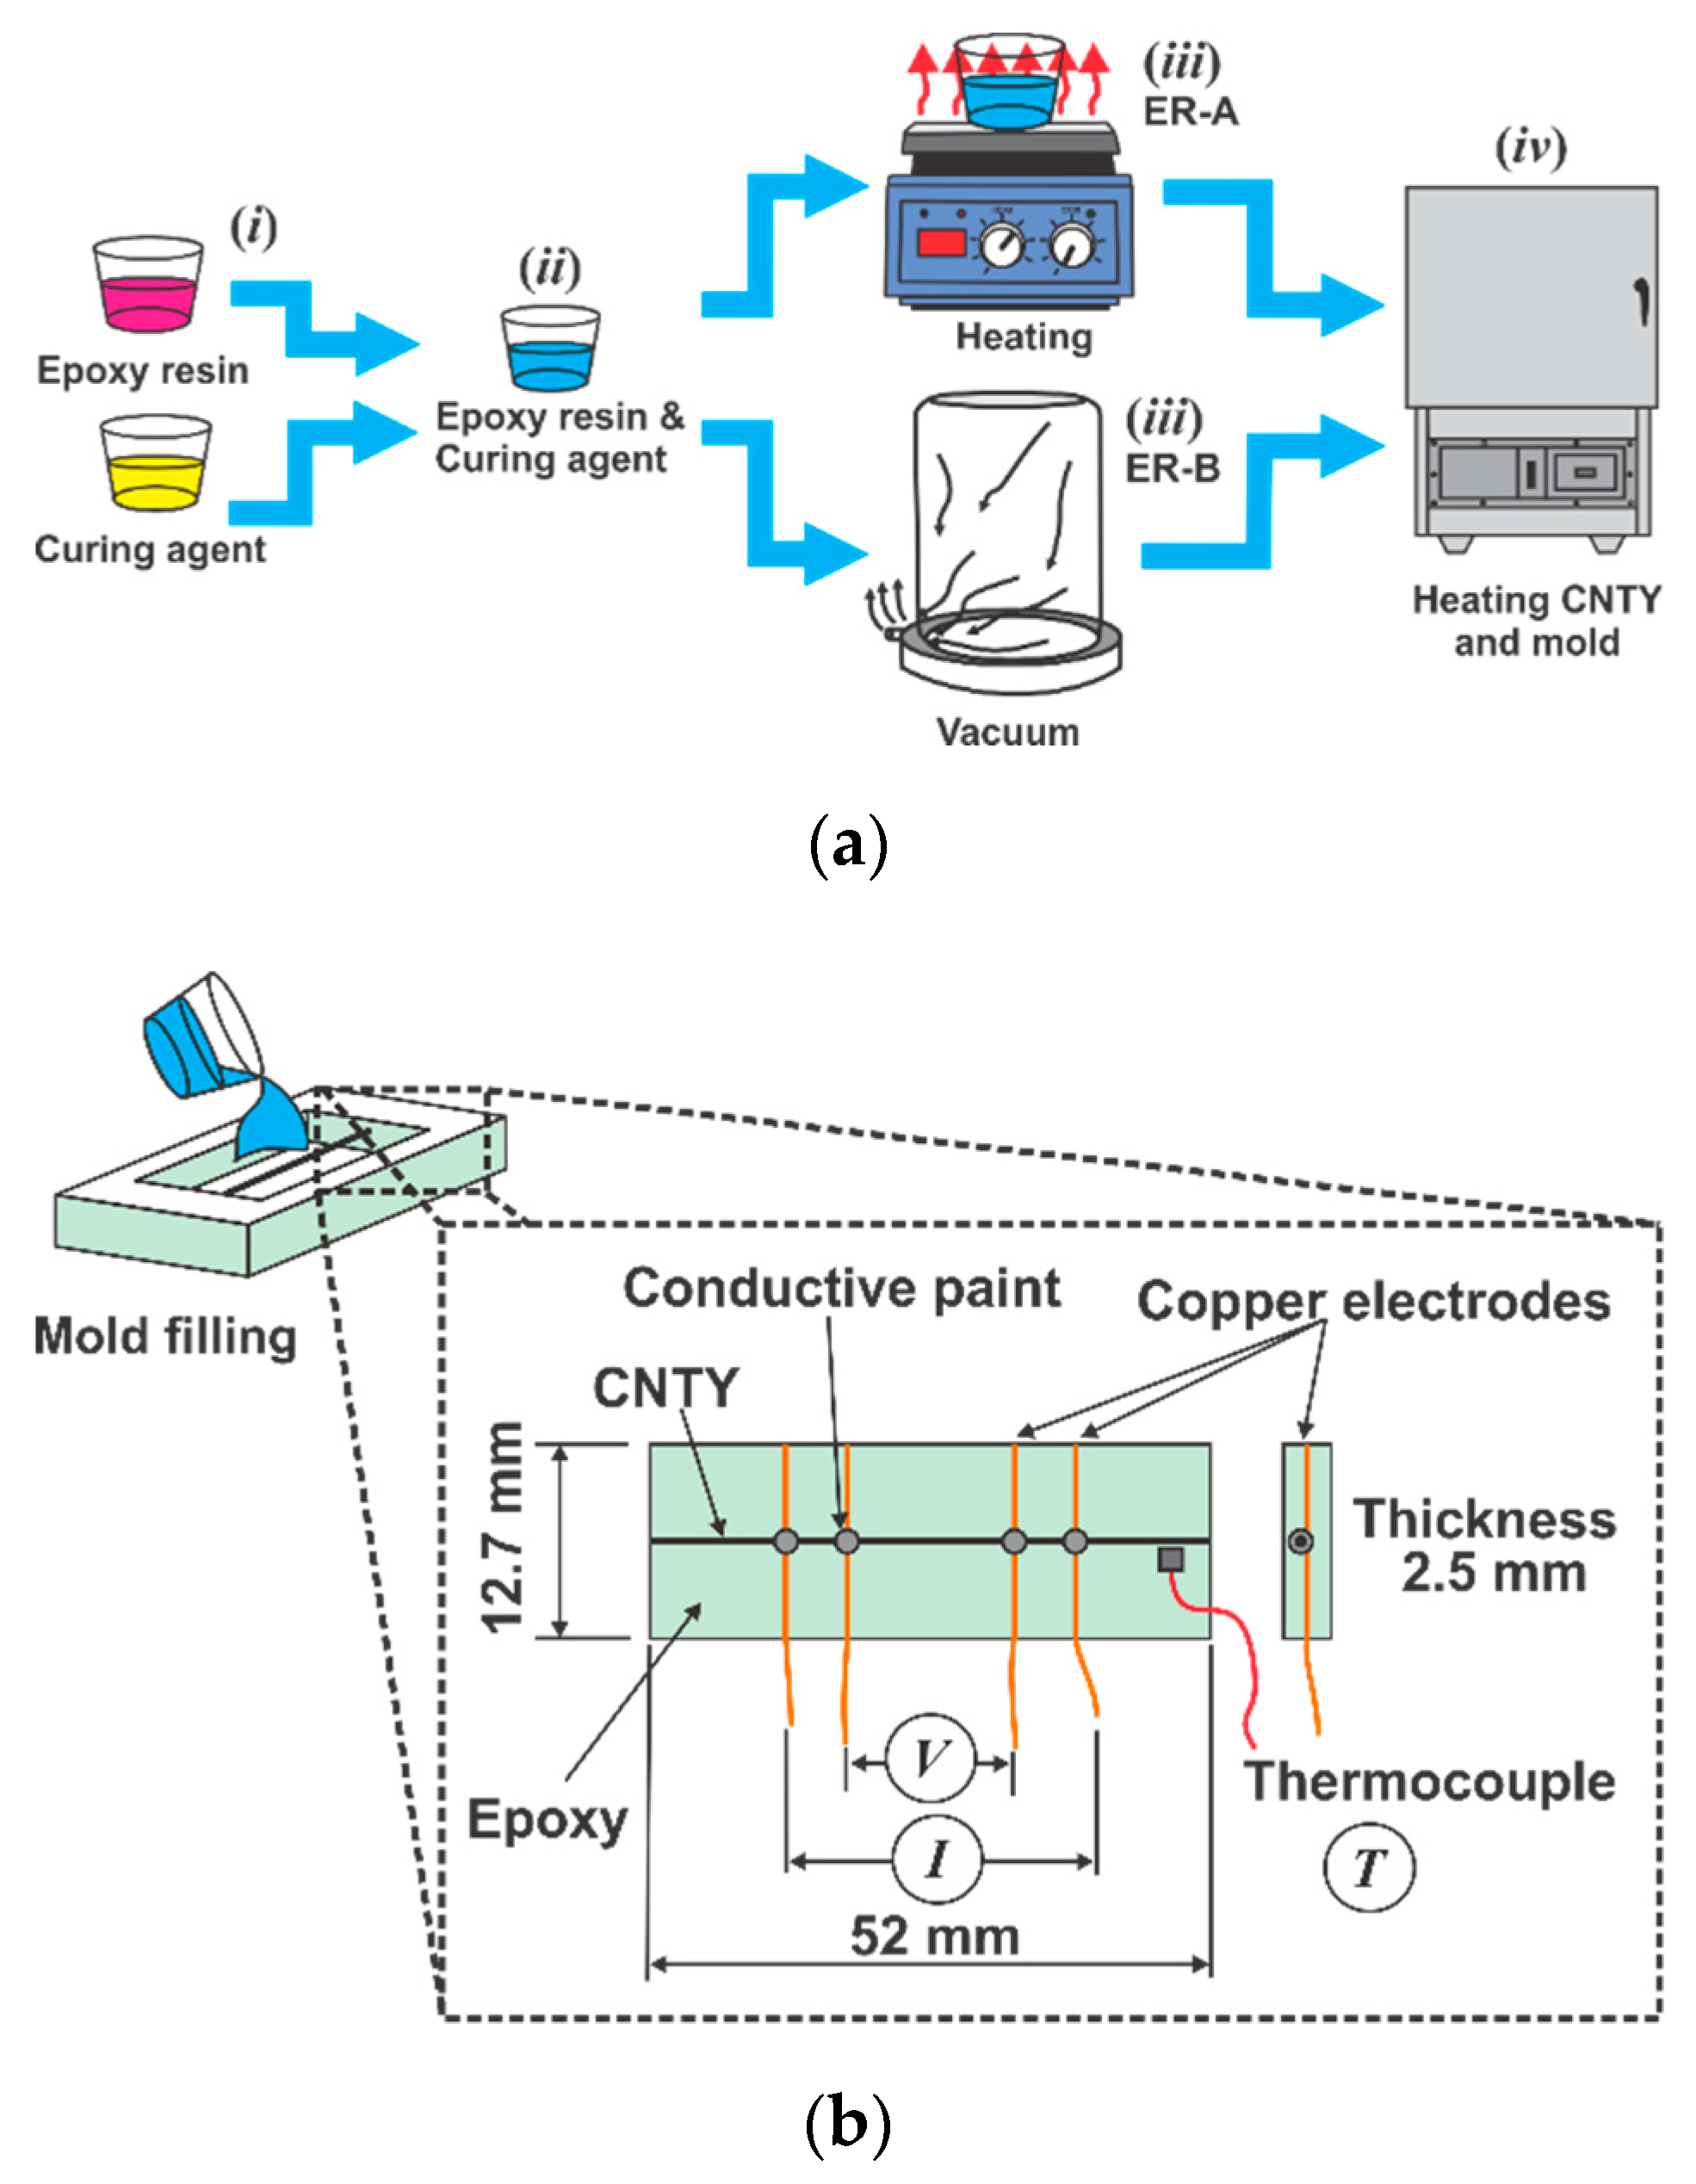
2.2. Experimental Set Up for In-Situ Electrical Resistance Measurements
2.3. Curing Program and Data Reduction
3. Results
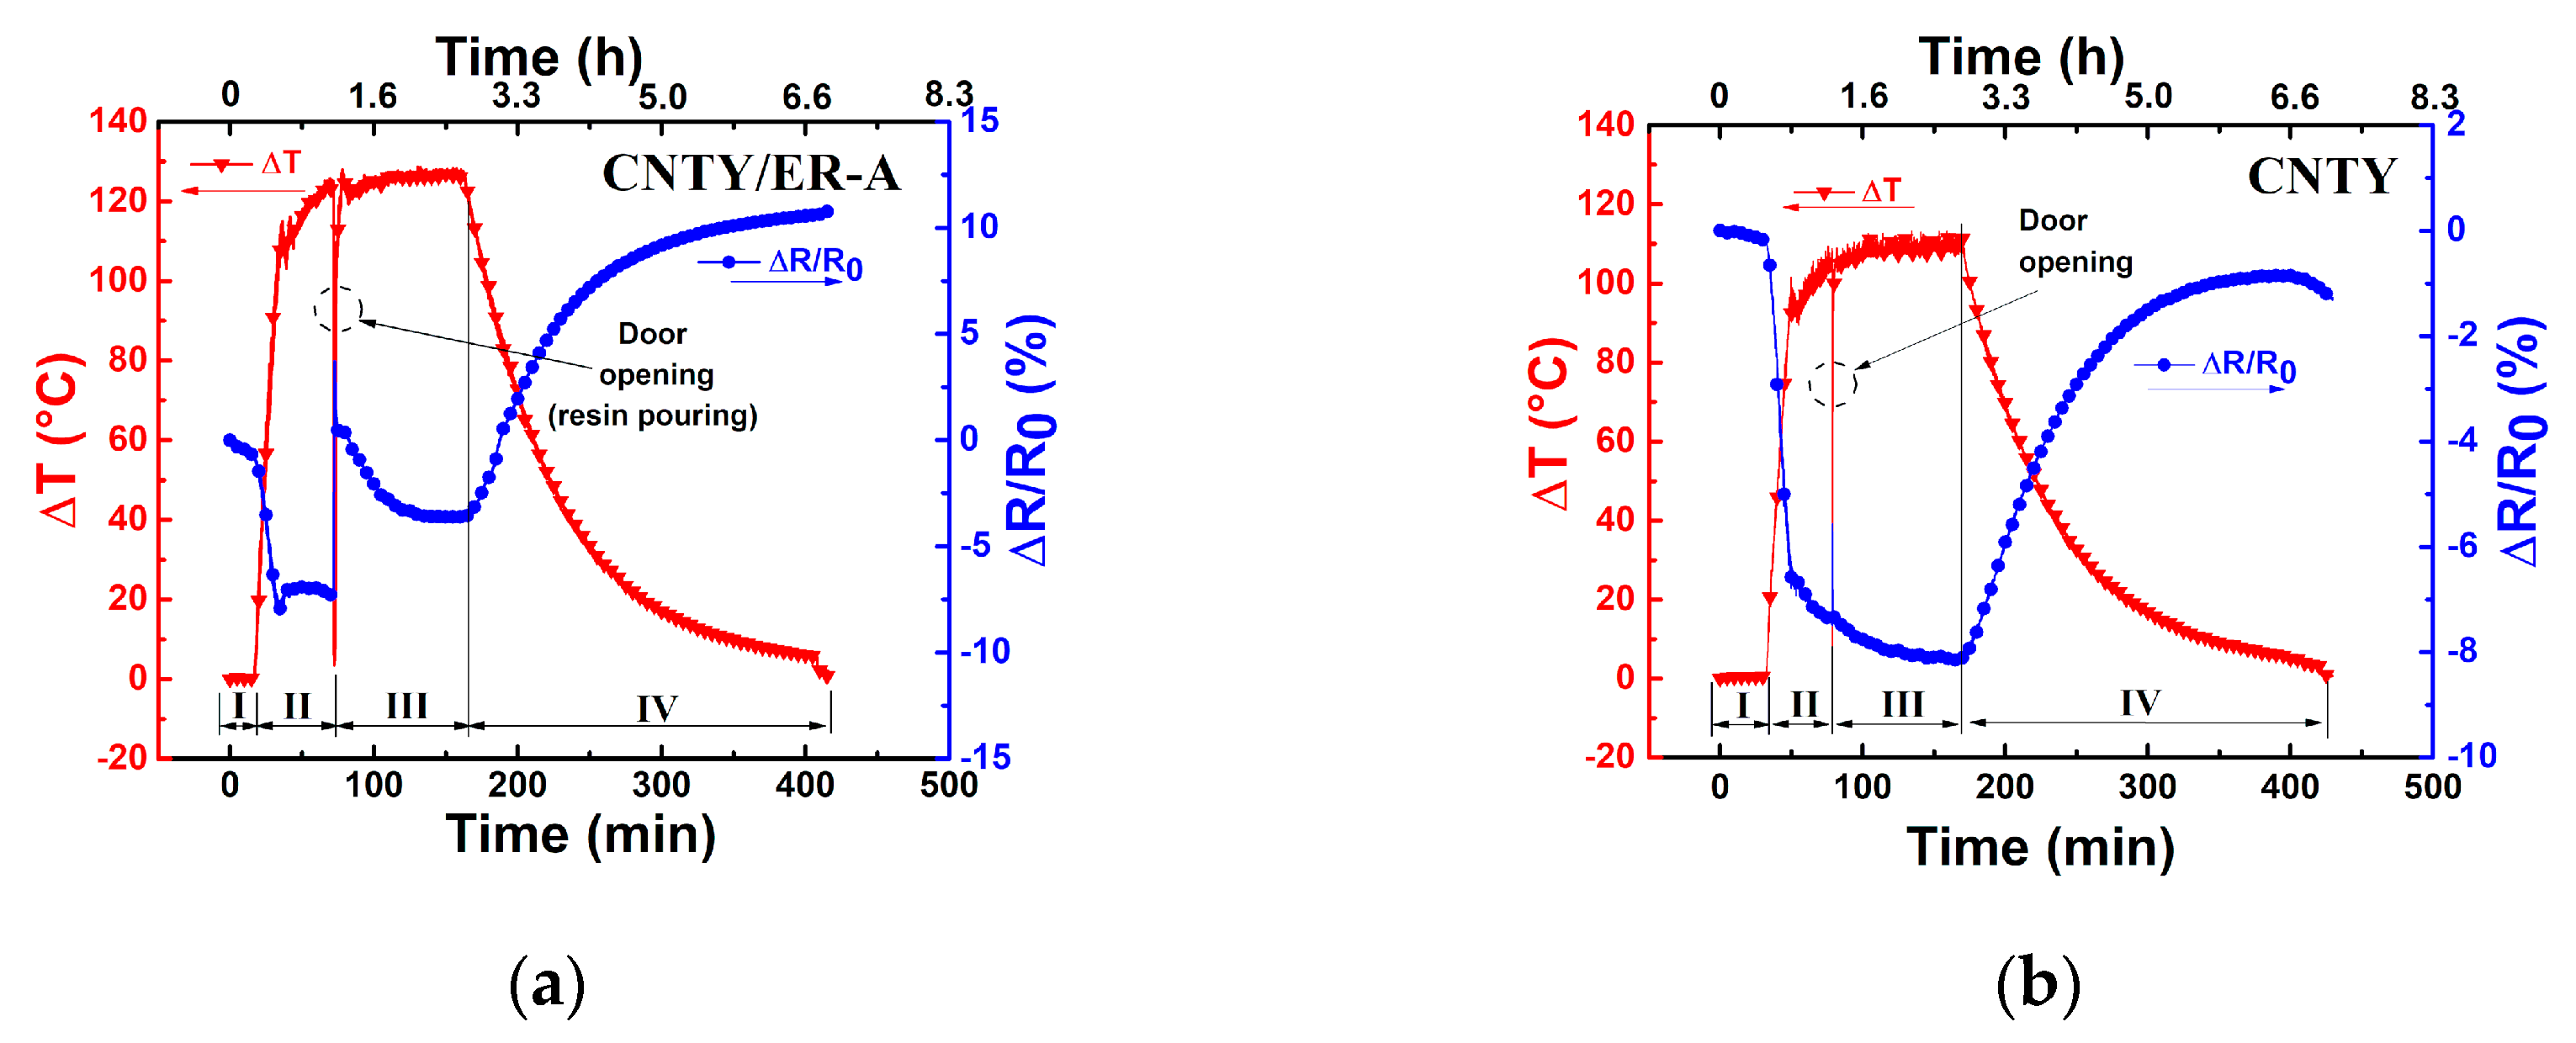
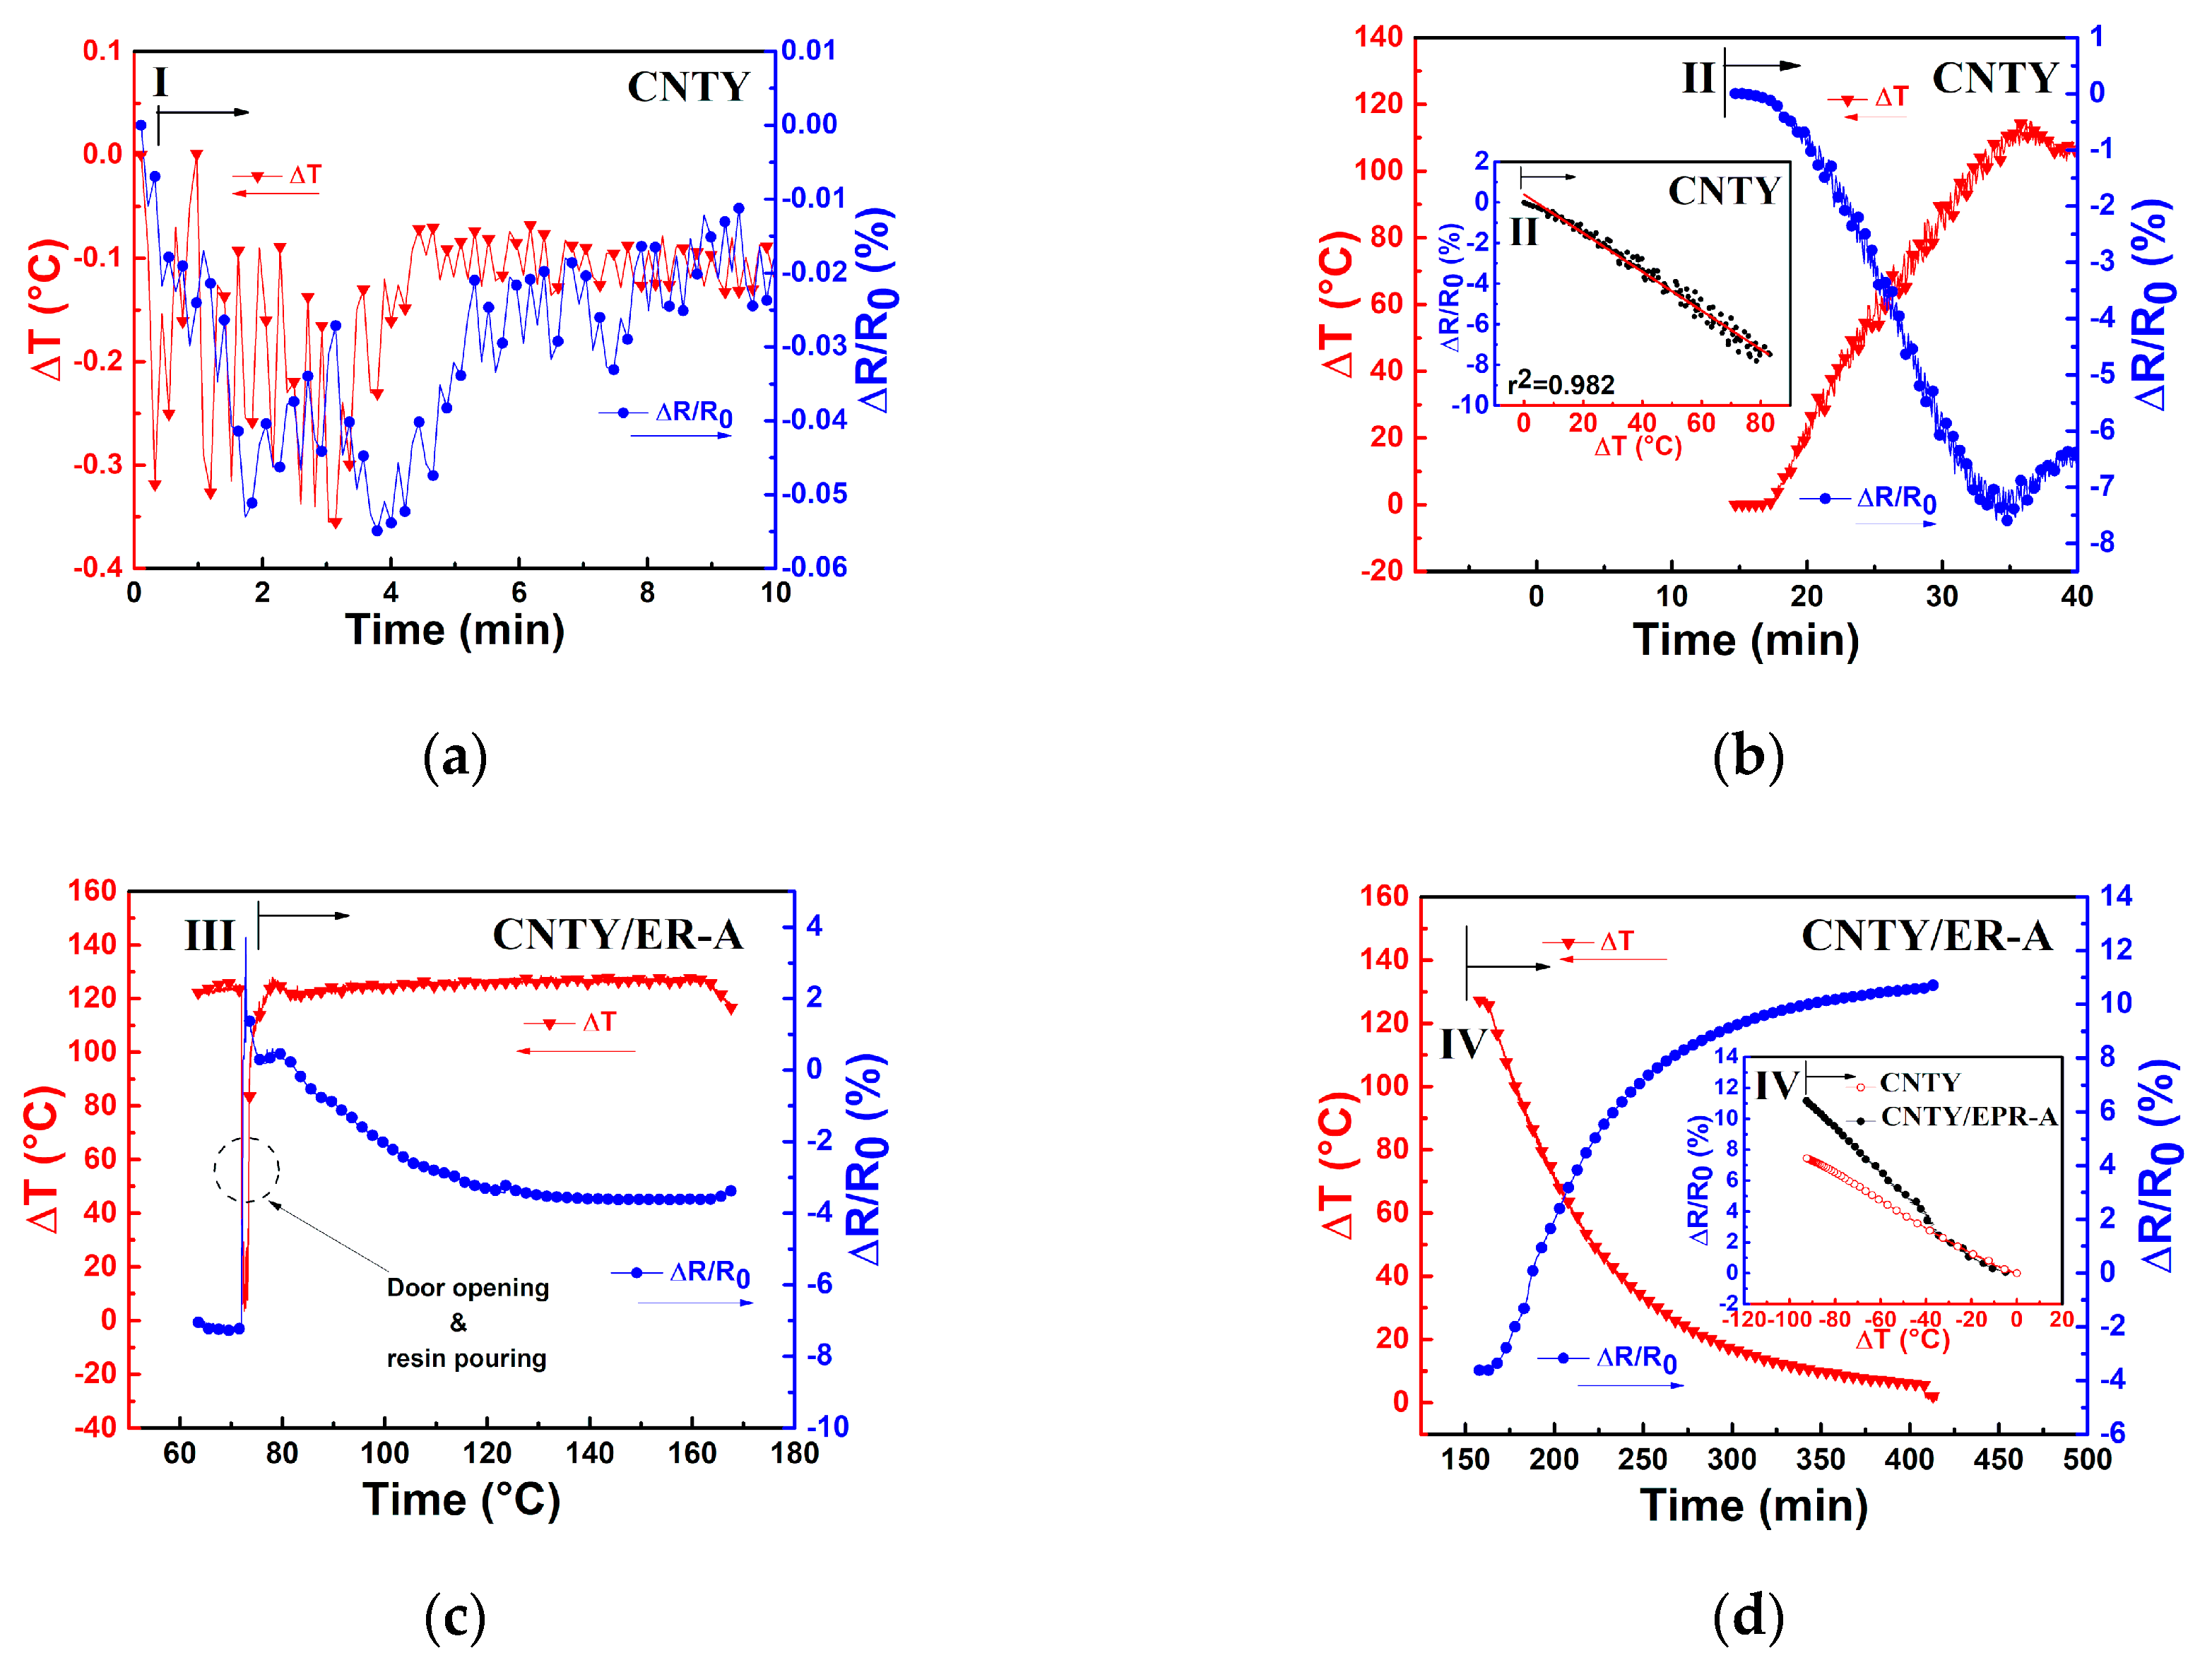
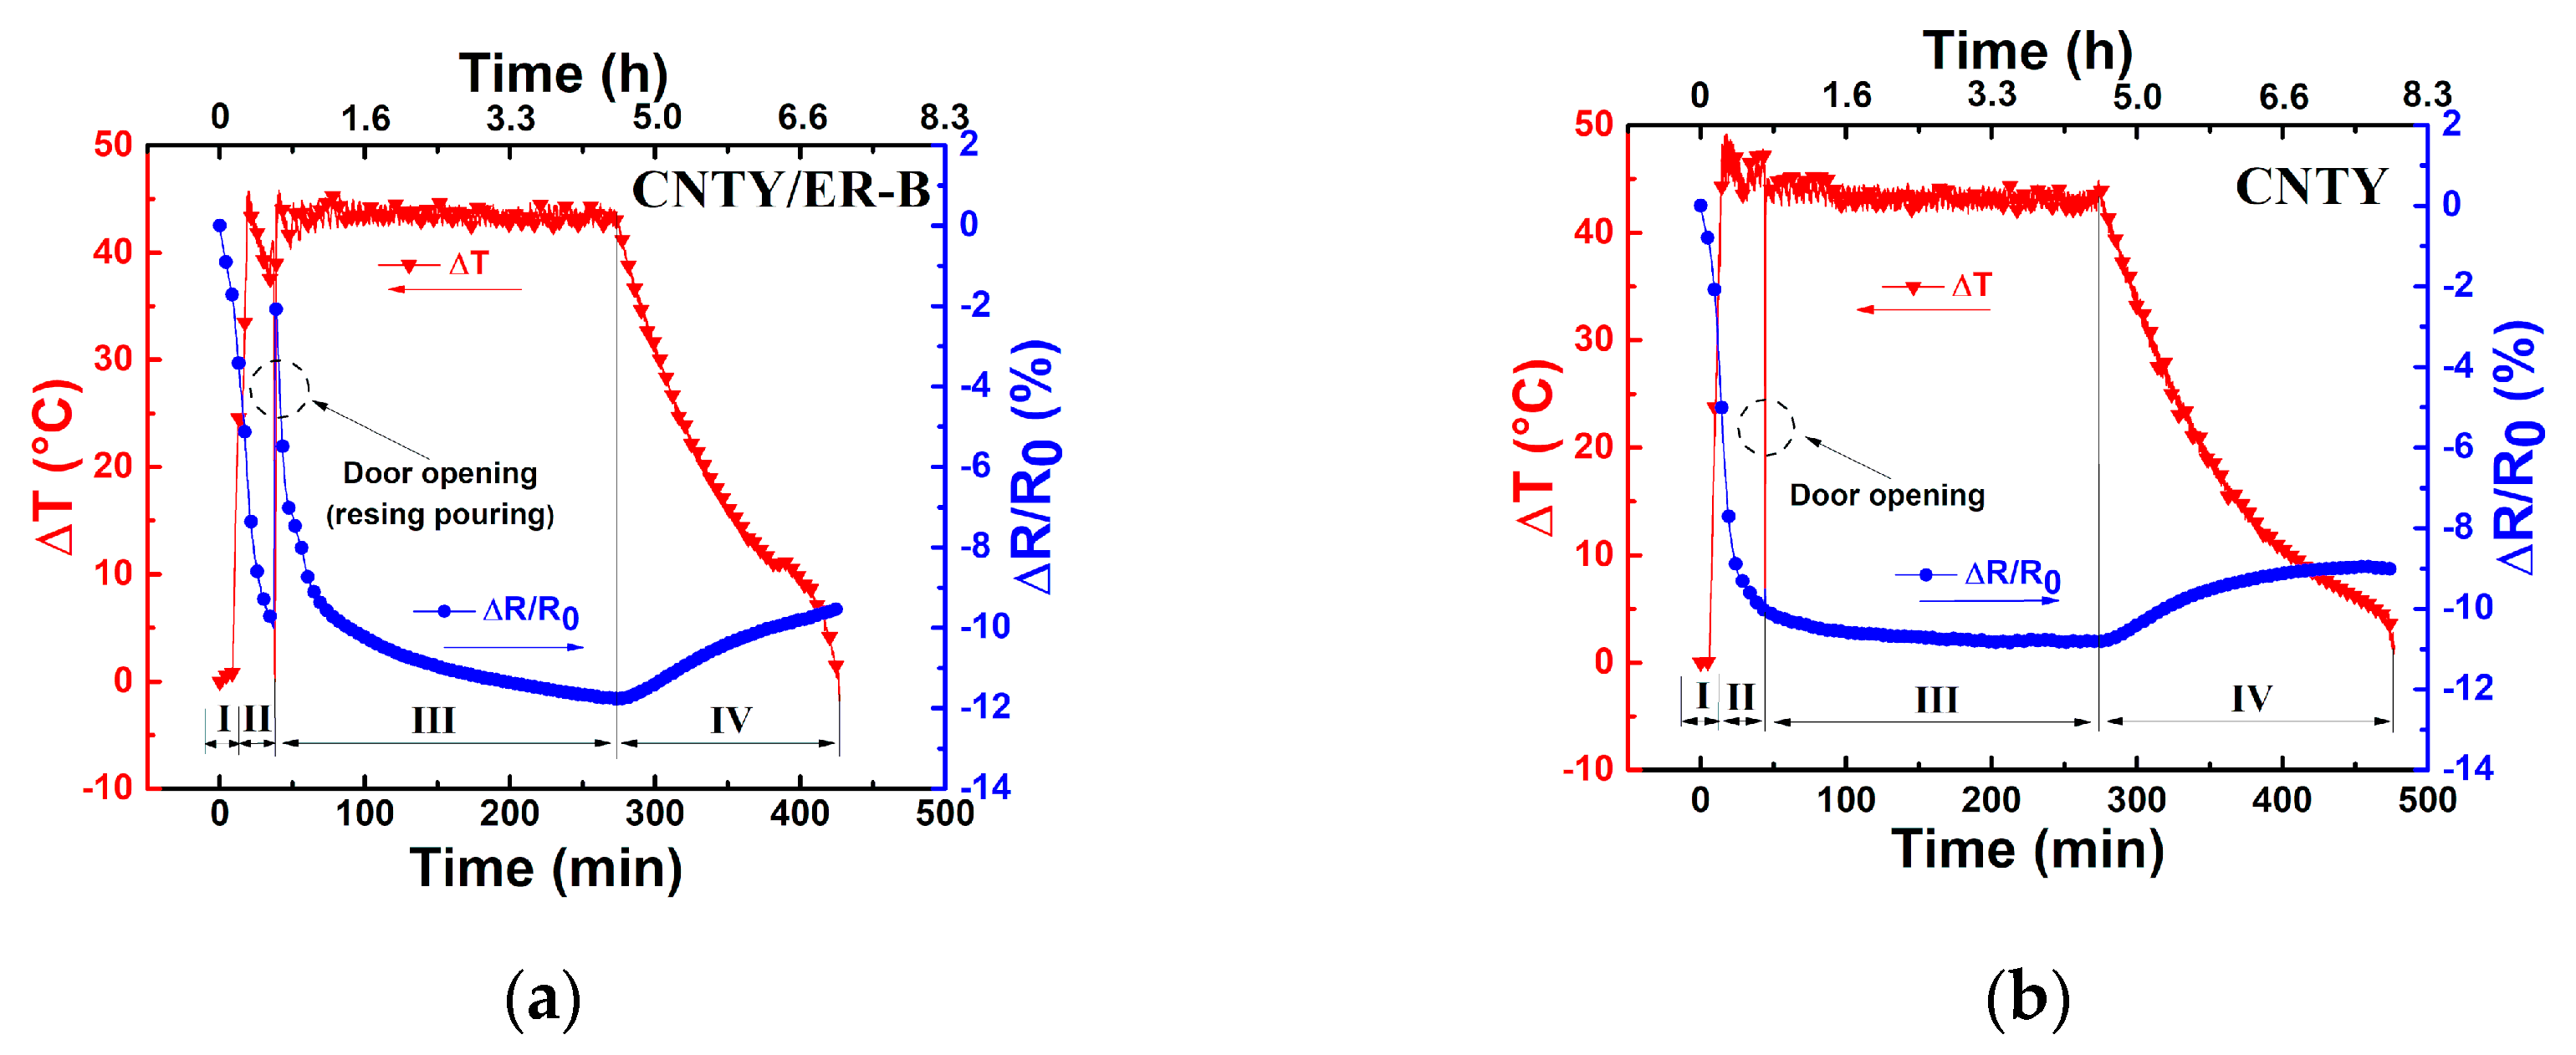
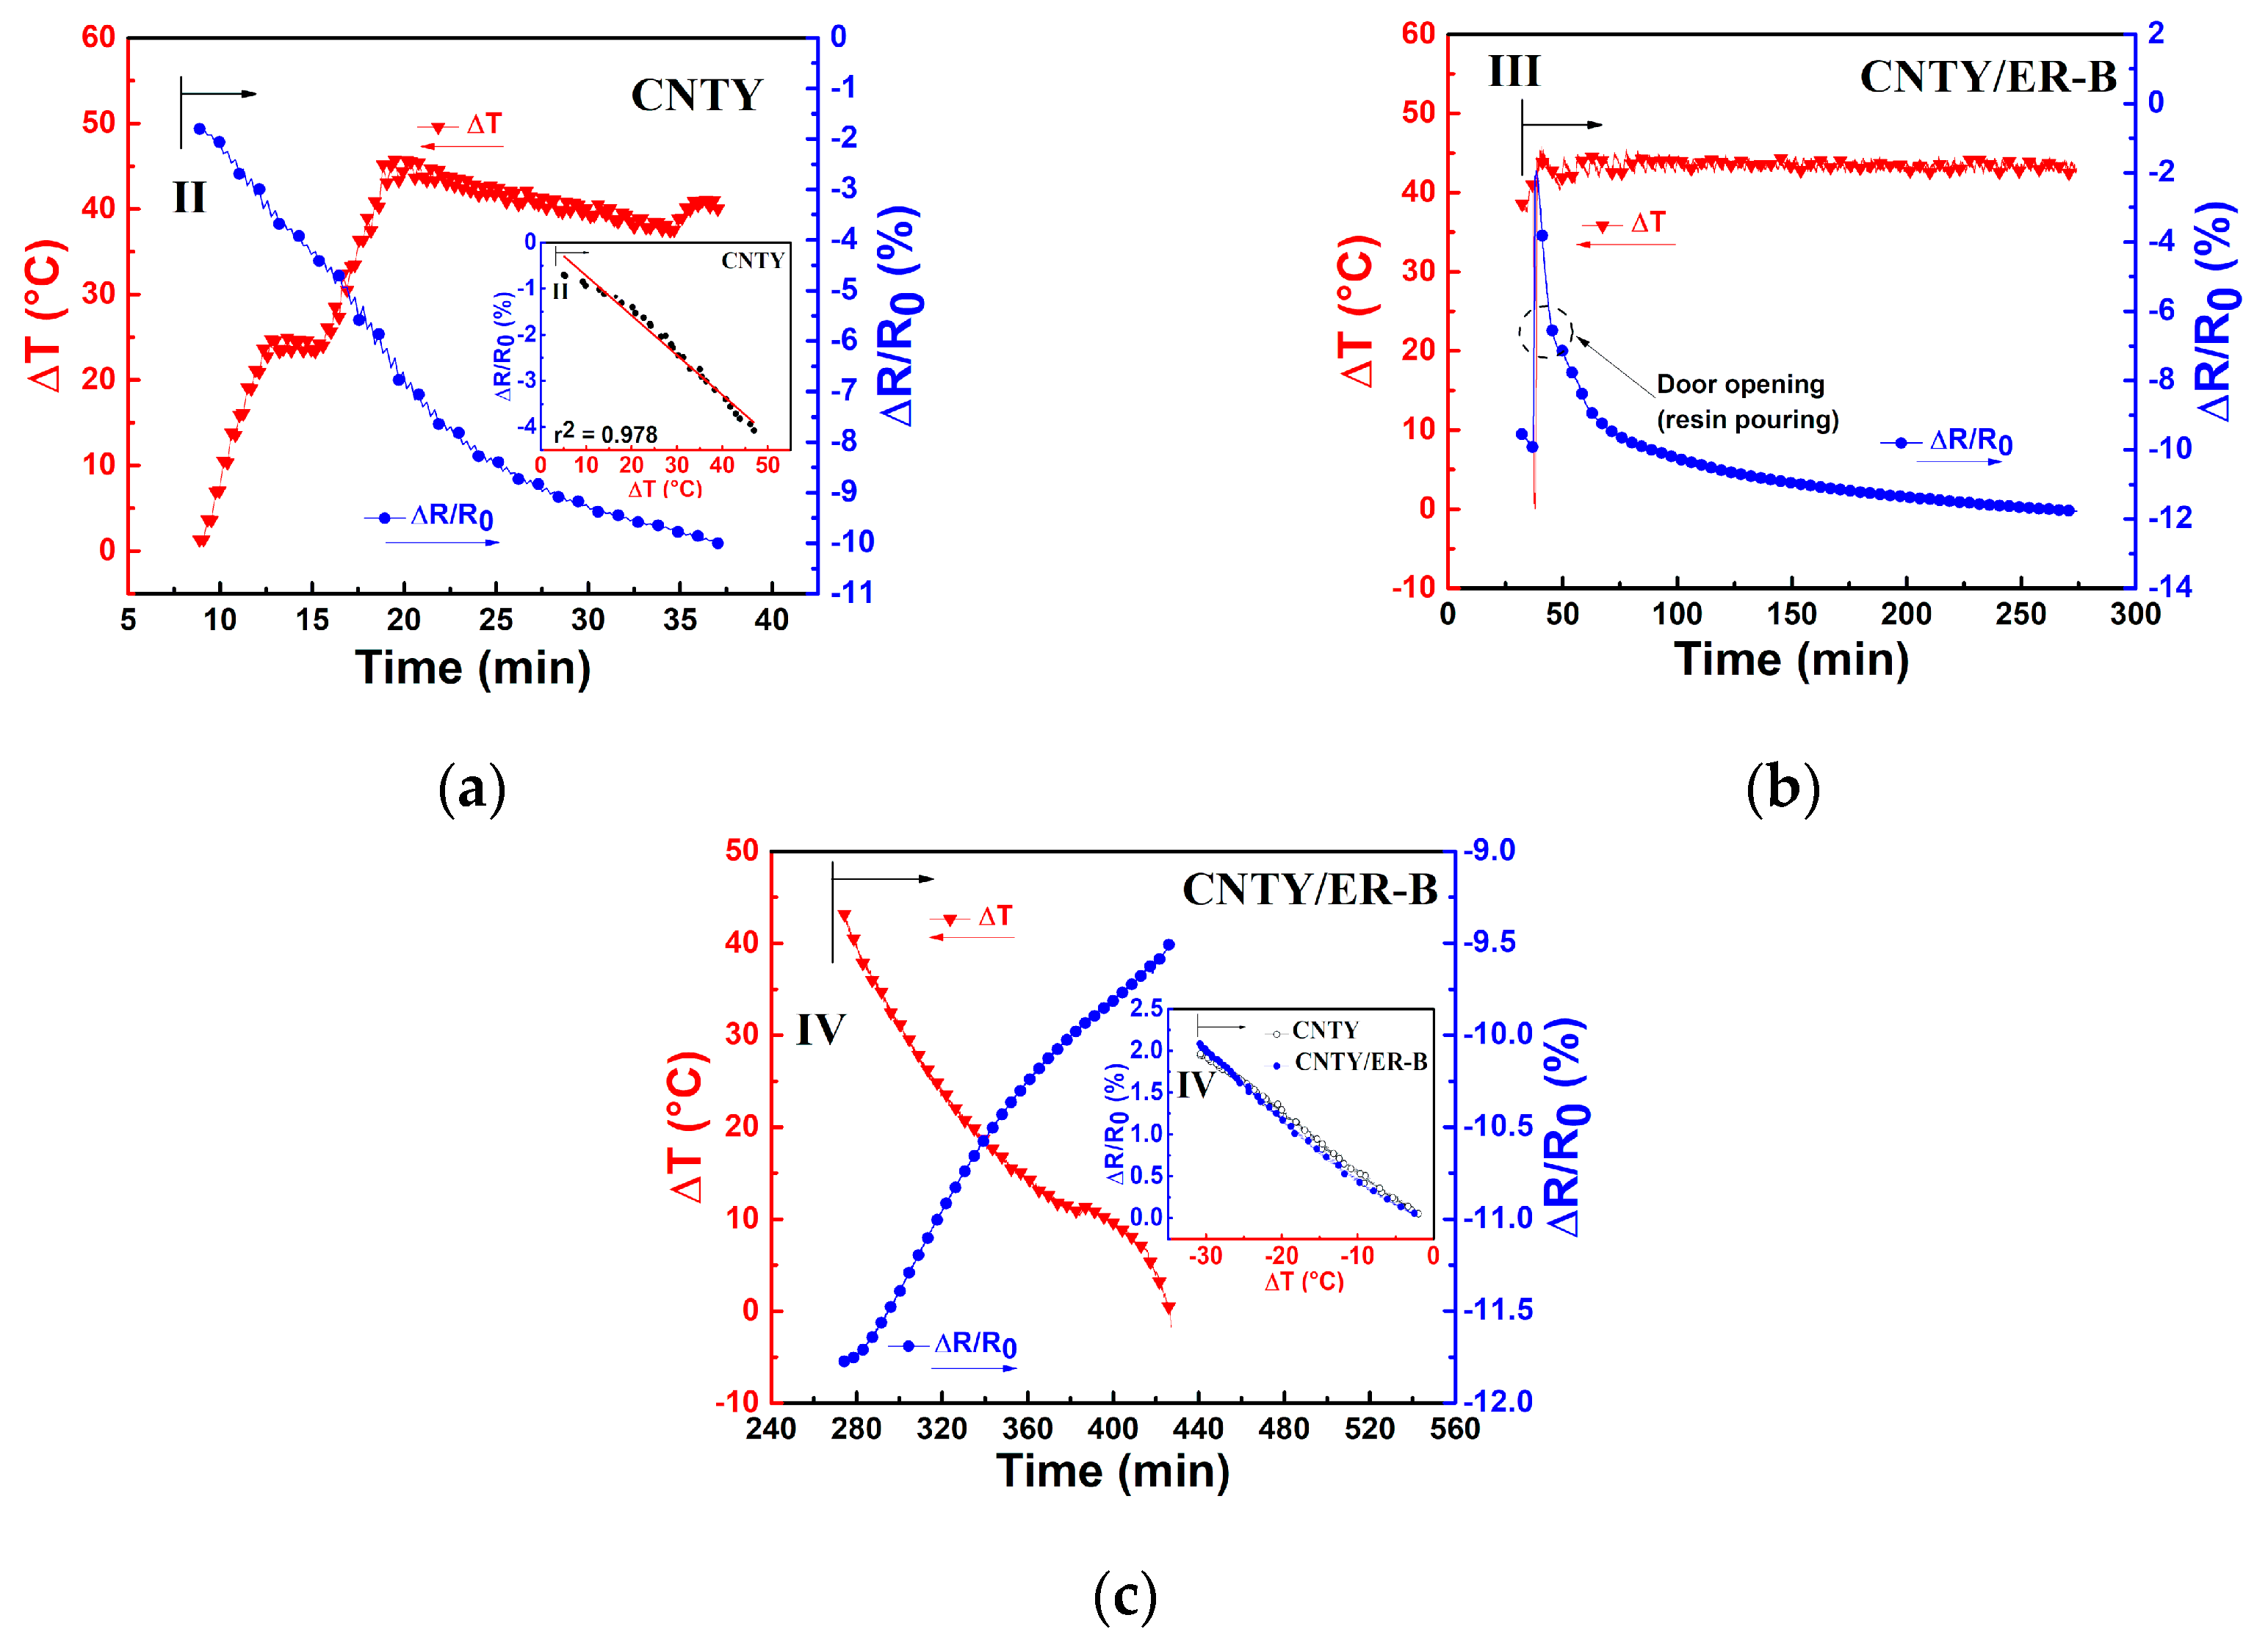
3.1. Electrical Response of CNTY During Resin Curing Using a Temperature Curing Program
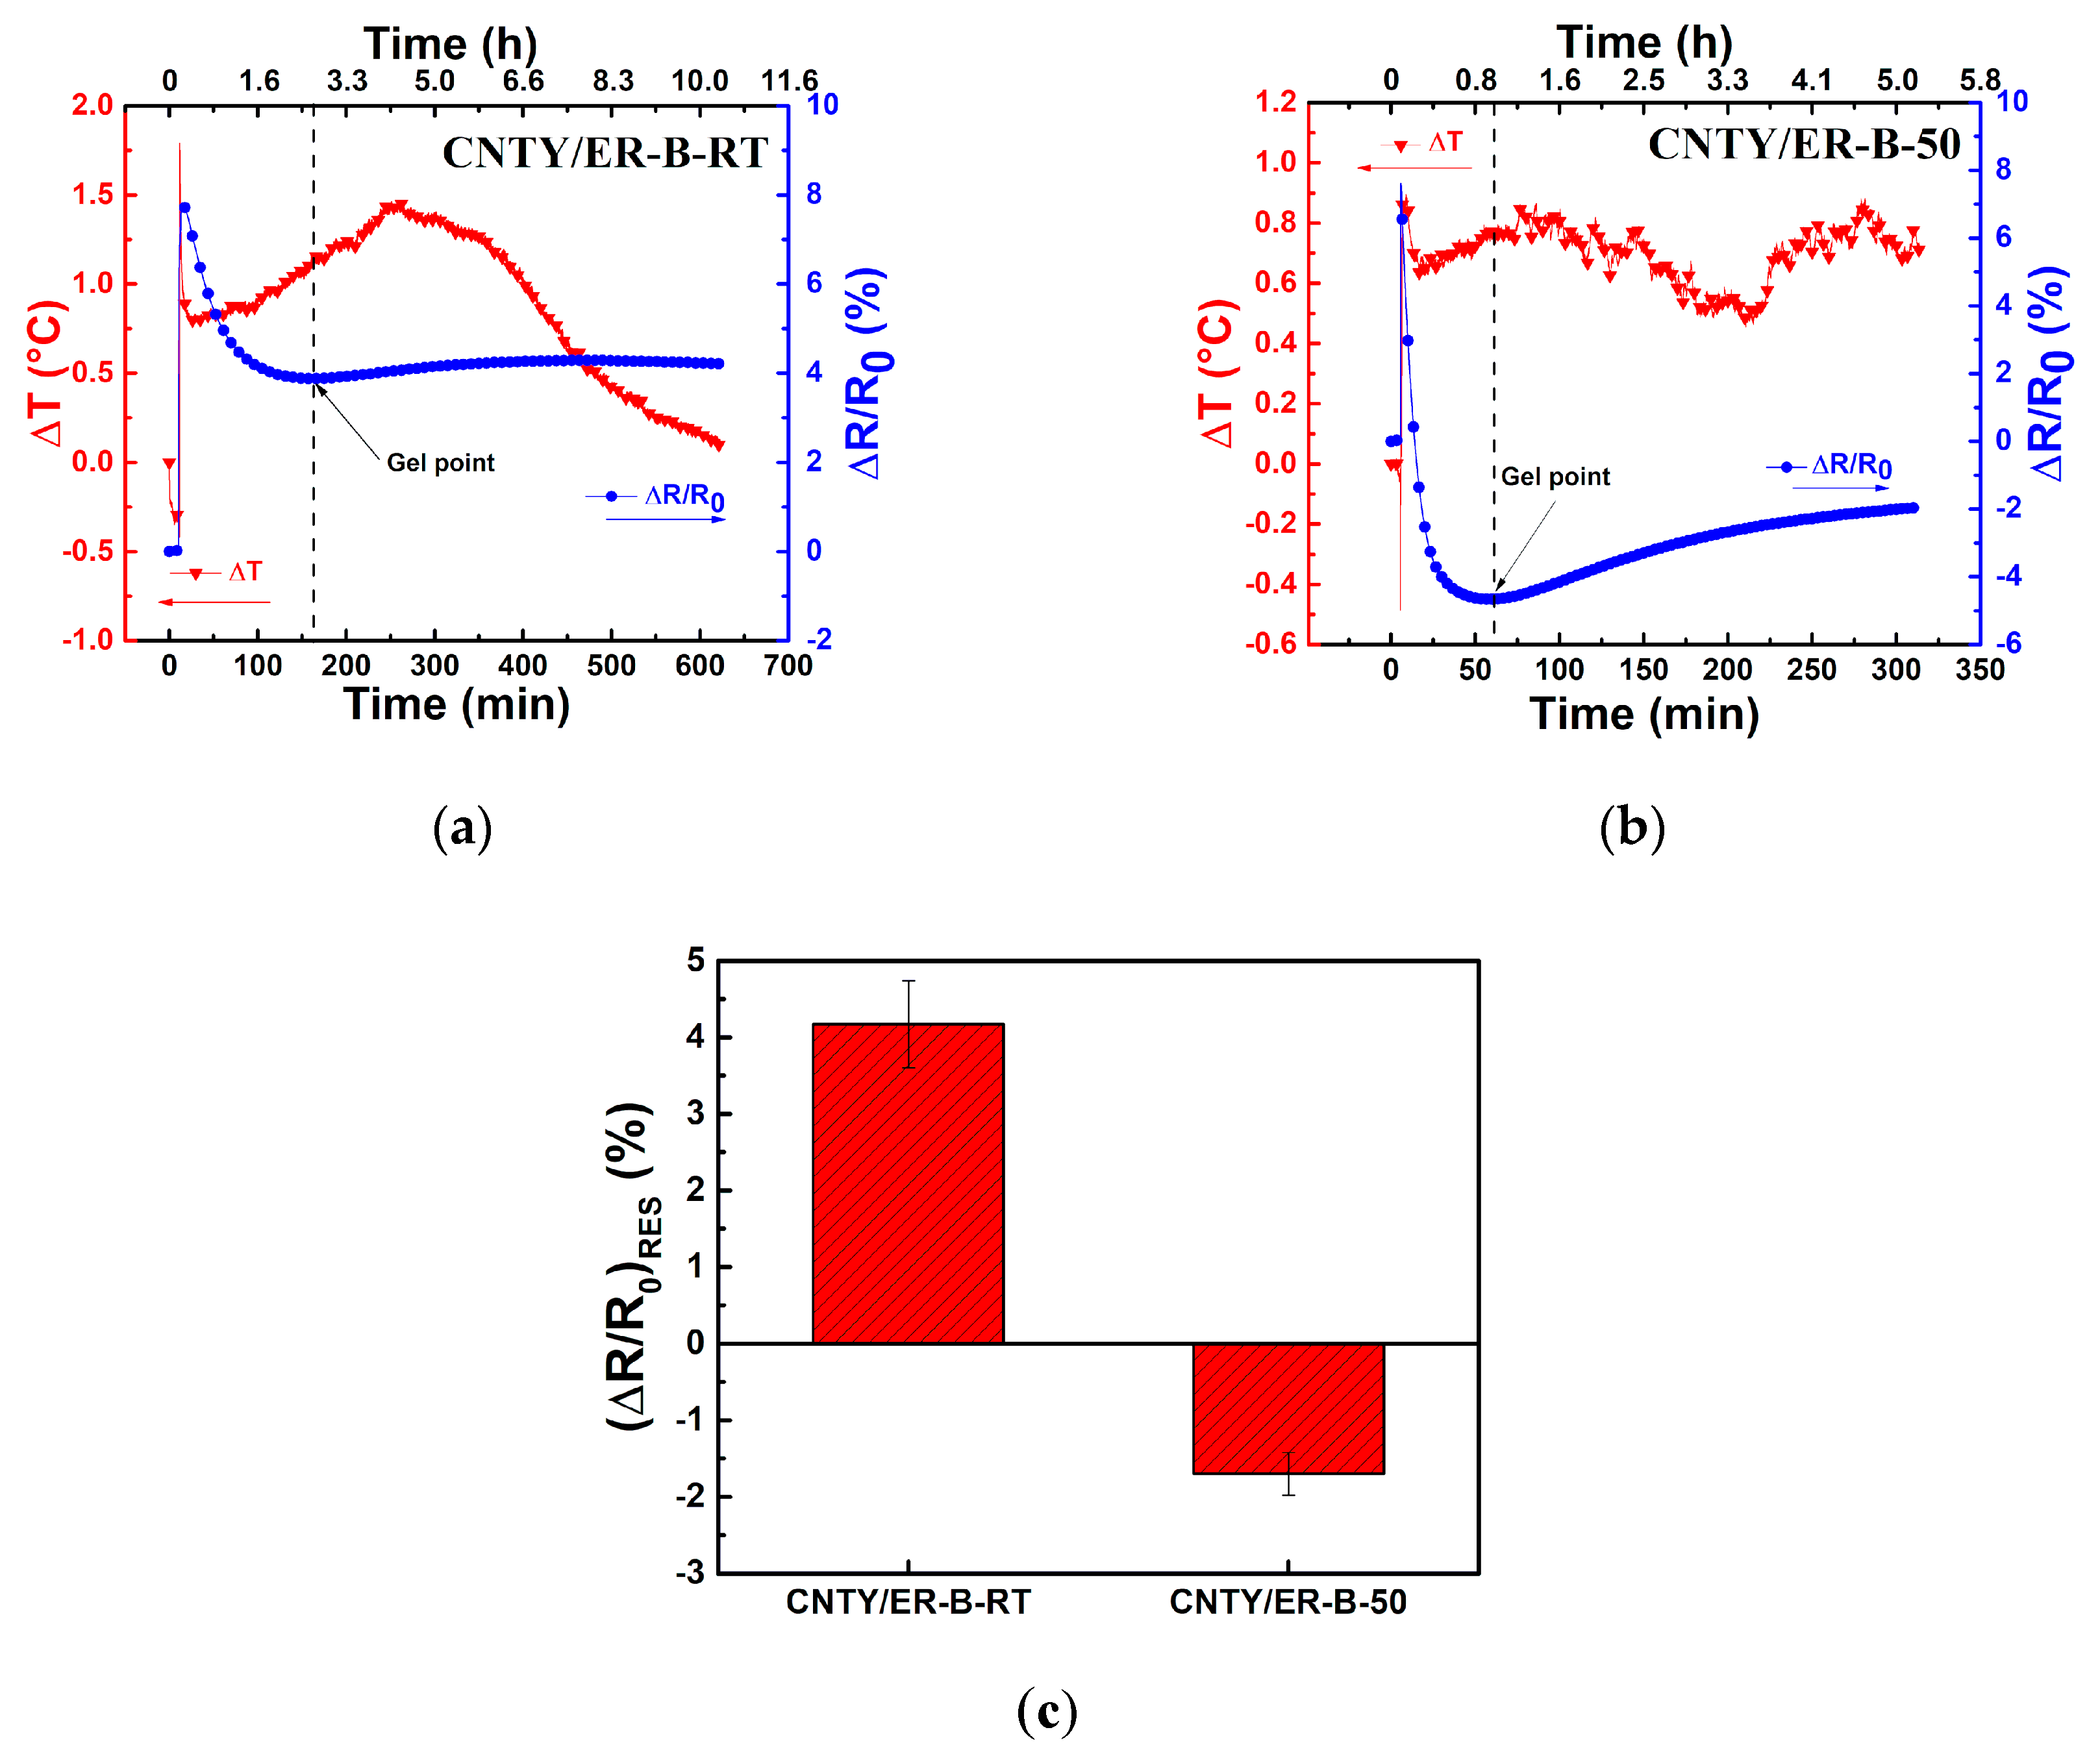
3.2. Electrical Response of CNTY during Resin Curing at Room Temperature
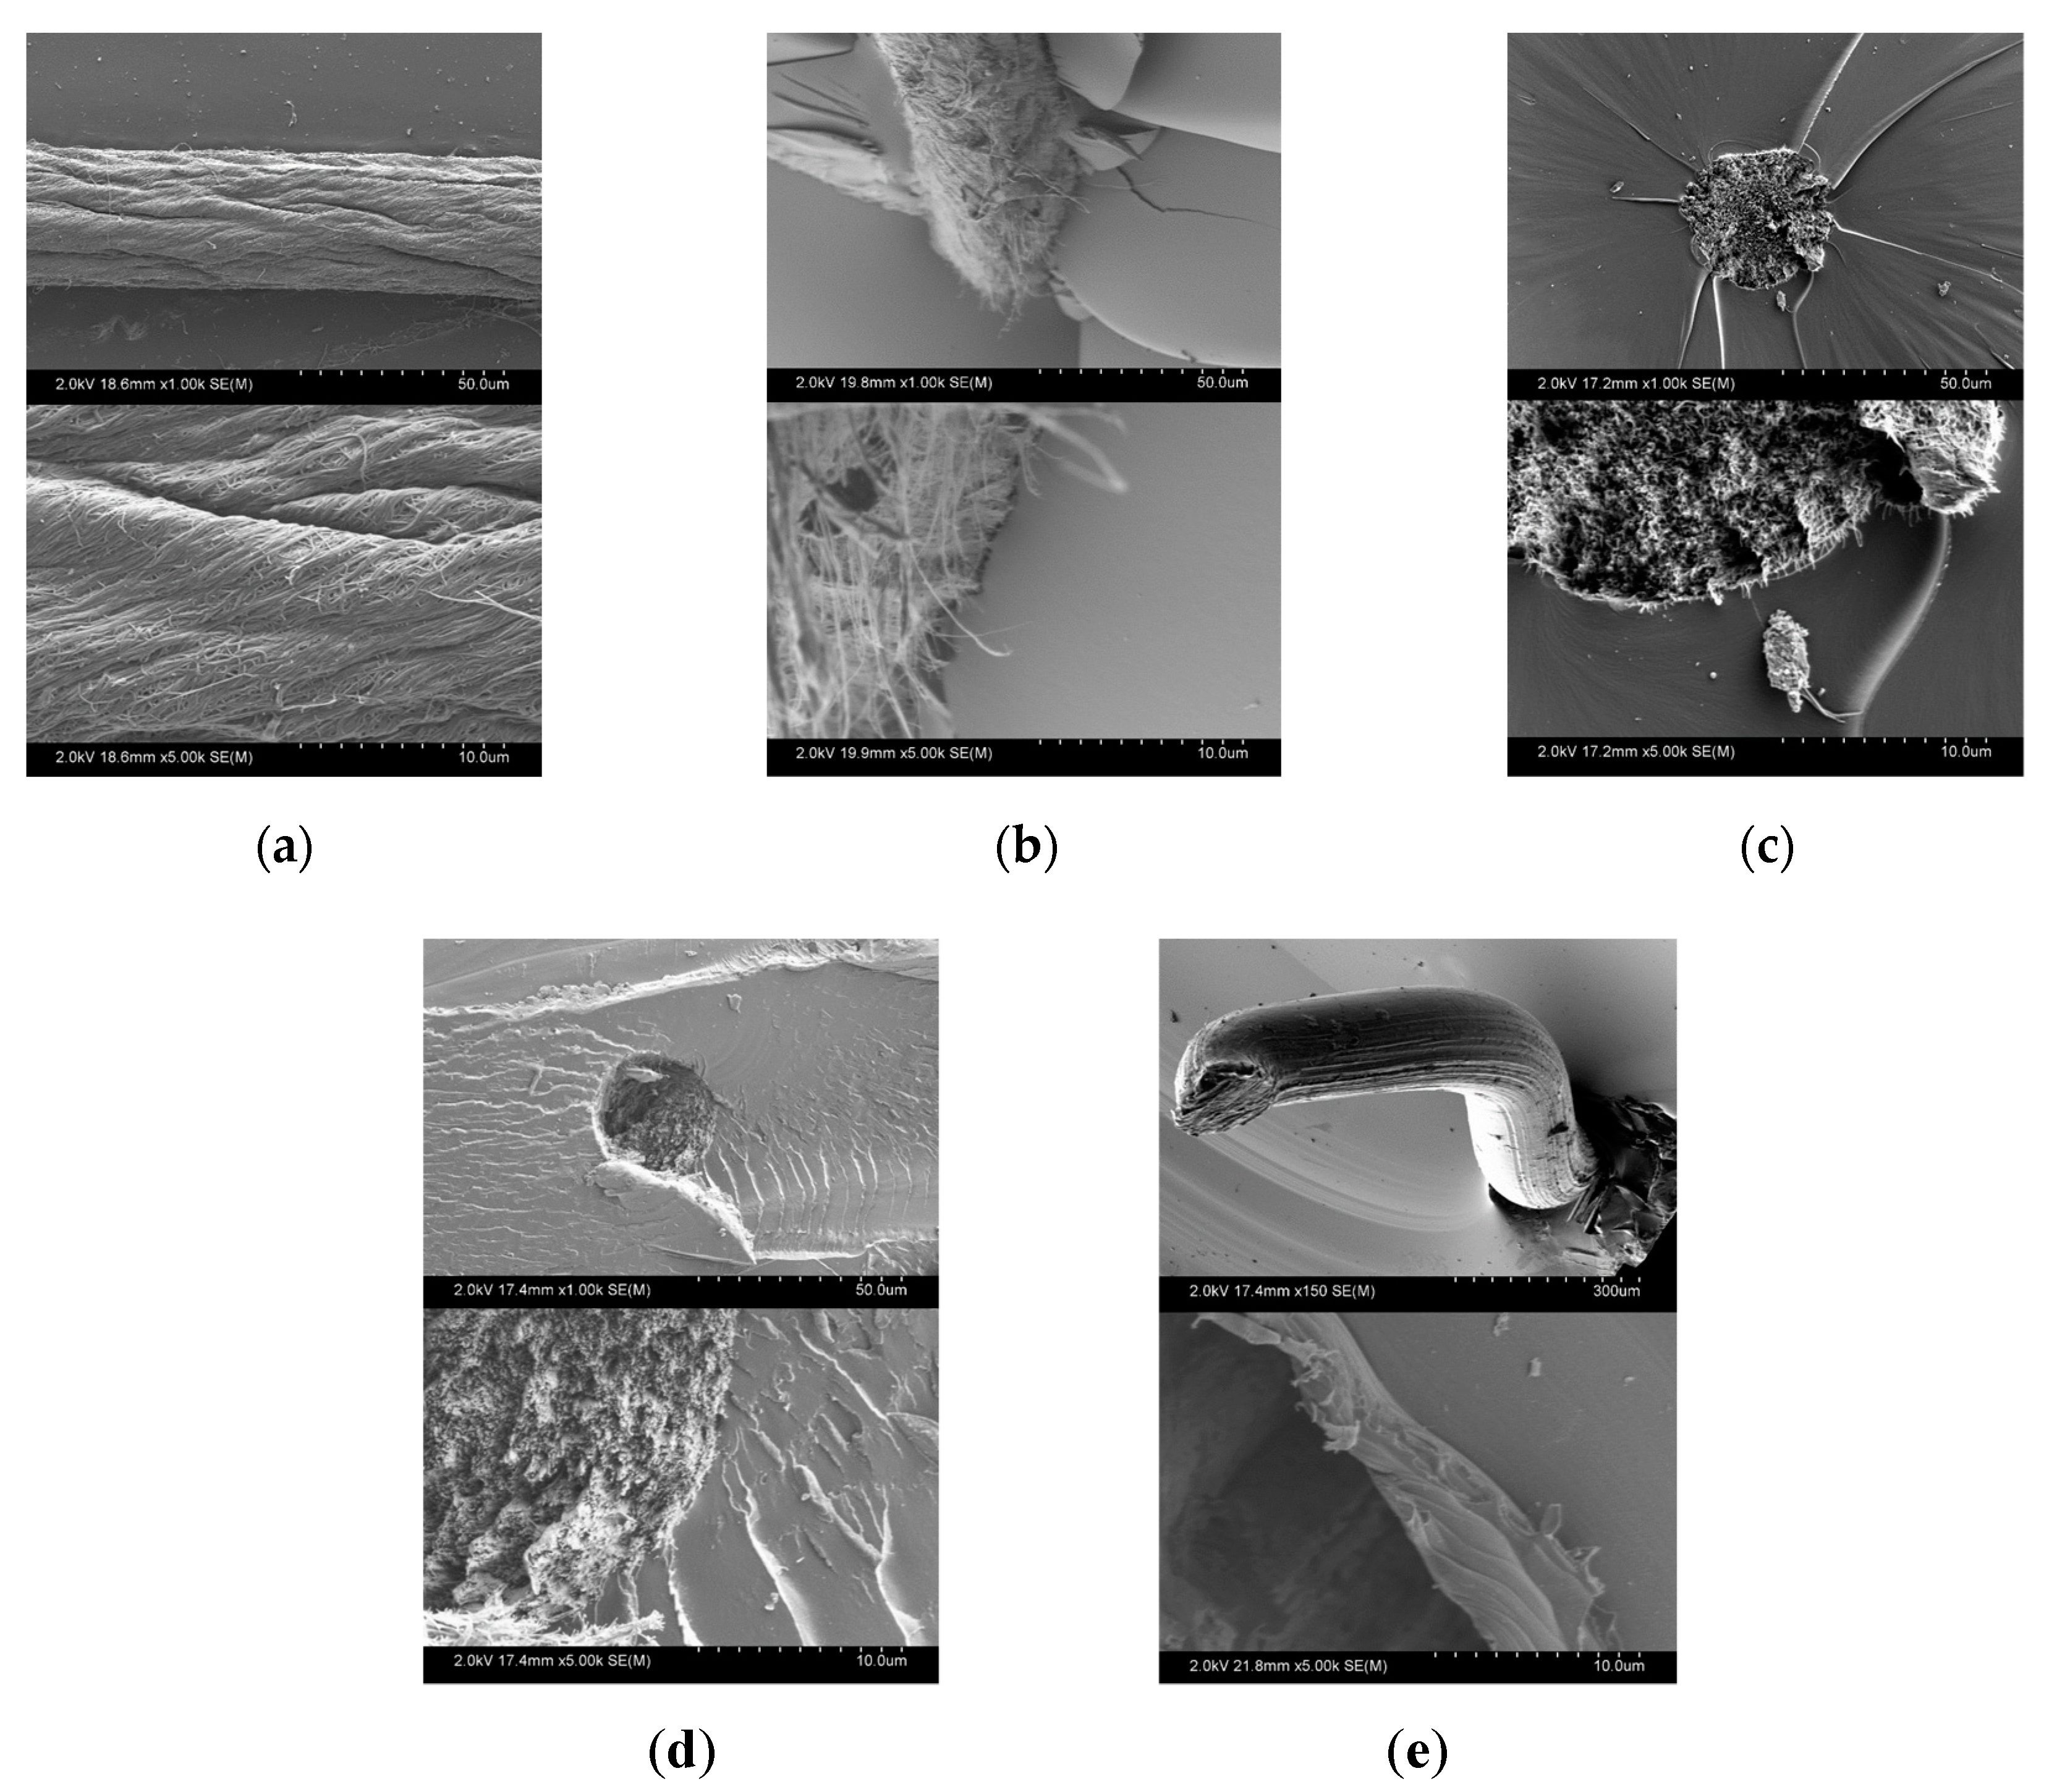
3.3. Electron Microscopy Observations of CNTY Wetting
4. Conclusions
Supplementary Materials
Author Contributions
Funding
Acknowledgments
Conflicts of Interest
References
- Vilatela, J.J.; Khare, R.; Windle, A.H. The hierarchical structure and properties of multifunctional carbon nanotube fibre composites. Carbon 2012, 50, 1227–1234. [Google Scholar] [CrossRef]
- Zhang, M.; Atkinson, K.R.; Baughman, R.H. Multifunctional carbon nanotube yarns by downsizing an ancient technology. Science 2004, 306, 1358–1361. [Google Scholar] [CrossRef]
- Anike, J.C.; Belay, K.; Abot, J.L. Effect of twist on the electromechanical properties of carbon nanotube yarns. Carbon 2019, 142, 491–503. [Google Scholar] [CrossRef]
- Jakubinek, M.B.; Johnson, M.B.; White, M.A.; Jayasinghe, C.; Li, G.; Cho, W.; Schulz, M.J.; Shanov, V. Thermal and electrical conductivity of array-spun multi-walled carbon nanotube yarns. Carbon 2012, 50, 244–248. [Google Scholar] [CrossRef]
- Miao, M. Yarn spun from carbon nanotube forest: Production, structure, properties and applications. Particuology 2013, 11, 378–393. [Google Scholar] [CrossRef]
- Behabtu, N.; Young, C.C.; Tsentalovich, D.E.; Kleinerman, O.; Wang, X.; Ma, A.W.; Bengio, E.A.; ter Waarbeek, R.F.; de Jong, J.J.; Hoogerwerf, R.E.; et al. Strong, light, multifunctional fibers of carbon nanotubes with ultrahigh conductivity. Science 2013, 339, 182–186. [Google Scholar] [CrossRef] [PubMed]
- Abot, J.L.; Schulz, M.J.; Song, Y.; Medikonda, S.; Rooy, N. Novel distributed strain sensing in polymeric materials. Smart Mater. Struct. 2010, 19, 085007. [Google Scholar] [CrossRef]
- Anike, J.C.; Le, H.H.; Brodeur, G.E.; Kadavan, M.M.; Abot, J.L. Piezoresistive response of integrated CNT yarns under compression and tension: The effect of lateral constraint. J. Carbon Res. 2017, 3, 14. [Google Scholar] [CrossRef]
- Anike, J.C.; Belay, K.; Abot, J.L. Piezoresistive response of carbon nanotube yarns under tension: Parametric effects and phenomenology. New Carbon Mater. 2018, 33, 140–154. [Google Scholar] [CrossRef]
- Anile, J.C.; Bajar, A.; Abot, J.L. Time dependent effects on the coupled mechanical electrical response of carbon nanotube yarns under tensile loading. J. Carbon Res. 2016, 2, 3. [Google Scholar]
- Abot, J.L.; Alosh, T.; Belay, K. Strain dependence of electrical resistance in carbon nanotube yarns. Carbon 2014, 70, 95–102. [Google Scholar] [CrossRef]
- Lu, W.; Zu, M.; Byun, J.H.; Kim, B.S.; Chou, T.W. State of the art of carbon nanotube fibers: Opportunities and challenges. Adv. Mater. 2012, 24, 1805–1833. [Google Scholar] [CrossRef] [PubMed]
- Choi, C.; Lee, J.A.; Choi, A.Y.; Kim, Y.T.; Lepró, X.; Lima, M.D.; Baughman, R.H.; Kim, S.J. Flexible supercapacitors made of carbon nanotube yarn with internal pores. Adv. Mater. 2014, 26, 2059–2065. [Google Scholar] [CrossRef]
- Keller, S.D.; Zaghloul, A.I.; Shanov, V.; Schulz, M.J.; Mast, D.B.; Alvarez, N.T. Electromagnetic simulation and measurement of carbon nanotube thread dipole antennas. IEEE Trans. Nanotechnol. 2014, 13, 394–403. [Google Scholar] [CrossRef]
- Can-Ortiz, A.; Abot, J.L.; Avilés, F. Electrical characterization of carbon based fibers and their application for sensing relaxation-induced piezoresistivity in polymer composites. Carbon 2019, 145, 119–130. [Google Scholar] [CrossRef]
- Lange, J.; Toll, S.; Manson, J.A.E.; Hult, A. Residual stress build-up in thermoset films cured above their ultimate glass transition temperature. Polymer 1995, 36, 3135–3141. [Google Scholar] [CrossRef]
- Ochi, M.; Yamashita, K.; Shimbo, M. The mechanism for occurrence of internal stress during curing epoxide resins. J. Appl. Polym. Sci. 1991, 43, 2013–2019. [Google Scholar] [CrossRef]
- Nakamura, Y.; Yamaguchi, M.; Iko, K.; Okubo, M.; Matsumoto, T. Internal stress of epoxy resin modified with acrylic polymers containing functional groups produced by in situ UV radiation polymerization. Polymer 1990, 31, 2066–2070. [Google Scholar] [CrossRef]
- Li, C.; Potter, K.; Wisnom, M.R.; Stringer, G. In-situ measurement of chemical shrinkage of MY750 epoxy resin by a novel gravimetric method. Compos. Sci. Technol. 2004, 64, 55–64. [Google Scholar] [CrossRef]
- Wang, X.; Chung, D. Residual stress in carbon fiber embedded in epoxy, studied by simultaneous measurement of applied stress and electrical resistance. Compos. Interfaces 1997, 5, 277–281. [Google Scholar] [CrossRef]
- Chung, D.L. Thermal analysis of carbon fiber polymer matrix composites by electrical resistance measurement. Thermochim. Acta 2000, 364, 121–132. [Google Scholar] [CrossRef]
- Hill, R.R., Jr.; Muzumdar, S.V.; Lee, L.J. Analysis of volumetric changes of unsaturated polyester resins during curing. Polym. Eng. Sci. 1995, 35, 852–859. [Google Scholar] [CrossRef]
- Holst, M.; Schänzlin, K.; Wenzel, M.; Xu, J.; Lellinger, D.; Alig, I. Time-resolved method for the measurement of volume changes during polymerization. J. Polym. Sci. Part B Polym. Phys. 2005, 43, 2314–2325. [Google Scholar] [CrossRef]
- Yu, H.; Mhaisalkar, S.; Wong, E. Cure shrinkage measurement of nonconductive adhesives by means of a thermomechanical analyzer. J. Electron. Mater. 2005, 34, 1177–1182. [Google Scholar] [CrossRef]
- Chung, D.D.L. Fibrous composite interfaces studied by electrical resistance measurement. Adv. Eng. Mater. 2000, 2, 788–796. [Google Scholar] [CrossRef]
- Wang, X.; Chung, D.L. Piezoresistive behavior of carbon fiber in epoxy. Carbon 1997, 10, 1649–1651. [Google Scholar] [CrossRef]
- Crasto, A.; Kim, R. Using carbon fiber piezoresistivity to measure residual stresses in composites. In Proceedings of the American Society for Composites 8th Technical Conference; Technomic Publishing AG: Basel, Switzerland, 1993; pp. 162–173. [Google Scholar]
- Tzounis, L.; Liebscher, M.; Tzounis, A.; Petinakis, E.; Paipetis, A.S.; Mäder, E.; Stamm, M. CNT grafted glass fibers as a smart tool for epoxy cure monitoring, UV sensing and thermal energy harvesting in model composites. RSC Adv. 2016, 6, 55514–55525. [Google Scholar] [CrossRef]
- Huang, Y.; Young, R. Interfacial behavior in high temperature cured carbon fibre/epoxy resin model composite. Composites 1995, 26, 541–550. [Google Scholar] [CrossRef]
- Ismail, I.M.K. Structure and active surface area of carbon fibers. Carbon 1987, 25, 653–662. [Google Scholar] [CrossRef]
- Qiu, J.; Terrones, J.; Vilatela, J.J.; Vickers, M.E.; Elliott, J.A.; Windle, A.H. Liquid infiltration into carbon nanotube fibers: Effect on structure and electrical properties. ACS Nano 2013, 7, 8412–8422. [Google Scholar] [CrossRef]
- Terrones, J.; Elliot, J.A.; Vilatela, J.J.; Windle, A.H. Electric field-modulated non-ohmic behavior of carbon nanotube fibers in polar liquids. ACS Nano 2014, 8, 8497–8504. [Google Scholar] [CrossRef] [PubMed][Green Version]
- ASTM. ASTM D638 Test Method for Tensile Properties of Plastics; ASTM International: West Conshohocken, PA, USA, 2002. [Google Scholar]
- Briman, M.; Bradley, K.; Gruner, G. Source of 1/f noise in carbon nanotube devices. J. Appl. Phys. 2006, 100, 013505. [Google Scholar] [CrossRef]
- Collins, P.G.; Fuhrer, M.; Zettl, A. 1/f noise in carbon nanotubes. Appl. Phys. Lett. 2000, 76, 894–896. [Google Scholar] [CrossRef]
- Soliveres, S.; Gyani, J.; Delseny, C.; Hoffman, A.; Pascal, F. 1/f noise and percolation in carbon nanotube random networks. Appl. Phys. Lett. 2007, 90, 082107. [Google Scholar] [CrossRef]
- Ramos, A.; Pezzin, S.H.; Farias, H.D.; Becker, D.; Bello, R.H.; Coelho, L.A. Conductivity analysis of epoxy/carbon nanotubes composites by dipole relaxation and hopping models. Phys. B Condens. Matter 2016, 499, 57–63. [Google Scholar] [CrossRef]
- Fernández-Toribio, J.C.; Iñiguez-Rábago, A.; González, J.V.C.; Ridruejo, A.; Vilatela, J.J. A composite fabrication sensor based on electrochemical doping of carbon nanotube yarns. Adv. Funct. Mater. 2016, 26, 7139–7147. [Google Scholar] [CrossRef]
- Abdelkader, A.F.; White, J.R. Curing characteristics and internal stresses in epoxy coating: Effect of crosslinking agent. J. Mater. Sci. 2005, 40, 1843–1854. [Google Scholar] [CrossRef]
- Guthy, A.E.A.C.; Zhang, M.; Fang, S.; Zakhidov, A.A.; Fischer, J.E.; Baughman, R.H. Thermal transportation in MWCNT sheets and yarns. Carbon 2007, 45, 2880–2888. [Google Scholar]
- Ebbesen, T.; Lezec, H.; Hiura, H.; Bennett, J.; Ghaemi, H.; Thio, T. Electrical conductivity of individual carbon nanotubes. Nature 1996, 382, 54. [Google Scholar] [CrossRef]
- Nysten, B.; Issi, J.P.; Barton, R., Jr.; Boyington, D. Microstructure and negative magnetoresistance in pitch-derived carbon fibres. J. Phys. D Appl. Phys. 1991, 24, 714. [Google Scholar] [CrossRef]
- Lekawa-Raus, A.; Walczak, K.; Kozlowski, G.; Wozniak, M.; Hopkins, S.C.; Koziol, K.K. Resistance-temperature dependence in carbon nanotube fibres. Carbon 2015, 84, 118–123. [Google Scholar] [CrossRef]
- Jung, Y.; Kim, T.; Park, C.R. Effect of polymer infiltration on structure and properties of carbon nanotube yarns. Carbon 2015, 88, 60–69. [Google Scholar] [CrossRef]
- Sui, X.; Greenfeld, I.; Cohen, H.; Zhang, X.; Li, Q.; Wagner, H.D. Multilevel composite using carbon nanotube fibers (CNTF). Compos. Sci. Technol. 2016, 137, 35–43. [Google Scholar] [CrossRef]
- ASTM. ASTM D2471 Standard Test Method for Gel Time and Peak Exothermic Temperature of Reacting Thermosetting Resins; ASTM International: West Conshohocken, PA, USA, 2002. [Google Scholar]


| Label | Description and Curing Conditions | Physical Property | ||
|---|---|---|---|---|
| Liquid Viscosity, (cP) * | Coefficient of Thermal Expansion, β (×10−6 K−1) | Elastic Modulus, E (GPa) | ||
| ER-A | EPON 862 and EPIKURE W 100:23 by weight cured @ 130 °C for 1.5 h | 1625 ± 8 | 57.8 ± 0.2 | 3.06 ± 0.16 |
| @ 30 °C | (0.25 to 25 °C) | |||
| 59 ± 19 | 179 ± 0.6 | |||
| @ 130 °C | (100 to 175 °C) | |||
| ER-B | Toolfusion 1A/1B 100:20 by weight cured @ 60 °C for 4 h | 56.4 ± 0.8 | 3.26 ± 0.16 | |
| (0.25 to 25 °C) | ||||
| 170 ± 4.2 | ||||
| (100 to 175 °C) | ||||
| ER-B-RT | Toolfusion 1A/1B 100:20 by weight cured @ RT for 10 h | 953 ± 21 | 59.4 ± 2.2 | 3.53 ± 0.10 |
| @ 30 °C | (0.25 to 25 °C) | |||
| 115 ± 30 | 169 ± 4.9 | |||
| @ 60 °C | (100 to 175 °C) | |||
| ER-B-50 | Toolfusion 1A/1B 100:50 by weight cured @ RT for 5 h | 53.9 ± 2.5 | 3.71 ± 0.17 | |
| (0.25 to 25 °C) | ||||
| 171 ± 3.5 | ||||
| (100 to 175 °C) | ||||
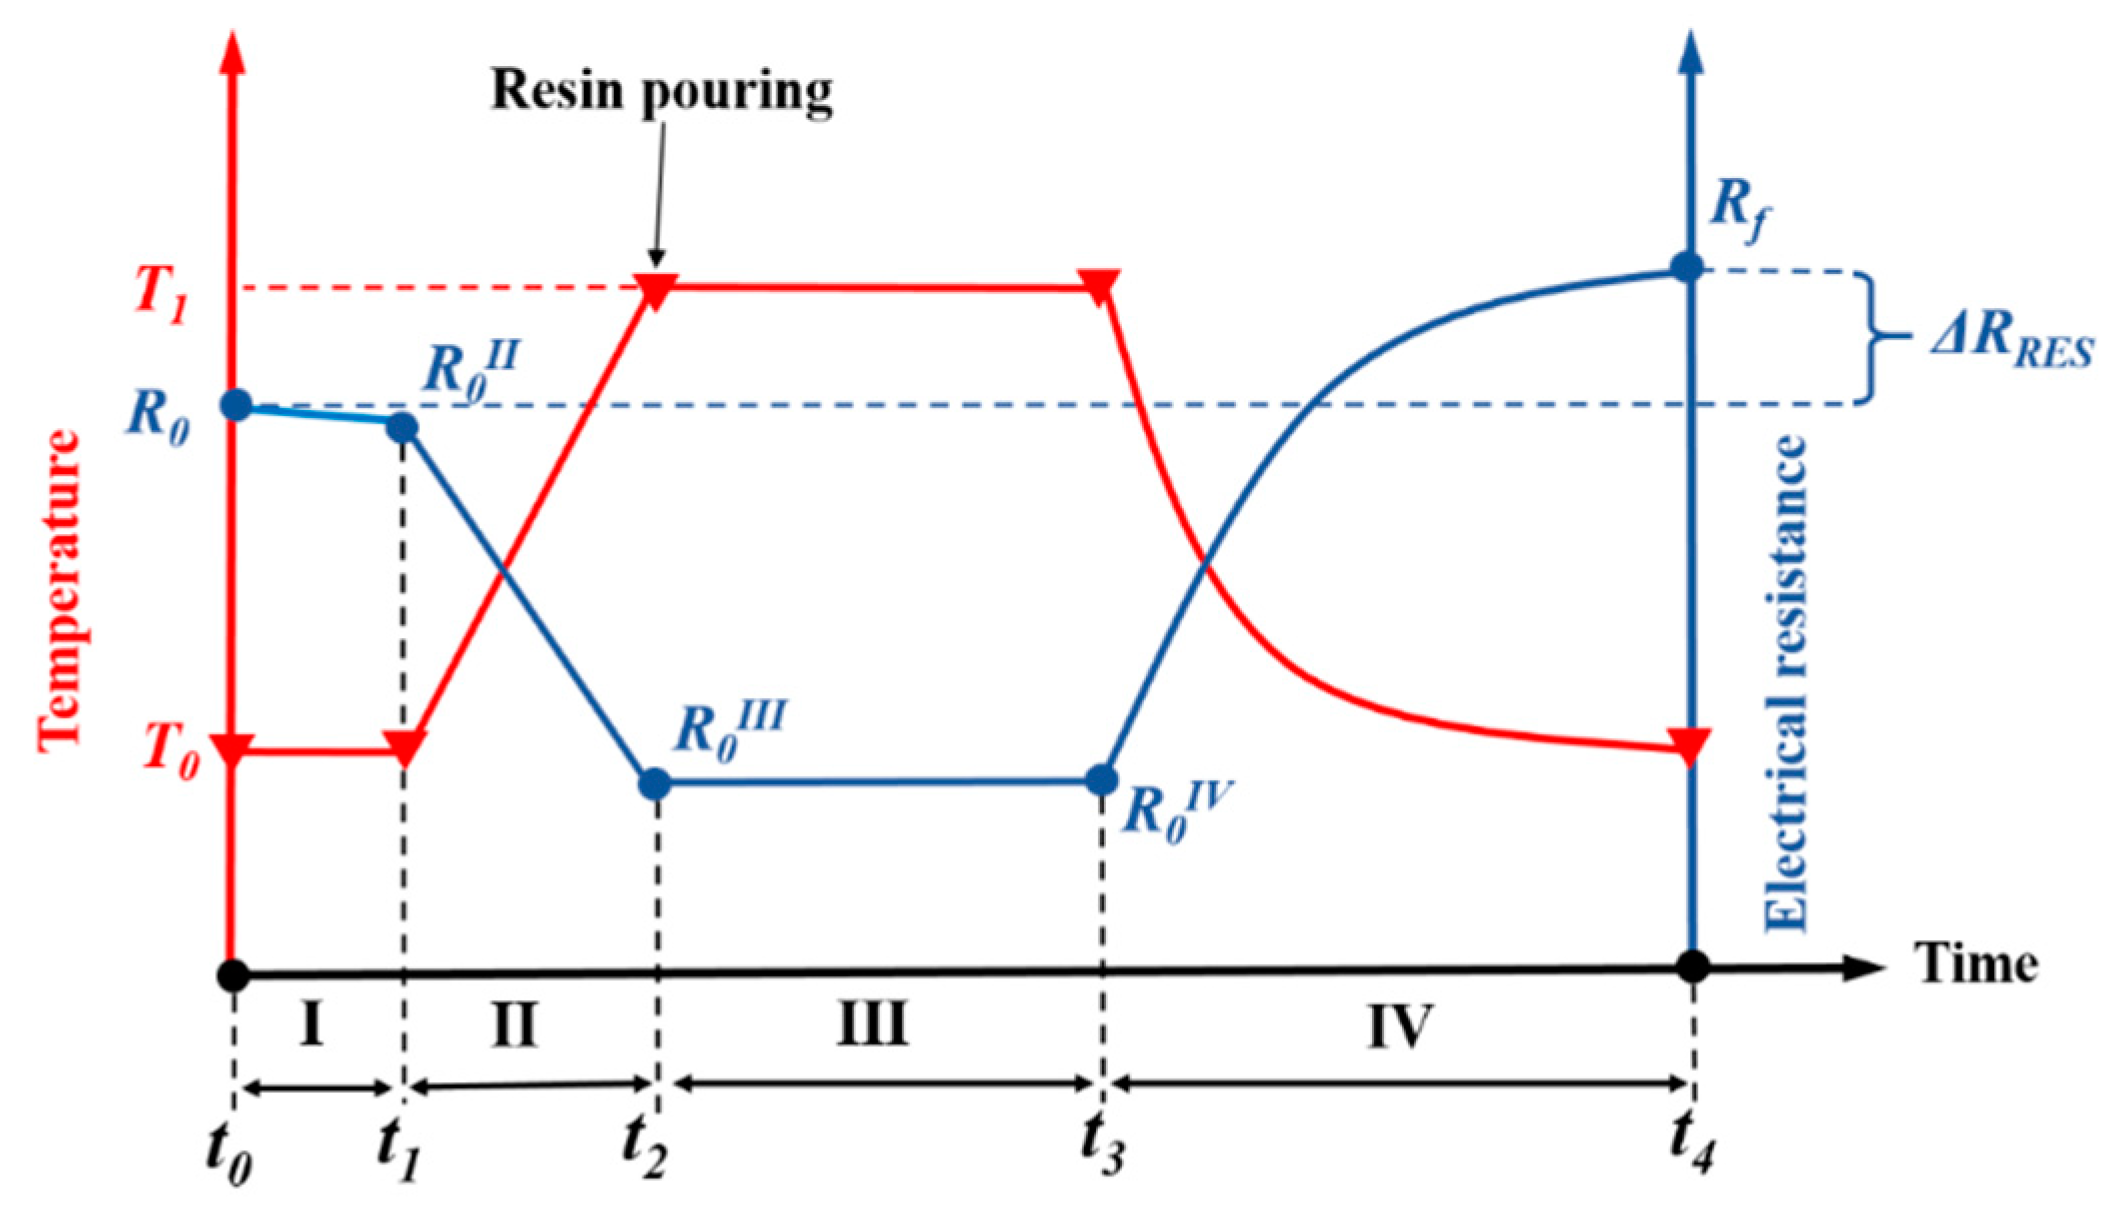
| Zone | Time Interval | Electrical Resistance Change | Description of Zone | Focus/Parameter Characterized |
|---|---|---|---|---|
| I | t0–t1 | R0II–R0 | Initial constant temperature (stabilization for 10 min). | Signal to noise ratio, Equation (1). |
| II | t1–t2 | R0III–R0II | Ramping from T0 to T1 at a heating rate of ~1.8 °C/min. | Thermoresistive sensitivity of the CNTY under heating, Equation (2). |
| III | t2–t3 | R0IV–R0III | Dwell at curing temperature (T1). | Effect of CNTY/resin interaction during curing, Equation (3). |
| IV | t3–t4 | Rf–R0IV | Cooling down to T0 (cooling rate of ~0.5 °C/min). | Thermoresistive sensitivity of CNTY embedded in resin and freestanding CNTY during cooling, Equation (4), and normalized residual electrical resistance, Equation (5). |
| Zone | Parameter | CNTY/ER-A | CNTY/ER-B |
|---|---|---|---|
| I | SNRCNTY (dB) | 29.0 ± 4.5 | |
| II | αHCNTY (°C−1) | −8.5 × 10⁻⁴ ± 1.0 × 10⁻⁵ | |
| III | (ΔR/R0)III (%) | 12.0 ± 1.4 | 9.0 ± 0.4 |
| (ΔR/R0)IIICNTY (%) | 2.2 ± 0.2 | 0.6 ± 0.05 | |
| ERP (%) = (ΔR/R0)III − (ΔR/R0)IIICNTY | 9.7 ± 1.1 | 8.4 ± 0.4 | |
| IV | αC (°C−1) | −13.4 × 10⁻⁴ ± 3.2 × 10⁻⁵ | −7.6 × 10⁻⁴ ± 3.3 × 10⁻⁵ |
| αCCNTY (°C−1) | −8.4 × 10⁻⁴ ± 3.2 × 10⁻⁵ | −6.2 × 10⁻⁴ ± 2.5 × 10⁻⁵ | |
| (25 °C ≤ T ≤ 130 °C) | (25 °C ≤ T ≤ 60 °C) | ||
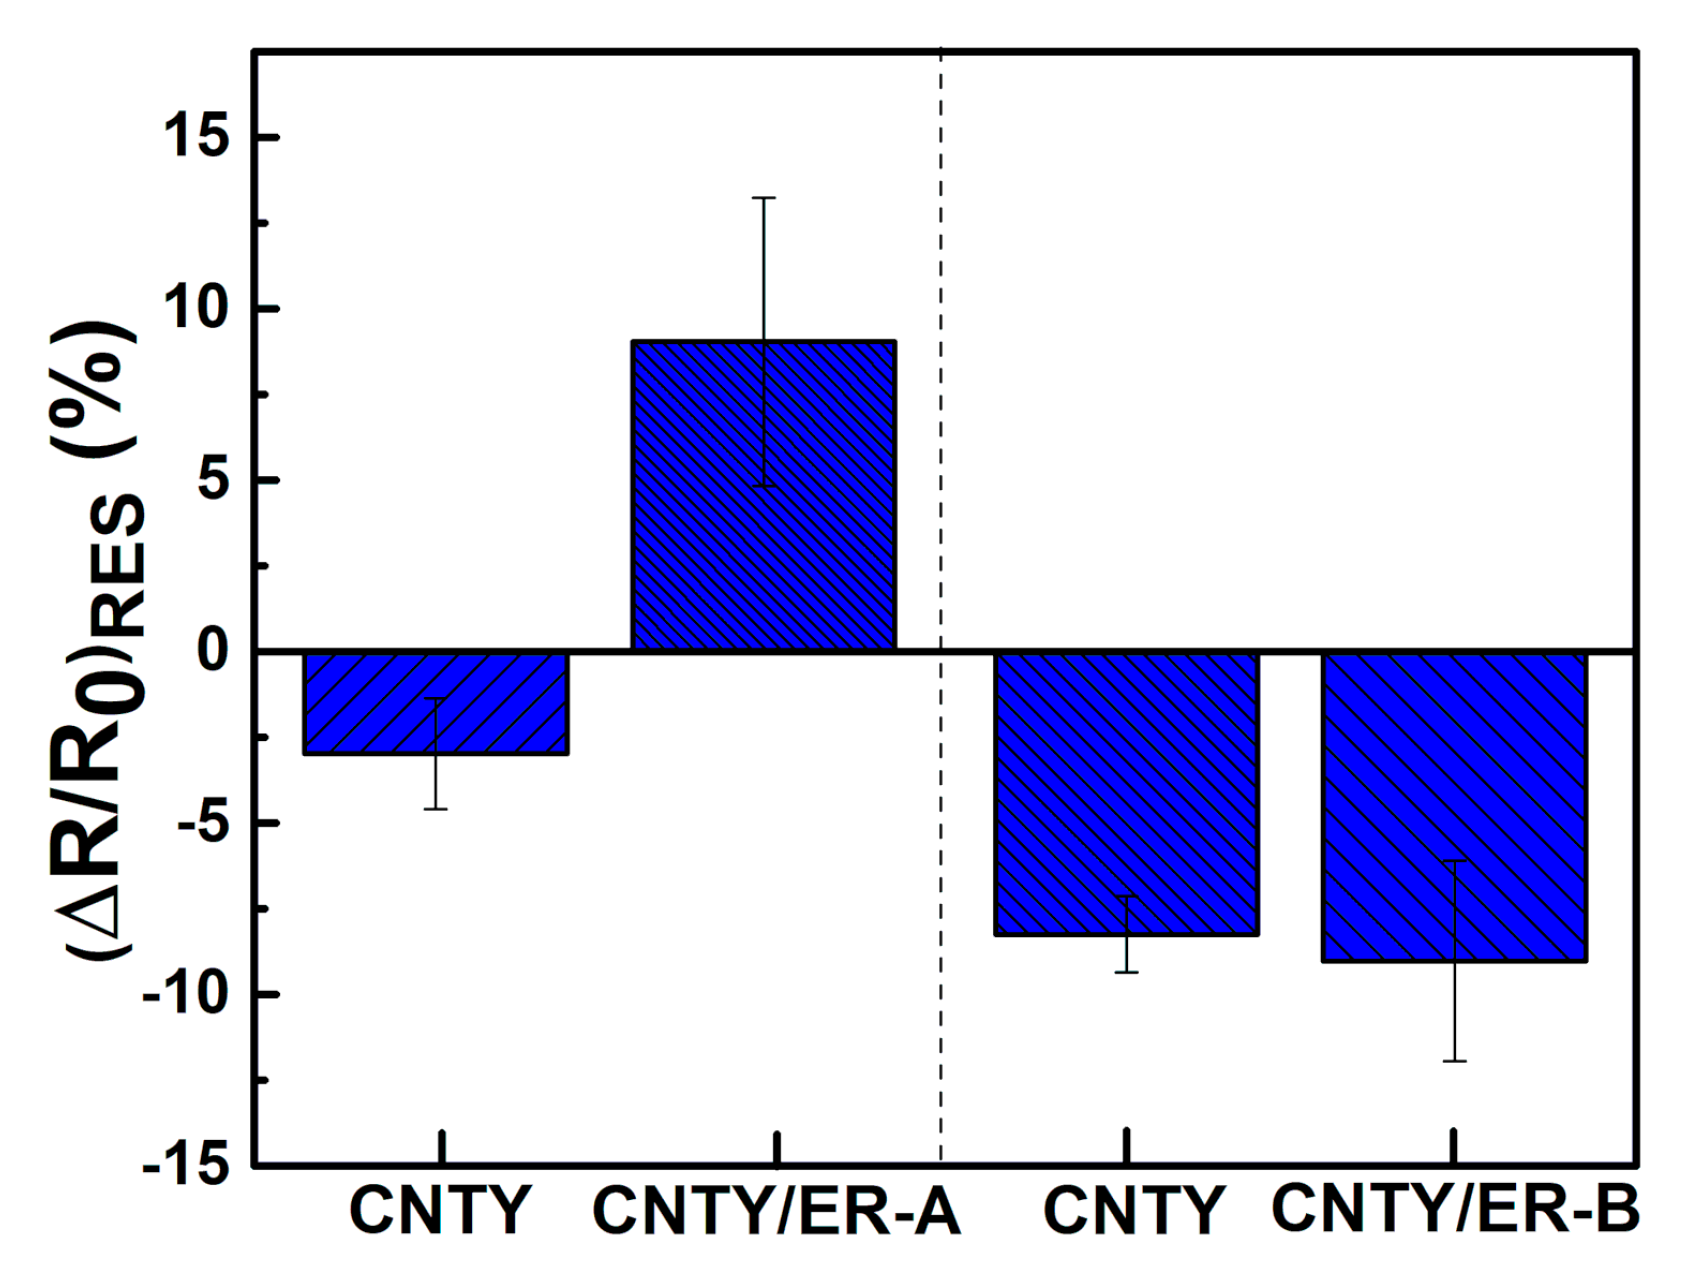
| - | (ΔR/R0)RES (%) | 9.0 ± 4.1 | −9.0 ± 2.9 |
© 2020 by the authors. Licensee MDPI, Basel, Switzerland. This article is an open access article distributed under the terms and conditions of the Creative Commons Attribution (CC BY) license (http://creativecommons.org/licenses/by/4.0/).
Share and Cite
Rodríguez-Uicab, O.; Abot, J.L.; Avilés, F. Electrical Resistance Sensing of Epoxy Curing Using an Embedded Carbon Nanotube Yarn. Sensors 2020, 20, 3230. https://doi.org/10.3390/s20113230
Rodríguez-Uicab O, Abot JL, Avilés F. Electrical Resistance Sensing of Epoxy Curing Using an Embedded Carbon Nanotube Yarn. Sensors. 2020; 20(11):3230. https://doi.org/10.3390/s20113230
Chicago/Turabian StyleRodríguez-Uicab, Omar, Jandro L. Abot, and Francis Avilés. 2020. "Electrical Resistance Sensing of Epoxy Curing Using an Embedded Carbon Nanotube Yarn" Sensors 20, no. 11: 3230. https://doi.org/10.3390/s20113230
APA StyleRodríguez-Uicab, O., Abot, J. L., & Avilés, F. (2020). Electrical Resistance Sensing of Epoxy Curing Using an Embedded Carbon Nanotube Yarn. Sensors, 20(11), 3230. https://doi.org/10.3390/s20113230