Gentle Versus Strong Touch Classification: Preliminary Results, Challenges, and Potentials

 ,
,  ,
, 
Abstract
1. Introduction
2. Materials and Methods
2.1. Participants
2.2. The Sensor
2.3. Data Selection
- Hitting the mannequin’s chest gently/strongly
- Hugging the mannequin gently/strongly
- Hitting the mannequin’s shoulder gently/strongly
- Rubbing the mannequin’s shoulder gently/strongly
- Rubbing the mannequin’s chest gently/strongly
- Hitting the mannequin’s chest gently (Touch1)
- Hugging the mannequin gently (Touch2)
- Hitting the mannequin’s shoulder gently (Touch3)
- Hitting the mannequin’s chest strongly (Touch4)
- Hugging the mannequin’s strongly (Touch5)
- Hitting the mannequin’s shoulder strongly (Touch6)
2.4. Analysis
2.4.1. Touch Feature Computation
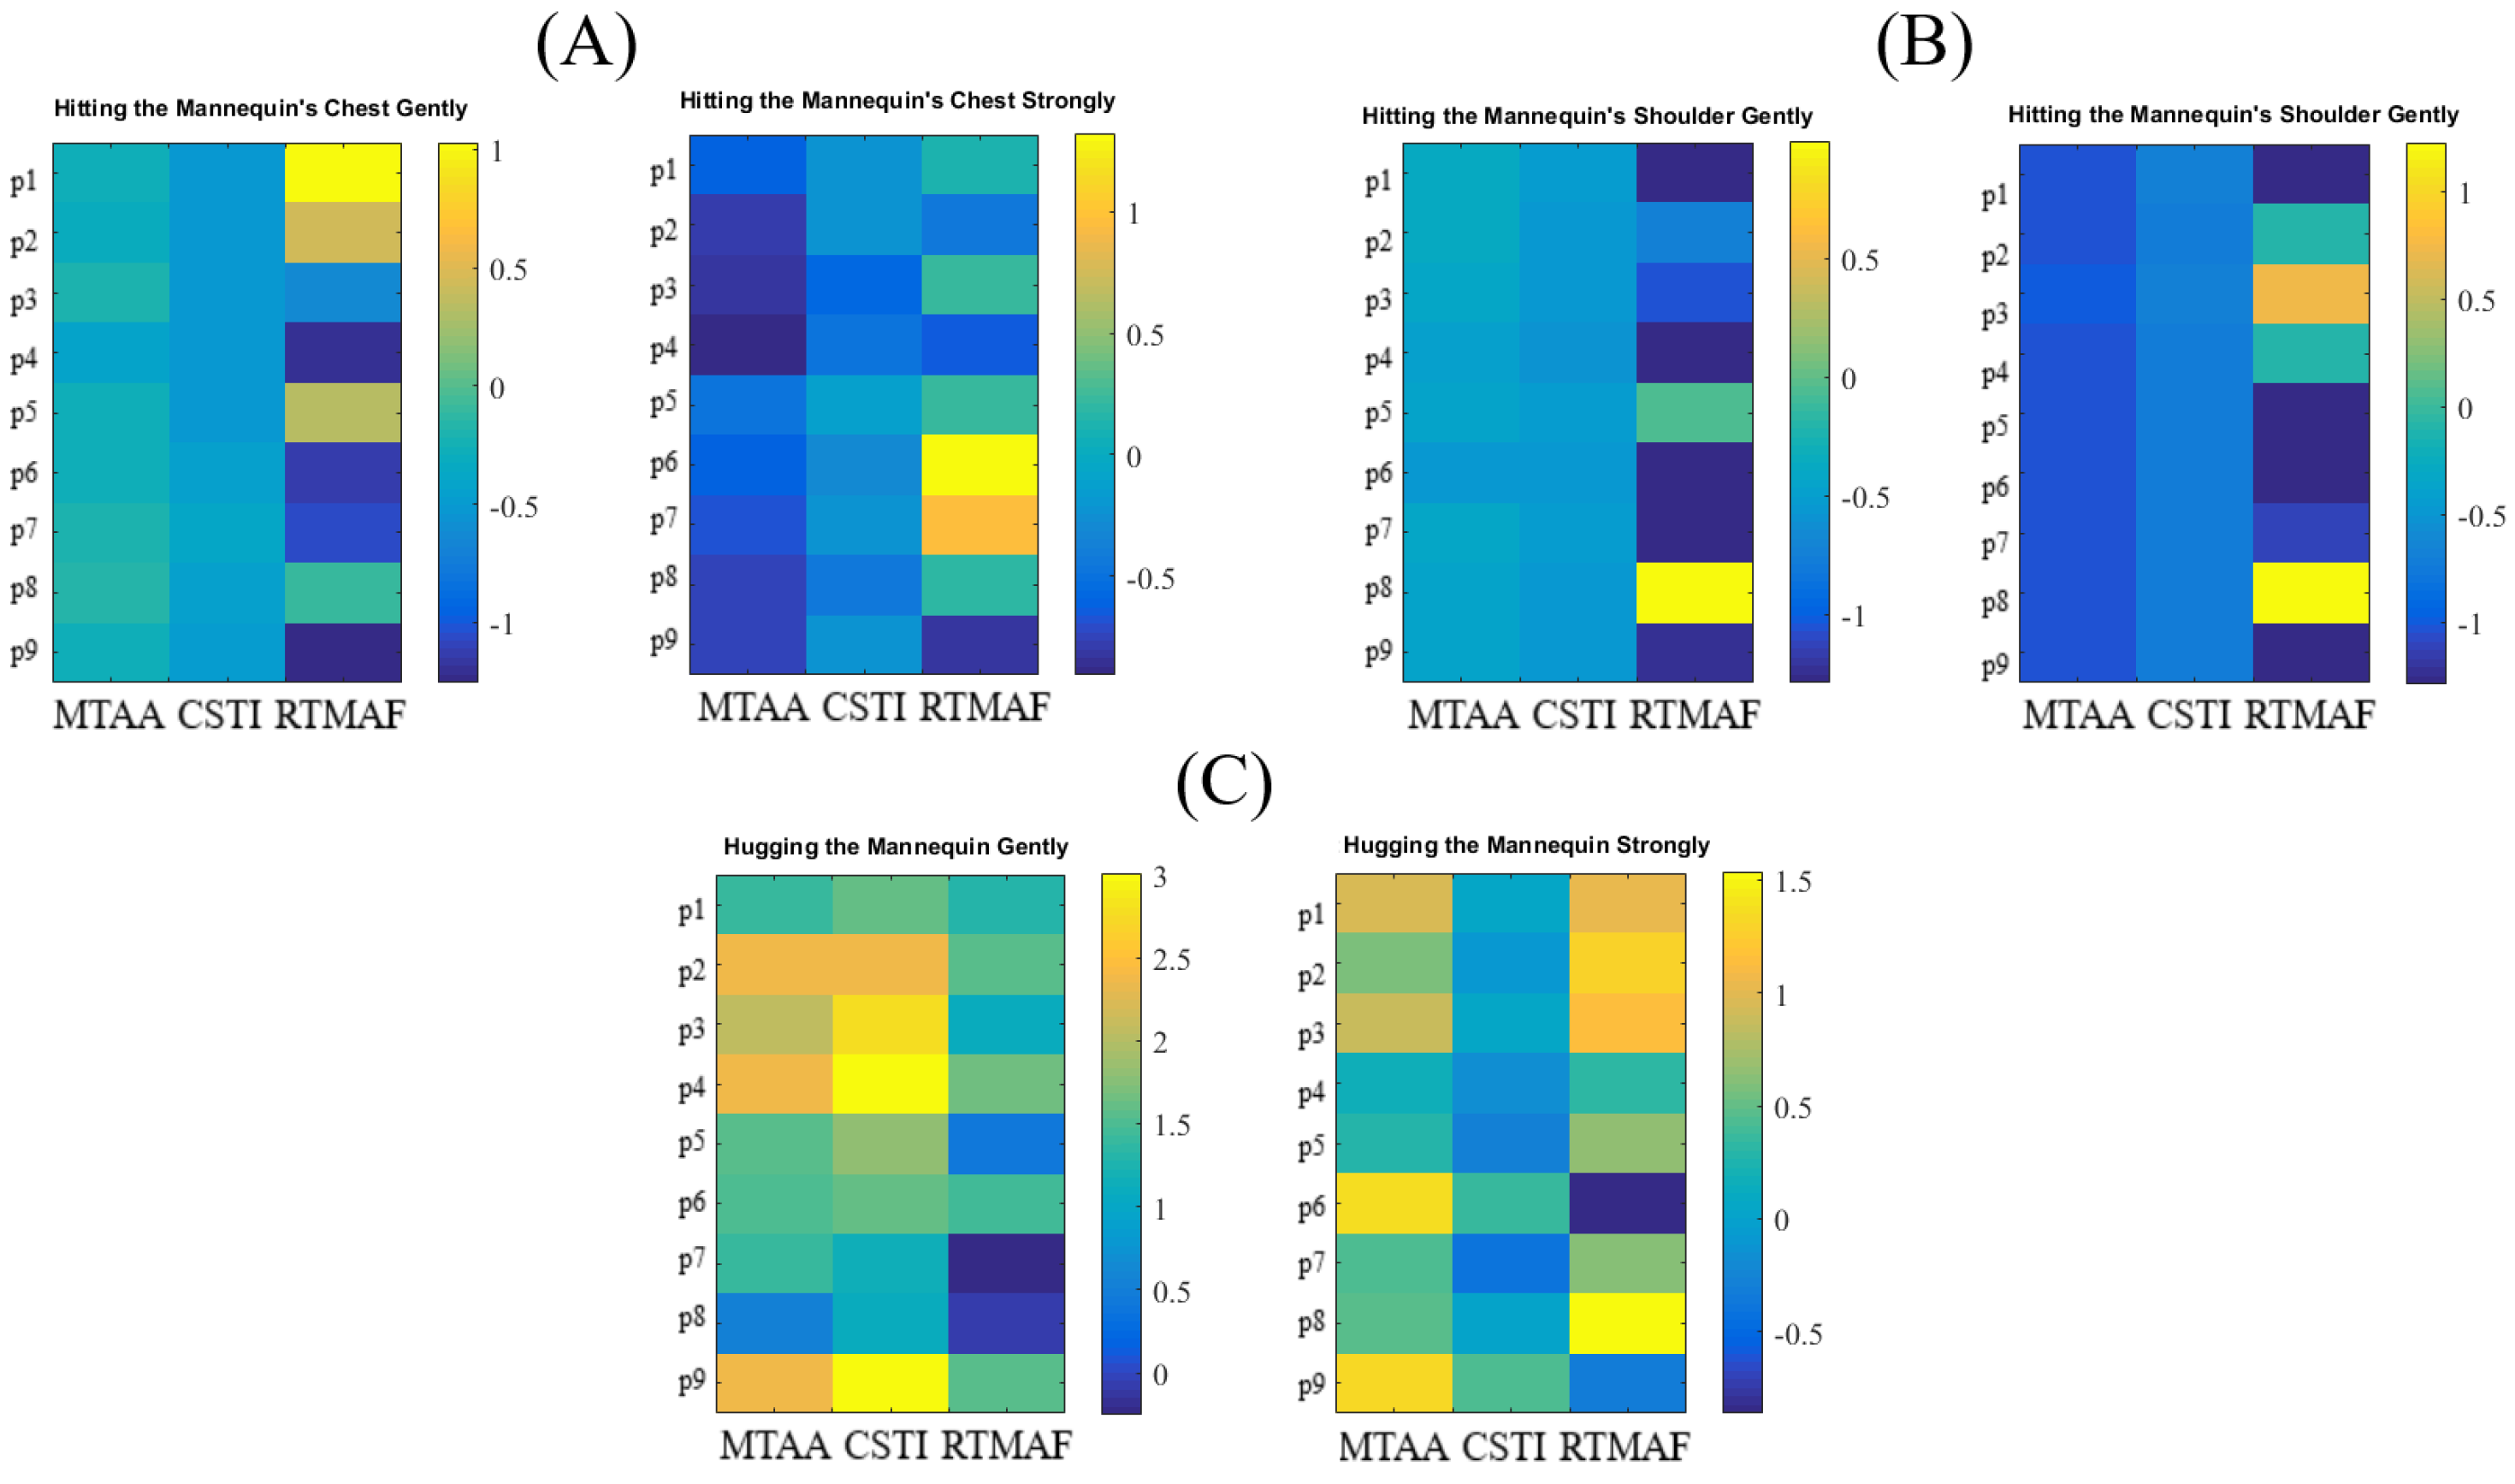
- Maximum Touch Activated Area (MTAA): We first found the frame with maximum number of activated touch sensor’s cells (i.e., out of 180 frames, per touch scenario, per participant). MTAA was then computed as m × 1.12 where m refers to the number of activated cells and 1.12 is the area of a single cell.
- Cumulative Sum of Touch Intensity (CSTI): This was calculated as the sum of activation (i.e., measured pressure, per cell) of all cells in the maximally touch activated frame that was used for computing the Maximally Activated Touch Area above.
- Relative Time of Maximally Activated Frame (RTMAF): This was computed as the index of the frame (i.e., out of 180 frames, per touch scenario) that corresponded to the frame with Maximally Activated Touch Area above.
2.4.2. Touch Classification
2.4.3. Improving the RF Accuracy
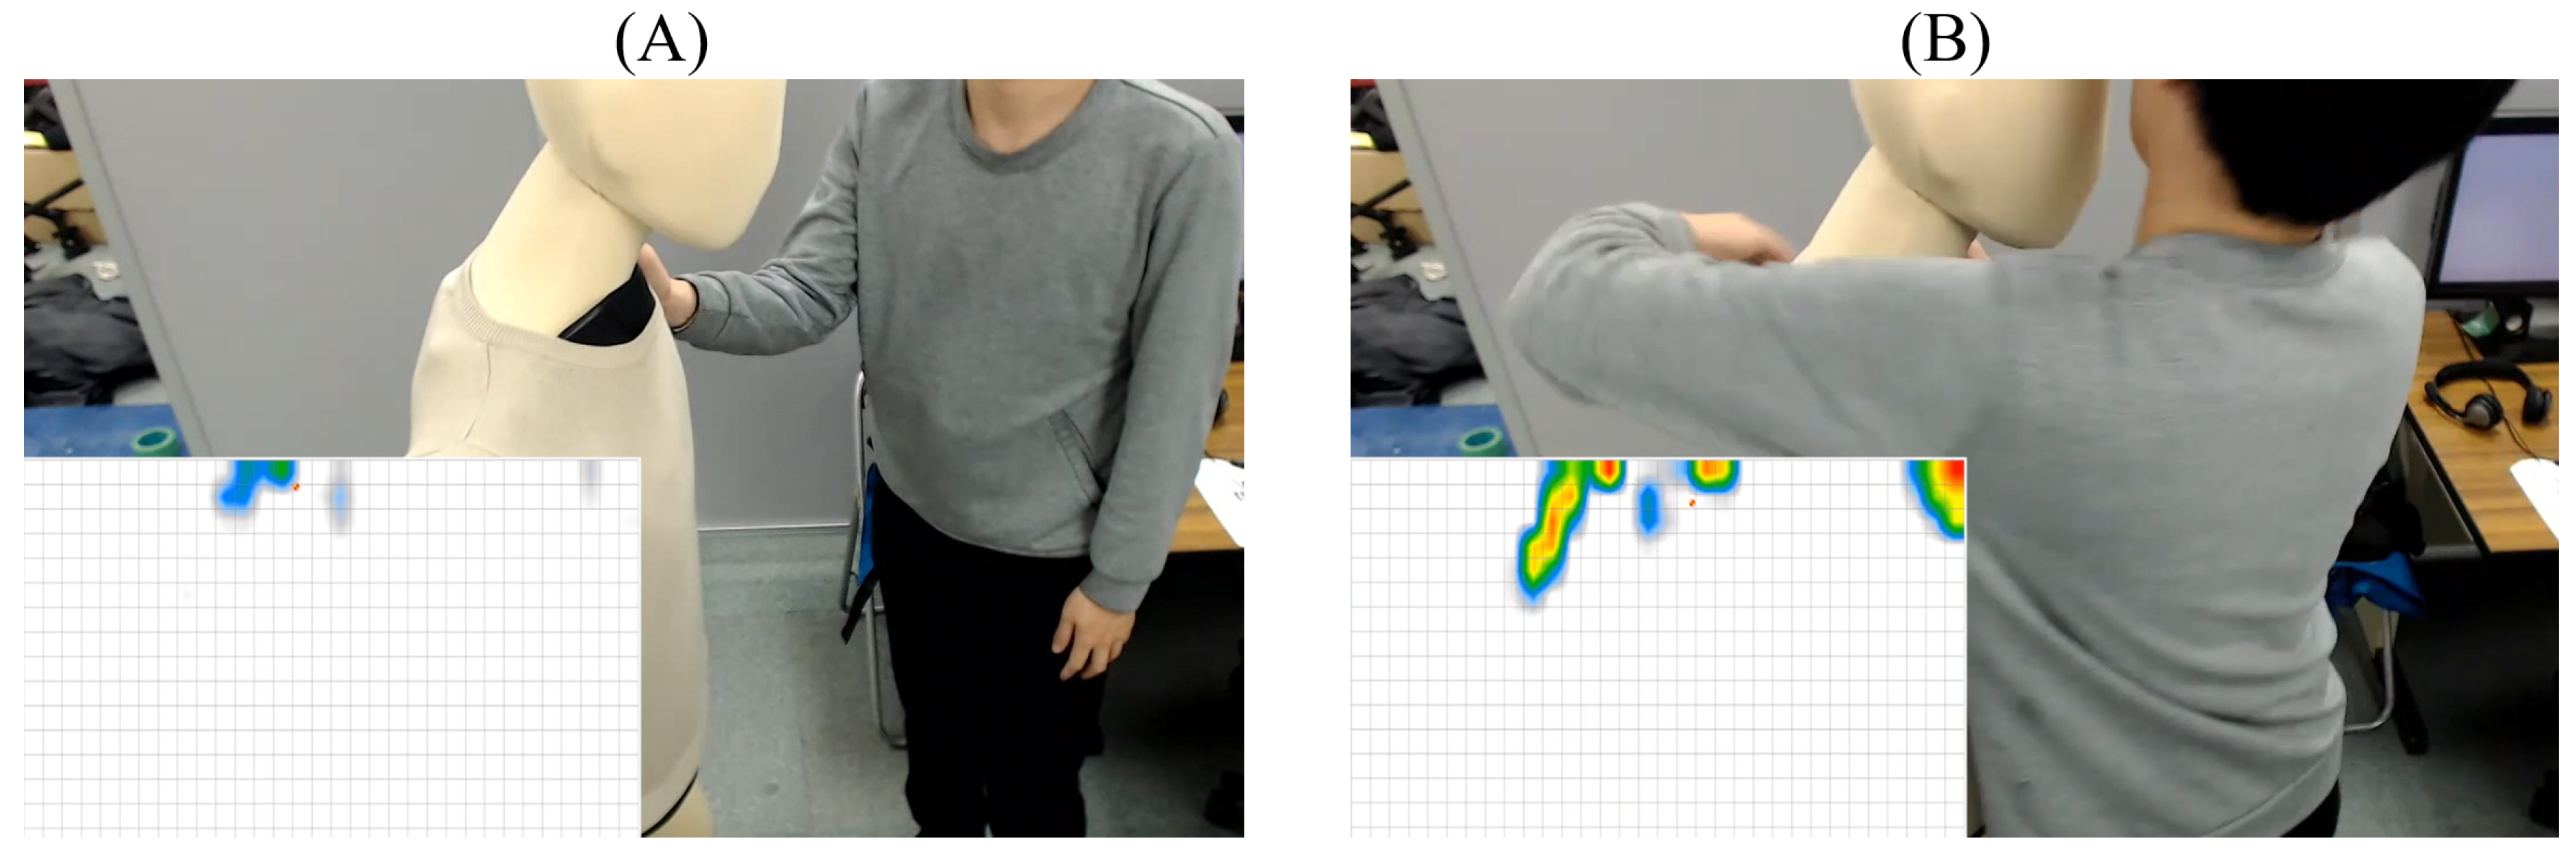
- Reduction of Undesired Activity around a Mannequin’s Neck: In our data, we observed that the activity around the mannequin’s neck was present in all participants’ data and regardless of the touch gesture that they performed on this mannequin. Further investigation of these data revealed that such an undesired activity was present even prior to the start of the participants’ session. The latter observation verified that the observed noisy activity was due to the inadequate placement of the sensor vest on the mannequin’s upper body. To attenuate this effect, we extracted the sensor’s data of all the participants that pertained to the one frame prior to the start of their session, per touch scenario. Next, we located all the sensor’s cells that were commonly active in all of these frames (i.e., one per participant, per touch gesture). We then computed the MTAA and CSTI features (Section 2.4.2 and Figure 2) for this undesired activity around the mannequin’s neck. Subsequently, we subtracted them from all participants’ corresponding MTAA and CSTI features that were calculated during their sessions, per touch gesture.
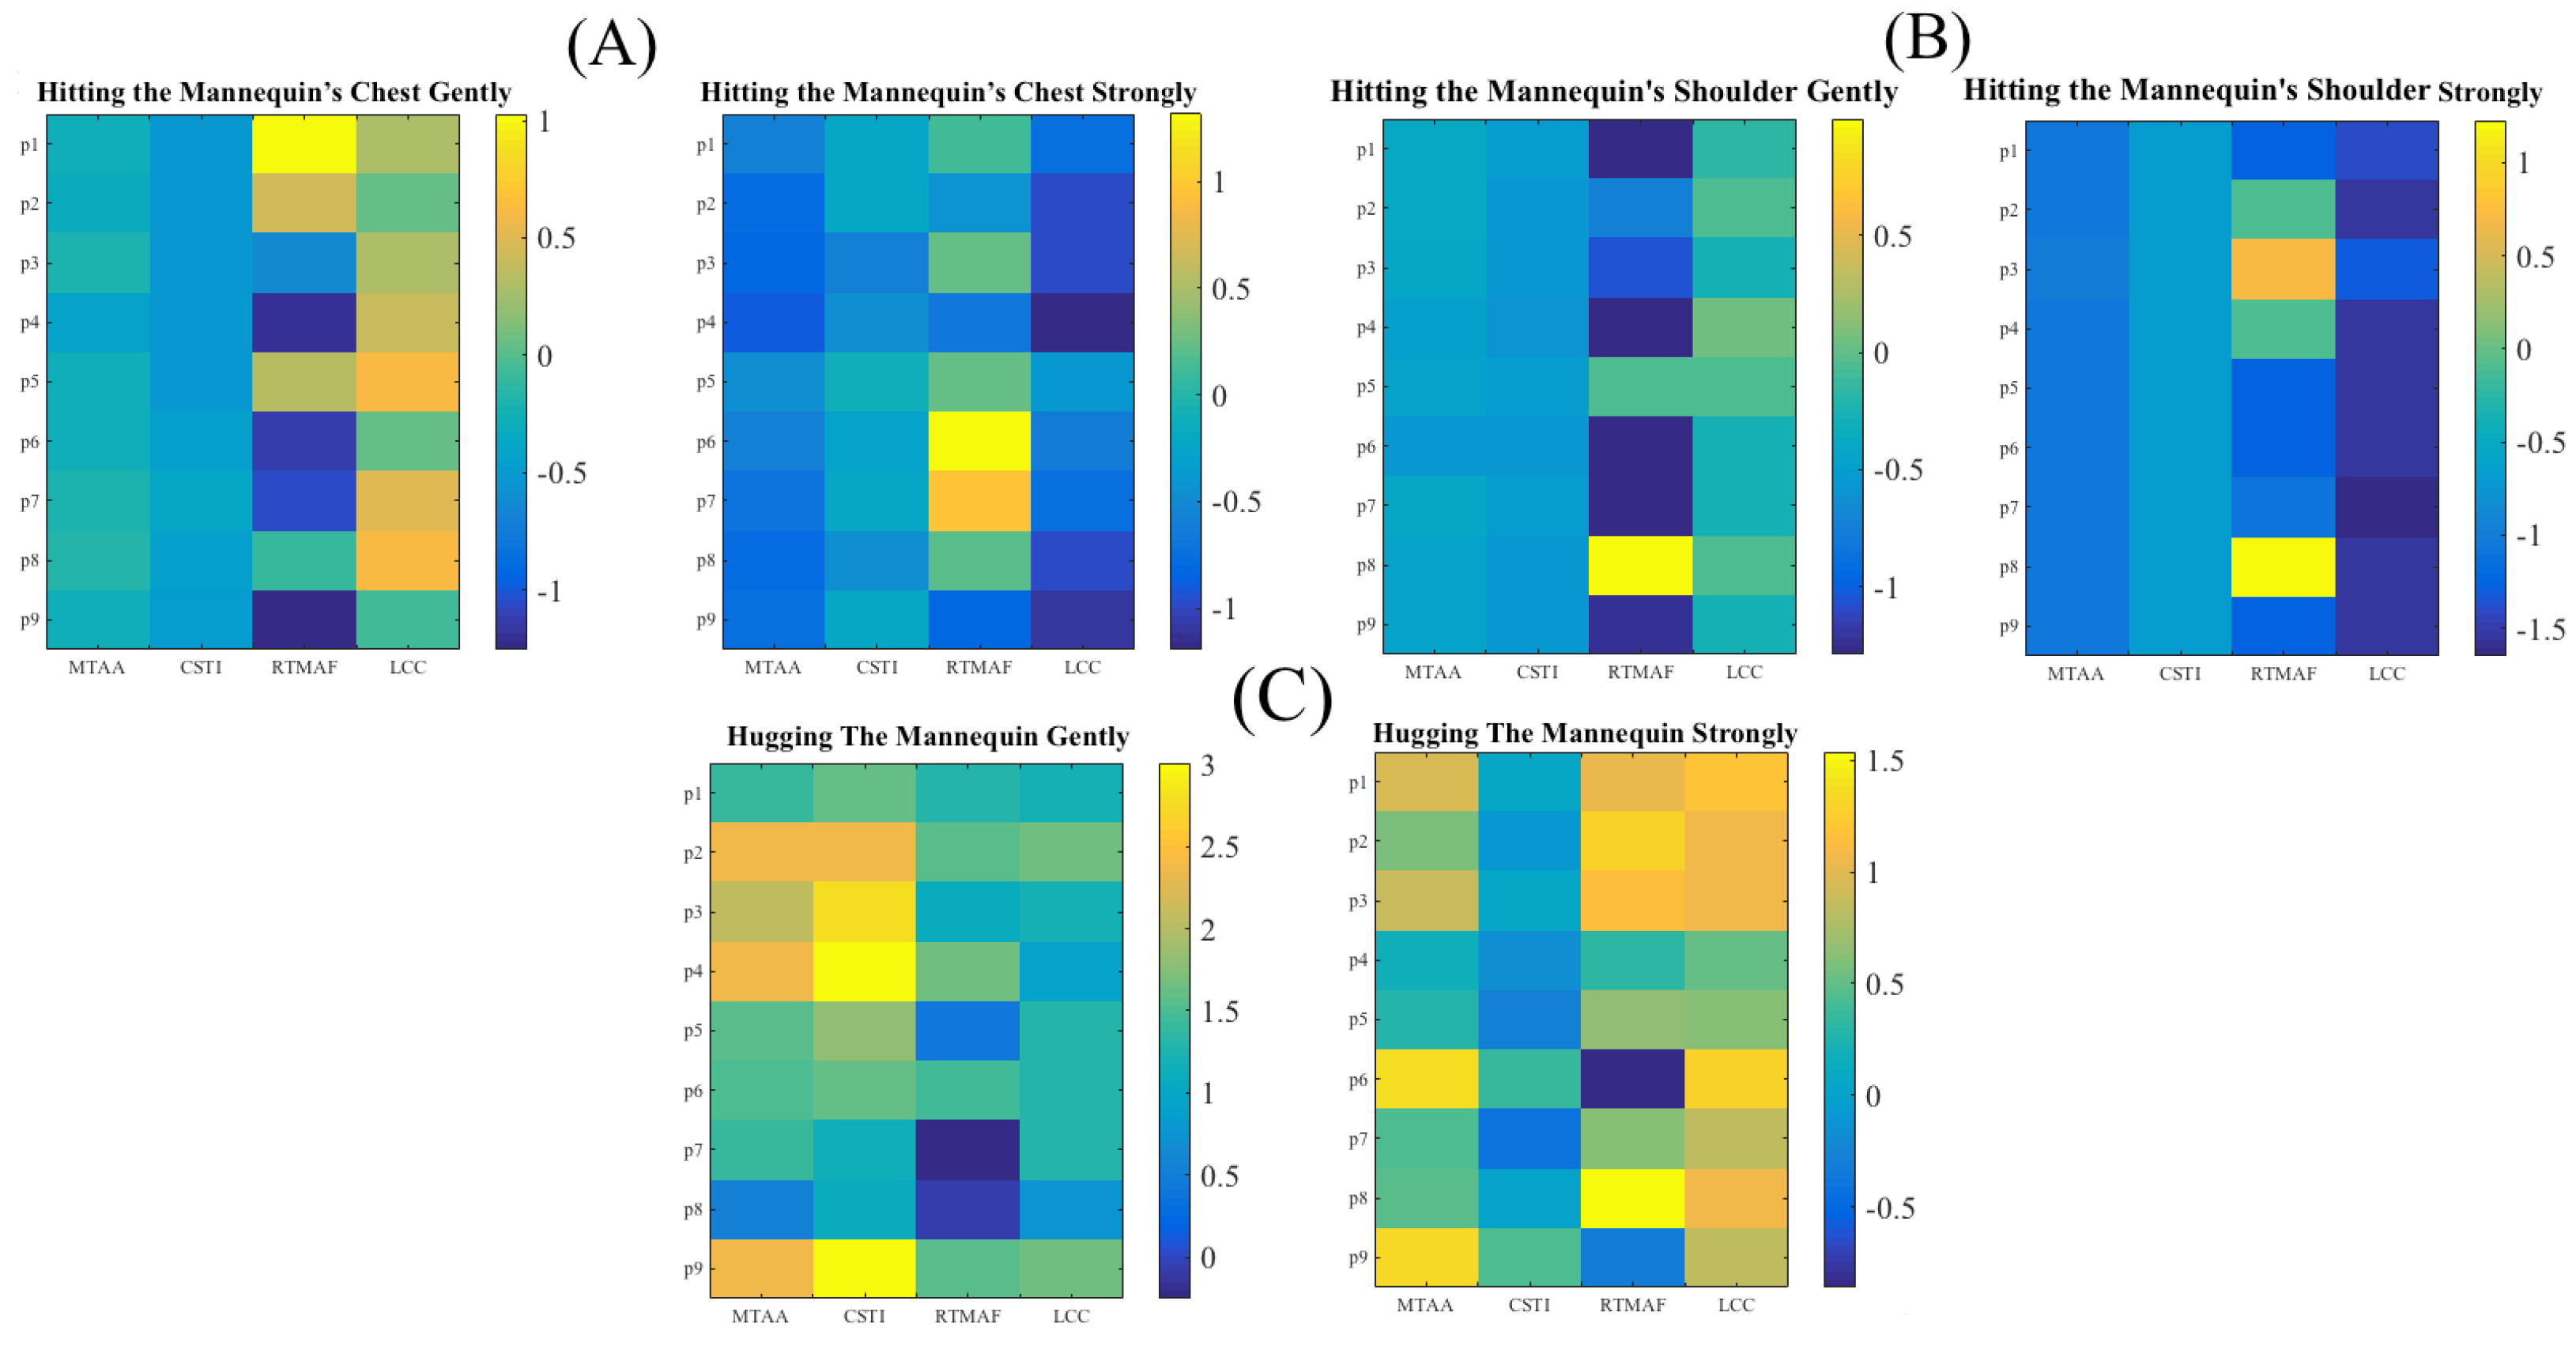
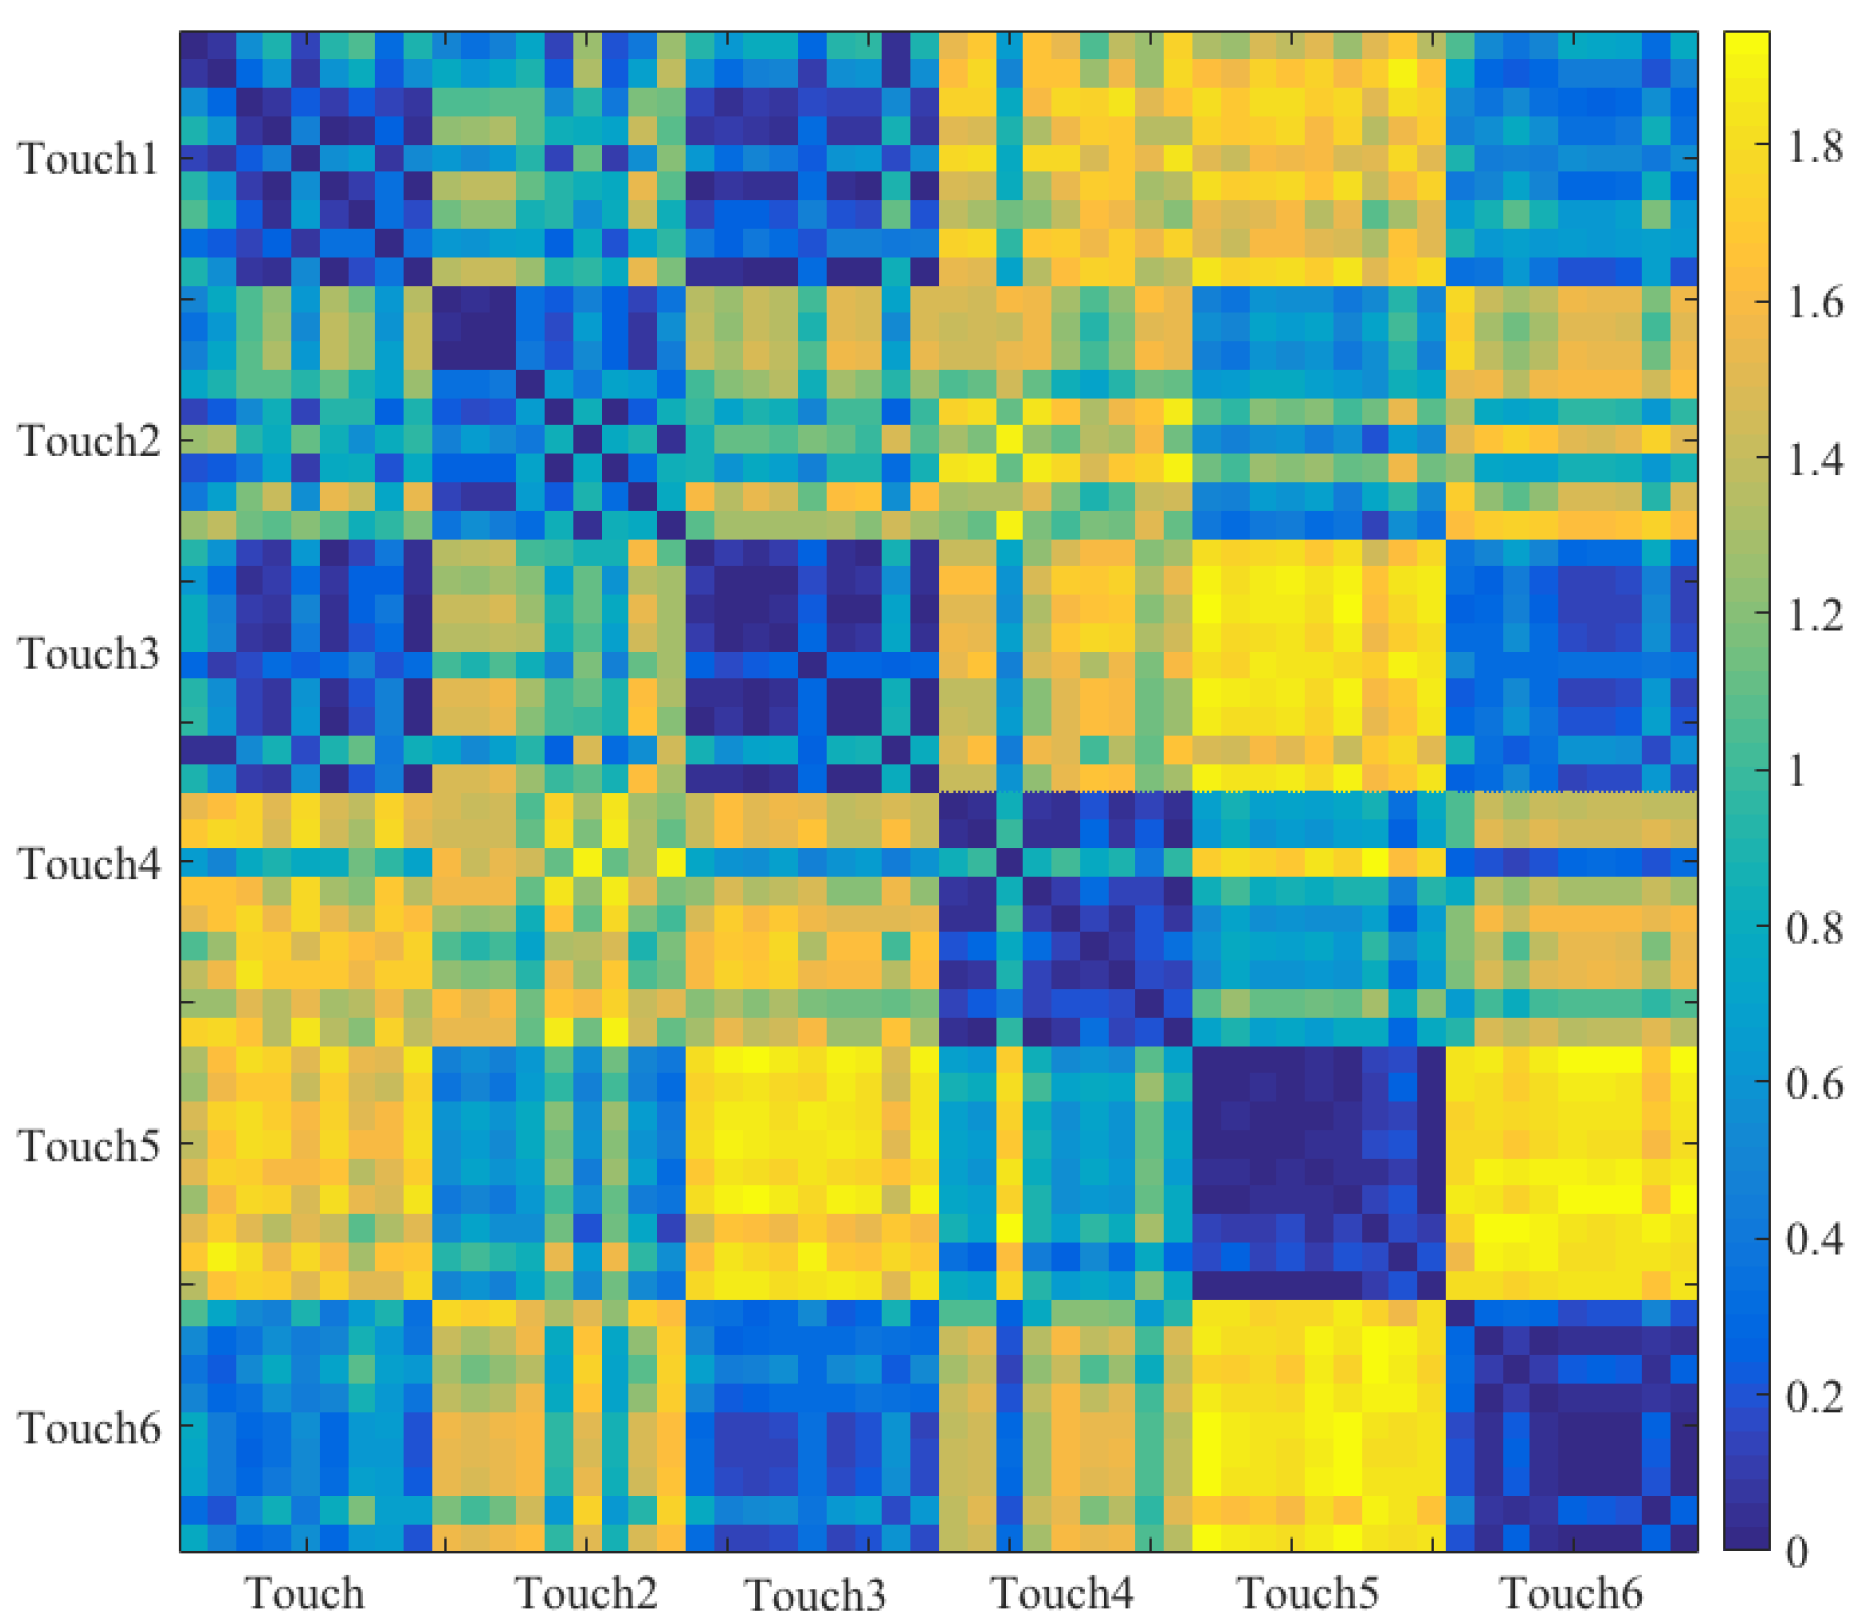
- Introduction of an Additional Feature: We computed a new feature; largest connected component (LCC). In essence, LCC corresponded to the number of activated sensor’s cells in the largest connected area of the sensor vest. In this respect, whereas MTAA quantified the maximum number of activated sensor’s cells during a touch session, LCC represented the number of such cells that formed a connected neighboring cells that formed the largest subset of such pattern of activation. To compute LCC, we treated the sensor’s data in terms of a graph. Precisely, we first converted this data to an adjacency matrix by assigning a “1” or a “0” to every cell “c” if it was active or inactive:where 32 represents a dimension of sensor’s frame (i.e., a 32 × 32 frame, Section 2.2) and c refers to the sensor’s cell at ith row and jth column location on this frame. Next, we computed all the connected components [21] of this adjacency matrix. LCC was then the connected component that comprised the largest number of active cells among all of these connected components. Figure 3 shows the modified feature vectors, per touch gesture, per participant that included LCC.Figure 4 visualizes the pairwise cosine similarity distances between different touch gestures. This figure verifies that the use of [MTAA, CSTI, and RTMAF, LCC] feature vectors for quantification of these touch gestures quite effectively captured the similarity between participants’ data for each of these gestures. This can be seen by inspecting the nearly zero-valued larger-area squares, per touch pairs that lay along the diagonal. Looking at the larger-area squares along the row entries, these features were also able to capture considerable dissimilarities between touch gestures of different type. These observations indicated that [MTAA, CSTI, and RTMAF, LCC] feature vectors extracted substantial motion-related spatial information that were inherent characteristic/property of these touch gestures. This is due to the fact that the cosine similarity quantifies the similarities among a given set of vectors in terms of their directions in space.
2.4.4. Statistics
2.5. Ethics Statement
3. Results
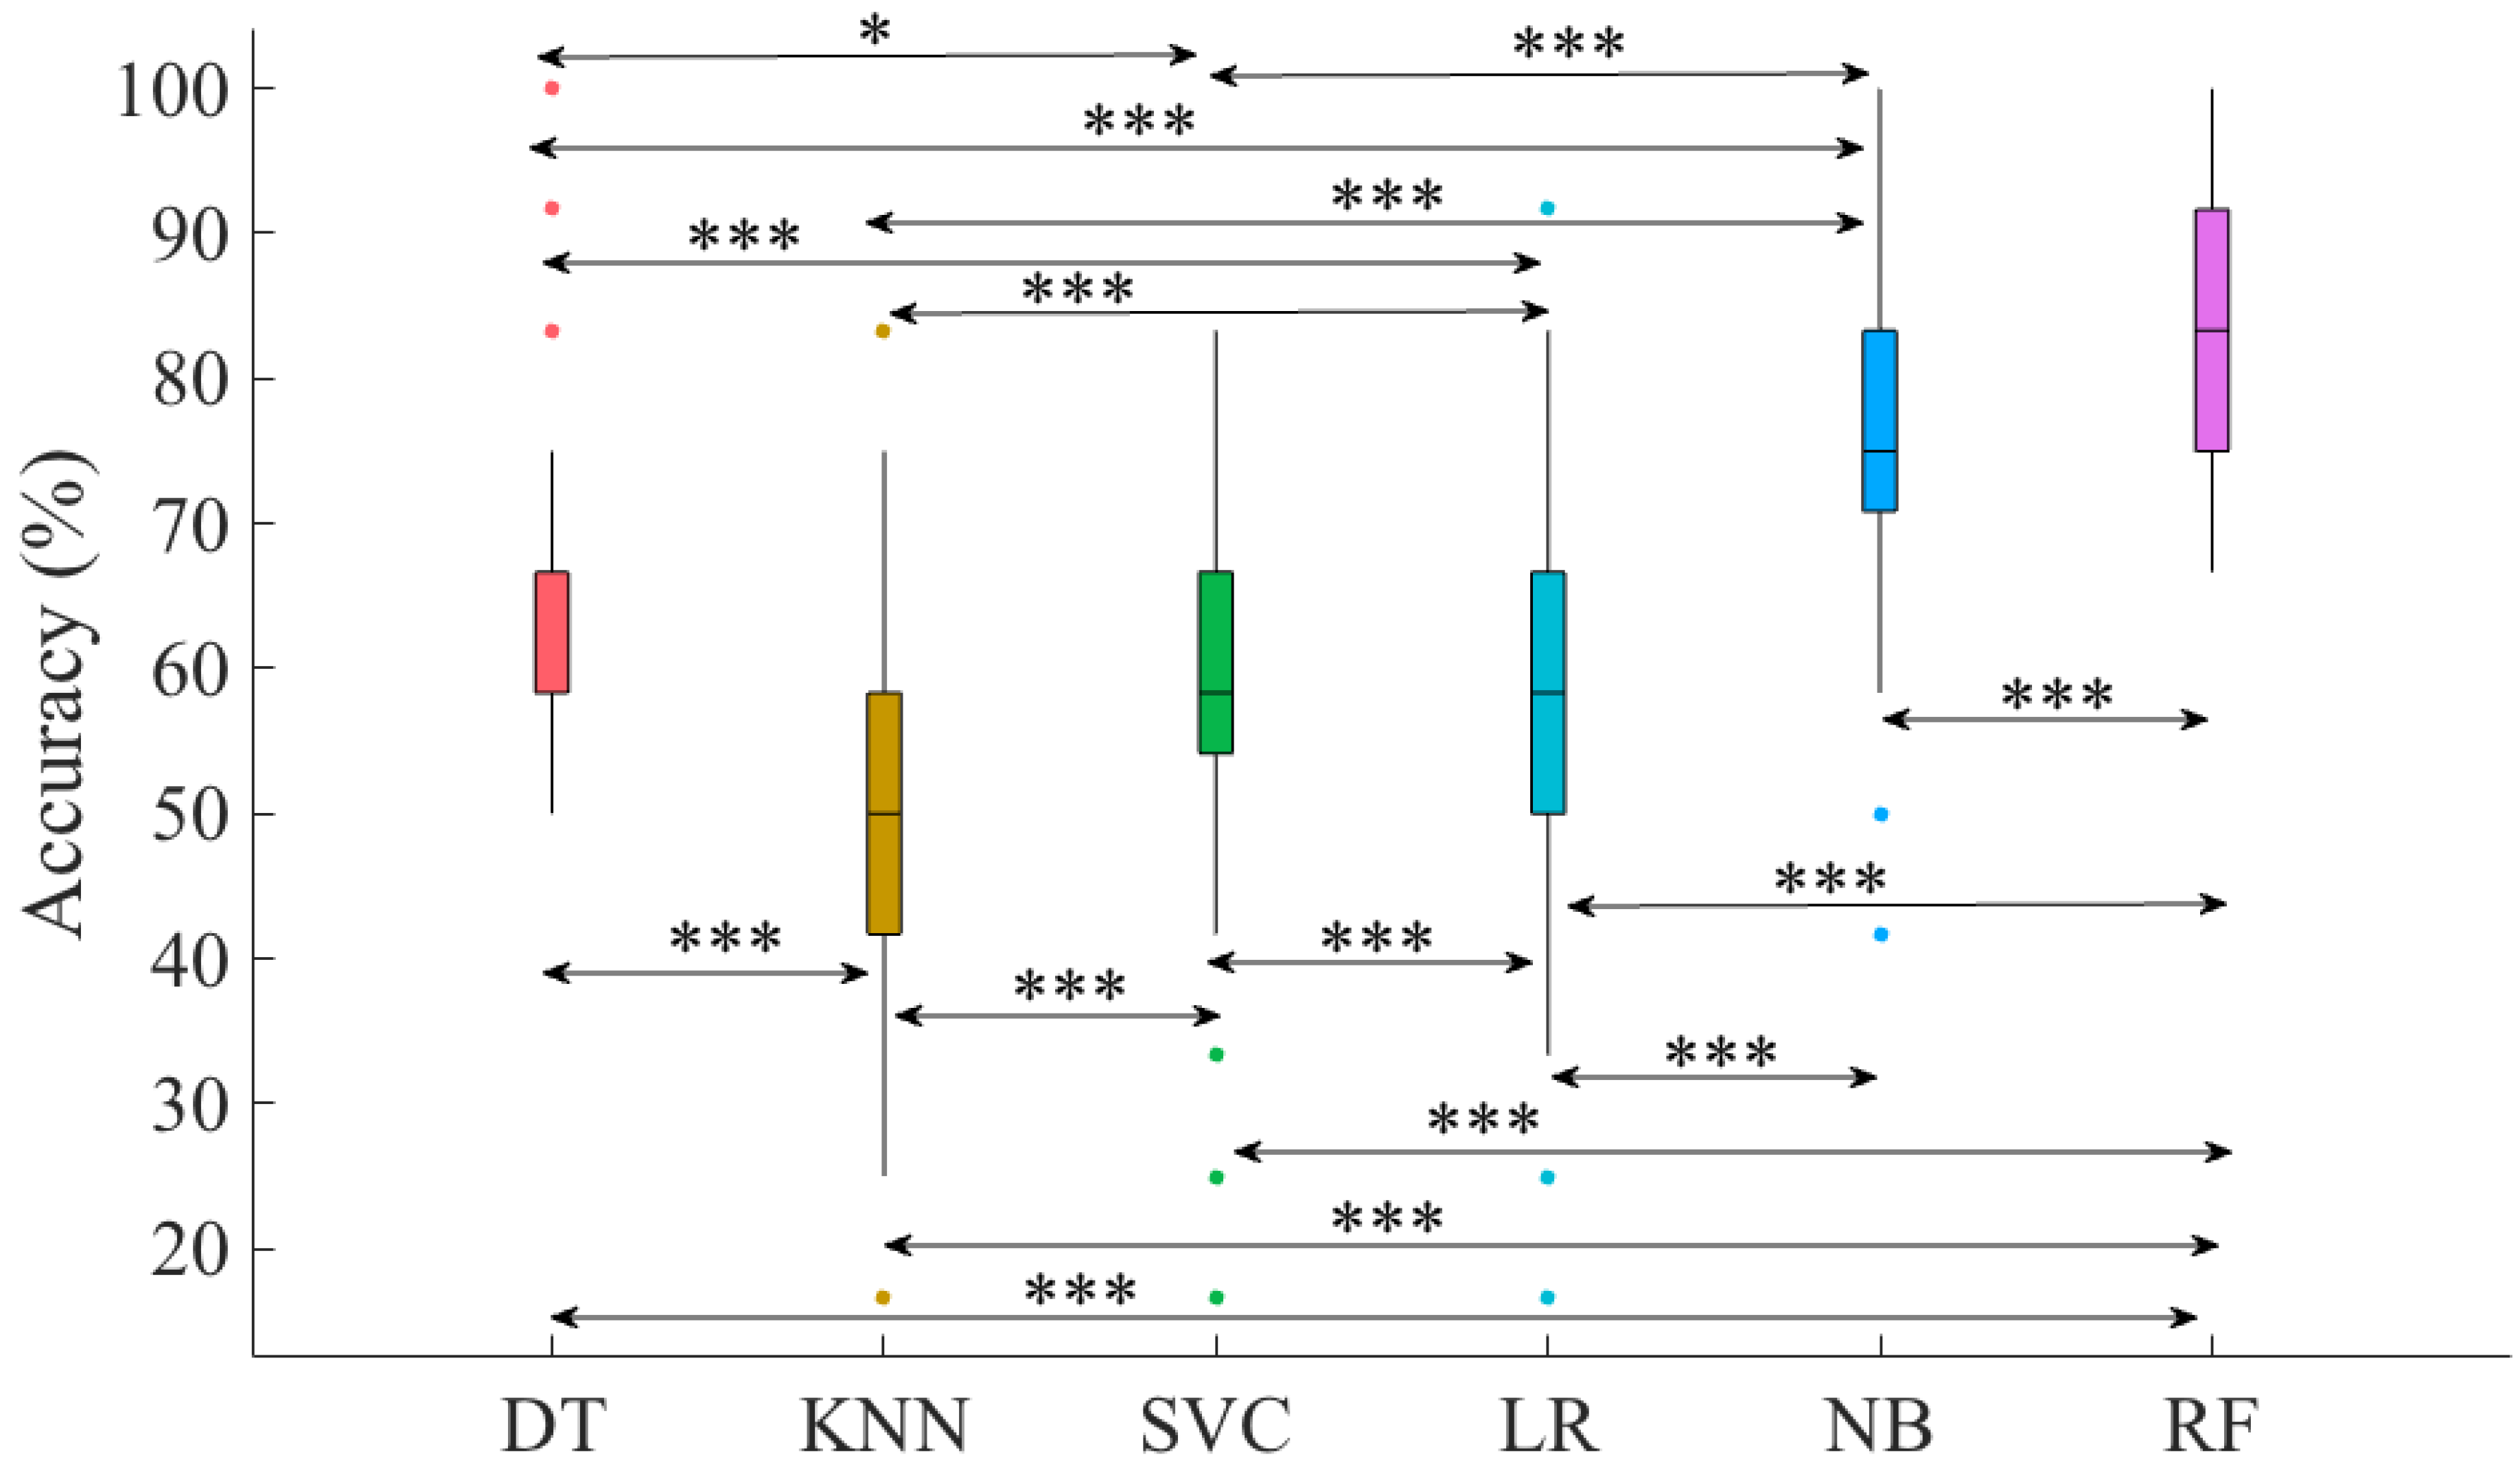
3.1. Overall Accuracies
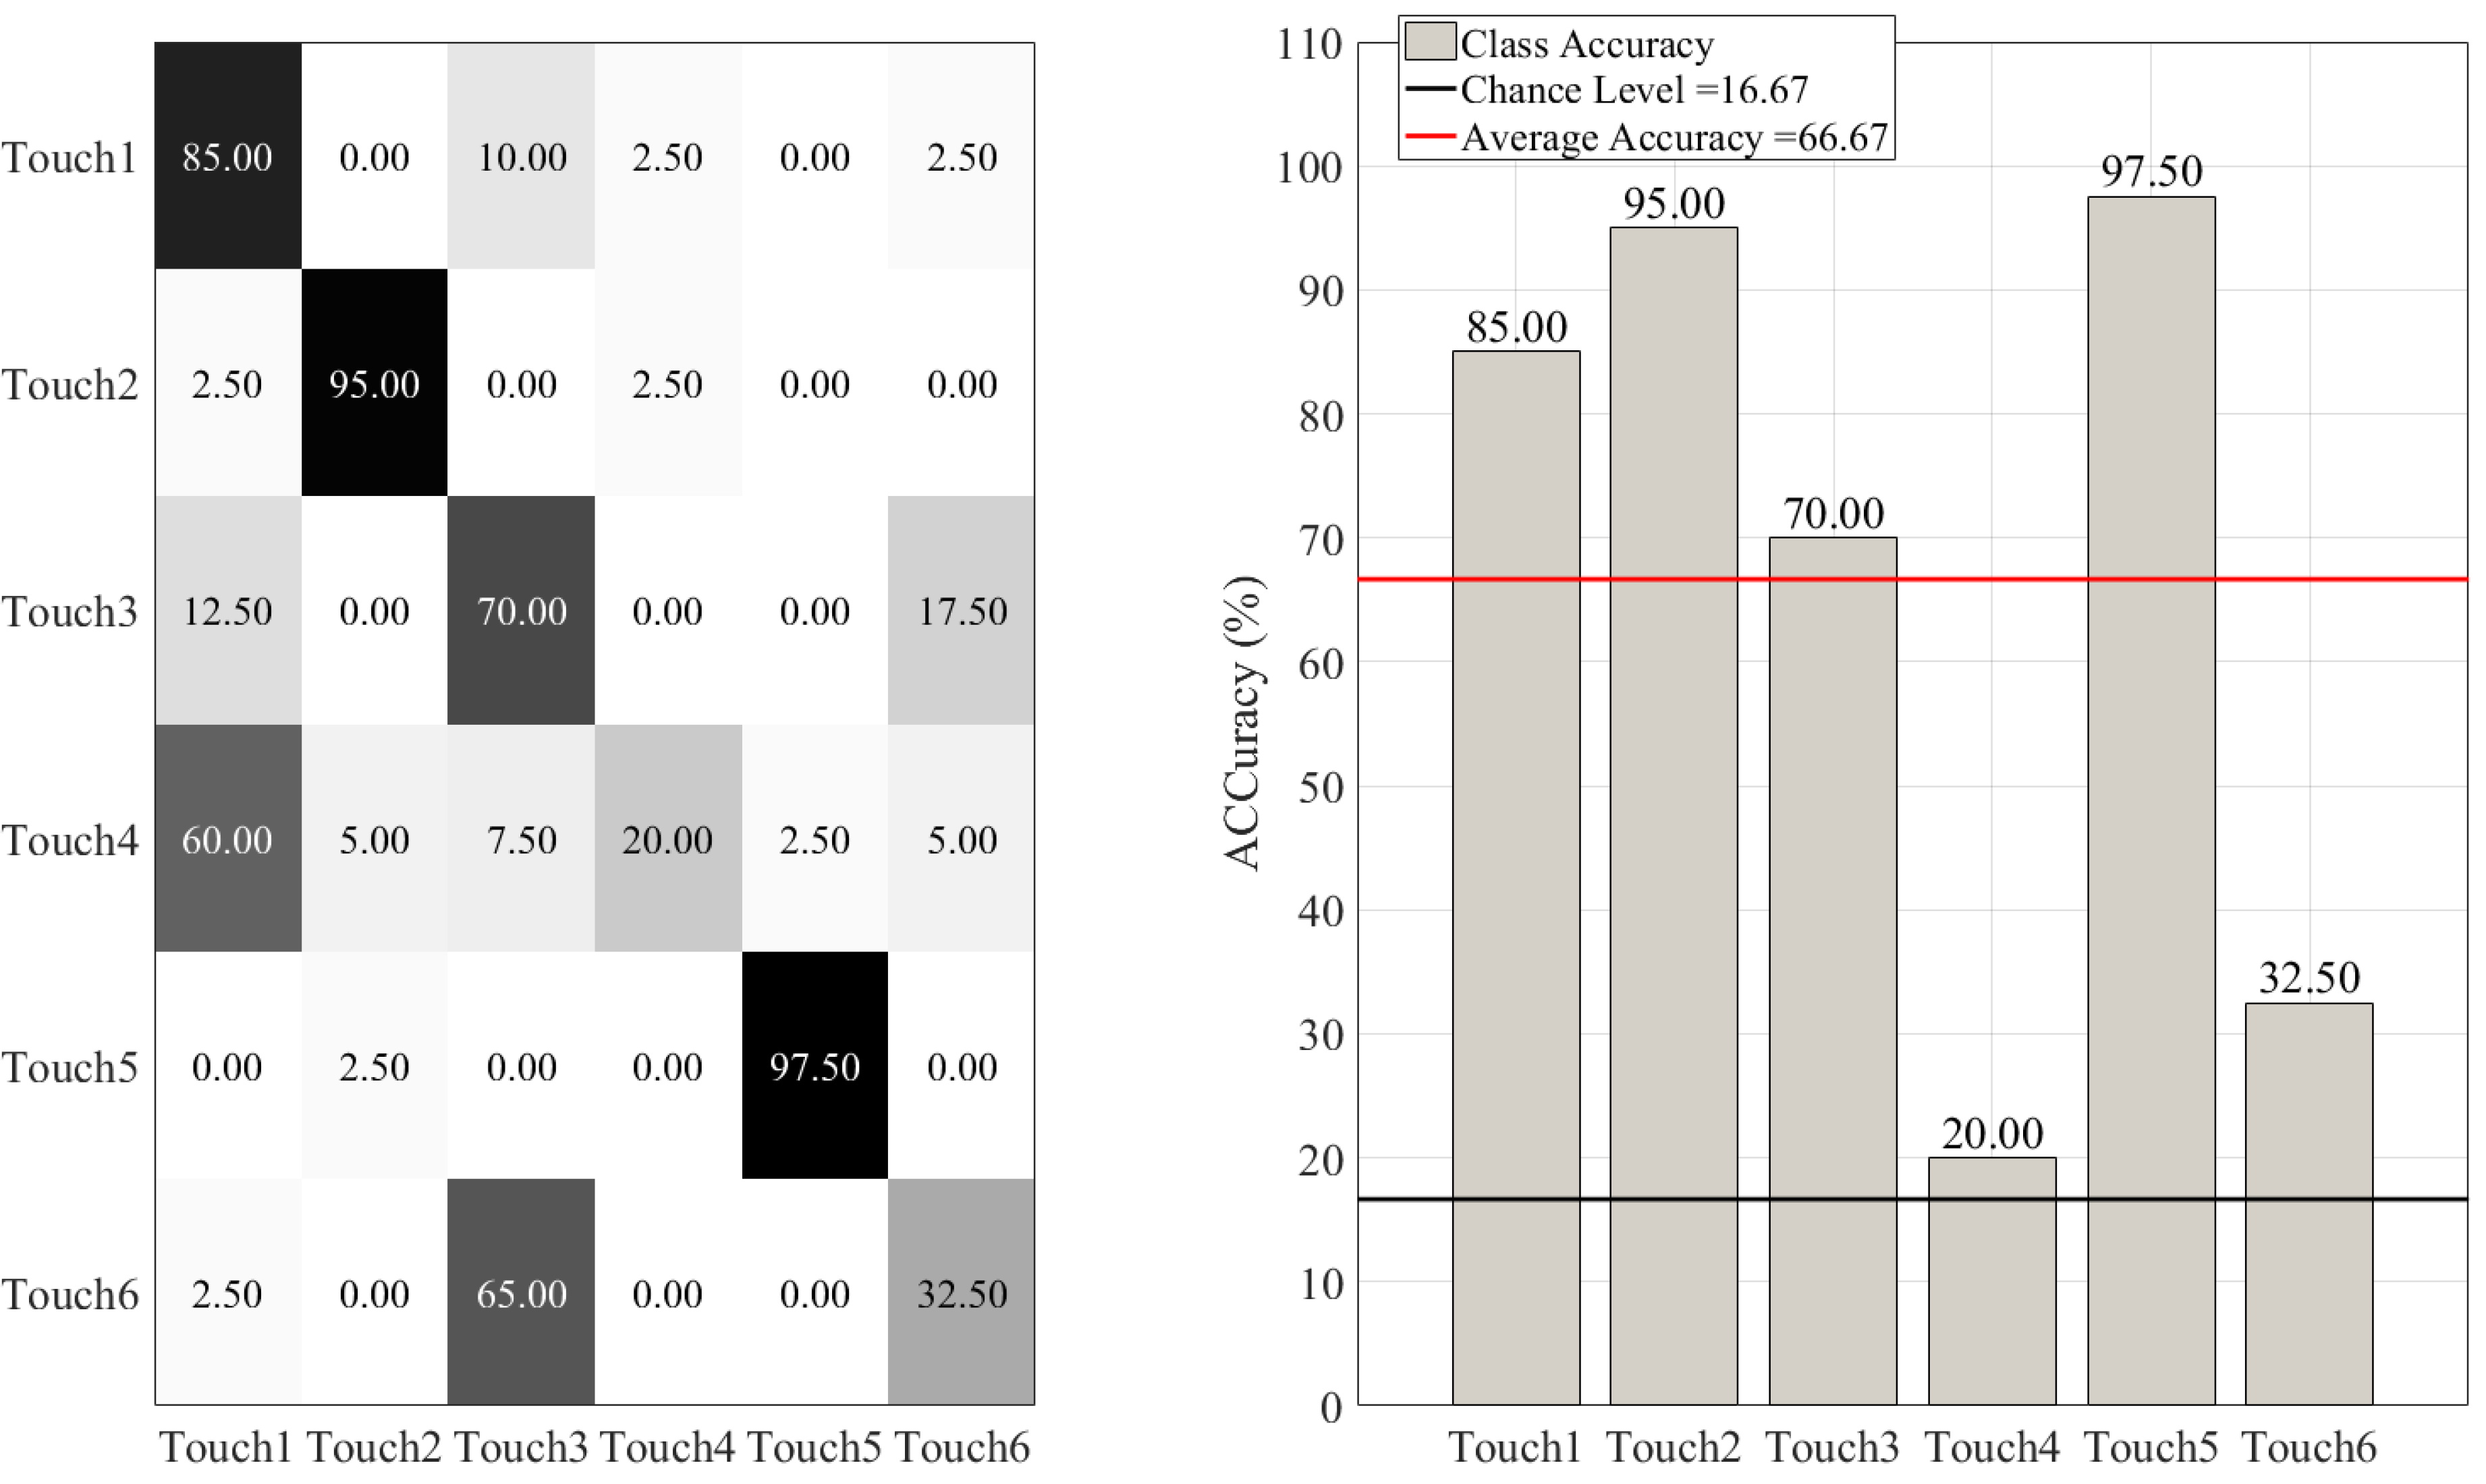
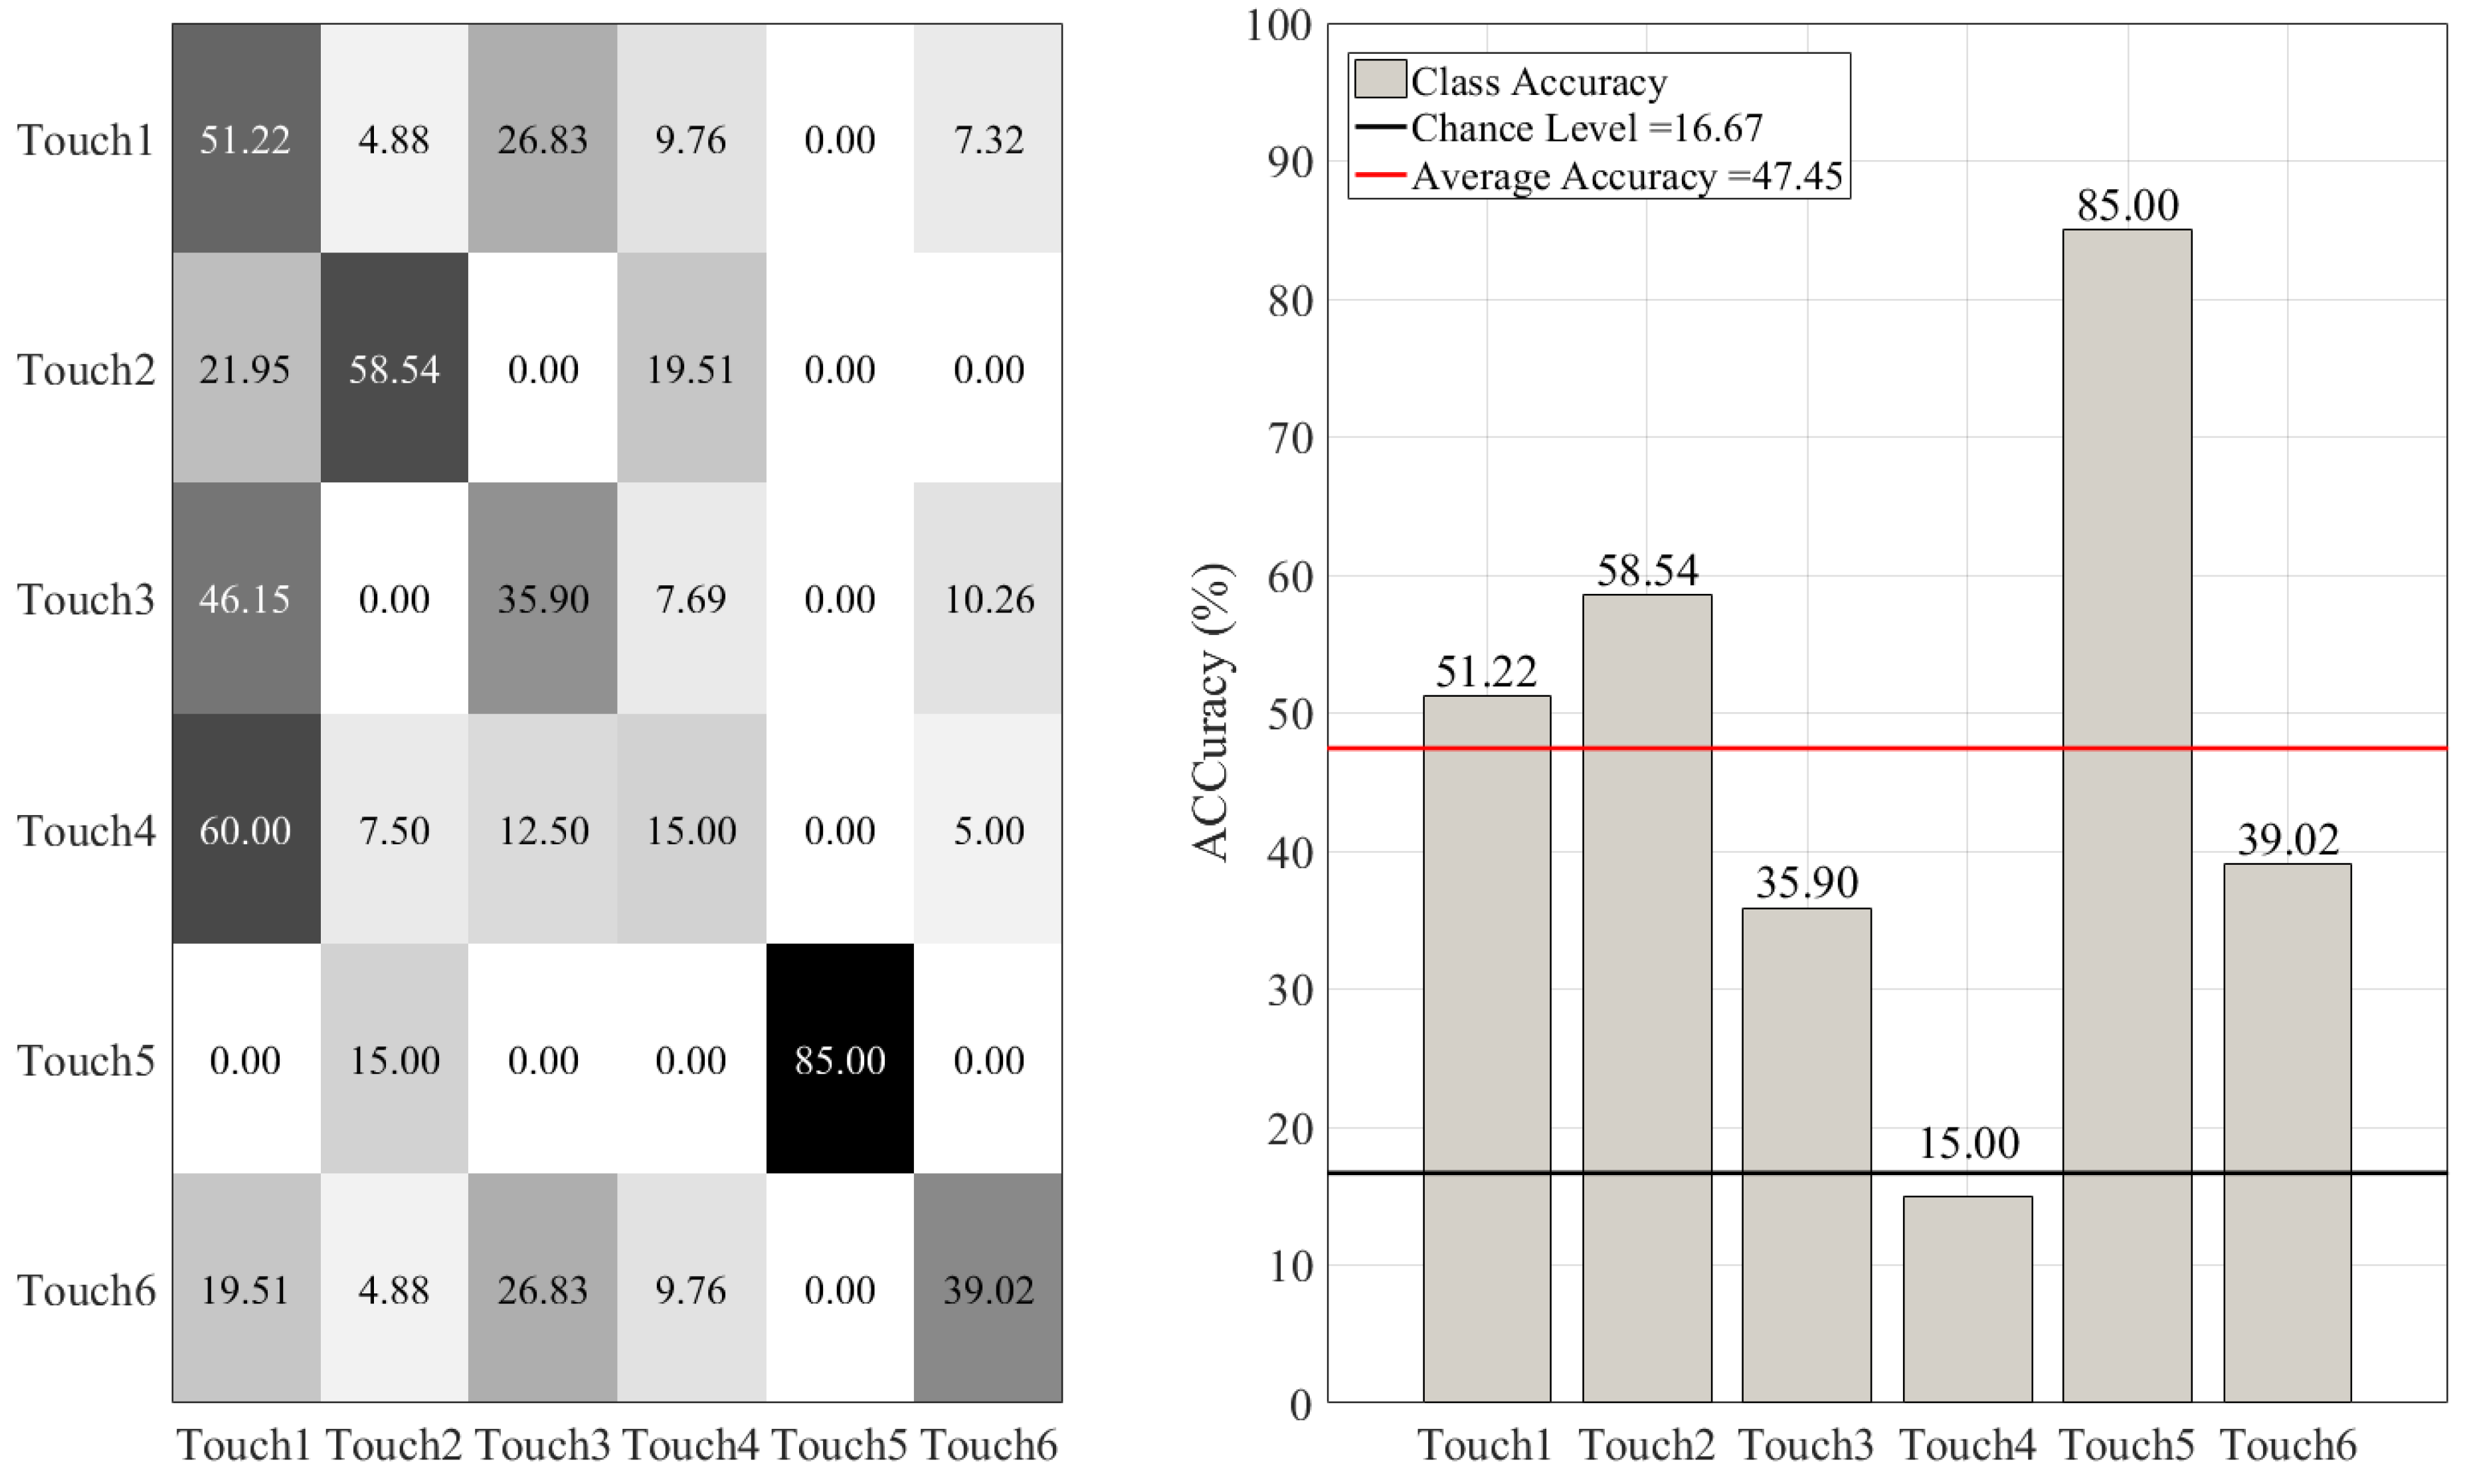
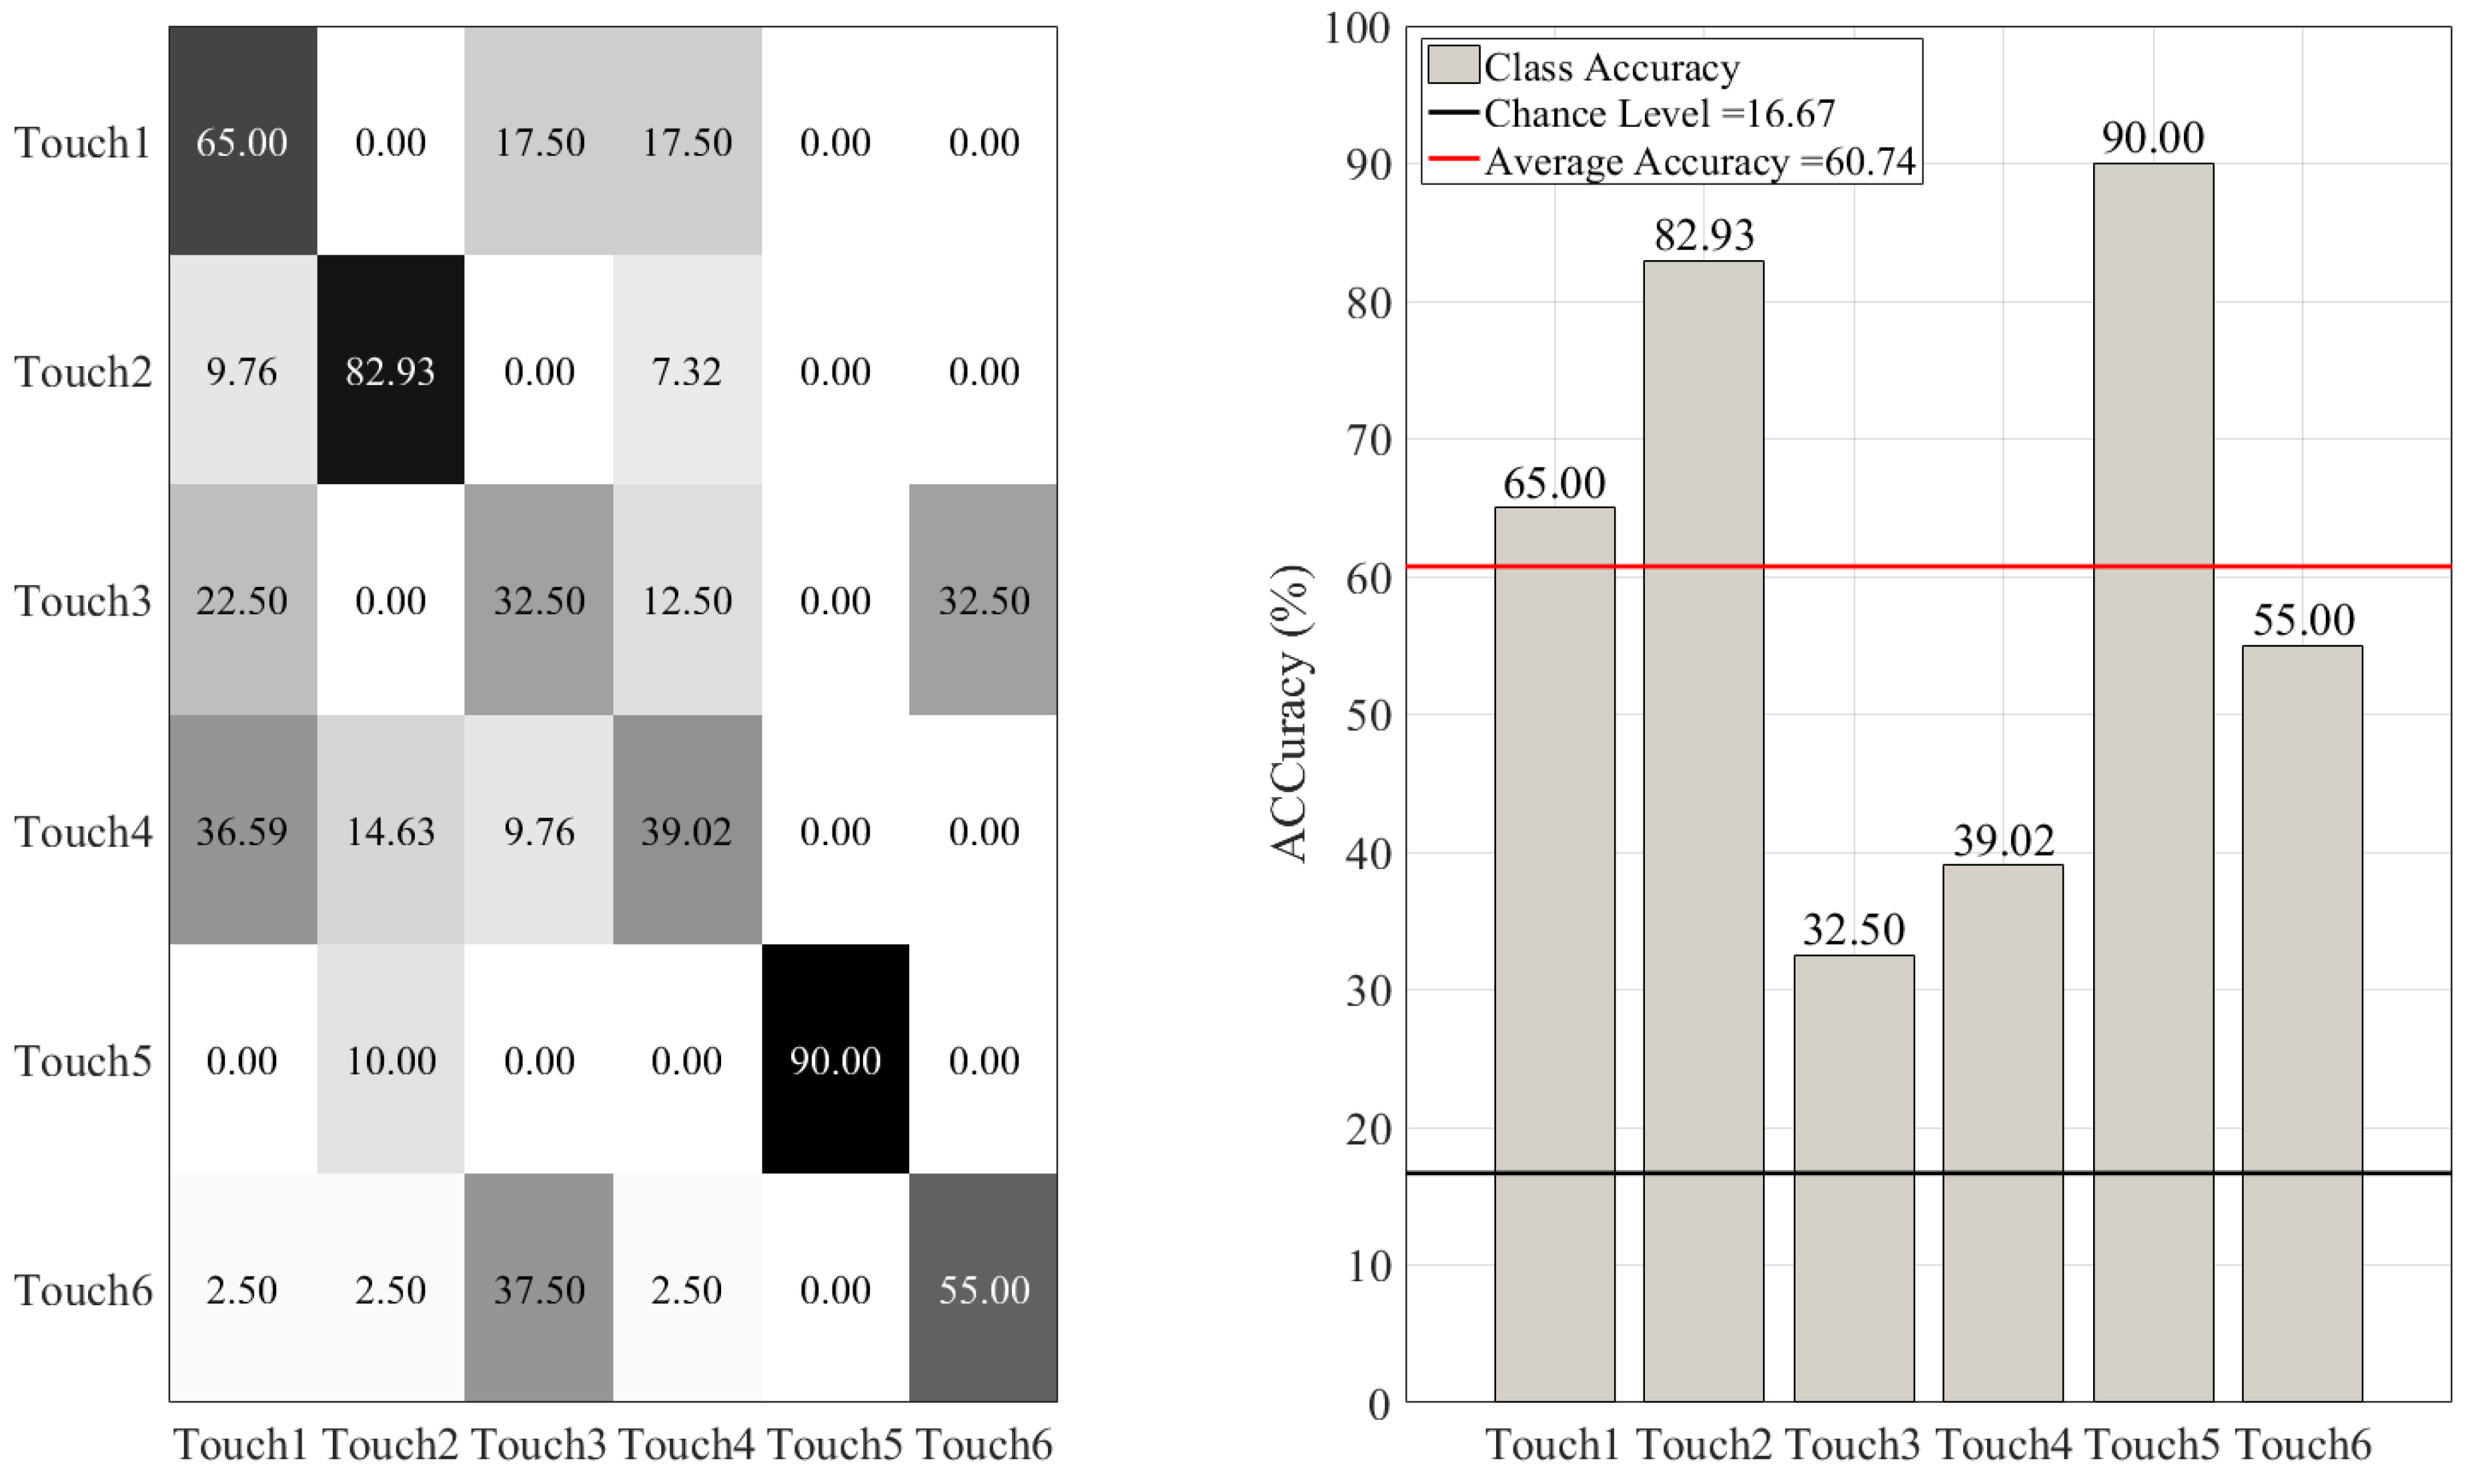
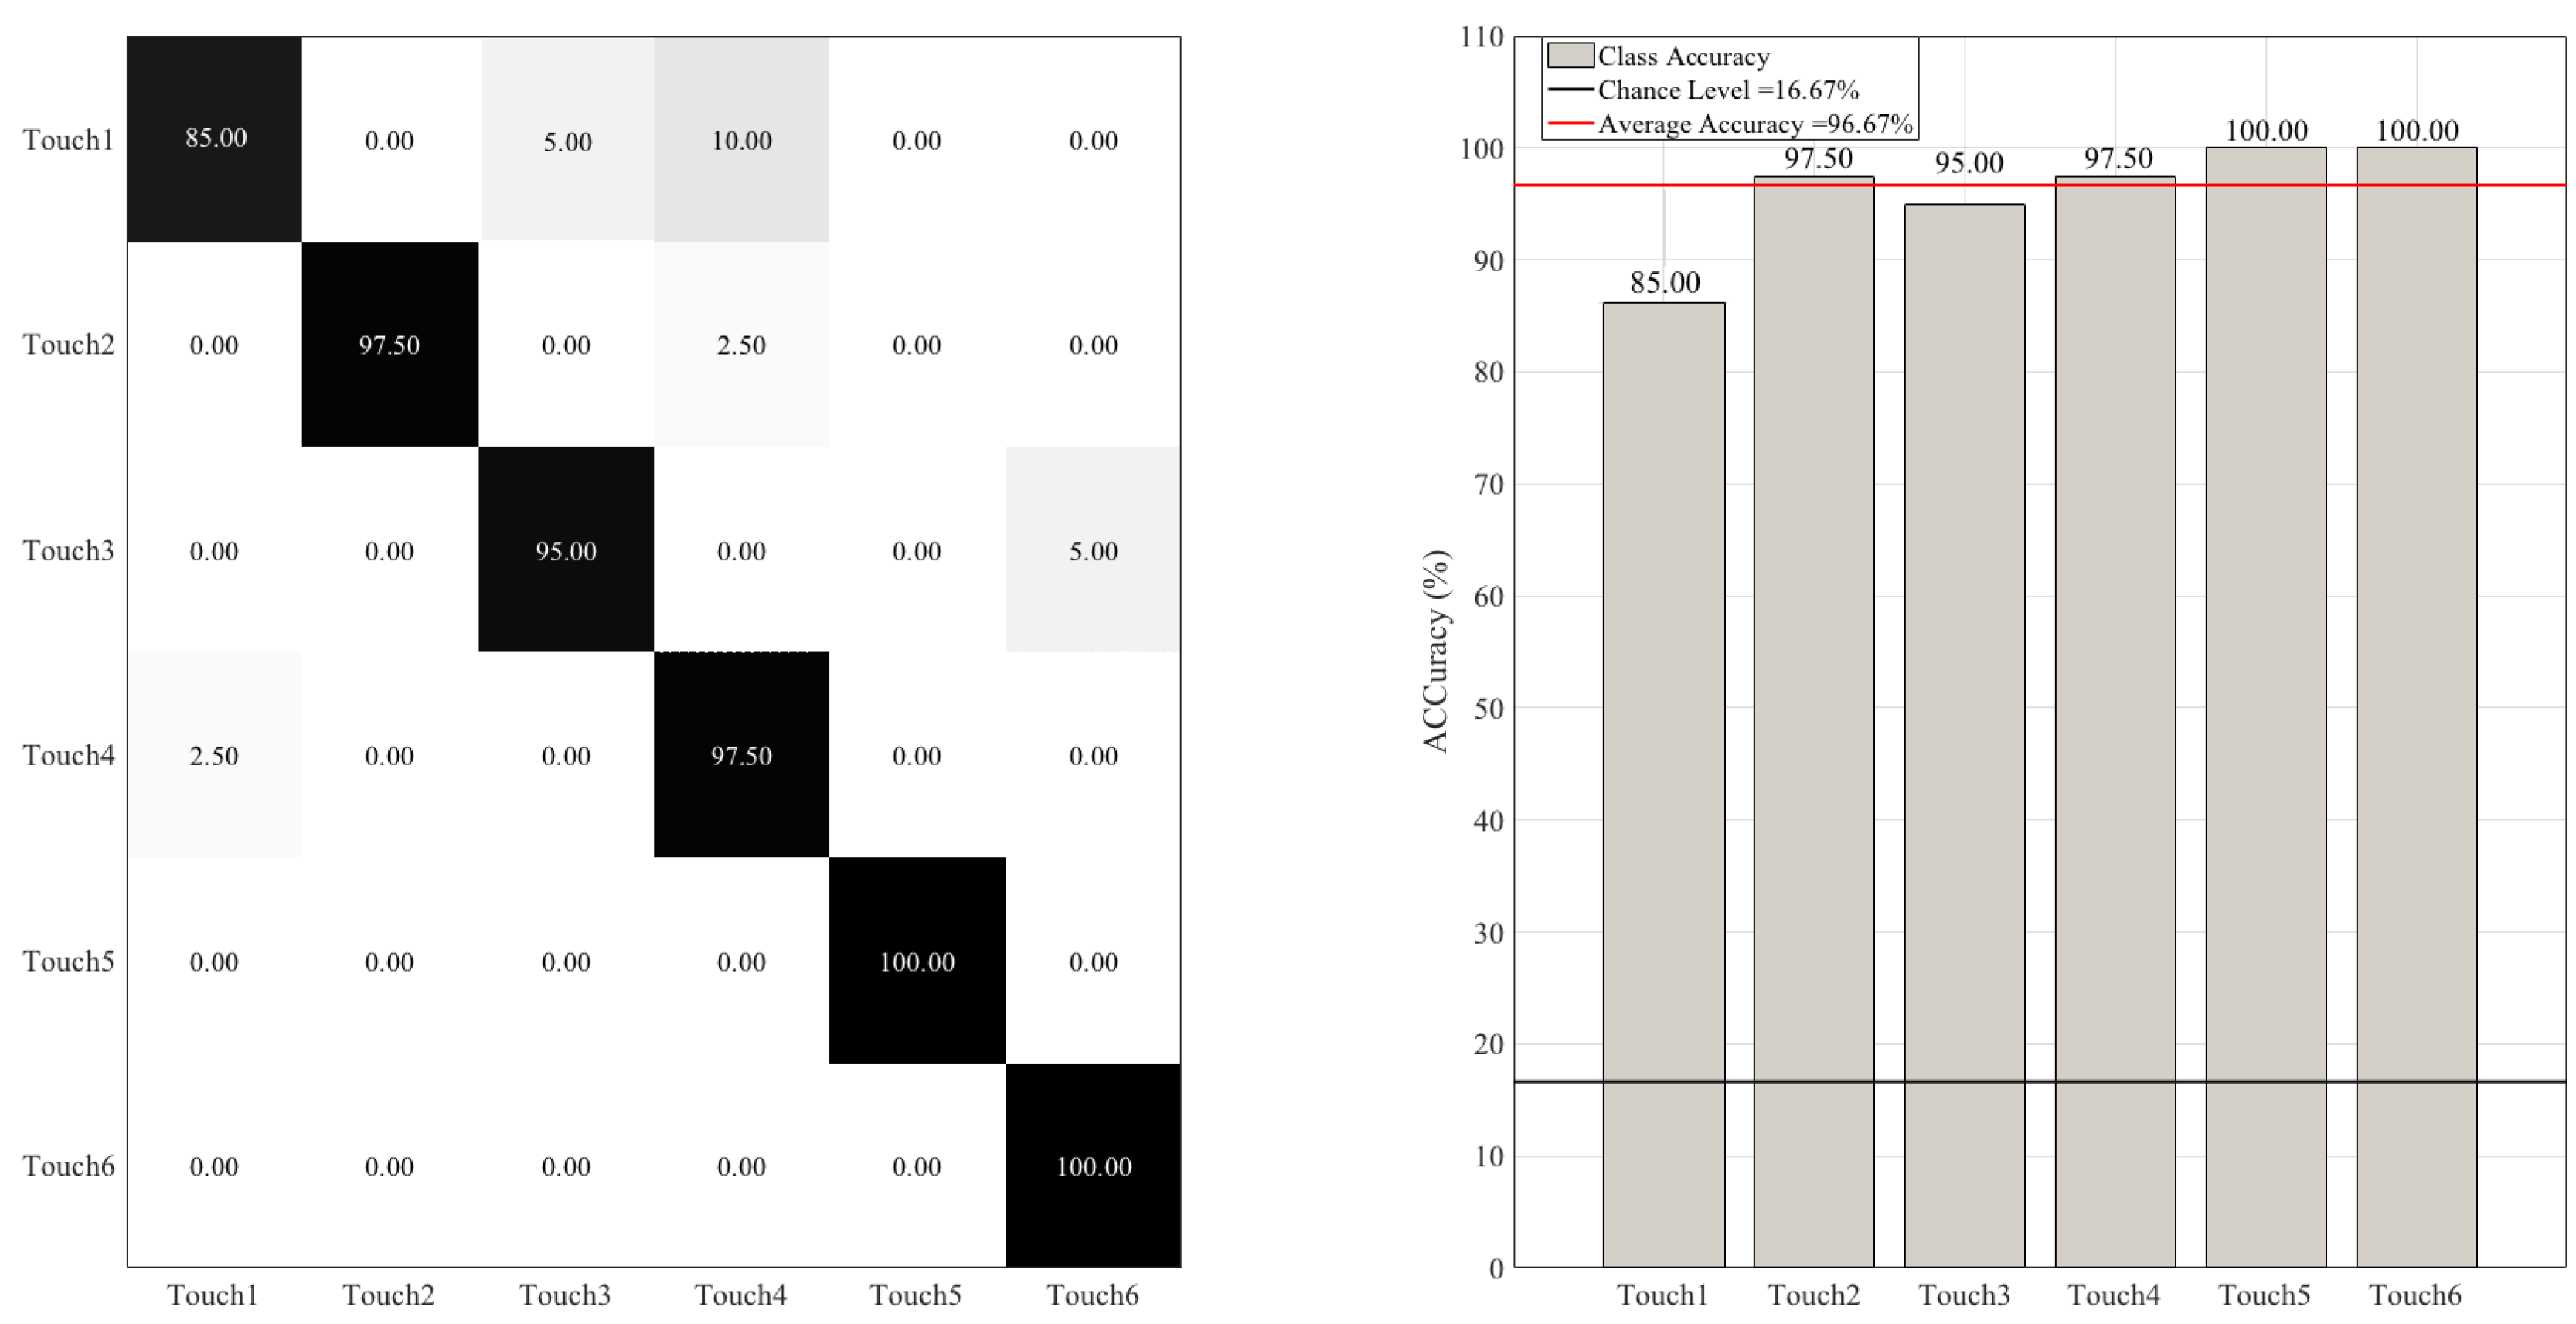
3.2. Between-Gesture Accuracies
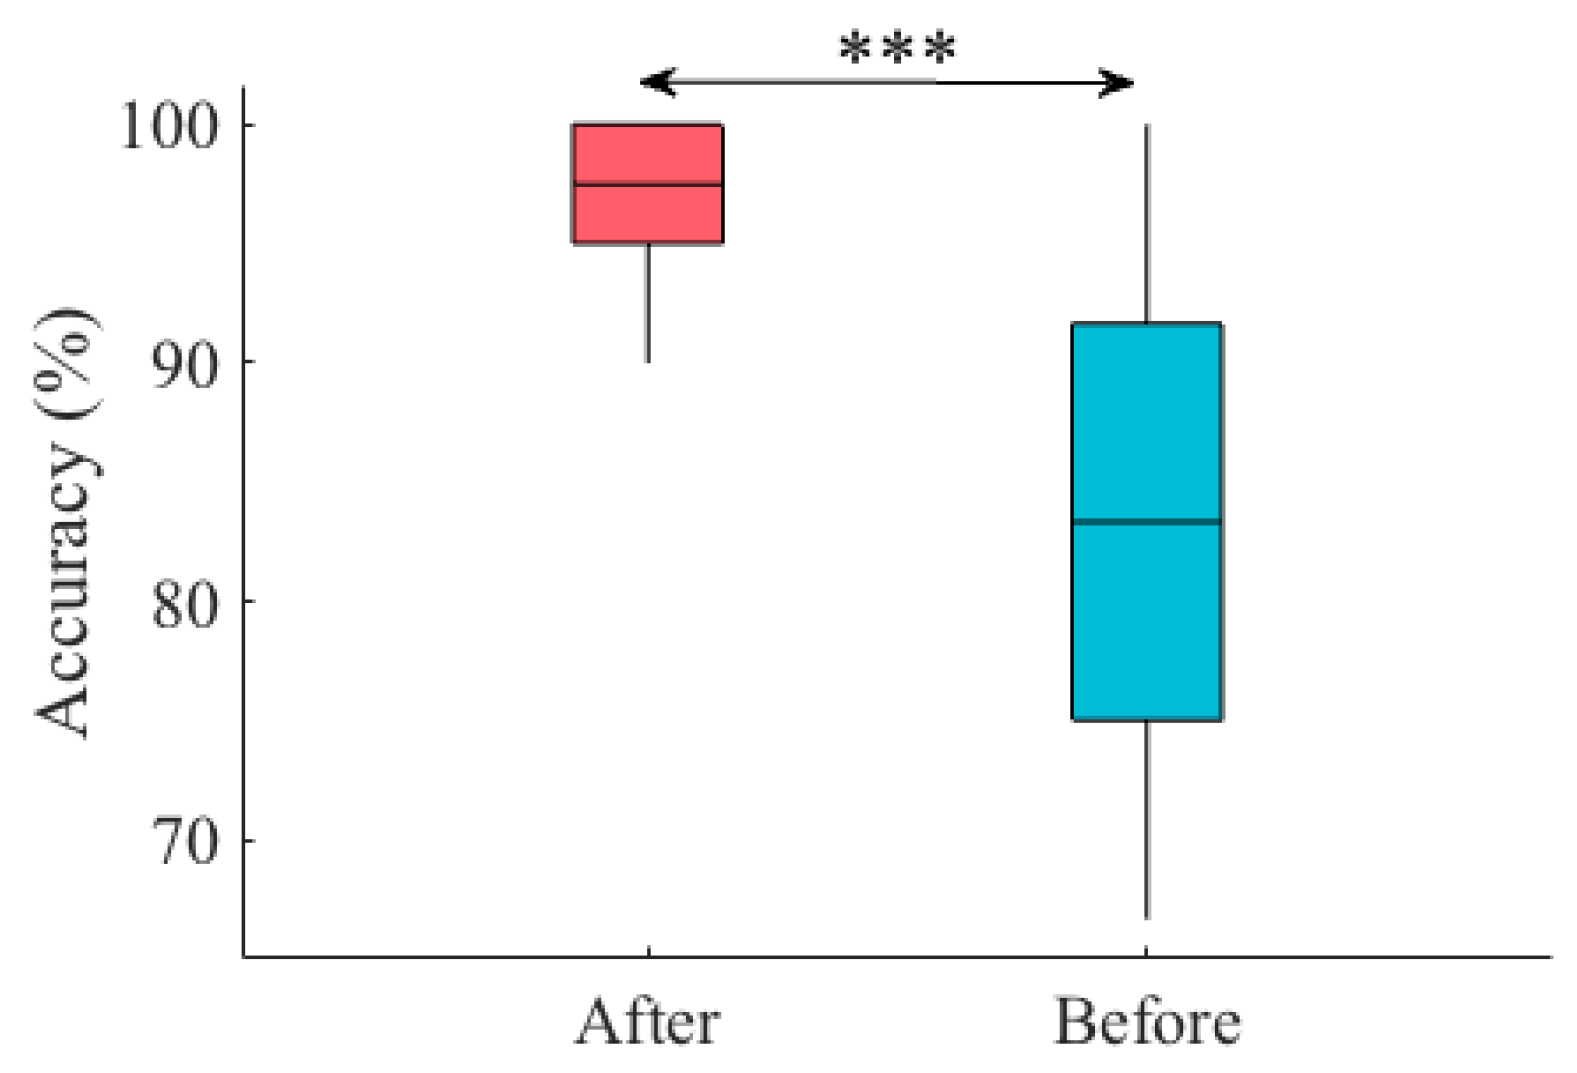
Improving the RF Accuracy
4. Discussion
5. Limitations and Future Directions
Author Contributions
Funding
Conflicts of Interest
Appendix A. Verification of the Non-Overfitting Performance of Random Forest (RF)


| Accuracy | M | SD | CI |
|---|---|---|---|
| Overall | 89.50 | 20.47 | [83.08 86.42] |
| Touch 1 | 89.50 | 20.47 | [84.50 93.00] |
| Touch 2 | 80.50 | 30.06 | [73.50 85.50] |
| Touch 3 | 75.00 | 27.98 | [69.28 80.50] |
| Touch 4 | 81.50 | 25.28 | [76.00 86.00] |
| Touch 5 | 100.00 | 0.00 | [100.00 100.00] |
| Touch 6 | 81.50 | 29.86 | [75.00 86.50] |
Appendix B. RF Performance Using a Larger Number of Touch Gestures
- Rubbing the mannequin’s shoulder gently (Touch7)
- Rubbing the mannequin’s chest strongly (Touch8)
- Rubbing the mannequin’s chest gently (Touch9)


References
- Hertenstein, M.J.; Verkamp, J.M.; Kerestes, A.M.; Holmes, R.M. The communicative functions of touch in humans, nonhuman primates, and rats: A review and synthesis of the empirical research. Genet. Soc. Gen. Psychol. Monogr. 2006, 132, 5–94. [Google Scholar] [CrossRef] [PubMed]
- Field, T. Touch for socioemotional and physical well-being: A review. Dev. Rev. 2010, 30, 367–383. [Google Scholar] [CrossRef]
- Nie, J.; Park, M.; Marin, A.L.; Sundar, S.S. Can You Hold My Hand? Physical warmth in human–robot interaction. In Proceedings of the 7th ACM/IEEE International Conference on Human-Robot Interaction, Boston, MA, USA, 5–8 March 2012; Volume 66, pp. 201–202. [Google Scholar]
- Altun, K.; MacLean, K.E. Recognizing affect in human touch of a robot. Pattern Recognit. Lett. 2015, 66, 31–40. [Google Scholar] [CrossRef]
- Yang, G.Z.; Bellingham, J.; Dupont, P.E.; Fischer, P.; Floridi, L.; Full, R.; Jacobstein, N.; Kumar, V.; McNutt, M.; Merrifield, R.; et al. The grand challenges of Science Robotics. Sci. Robot. 2018, 3, 31–40. [Google Scholar]
- Matarić, M.J. Socially assistive robotics: Human augmentation versus automation. Sci. Robot. 2018, 2, eaam5410. [Google Scholar] [CrossRef]
- Stiehl, W.D.; Breazeal, C. Affective Touch for Robotic Companions. In Proceedings of the International Conference on Affective Computing and Intelligent Interaction (ACII), Beijing, China, 22–24 October 2005; pp. 747–754. [Google Scholar]
- Chang, J.; MacLean, K.; Yohanan, S. Gesture Recognition in the Haptic Creature. In International Conference EuroHaptics; Springer: Berlin/Heidelberg, Germnany, 2010; pp. 385–391. [Google Scholar]
- Nakajima, K.; Itoh, Y.; Hayashi, Y.; Ikeda, K.; Fujita, K.; Onoye, T. Emoballoon a Balloon-Shaped Interface Recognizing Social Touch Interactions. In International Conference on Advances in Computer Entertainment (ACE); Springer: Cham, Switzerland, 2013; pp. 182–197. [Google Scholar]
- Jung, M.M.; Poppe, R.; Poel, M.; Heylen, D.K. Touching the Void–Introducing CoST: Corpus of Social Touch. In Proceedings of the 16th International Conference on Multimodal Interaction (ICMI), Istanbul, Turkey, 12–16 November 2014; pp. 120–127. [Google Scholar]
- Silvera-Tawil, D.; Rye, D.; Velonaki, M. Interpretation of the modality of touch on an artificial arm covered with an eit-based sensitive skin. Int. J. Robot. Res. 2012, 31, 1627–1641. [Google Scholar]
- Naya, F.; Yamato, J.; Shinozawa, K. Recognizing Human Touching Behaviors Using a Haptic Interface for a Pet-Robot. In Proceedings of the International Conference on Systems, Man, and Cybernetics (SMC), Tokyo, Japan, 12–15 October 1999; Volume 2, pp. 1030–1034. [Google Scholar]
- Van Wingerden, S.; Uebbing, T.J.; Jung, M.M.; Poel, M. A Neural Network Based Approach to Social Touch Classification. In Proceedings of the 2014 Workshop on Emotion Representation and Modelling in Human-Computer-Interaction-Systems, Istanbul, Turkey, 16 November 2014; pp. 7–12. [Google Scholar]
- Murray-Smith, R.; Williamson, J.; Hughes, S.; Quaade, T. Stane, Synthesized surfaces for tactile input. In Proceedings of the Twenty-Sixth Annual CHI Conference on Human Factors in Computing Systems, Florence, Italy, 5–10 April 2008; pp. 1299–1302. [Google Scholar]
- Robinson, S.; Rajput, N.; Jones, M.; Jain, A.; Sahay, S.; Nanavati, A. TapBack: Towards Richer Mobile Interfaces in Impoverished Contexts. In Proceedings of the SIGCHI Conference on Human Factors in Computing Systems, Vancouver, BC, Canada, 7–12 May 2011; pp. 2733–2736. [Google Scholar]
- Braun, A.; Krepp, S.; Kuijper, A. Acoustic Tracking of Hand Activities on Surfaces. In Proceedings of the 2nd International Workshop on Sensor-Based Activity Recognition and Interaction, Rostock, Germany, 25–26 June 2015; Volume 9. [Google Scholar]
- Harrison, C.; Schwarz, J.; Hudson, S.E. TapSense: Enhancing Finger Interaction on Touch Surfaces. In Proceedings of the 24th Annual ACM Symposium on User Interface Software and Technology, Santa Barbara, CA, USA, 16–19 October 2011; pp. 627–636. [Google Scholar]
- Alonso-Martin, F.; Malfaz, M.; Sequeira, J.; Gorostiza, J.; Salichs, M.A. A multimodal emotion detection system during human–robot interaction. Sensors 2013, 13, 15549–15581. [Google Scholar] [CrossRef] [PubMed]
- Fleh, S.Q.; Bayat, O.; Al-Azawi, S.; Ucan, O.N. A systematic mapping study on touch classification. Int. J. Comput. Sci. Netw. Secur. 2018, 31, 7–12. [Google Scholar]
- Kim, Y.M.; Koo, S.Y.; Lim, J.G.; Kwon, D.S. A robust online touch pattern recognition for dynamic human–robot interaction. IEEE Trans. Consum. Electron. 2010, 56, 1979–1987. [Google Scholar] [CrossRef]
- Cormen, T.H.; Leiserson, C.E.; Rivest, R.L.; Stein, C. Introduction to Algorithms (Ch. 22); MIT Press: Cambridge, MA, USA, 2009. [Google Scholar]
- Rosenthal, R.; DiMatteo, M.R. Meta-analysis: Recent developments n quantitative methods for literature reviews. Annu. Rev. Psychol. 2001, 52, 59–82. [Google Scholar] [CrossRef] [PubMed]
- Tomczak, M.; Tomczak, E. The need to report effect size estimates revisited. an overview of some recommended measures of effect size. Trends Sport Sci. 2014, 1, 19–25. [Google Scholar]
- Buitinck, L.; Louppe, G.; Blondel, M.; Pedregosa, F.; Mueller, A.; Grisel, O.; Niculae, V.; Prettenhofer, P.; Gramfort, A.; Grobler, J.; et al. API Design for Machine Learning Software: Experiences from the Scikit-Learn Project. In Proceedings of the ECML PKDD Workshop: Languages for Data Mining and Machine Learning, Prague, Czech Republic, 23 September 2013; pp. 108–122. [Google Scholar]
- Kriegeskorte, N.; Simmons, W.K.; Bellgowan, P.S.; Baker, C.I. Circular analysis in systems neuroscience: The dangers of double dipping. Nat. Neurosci. 2009, 12, 535–540. [Google Scholar] [PubMed]
- Scassellati, B.; Boccanfuso, L.; Huang, C.M.; Mademtzi, M.; Qin, M.; Salomons, N.; Ventola, P.; Shic, F. Improving social skills in children with ASD using a long-term, in-home social robot. Sci. Robot. 2018, 3, eaat7544. [Google Scholar]
- Soler, M.V.; Agüera-Ortiz, L.; Rodriguez, J.O.; Rebolledo, C.M.; Muñoz, A.P.; P’érez, I.R.; Ruiz, E.O.; Sánchez, A.B.; Cano, V.H.; Chillón, L.C.; et al. Social robots in advanced dementia. Front. Aging Neurosci. 2015, 7, 133. [Google Scholar]


| Technology | Piezoresistive |
|---|---|
| Pressure Range | 0.1 to 200 PSI (0.007 to 14.1 kg/cm2) |
| Matrix Size | Up to 64 × 256 lines |
| Thickness | From 12 mils (0.3 mm) |
| Mat Sensor Size | Customizable up to 150" (381 cm) |
| 1Scan Speed | Up to 1000 hertz |
| Min Sensing Point Size | 0.188 in2 (1.21 cm2) |
| Stretchability | Up to 158% |
| Accuracy | ±10% |
| Repeatability | ±2% |
| Hysteresis | ±5% |
| Nonlinearity | ±1.5% |
| Calibration | NIST Traceable |
| Classifier | Accuracy | Precision | Recall | F1-Score |
|---|---|---|---|---|
| RandomForest | M = 85.00%, SD = 8.60 | 0.89 | 0.87 | 0.86 |
| Naive Bayes | M = 77.62 %, SD = 10.65 | 0.86 | 0.83 | 0.82 |
| DecisionTree | M = 66.67%, SD = 9.66 | 0.68 | 0.64 | 0.66 |
| KNN | M = 47.45%, SD = 12.90% | 0.57 | 0.54 | 0.53 |
| Support Vector | M = 60.74%, SD = 12.68% | 0.60 | 0.62 | 0.61 |
| Logistic Regression | M = 58.28%, SD = 14.47 | 0.57 | 0.56 | 0.58 |
| Models | p < | W(198) | r |
|---|---|---|---|
| RF vs. KNN | 0.00001 | 12.12 | 0.86 |
| RF vs. SVC | 0.00001 | 10.86 | 0.77 |
| RF vs. LR | 0.00001 | 11.06 | 0.78 |
| RF vs. NB | 0.00001 | 4.54 | 0.32 |
| RF vs. DT | 0.00001 | 10.08 | 0.71 |
| NB vs. KNN | 0.00001 | 11.33 | 0.80 |
| NB vs. LR | 0.00001 | 9.04 | 0.64 |
| NB vs. SVC | 0.00001 | 8.42 | 0.60 |
| NB vs. DT | 0.00001 | 7.07 | 0.50 |
| KNN vs. SVC | 0.00001 | −7.07 | −0.50 |
| KNN vs. LR | 0.00001 | −5.06 | −0.36 |
| KNN vs. DT | 0.00001 | −9.67 | −0.68 |
| SVC vs. LR | 0.00001 | 7.07 | 0.50 |
| SVC vs. DT | 0.01 | −3.02 | −0.21 |
© 2020 by the authors. Licensee MDPI, Basel, Switzerland. This article is an open access article distributed under the terms and conditions of the Creative Commons Attribution (CC BY) license (http://creativecommons.org/licenses/by/4.0/).
Share and Cite
Keshmiri, S.; Shiomi, M.; Sumioka, H.; Minato, T.; Ishiguro, H. Gentle Versus Strong Touch Classification: Preliminary Results, Challenges, and Potentials. Sensors 2020, 20, 3033. https://doi.org/10.3390/s20113033
Keshmiri S, Shiomi M, Sumioka H, Minato T, Ishiguro H. Gentle Versus Strong Touch Classification: Preliminary Results, Challenges, and Potentials. Sensors. 2020; 20(11):3033. https://doi.org/10.3390/s20113033
Chicago/Turabian StyleKeshmiri, Soheil, Masahiro Shiomi, Hidenobu Sumioka, Takashi Minato, and Hiroshi Ishiguro. 2020. "Gentle Versus Strong Touch Classification: Preliminary Results, Challenges, and Potentials" Sensors 20, no. 11: 3033. https://doi.org/10.3390/s20113033
APA StyleKeshmiri, S., Shiomi, M., Sumioka, H., Minato, T., & Ishiguro, H. (2020). Gentle Versus Strong Touch Classification: Preliminary Results, Challenges, and Potentials. Sensors, 20(11), 3033. https://doi.org/10.3390/s20113033