1. Introduction
Health 4.0 is a concept derived from the Industry 4.0 paradigm and, as such, it shares the same design principles, such as interoperability, virtualization, decentralization, real-time capability, service orientation, and modularity [
1]. One of the major impacts expected from Health 4.0 is the personalization of health and care, next to real time, for patients [
2]. In this regard, wearable sensing devices are key factors for revolutionizing healthcare diagnostics and delivery [
3,
4]. Wearable devices may enable personalized preventative care, by exploiting the early detection of vital sign anomalies in patient to improve healthcare outcomes [
5,
6] and to allow continuous and remote monitoring of these values [
7]. There are numerous biomedical parameters that can be monitored through wearable, portable sensing solutions: electrocardiogram, oxygen saturation, heart rate, blood pressure. For these biomedical parameters, there are a number of low-cost, wearable devices that are commercially available.
On the other hand, wearable technological solutions for monitoring skin hydration are not as consolidated. In fact, as detailed in the following section, in the literature, different sensors and techniques have been developed for monitoring skin hydration. However, most of the state-of-the-art skin hydration measuring devices are not wearable; hence, they are unsuitable for real-time use and the patient has to stop their activities to carry out the measurement. These devices cannot be used, for example, in monitoring sports activities, or by patients with walking difficulties who prefer to have a wearable device, or by people who are unable to use electronic equipment to carry out autonomously the measurements.
In this context, microwave-based measurement systems represent a convenient solution for noninvasive monitoring of hydration, mostly thanks to the possibility of adapting the measurement approach to the specific application context. In microwave techniques, skin hydration measurements rely on the strong relationship between dielectric properties and water content of biological tissues [
8]. Starting from these considerations, this work addresses the feasibility of an innovative wearable device that monitors skin hydration through a time-domain reflectometry (TDR)-based system. In particular, the proposed system relies on the combined use of TDR and of a wearable SE element (fabricated on a printed circuit board) to assess in real-time skin hydration. This monitoring system relies on measuring dielectric permittivity and electrical conductivity variations of the skin to infer the hydration status. In fact, the composition and metabolic activity of the skin alter its electrical properties: increasing (or decreasing) the water content of the skin increases (or decreases) the conductivity and the dielectric permittivity of the skin.
In addition to real-time measurements, TDR offers several other advantages, such as low cost, portability, possibility of remote control and high customization. Furthermore, through multiplexing, it is possible to connect one single TDR measuring device to a number of probes; in this way, it would be possible to monitor simultaneously different body parts. In the following sections, after describing the TDR-based wearable monitoring system, the results of the experimental characterization are presented and discussed in detail.
The present work is organized as follows.
Section 2 addresses, in more detail, the rationale behind this work and provides an overview of state-of-the-art solutions for monitoring skin hydration.
Section 3 describes the basic theoretical background behind the proposed system and the used experimental setup.
Section 4 introduces to the experiments whose results are reported in
Section 5. Finally, conclusions and future work are outlined in
Section 6.
2. Rationale of the Work and Review of State-of-the-Art Methods for Monitoring Human Hydration
Skin hydration plays an important role in the analysis of various diseases and determines the effectiveness of medical therapies. In fact, there are several situations in which it is necessary to monitor skin hydration: dermatological diseases represent the major field of application of a system of this type. A number of skin conditions last a long time and some may start in childhood and continue into adulthood. Atopic dermatitis is a common, complex disease that can affect the quality of life of patients and families to a significant degree. In addition, this problem primarily affects children with an important increase of Transepidermal water loss (TEWL) leading to significant dehydration status of skin [
9,
10]. For this, a wearable monitoring skin hydration system represents the fundamental device to help mothers in the constant control on the kid’s sensitive skin, in order to supervise positive effects of the medical treatment and collaborate optimally with doctors. In addition to this one, dermatological illnesses that share the presence of skin dehydration also include ichthyosis [
11], psoriasis [
12] and eczema [
13].
A skin hydration sensor can be very useful in many other contexts: consider people employed in working environments characterized by the continuous presence of cold, wind, UV rays, low humidity or pollution. These factors easily alter the hydration state of the skin [
14,
15,
16] causing severe damage in its natural barrier function. There are many working environments characterized by at least one condition of this type; consequently, monitoring the hydration of the skin could certainly be useful to intervene promptly before the skin damage becomes more serious and requires more important pharmacological treatments. A different scenario, but equally important, regards menopausal women affected by a decrease in hormone estrogen that causes various skin alterations as dehydration of stratum corneum [
17,
18]. Certainly, also stress, smoke and alcohol can cause deteriorating effects on the skin and its hydration status [
19]. Attention is required also for many elderly people that have fragile, thin and dry skin due to cellular aging. Hydration skin measurement is also useful in cosmetology, to monitor the health and hydration of the skin subjected to chemical, biochemical, physical or surgical treatments which can stress it before obtaining the desired effects [
20,
21]. All these cases demonstrate very clearly the primary importance of a skin hydration sensing system to detect problems in skin hydration that could not be diagnosed through techniques that measure total body water (as bioimpedance): a check of total body water, in fact, will give no useful information because a subject may be normally hydrated inside but he could suffer from dermatological diseases or he might have to do with some of the aforementioned conditions, which affect his state of superficial skin hydration. In addition, another strong point of this system is the possibility of carrying out measurements on localized parts of the body (arms, legs, etc.) where necessary.
Finally, studies have demonstrated the correlation between skin hydration and total body water level. In fact, diseases such as hypothyroidism, scleroderma and diabetes cause a significant decrease in body water level, which generally reflects into dry skin: many studies, in fact, show a close correlation between skin hydration and total body water level [
22,
23,
24]. This suggests that while skin hydration is contingent to several factors (nonetheless to external/environmental ones), it is also an indicator of possible illness that brings a global dehydration which can manifest also in dry skin.
In such a context, the major purpose of the proposed sensing system is to monitor skin hydration in those situations that directly affect the skin, as explained above, but also in the cases of more complex diseases affecting the whole organism, our system may play an important role. In this context, in fact, a skin hydration sensor can be useful as indicator that pharmacological therapy is not functioning properly, or as aid to suffering people to monitor their symptoms. For all these reasons, it is important to develop a measurement system for sensing skin hydration status and, also in cases of at-home patients, for allowing the doctor to check this parameter remotely.
The sensing technology of state-of-the-art systems, typically, relies on confocal Raman spectroscopy [
25] which detects skin hydration through the analysis of the light that is scattered by the tissue. However, this method is quite expensive. Methods such as near-IR spectroscopy [
26], or terahertz spectroscopy [
27] have the same cost problem. Skin hydration levels can also be characterized through measurements of skin thermal conductivity [
28]; nevertheless, this approach is effective only in predicting the depth of a burn through the analysis of the tissue water content and thermal properties. Recently, a system for hydration level estimation in the human body using the galvanic skin response has been presented in [
29]. However, most devices are based on skin impedance measurements [
30,
31] through the placement of two electrodes on the skin: an increase in hydration corresponds to a decrease in skin impedance due to an increase in conductivity and dielectric constant. Other methods are based on bio-impedance measurements [
32]: two or more electrodes placed on the skin are used to inject a controlled current and to measure the resulting voltage. Nevertheless, despite the large use of these procedures, the related measurement accuracy is significantly influenced by various effects such as by the variations of some physiological and environmental parameters. Other monitoring systems use a capacitive principle [
33,
34]: the stratum corneum is essentially a dielectric medium and its capacitance may change with the distribution of water in the skin, which directly affects the electrical field penetration into skin. In all of these types of systems, the measurement depth depends on the geometrical factors of the measurement probe or sensing element (SE). This means that measured hydration may change between the devices since there is a concentration gradient of water in the stratum corneum. Recent developments have also led to the creation of tattoos for monitoring skin hydration [
35]; however, these types of systems have a short lifetime and they are not suitable for long-term skin hydration monitoring. Clearly, this review does not take into account methods that perform in vivo measurements by directly extracting fluids from the skin through microneedles. In fact, non-invasiveness is of the utmost importance for remote patient monitoring.
4. Description of the Experiments
For validating the proposed system, TDR measurements were carried out on with the SE in the following conditions:
immersed in ultrapure water and sugar solutions;
immersed in saline solutions with sugar;
placed on human foreskin arm; and
placed in contact with a sample of animal hide.
The goal of the experiments was to confirm the possibility of relating skin hydration to the variation of two electrical parameters:
the relative dielectric constant (), which is derived from the TDR reflectogram and in particular, from the evaluation of the apparent length of the sensing element,
by evaluating the electrical conductivity of the skin (), measured from the steady-state value of the reflection coefficient, evaluated from the TDR reflectogram.
The #1 and #2 sets of experiments were carried out to assess the sensor sensitivity to changes in permittivity and conductivity for different concentrations of these substances in ultrapure water. It should be mentioned that tissue-equivalent liquids are largely employed in specific absorption rate (SAR) compliance assessment tests of wireless devices (i.e., IEC 62209-1). One of the common “recipes” to obtain liquid solutions with dielectric characteristics “mimicking” those of human tissues is to add 50% to 60% of sugar to pure water. If also the conductivity has to be “emulated”, and additional 1% to 6% of salt is further added. The solutions used in the present study cover a variation of dielectric properties, which largely encompasses those of human tissues, and human skin in particular.
After verifying the capability of the system to detect these variations, the set #3 of experiments consisted in analyzing the TDR response in different hydration states of the skin (in particular, of a person’s forearm).
Finally, the experimental session #4 was carried out by placing the SE in contact with a sample of animal hide. Using this sample allowed to bring the hide sample to known values of hydration and experiment on larger hydration ranges.
5. Experimental Results
5.1. Ultrapure Water and Sugar Solutions
The preliminary experiments were conducted with the SE immersed in reference liquid solutions. The first experimental session, TDR responses associated with ultrapure water and ultrapure water with different mass concentrations of sugar were compared. Seven solutions in total were mixed, starting with the lowest value of sugar mass concentration in water (10%), to the highest value (70%), with a 10% step.
Figure 3 shows the trend of the TDR reflectograms for the considered solutions.
It can be noticed that the value corresponding to the beginning of the probe, remains the same because, up to that point, there is no sensing capability. On the other hand, the abscissa value corresponding to the end of the sensing element, , moves towards lower values as the percentage of sugar increases. Overall, the apparent length of the probe decreases with the increase of sugar concentration.
It can be noticed that the apparent distance of the SE tends to decrease as the concentration of sugar increases. Such a decrease reflects a decrease in dielectric permittivity.
This phenomenon depends on the decrease of free water with the increase of sugars dissolved in the solution. In fact, when the sugar percentage is low, then few water molecules bind to the sugar molecules and in this way the free water molecules are still dominant within the solution. As the weight percentage of dissolved sugar increases, however, more and more molecules will be involved in chemical bonds with the sugar and fewer free water molecules will be present in the solution.
The FD results were obtained by converting the TDR data into the FD domain, through a fast Fourier transform (FFT)-based processing. A 15 m-long window guaranteed good accuracy in the estimation of the reflection scattering parameter, . This window length allows an optimal trade-off between resolution for the estimation of the apparent length and the possibility of an accurate estimation of the conductivity (which can be retrieved from the portion of reflectogram at “long” distances, practically corresponding to the DC condition).
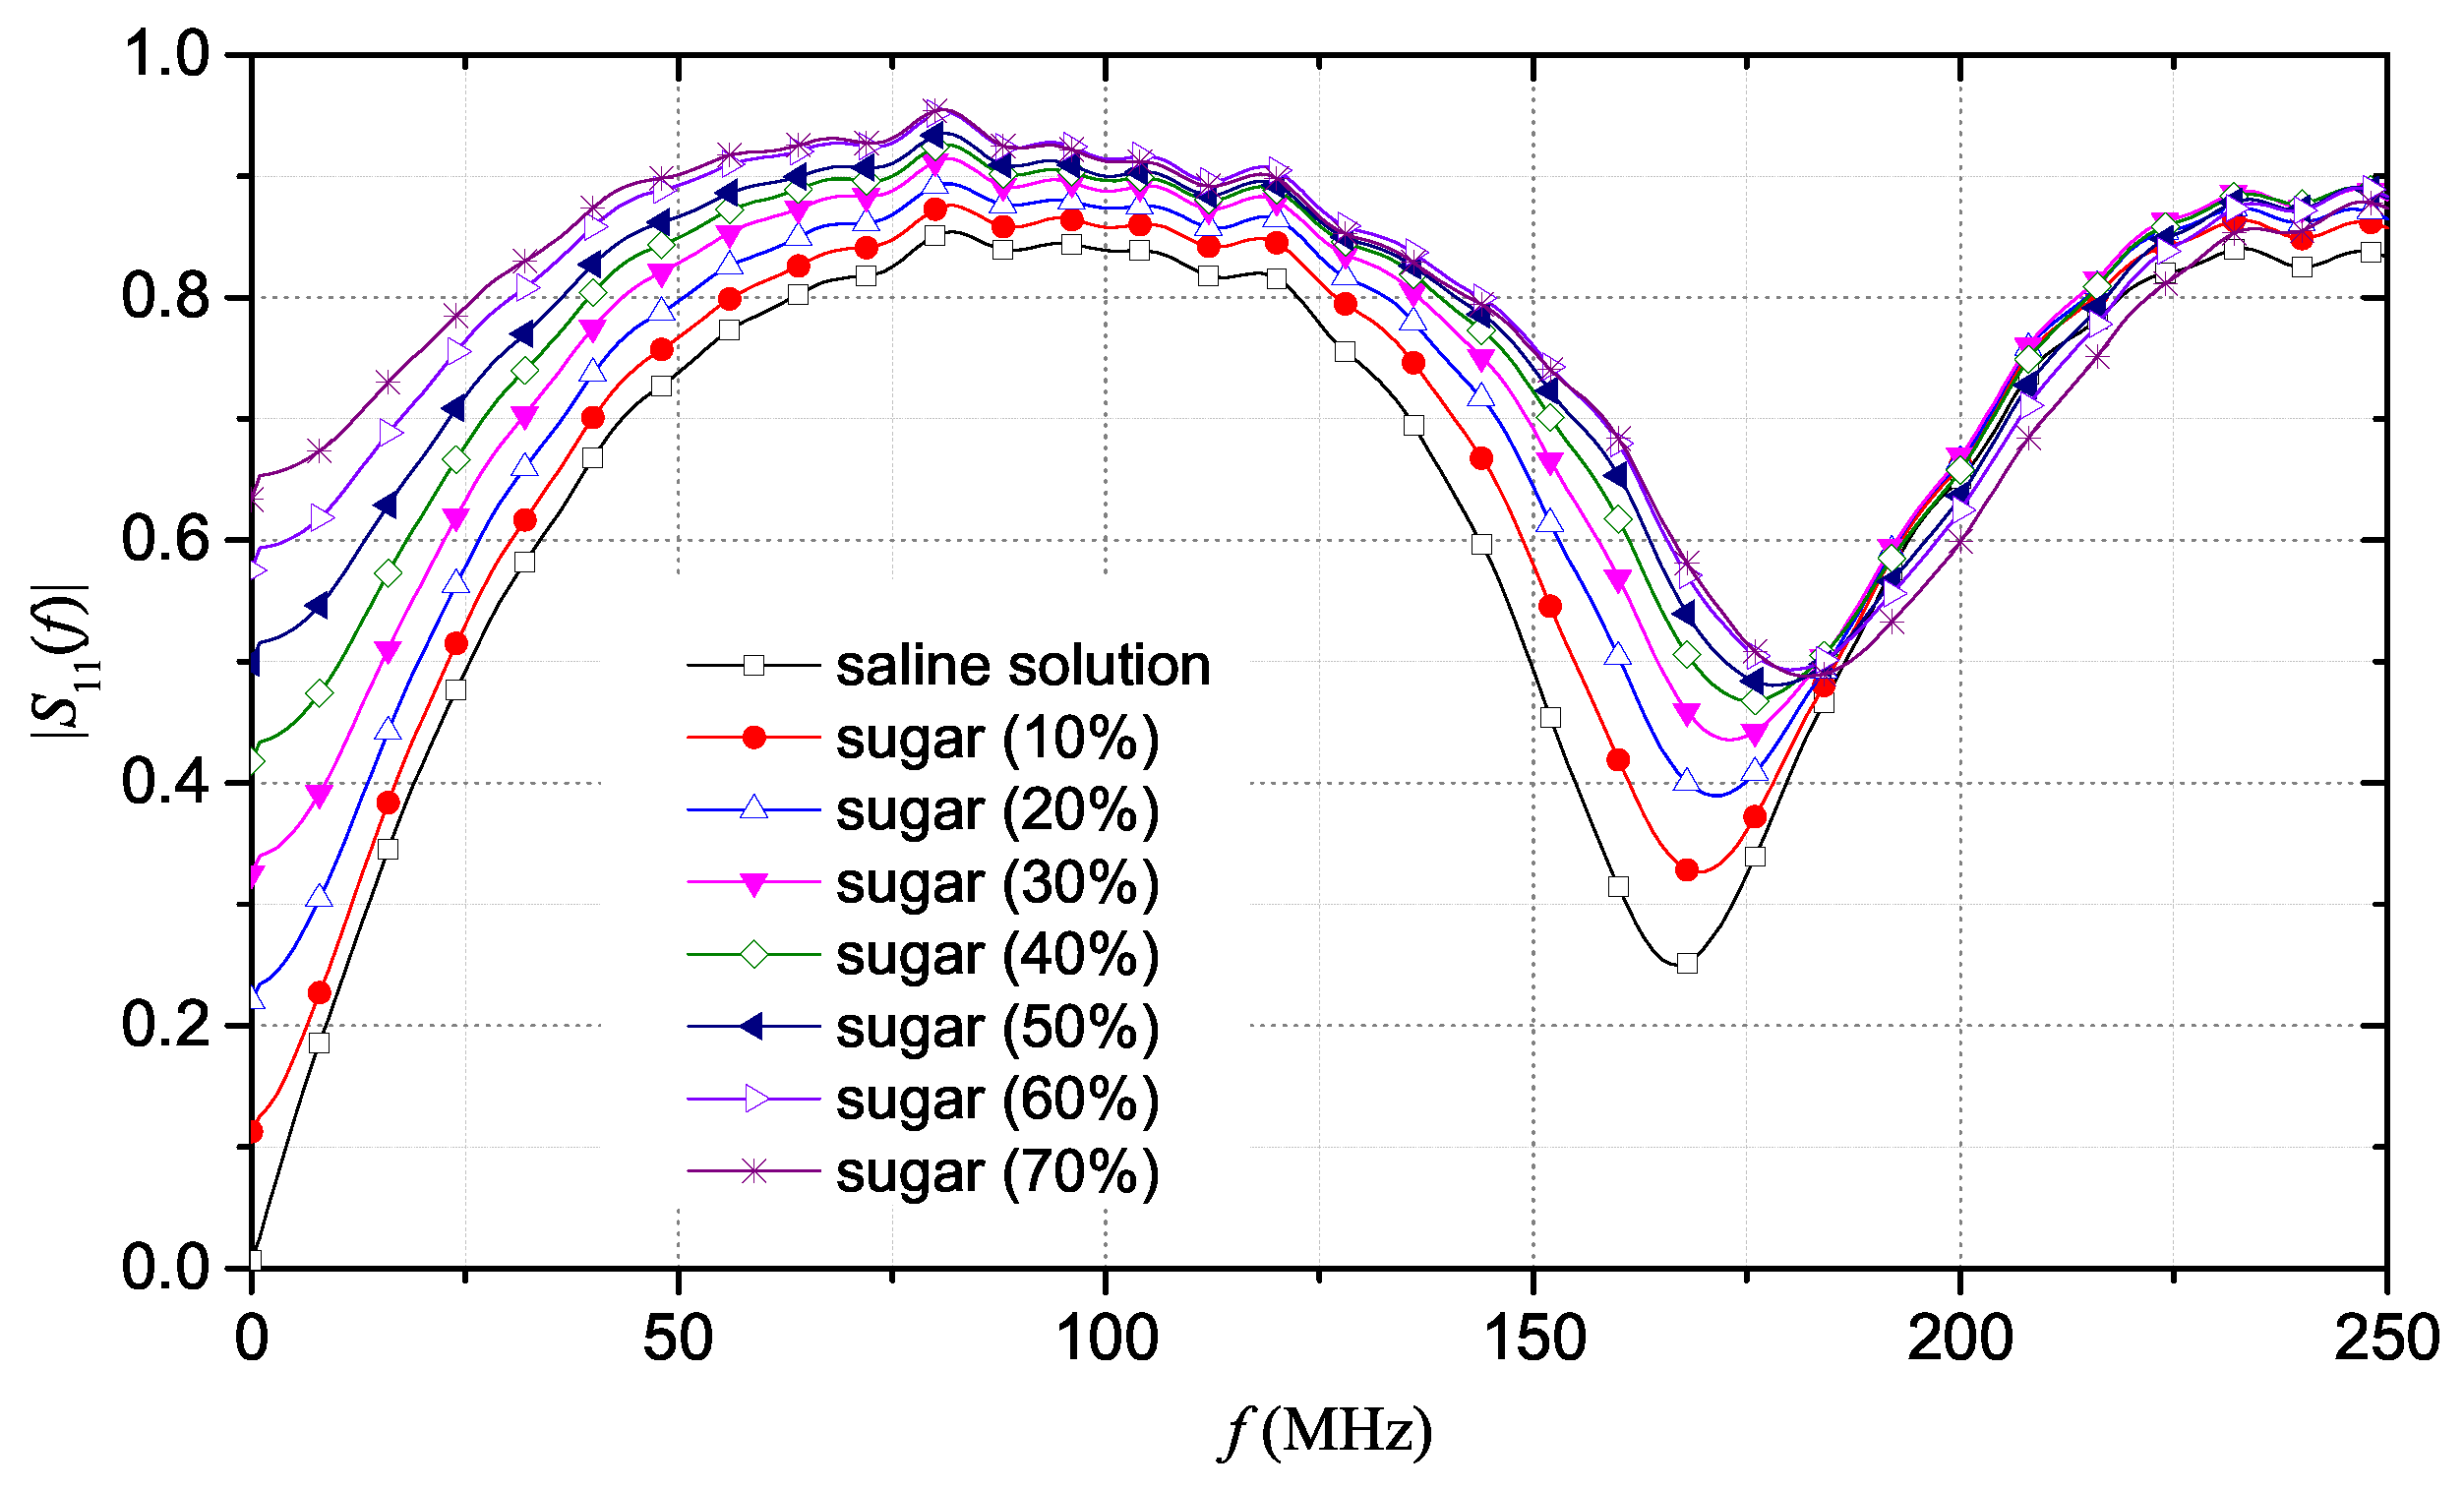
Figure 4 shows the magnitude of
, in the 0–250 MHz frequency range, which is the range where changes in the
behavior were more evident. The
curves exhibit the typical minima: for each solution, the difference in frequency between two consecutive minima (
) is directly related to the change in the apparent distance of the SE immersed in the solution [
40]. It is possible to note that, as sugar concentration increases, the minima of the curve shift toward higher frequency values and, at the same time, the magnitude of the reflection scattering parameter decreases. With regard to the static conductivity,
, it can be seen that there is no significant variation for the different solutions: in fact, by observing
Figure 4, the curves of the
are practically superimposed at 0 Hz.
5.2. Saline Solution with Sugar
To emulate a material with dielectric parameters similar to those of human skin, a solution with a reference = 0.10 S/m was prepared and the same different concentrations of sugar were dissolved. Also in this case, mass concentration of sugar ranging from 10% to 70%, with a 10% step were dissolved.
Figure 5a shows that, as expected, the apparent distance of the SE continues to decrease as the concentration of sugar increases; however, in this case, also the conductivity of the solution decreases. This phenomenon is highlighted by the trend of reflection coefficient
that, at long distance, is intrinsically related to the static electrical conductivity of the solution (
Figure 5b). As the sugar content increases, the corresponding
increases; this happens because the value of
of the solution decreases.
Also in this case, starting from the TDR obtained data, the corresponding
information was extrapolated.
Figure 6 shows the trend of the
in the same frequency range analyzed in the previous case. Also in this case, the minima of the curves of
shift in frequency toward higher frequencies, while the magnitude increases with increasing sugar concentrations in saline solution.
With regard to the static conductivity, in this case it is possible to notice different magnitude values of at 0 Hz. In particular, this value increases as the sugar concentration in the saline solution increases and this means that the magnitude of scattering parameter increases as the conductivity of the solutions decreases.
5.3. Measurements on Human Forearm Skin
After testing the sensitivity of the SE with respect to changes in dielectric permittivity and static conductivity of reference liquid solutions, the SE was attached on the internal surface of a smartphone armband (typically used for running) in order to carry out measurements directly on human skin, as shown in
Figure 7.
Figure 8 shows a picture of the experimental setup.
Measurements were carried out for four different forearm hydration states. The first condition was that of the forearm in dry condition. Then, a skin lotion was applied to the forearm to increase the skin hydration level and the measurement was repeated. Subsequently, after the lotion had been absorbed almost completely by the skin, the forearm was wetted with water; also in this condition, another TDR measurement was carried out. Finally, the forearm was dried with paper to remove lotion and water residues, and measurement was carried out after few minutes. However, in this situation the forearm was not completely dry.
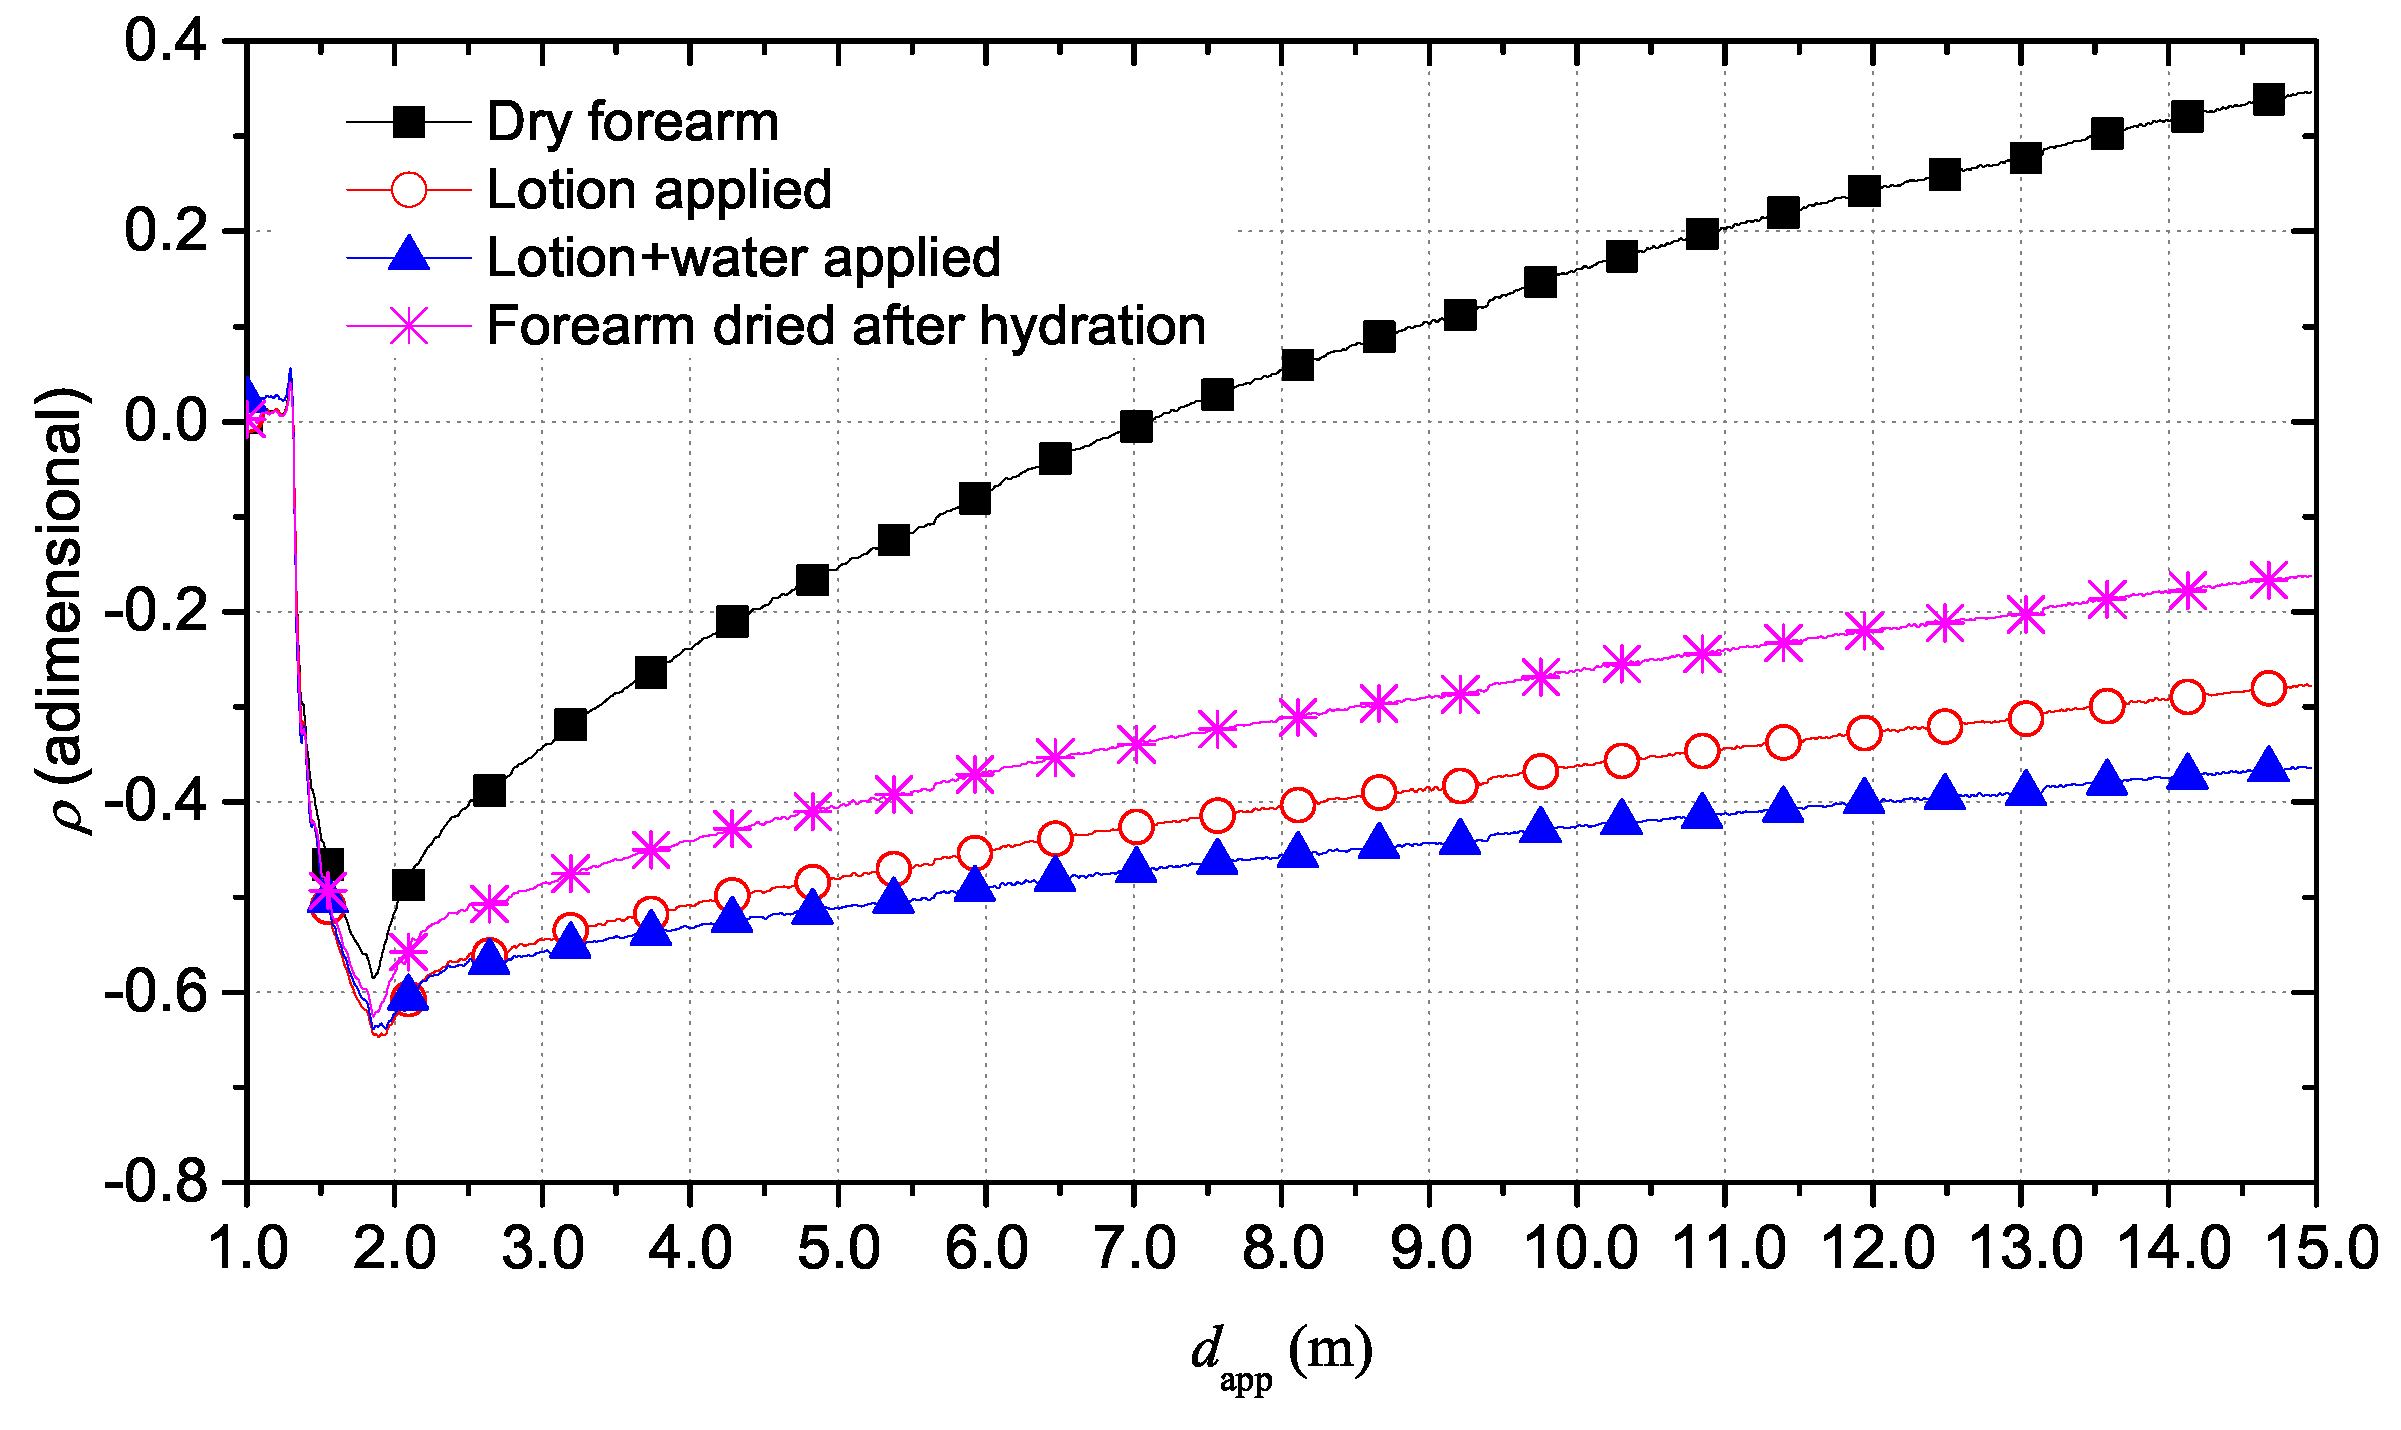
Figure 9 shows the TDR reflectograms associated to the four conditions described above. The results are in good agreement with the described forearm conditions.
As aforementioned, the reflection coefficient
value at long distances is closely related to the static conductivity
. The dry forearm exhibits the highest value of
at 15 m, which corresponds to the lowest value of static conductivity
compared to the other cases. In fact, the anhydrate skin of forearm has lower content of water and therefore a lower value of conductivity. On the other hand, the highest hydration situation is the case of lotion and water applied on the skin and, predictably, it corresponds to the lowest value of
at 15 m, result of the largest increase in conductivity of the skin. In an intermediate situation, there is the case of only lotion applied to the skin, before applying water. In this condition, the forearm is less hydrated than the previous condition and, for this reason, an increase of the
value can be observed: this corresponds to a lower conductivity value due to a lower hydration state. Finally, the forearm was dried up and, after several minutes, the measurement was repeated to observe the effects of a moisturizing action over time. Clearly, in this case, the forearm was not completely dry due to strong previous hydration procedure and it was slightly moist. For this, the resulting TDR reflectogram differs from that of the dry forearm. In particular, the reflection coefficient
at 15 m is lower than that of the dry forearm but it is higher than the
value for the two cases of lotion and water applied to the skin. This means that, in this situation, the effect of hydration still exists but it is lower due to the progressive absorption of moisturizing substances. In fact, the value of
corresponds to a lower conductivity with respect to the cases with lotion and cream but a higher conductivity than a completely dry skin. This is all due to the persisting hydrating effect, which tends to disappear over time up to the starting condition. The extrapolation of data in the frequency domain allows to analyze the trend of the
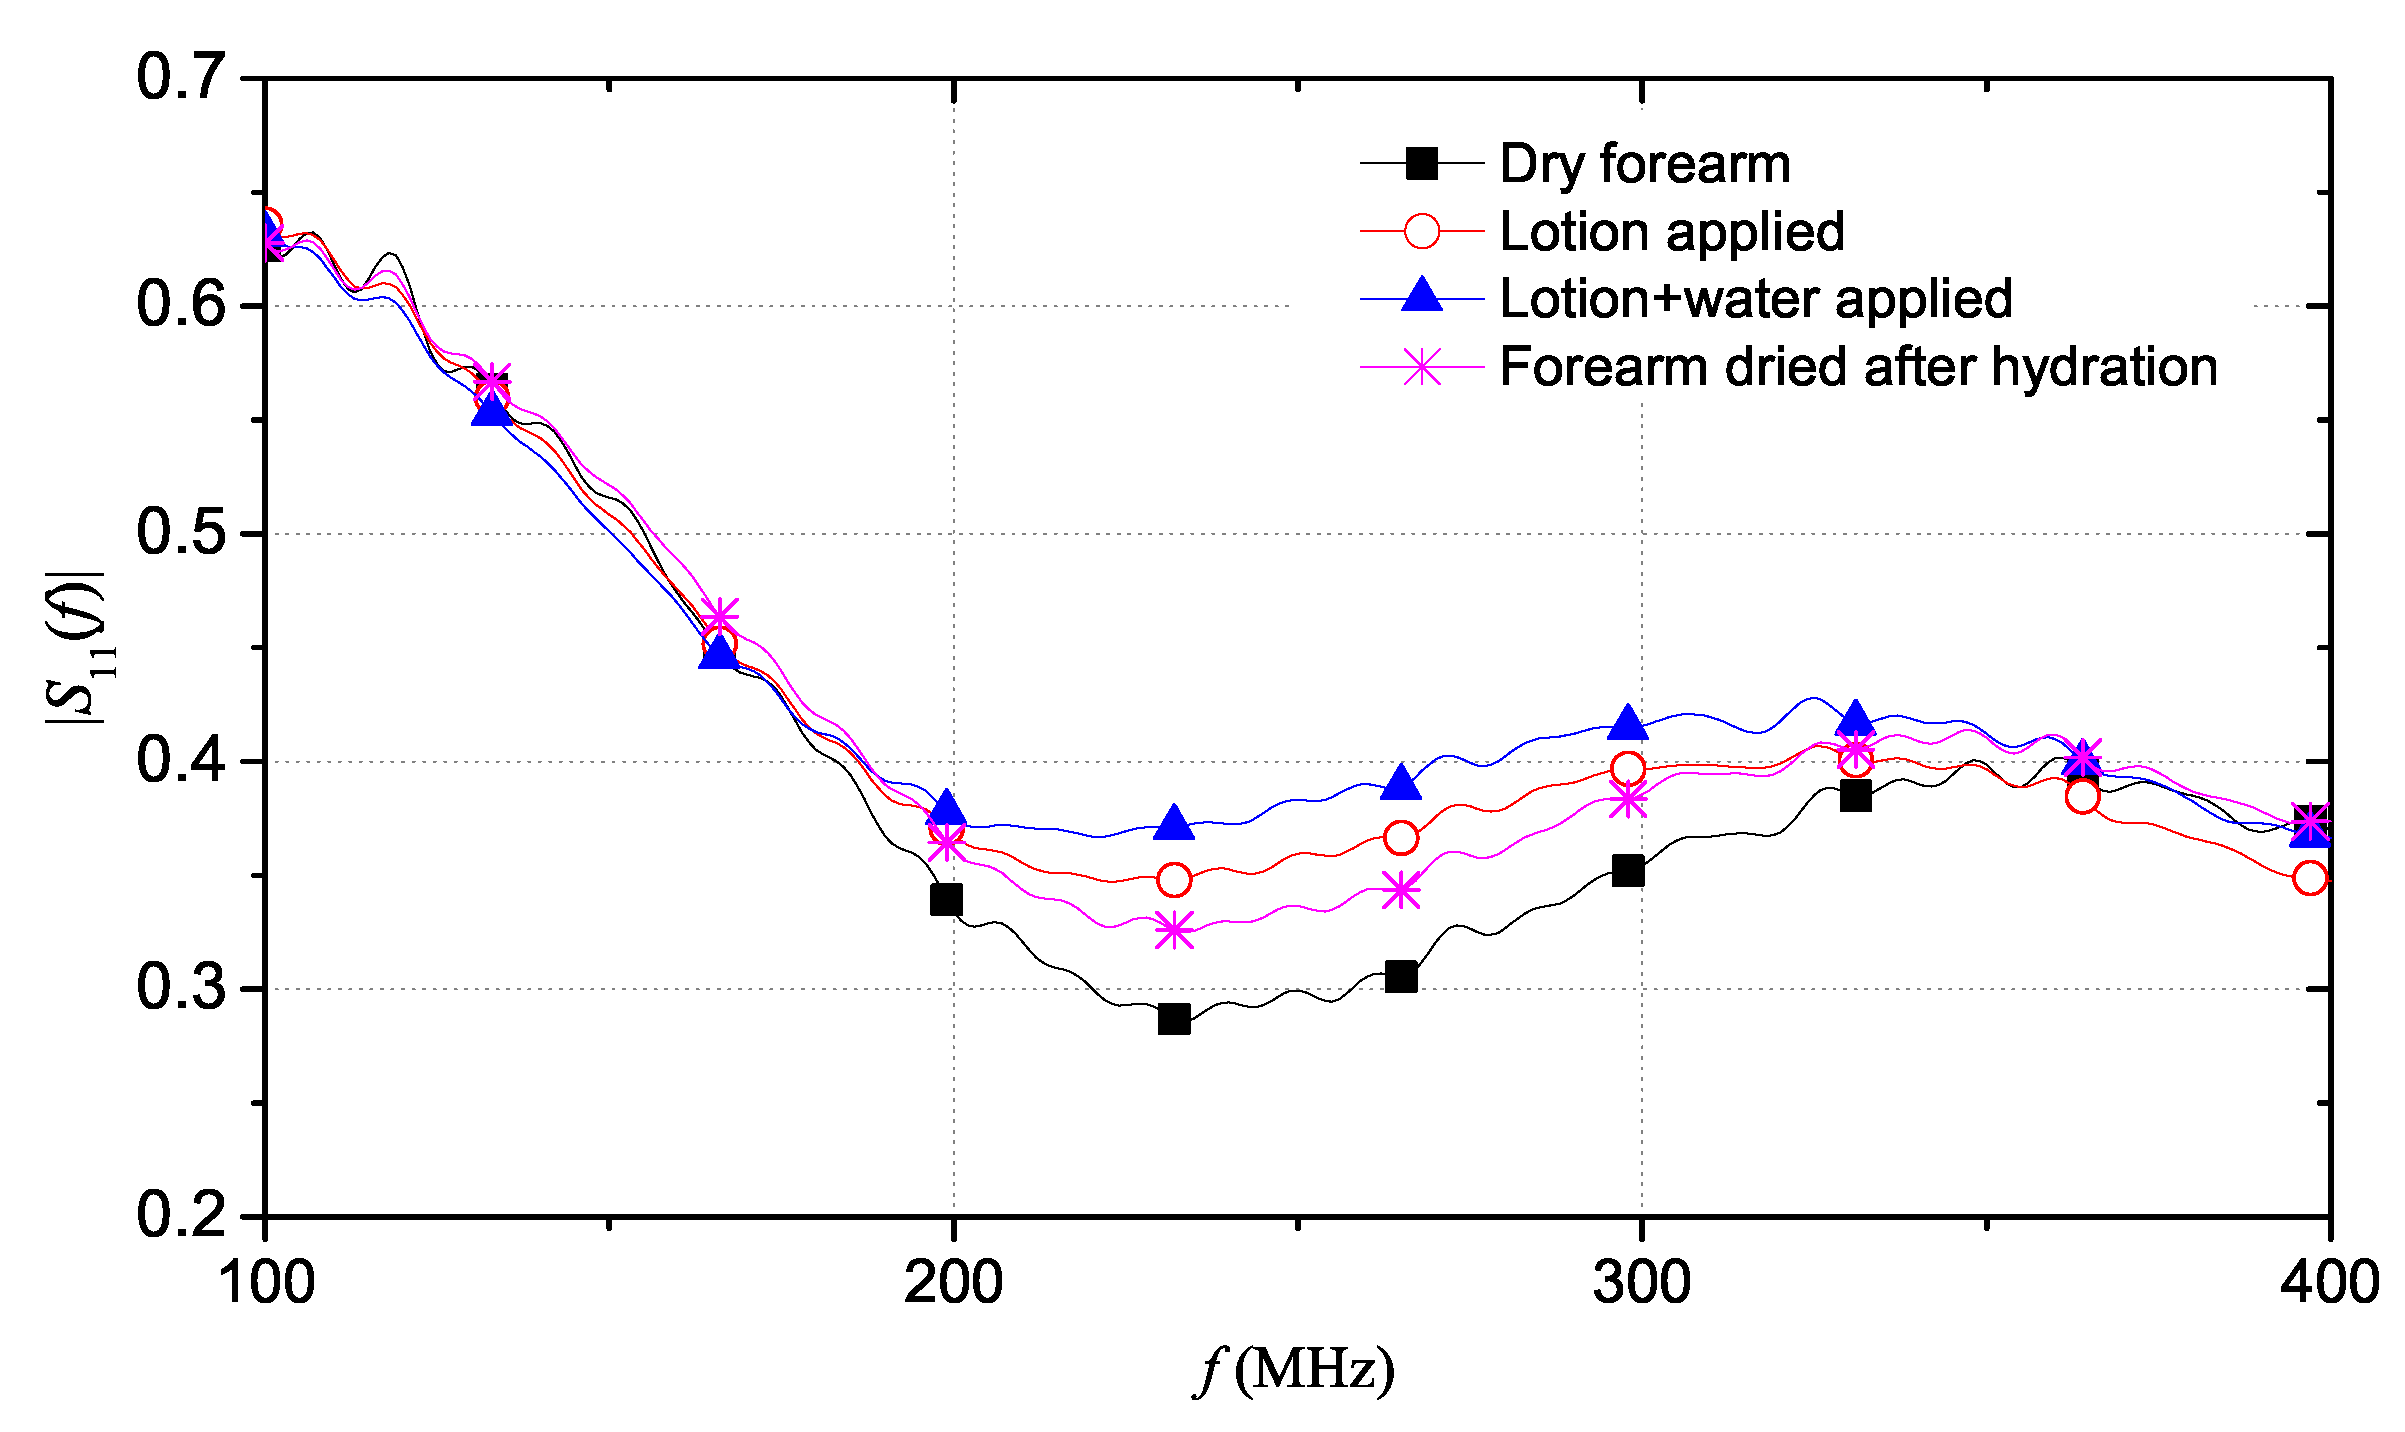
for the four cases, as shown in
Figure 10.
It is interesting to analyze a frequency range of 100–400 MHz. In fact, in this range, it can be seen that exhibits distinct changes that follow a specific trend. Additionally, it can be seen that the value progressively increases when skin hydration increases, due to the increase of the electrical conductivity of the skin when it is progressively hydrated. In addition, as evidenced by previous tests, a decrease in water in the skin, due to a decrease in hydration, involves a shift of minima towards higher frequencies. This phenomenon is due to changes in the dielectric constant of the skin at different hydration states.
Finally, it is worth noting that a single TDR measurement takes approximately a couple of minutes. Therefore, in view of practical monitoring applications, this can be considered as the time resolution that can be achieved between two consecutive TDR measurements on a patient. This should suffice to ensure adequate online monitoring.
5.4. Measurements on Animal Hide
To test the sensitivity of the proposed monitoring system to wider ranges of skin hydration, the final experiment was conducted on a piece of animal hide. This was done in order to emulate human tissue. Moreover, as aforementioned, using a hide sample allowed to bring the sample to known values of hydration and experiment and hydration larger ranges.
In addition, this experiment allowed to assess the relationship between the electrical quantity and hydration, we have carried out measurements on a piece of animal hide brought at known reference values of hydration. As a result, it was possible to retrieve a calibration curve relating to the hydration of the hide. The hide sample (dry weight of 8.4 g), was immersed in water until it reached progressively increasing water content values. The water-saturation condition corresponds to 70% of water in the sample while the other measurements correspond to 64% and 58% of water in the sample, respectively. The moisture content values reached by the hide sample were evaluated through the gravimetric method.
Figure 11 shows that the reflection coefficient
, at long distances, increases with decreasing of water content in the sample and, consequently, with decreasing of static conductivity
. In addition, once piece of hide dries, it gradually loses its water content and, for this reason, the permittivity decreases. This aspect can be seen in the decreasing of apparent length of SE as sample dries.
6. Conclusions
In this study, the feasibility of a TDR-based wearable skin hydration sensing system for real-time, continuous monitoring of skin hydration level was investigated. The feasibility of the proposed system was assessed through experimental tests on reference liquid solutions, directly on human skin and on tanned animal hide. The proposed system guarantees good accuracy, low cost, possibility of remote control and portability that make it particularly attractive for practical medical applications, in particular for sick people or older people with walking difficulties. The proposed hydration monitoring system can represent an important resource to help patients in monitoring their health status. The implementation of such a system is quite promising, as it would allow a substantial improvement of the remote control of diseases.
This system can be further miniaturized and made completely portable, in order to achieve a new wearable skin hydration monitoring system based on TDR technique. To ensure wearability of the system, the authors are working on a miniaturized version of a TDR measuring instrument that could be attached directly to the armband. The miniaturized TDR instrument will be based on FPGA technology, similarly to the one proposed in [
43]. In turn, the TDR measuring instrument will transmit data wirelessly, for example, to a remote monitoring station. The goal is to guarantee complete freedom of movement to the user.
The upcoming work will regard the identification of the relationship between physiological parameters and the TDR-measured quantities (for example, the frequency value of the peak of the ; the value of at 0 Hz; or the electrical conductivity calculated from the long-distance value of in the reflectogram). To this purpose, the next step will require to verify the proposed system on a number of voluntary subjects whose physiological parameters will be determined also through comparative, reference measurement system. This will allow to validate the proposed system also from a metrological point of view.

 ,
, 


