Simulating and Testing Microvibrations on an Optical Satellite Using Acceleration Sensor-Based Jitter Measurements

Abstract
1. Introduction
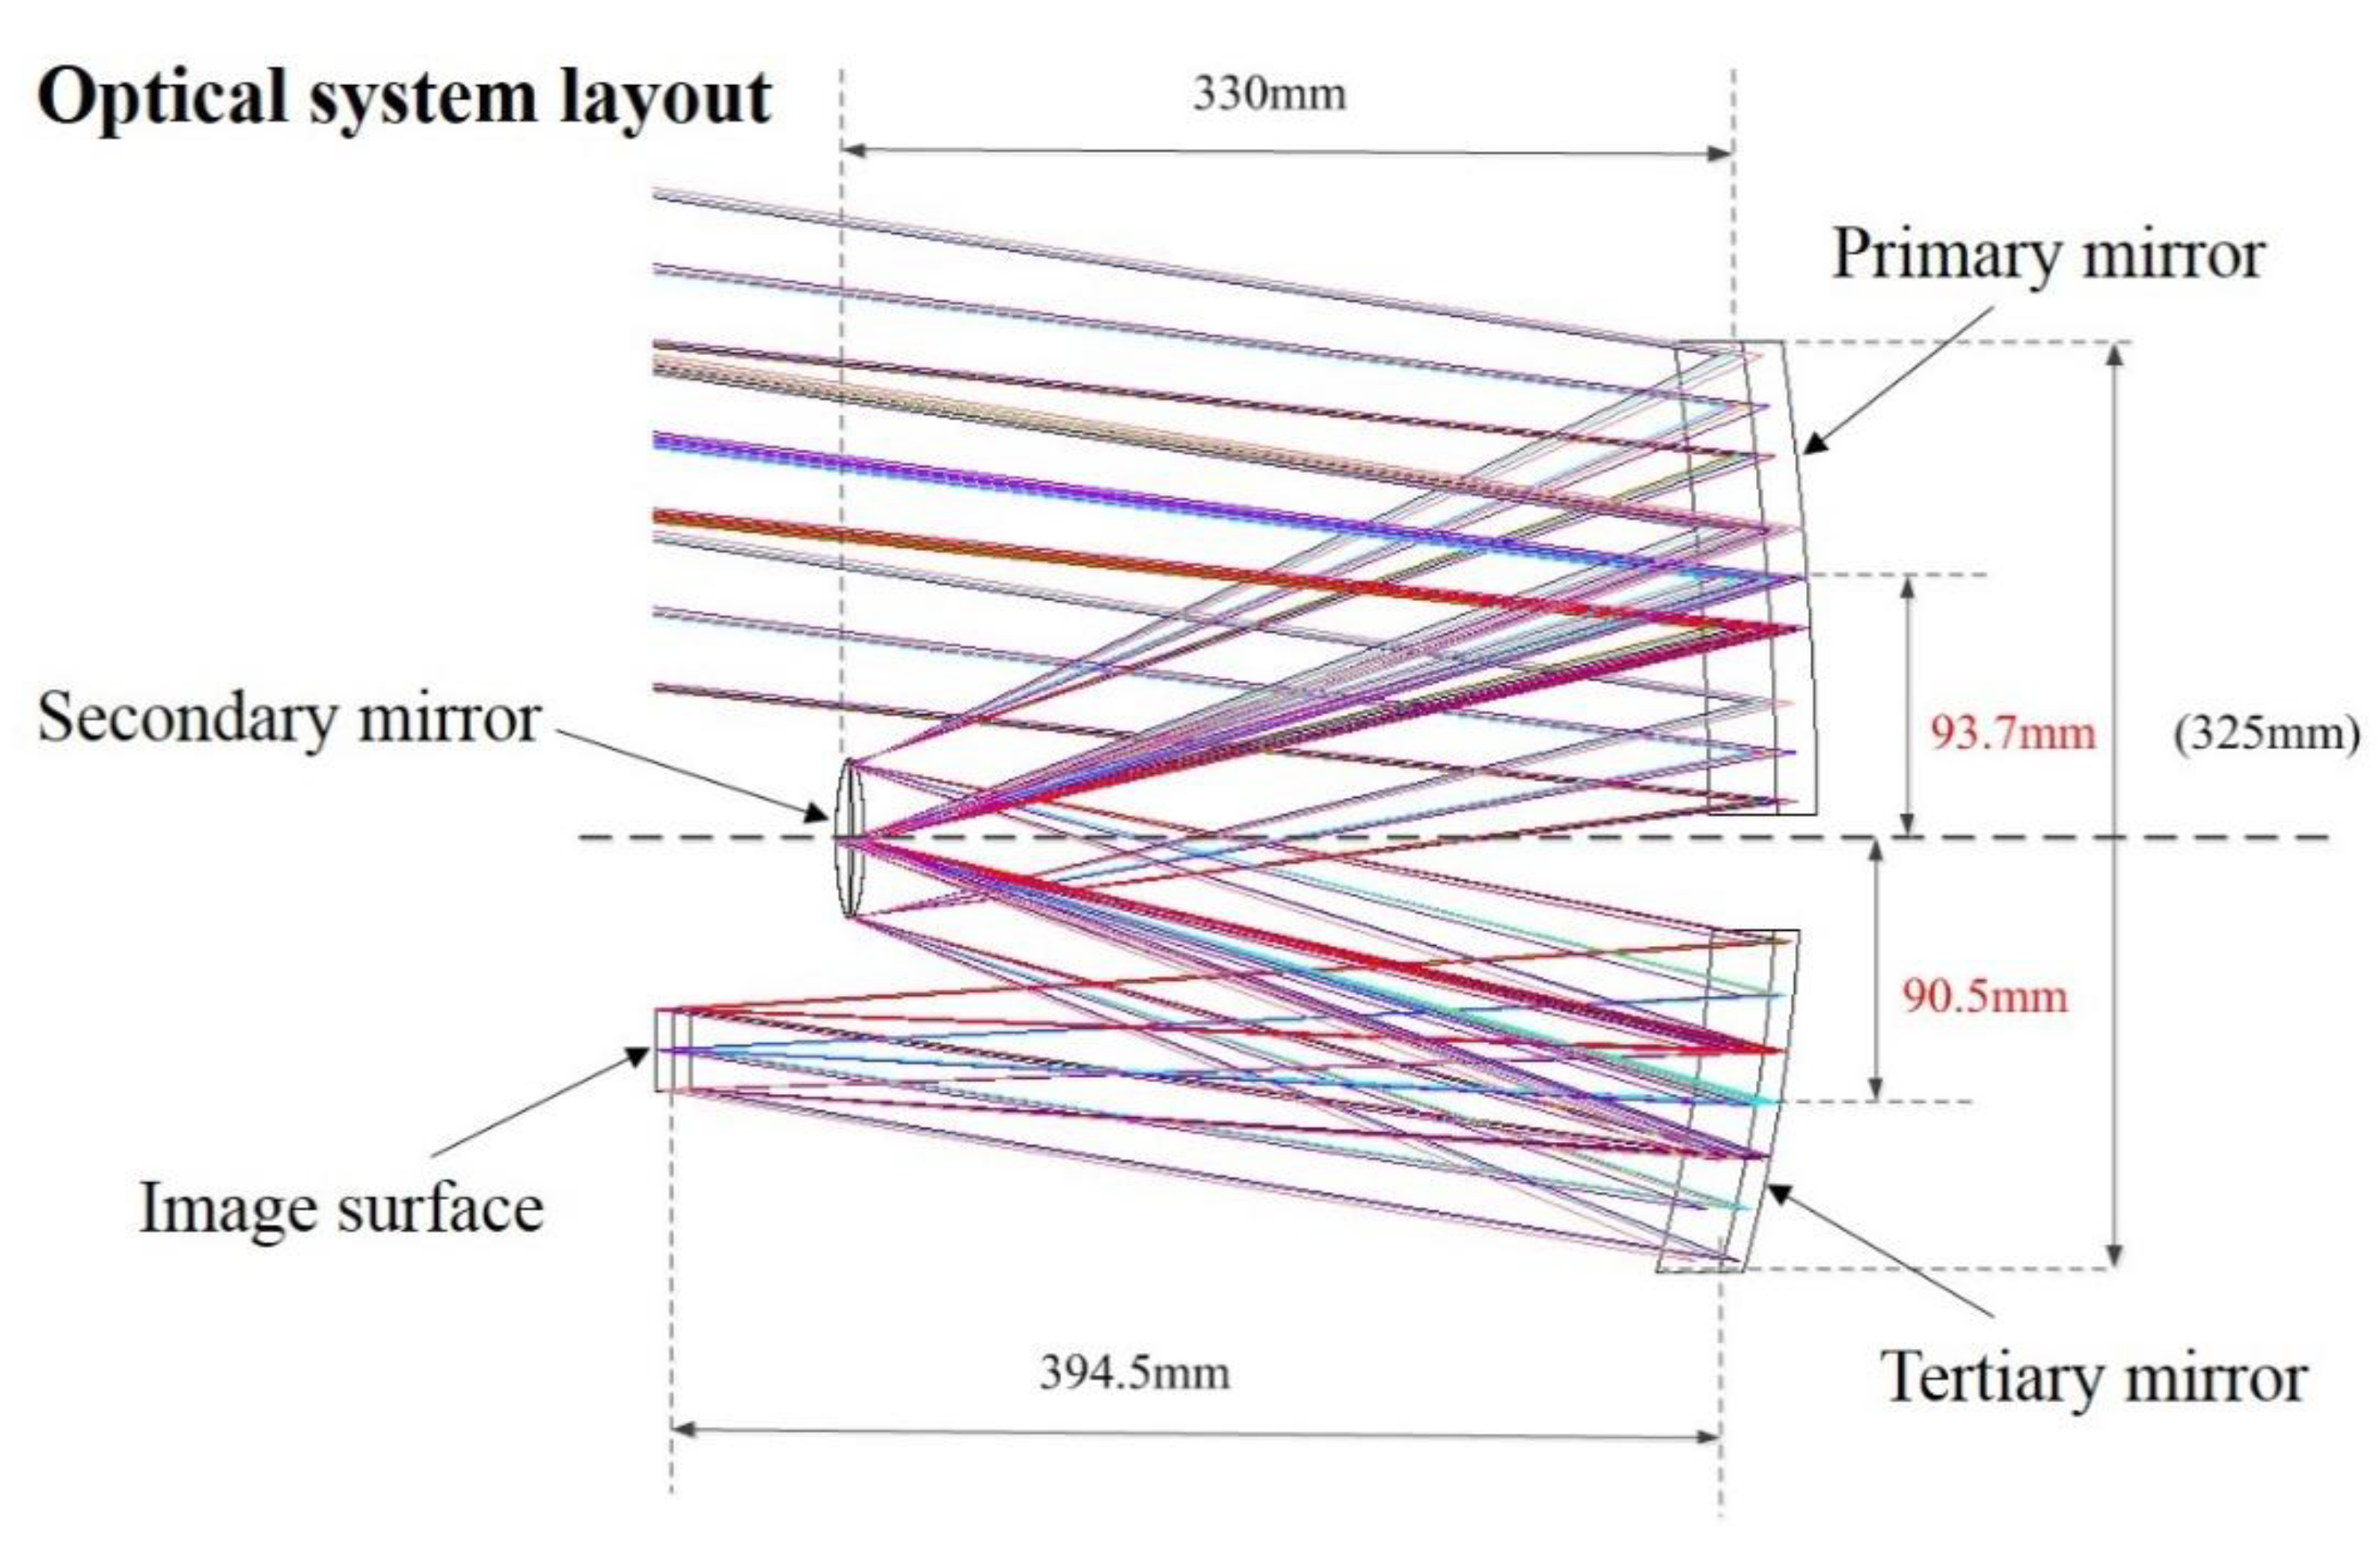
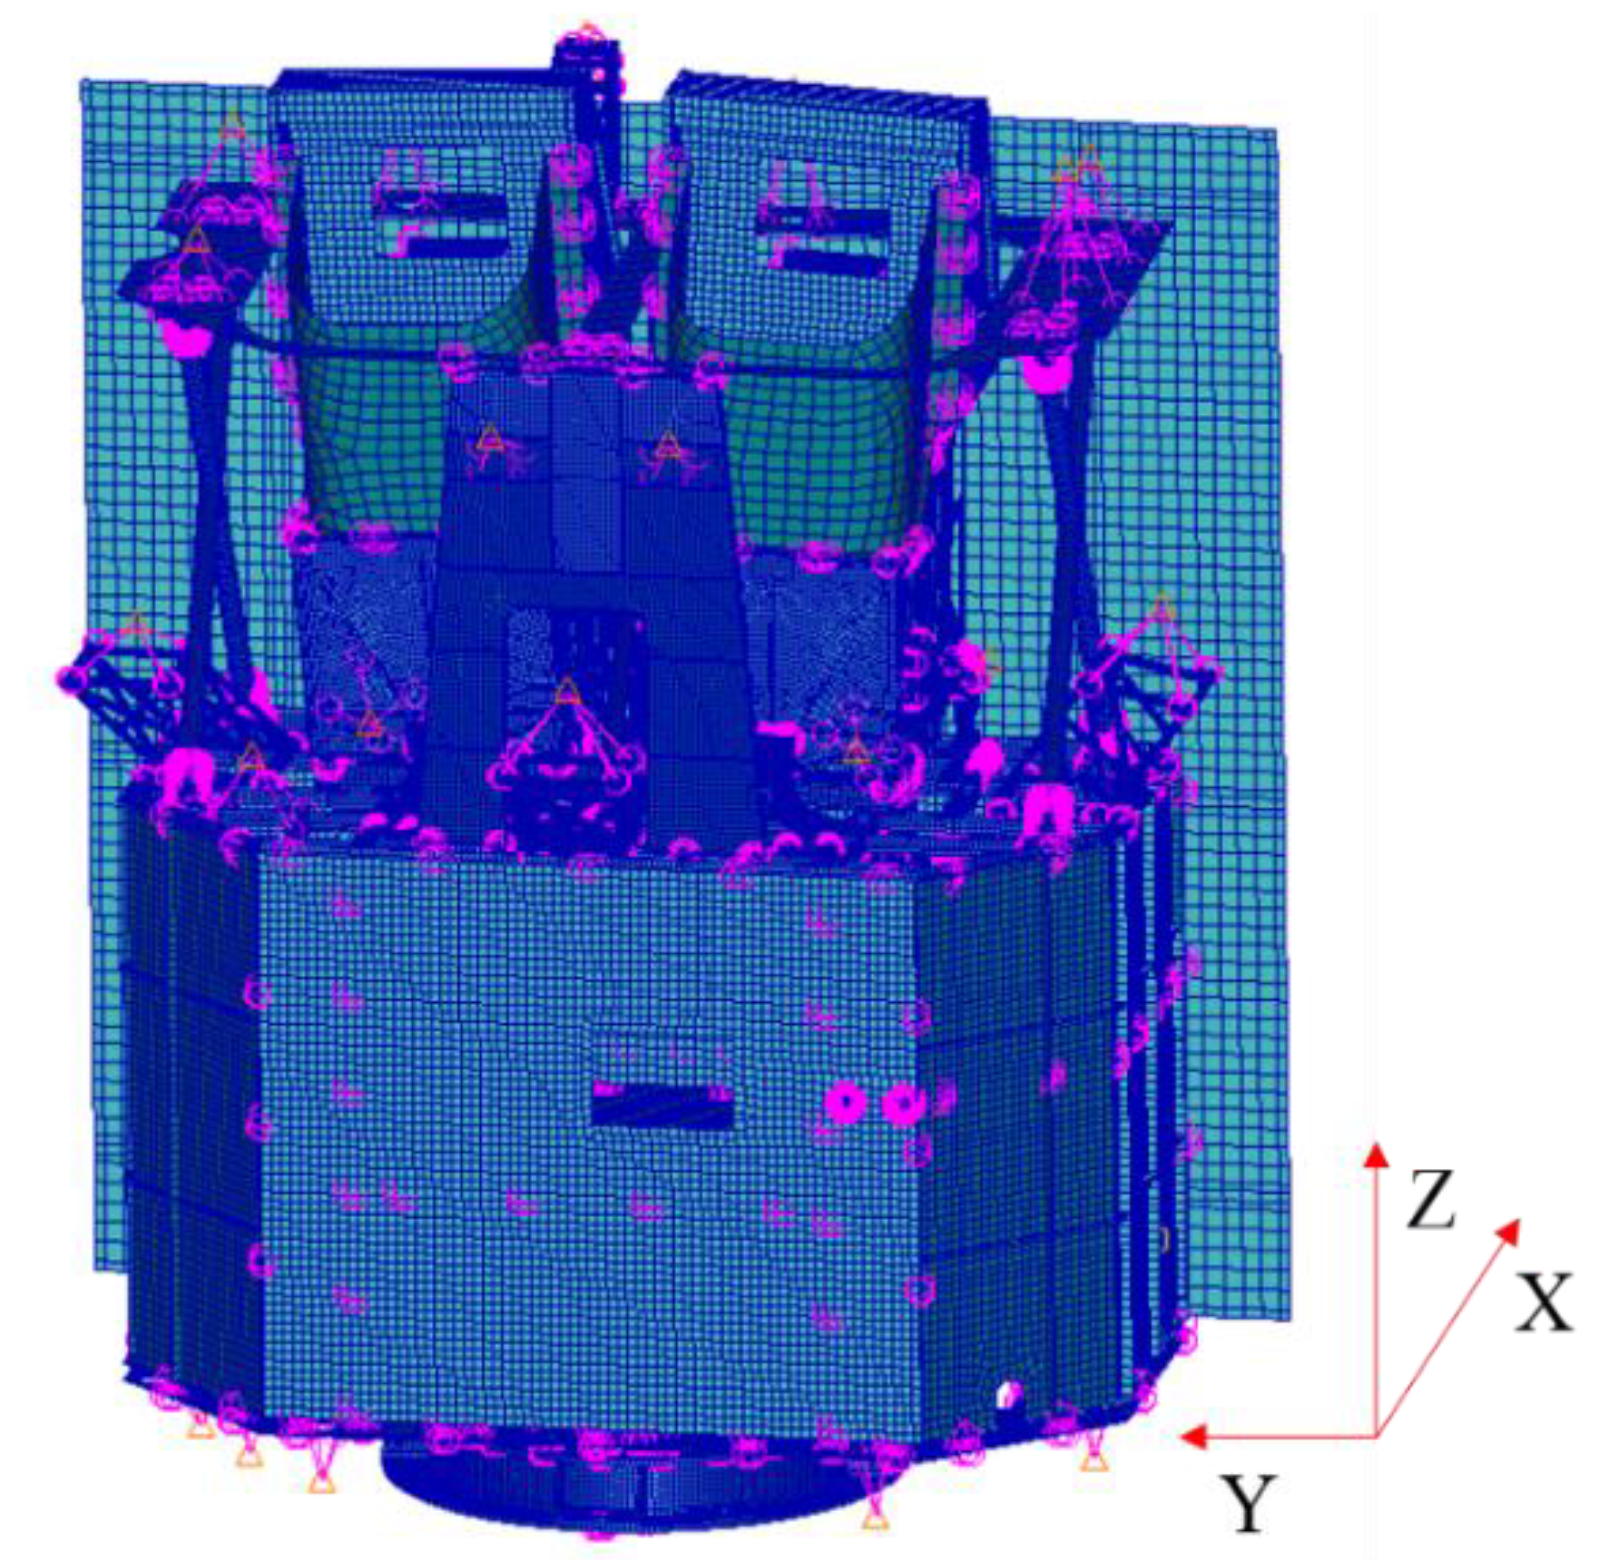
2. Optical Model
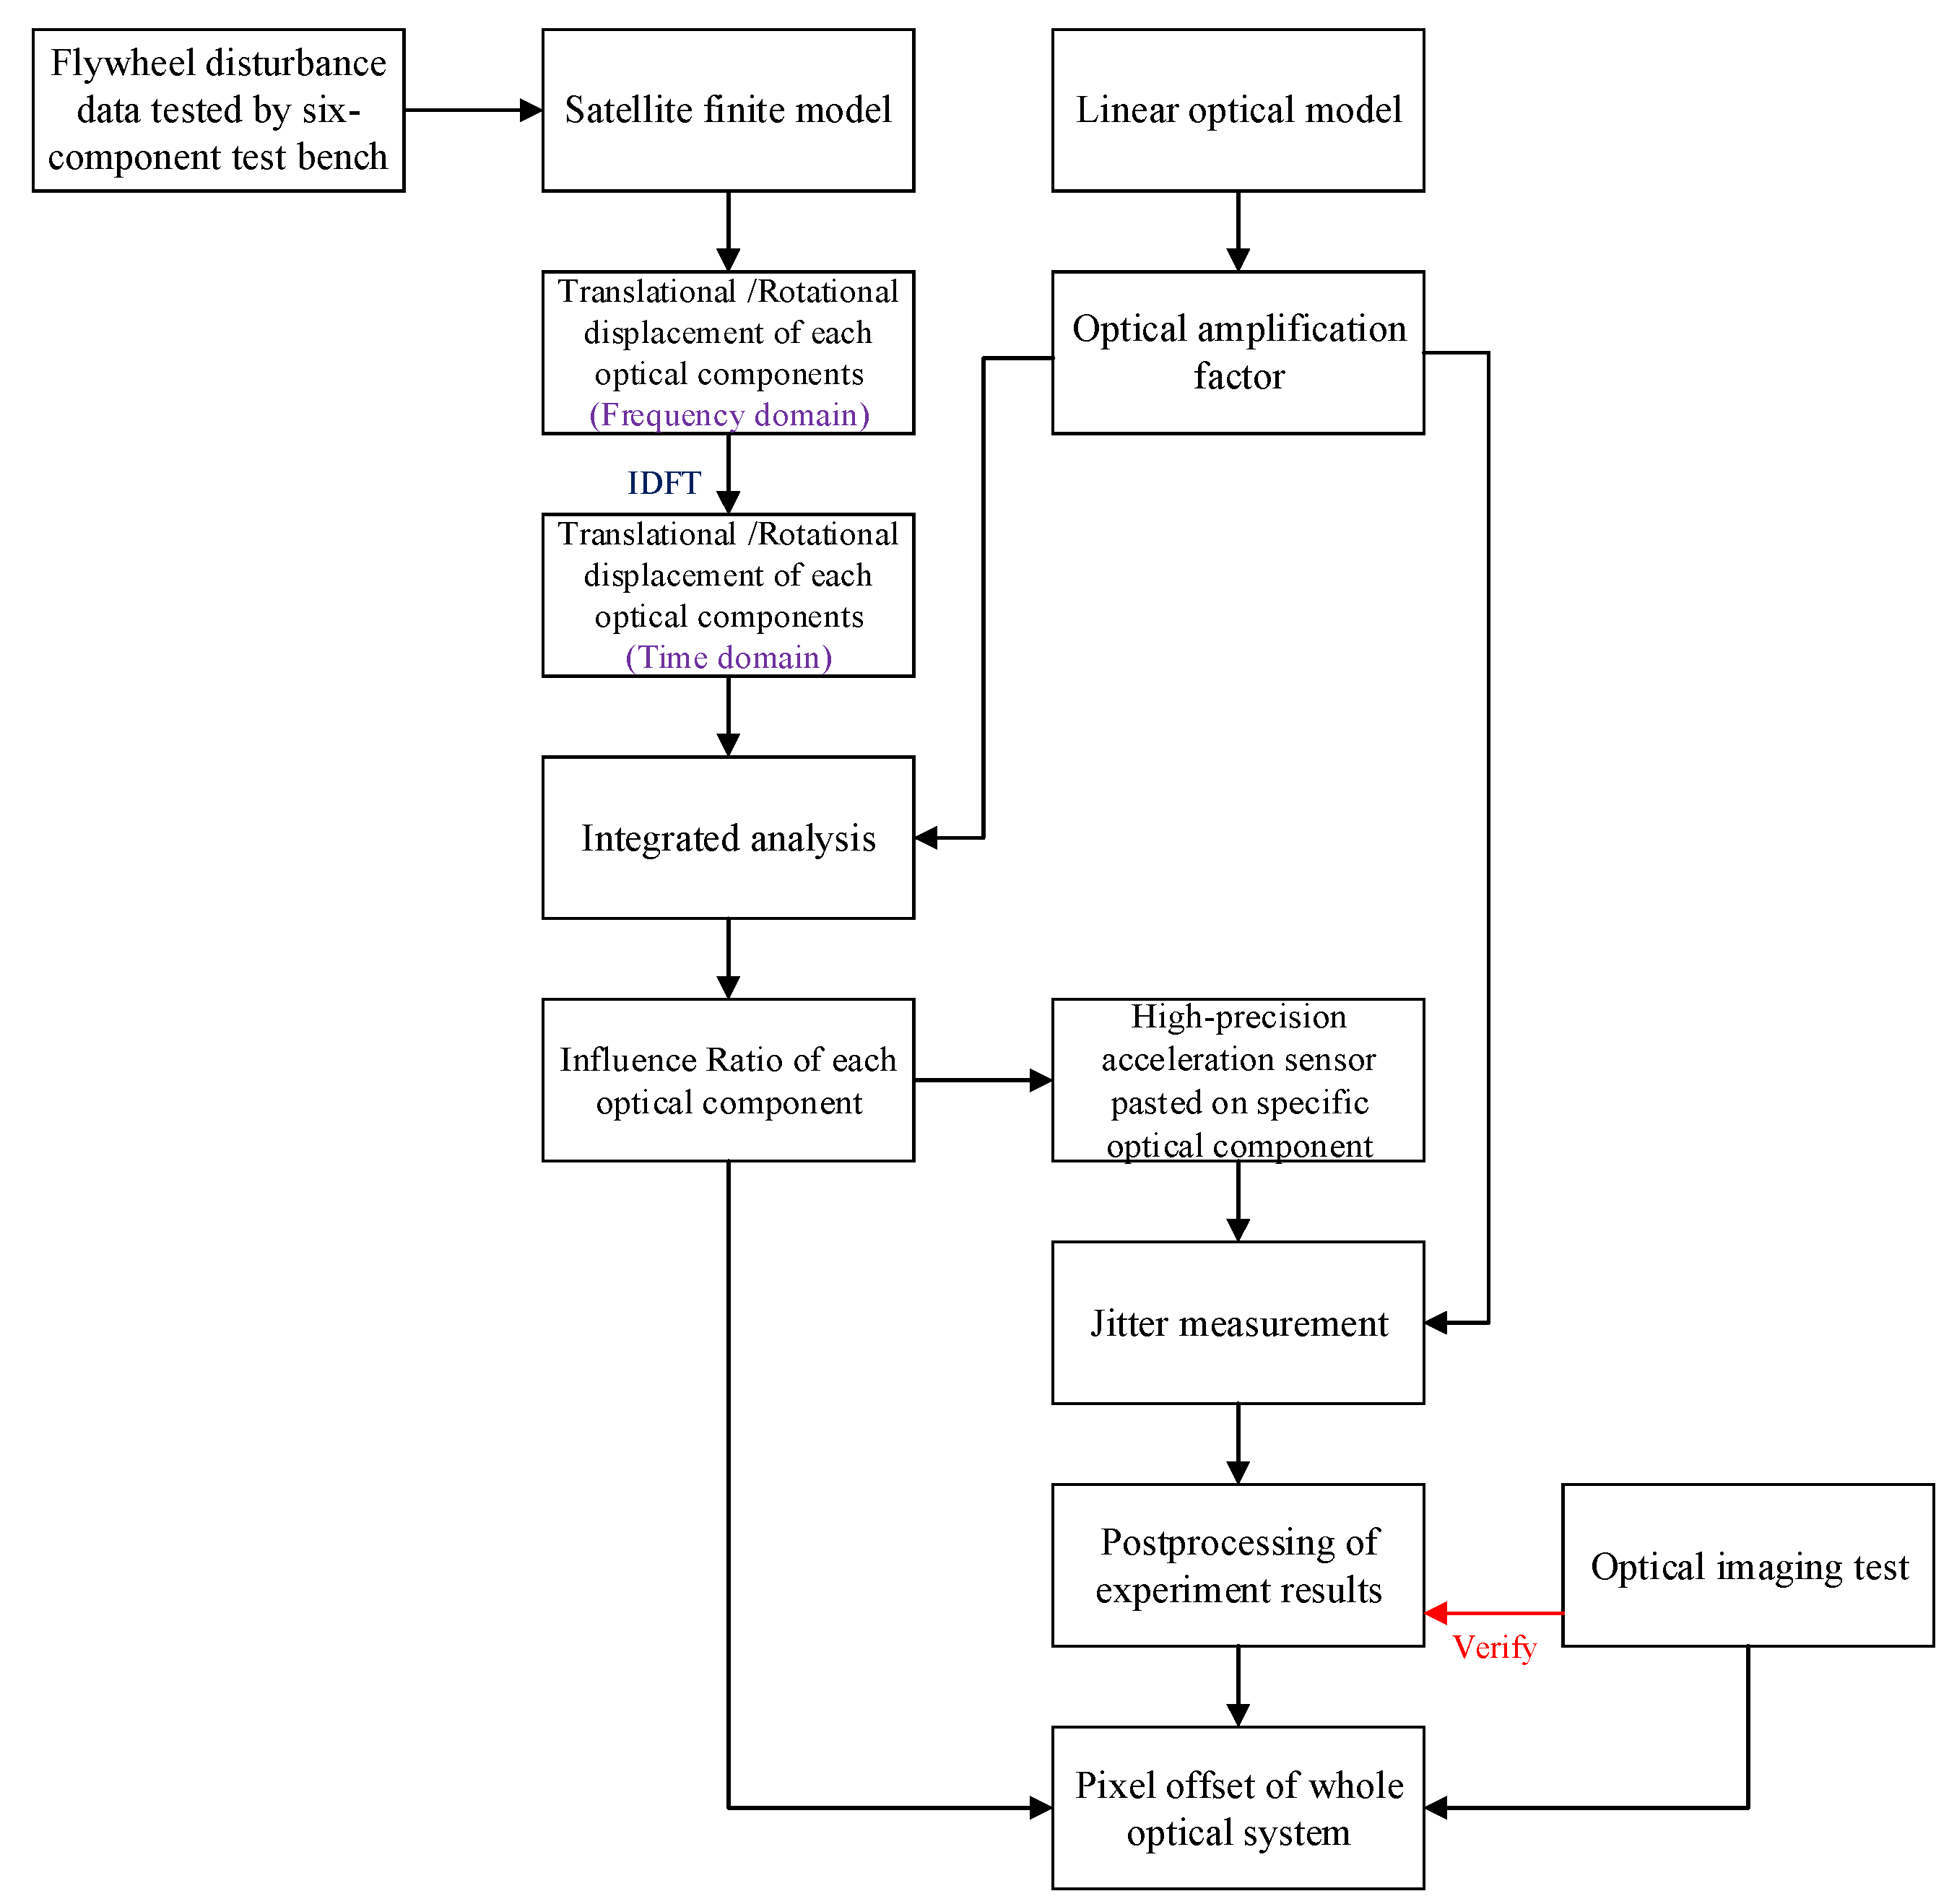
3. Simulation
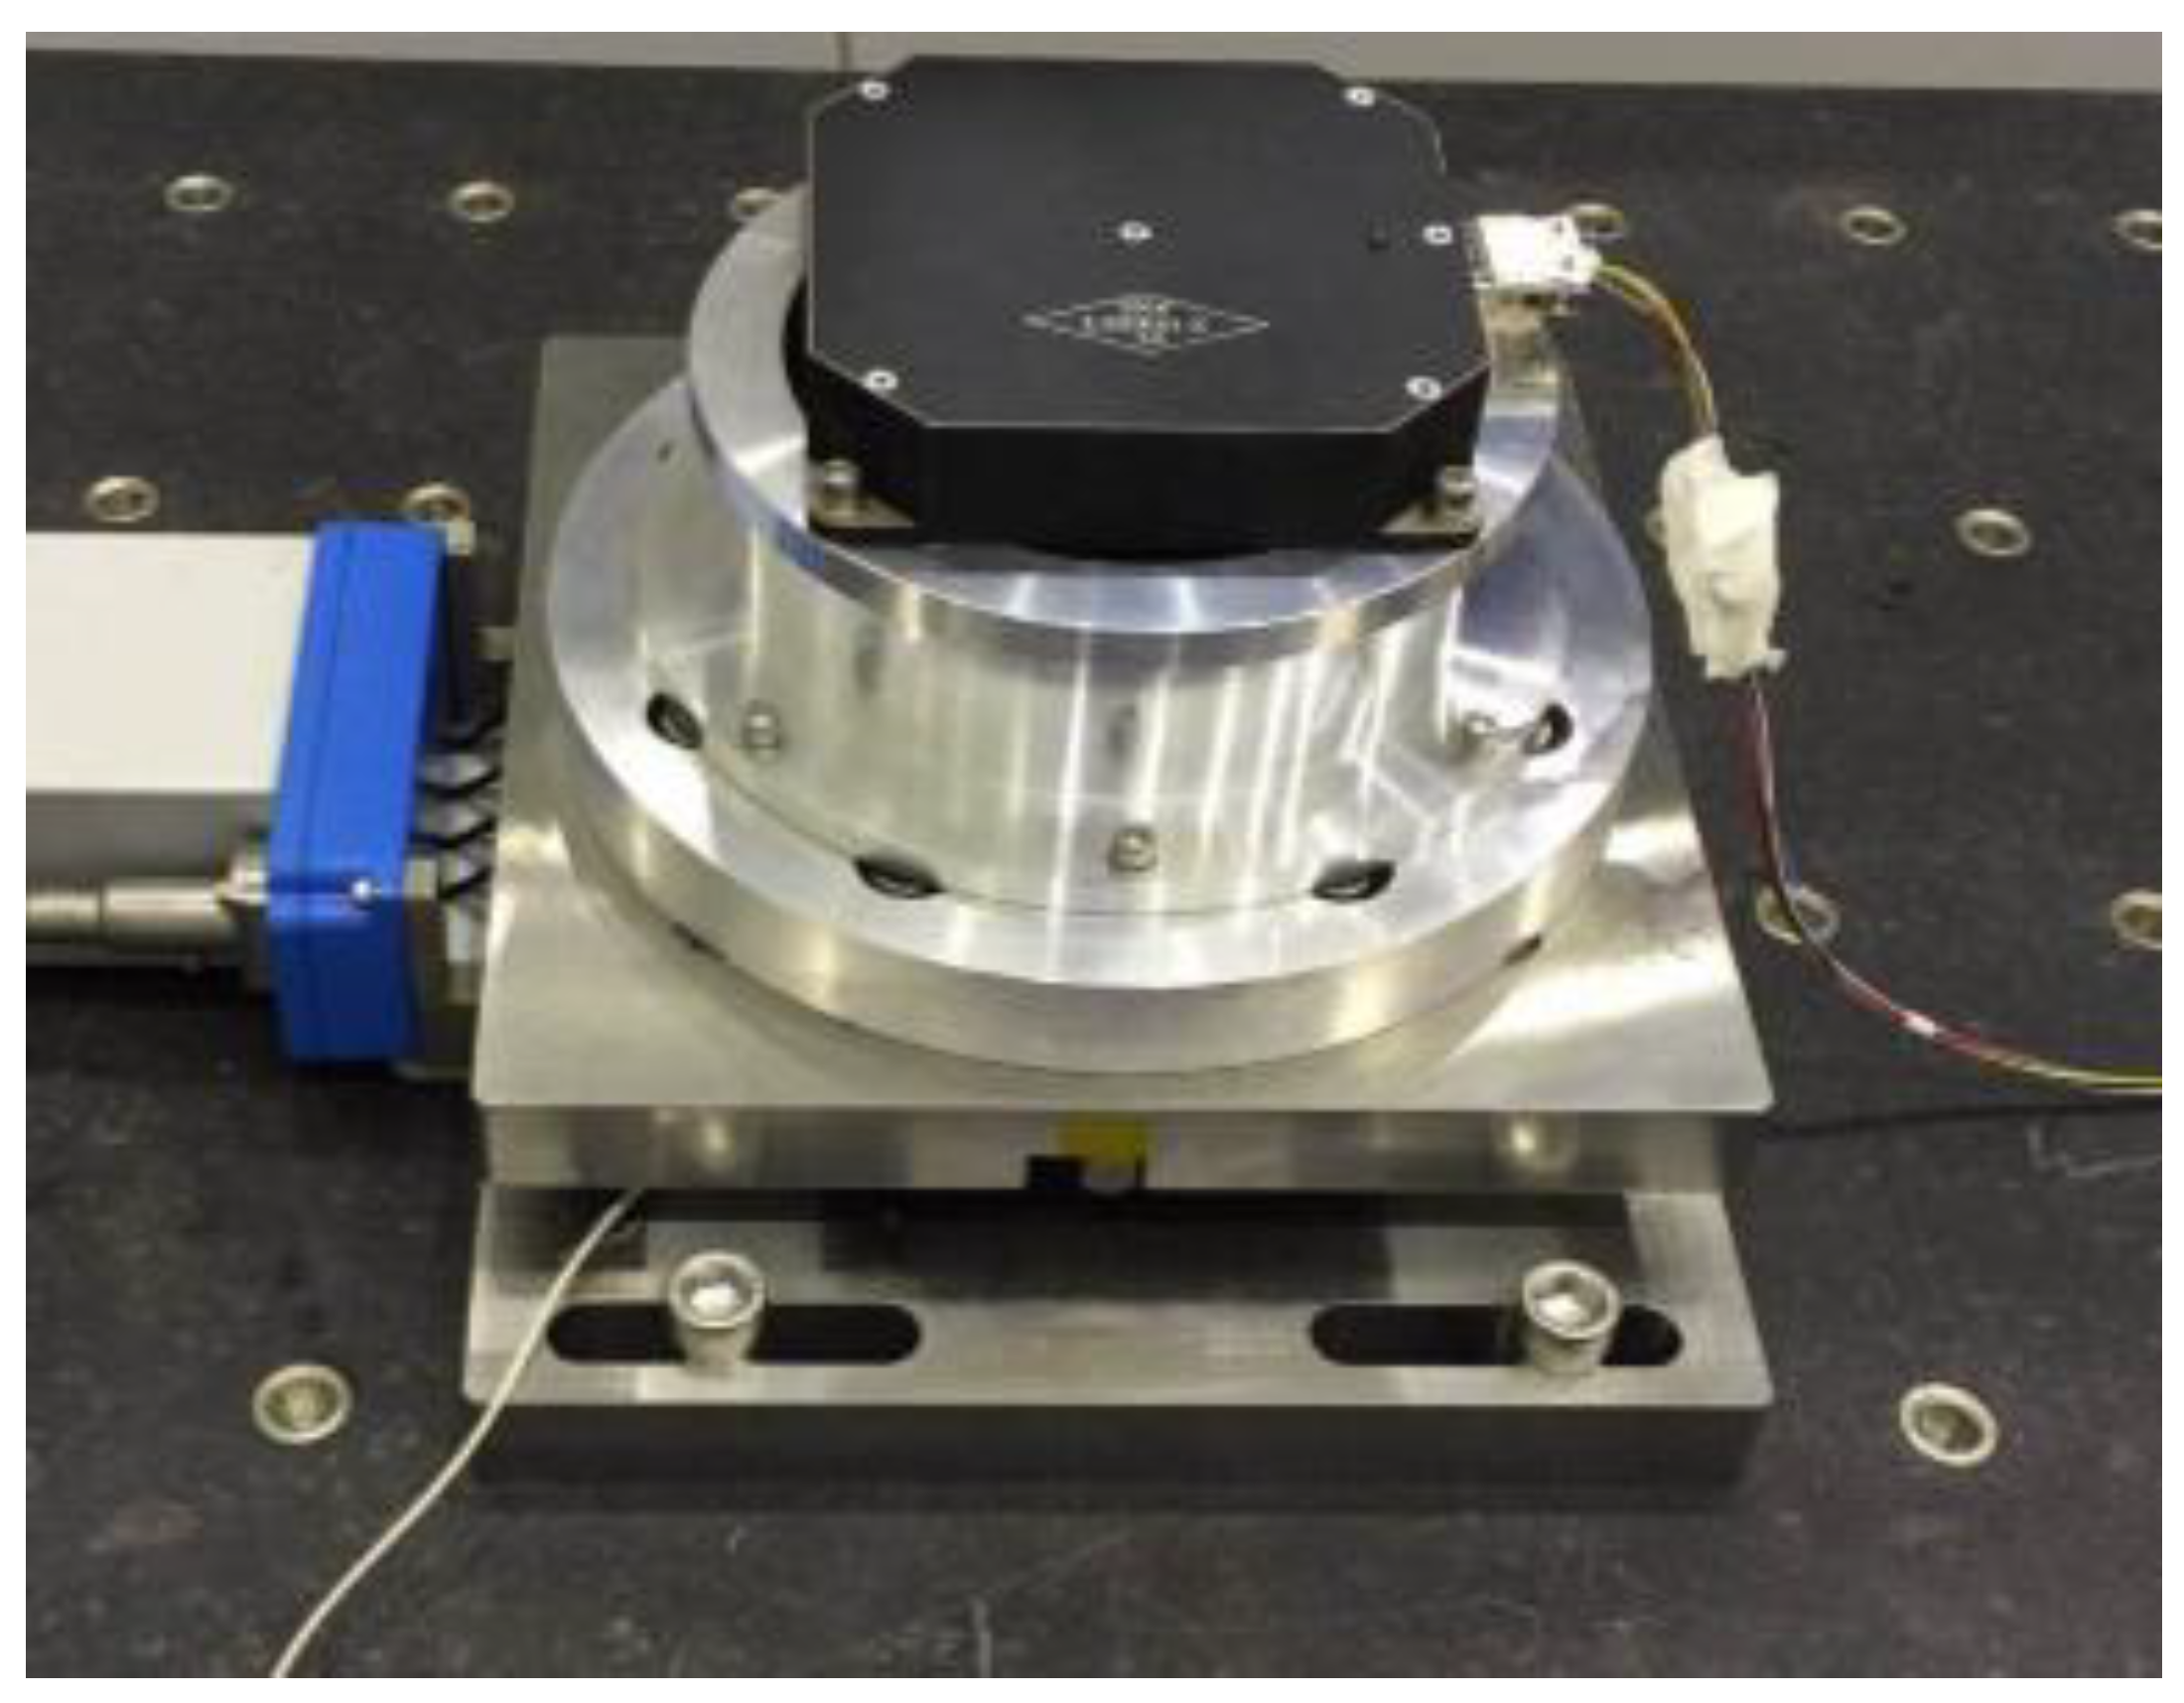
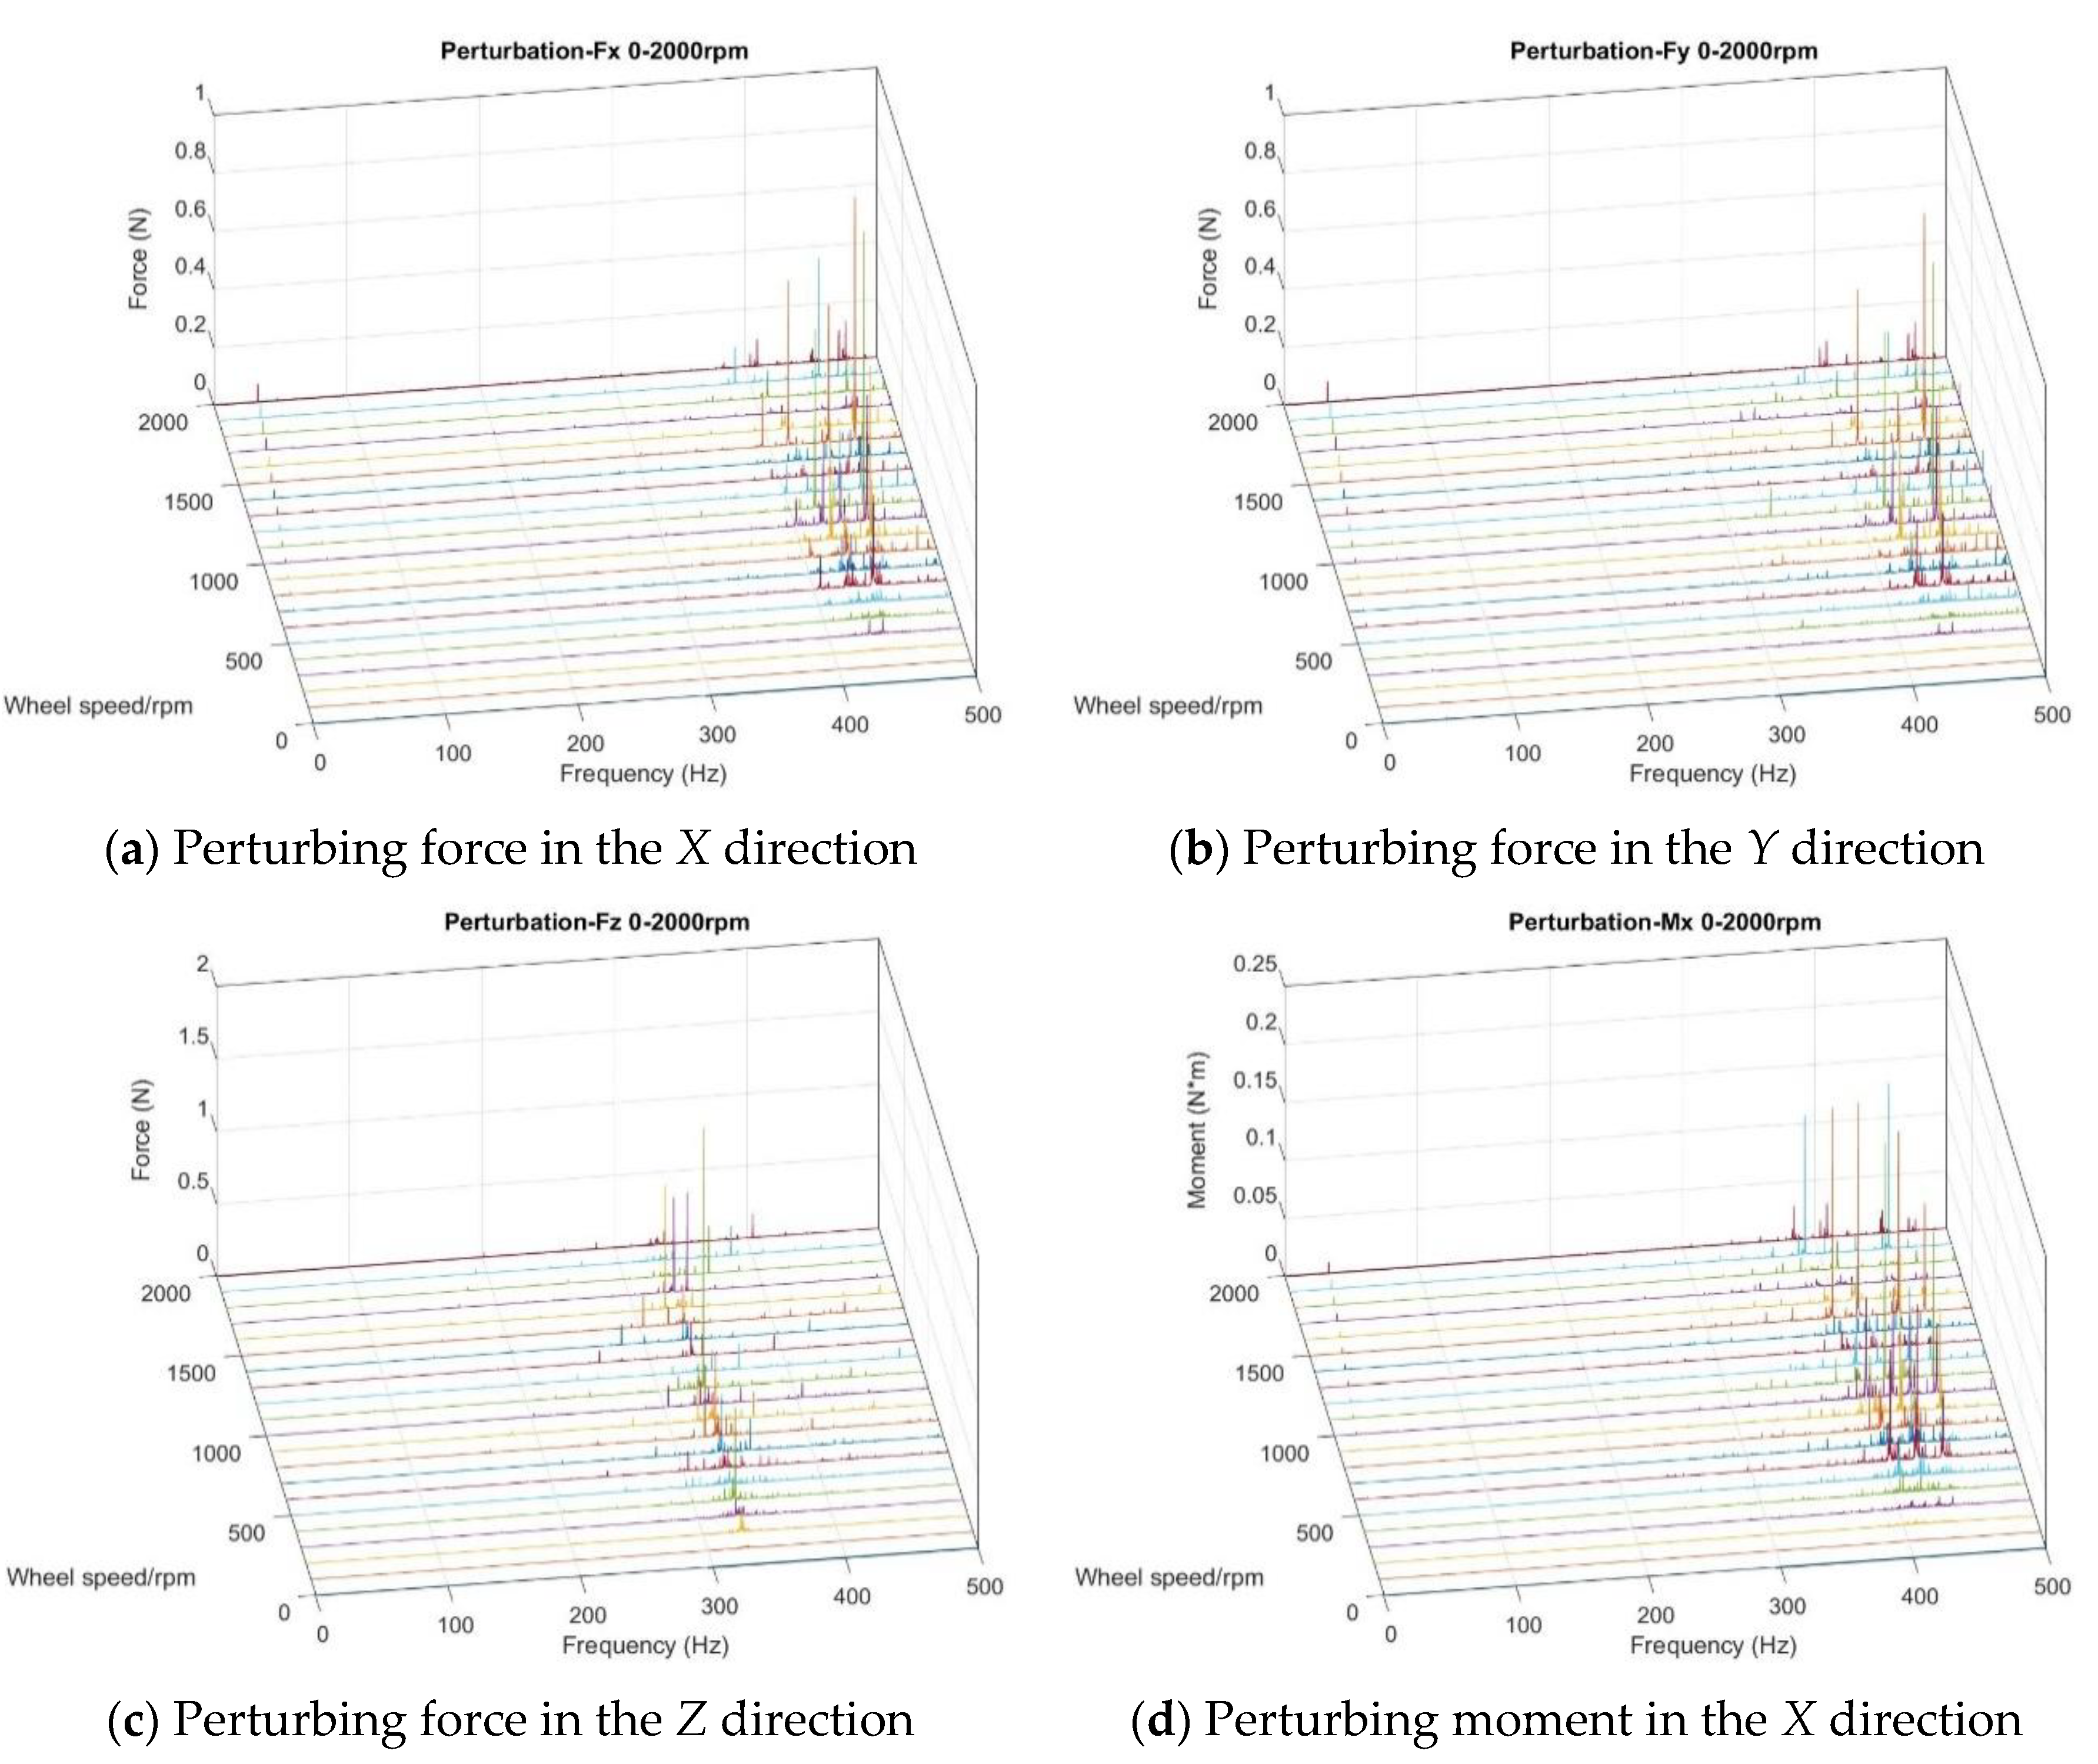
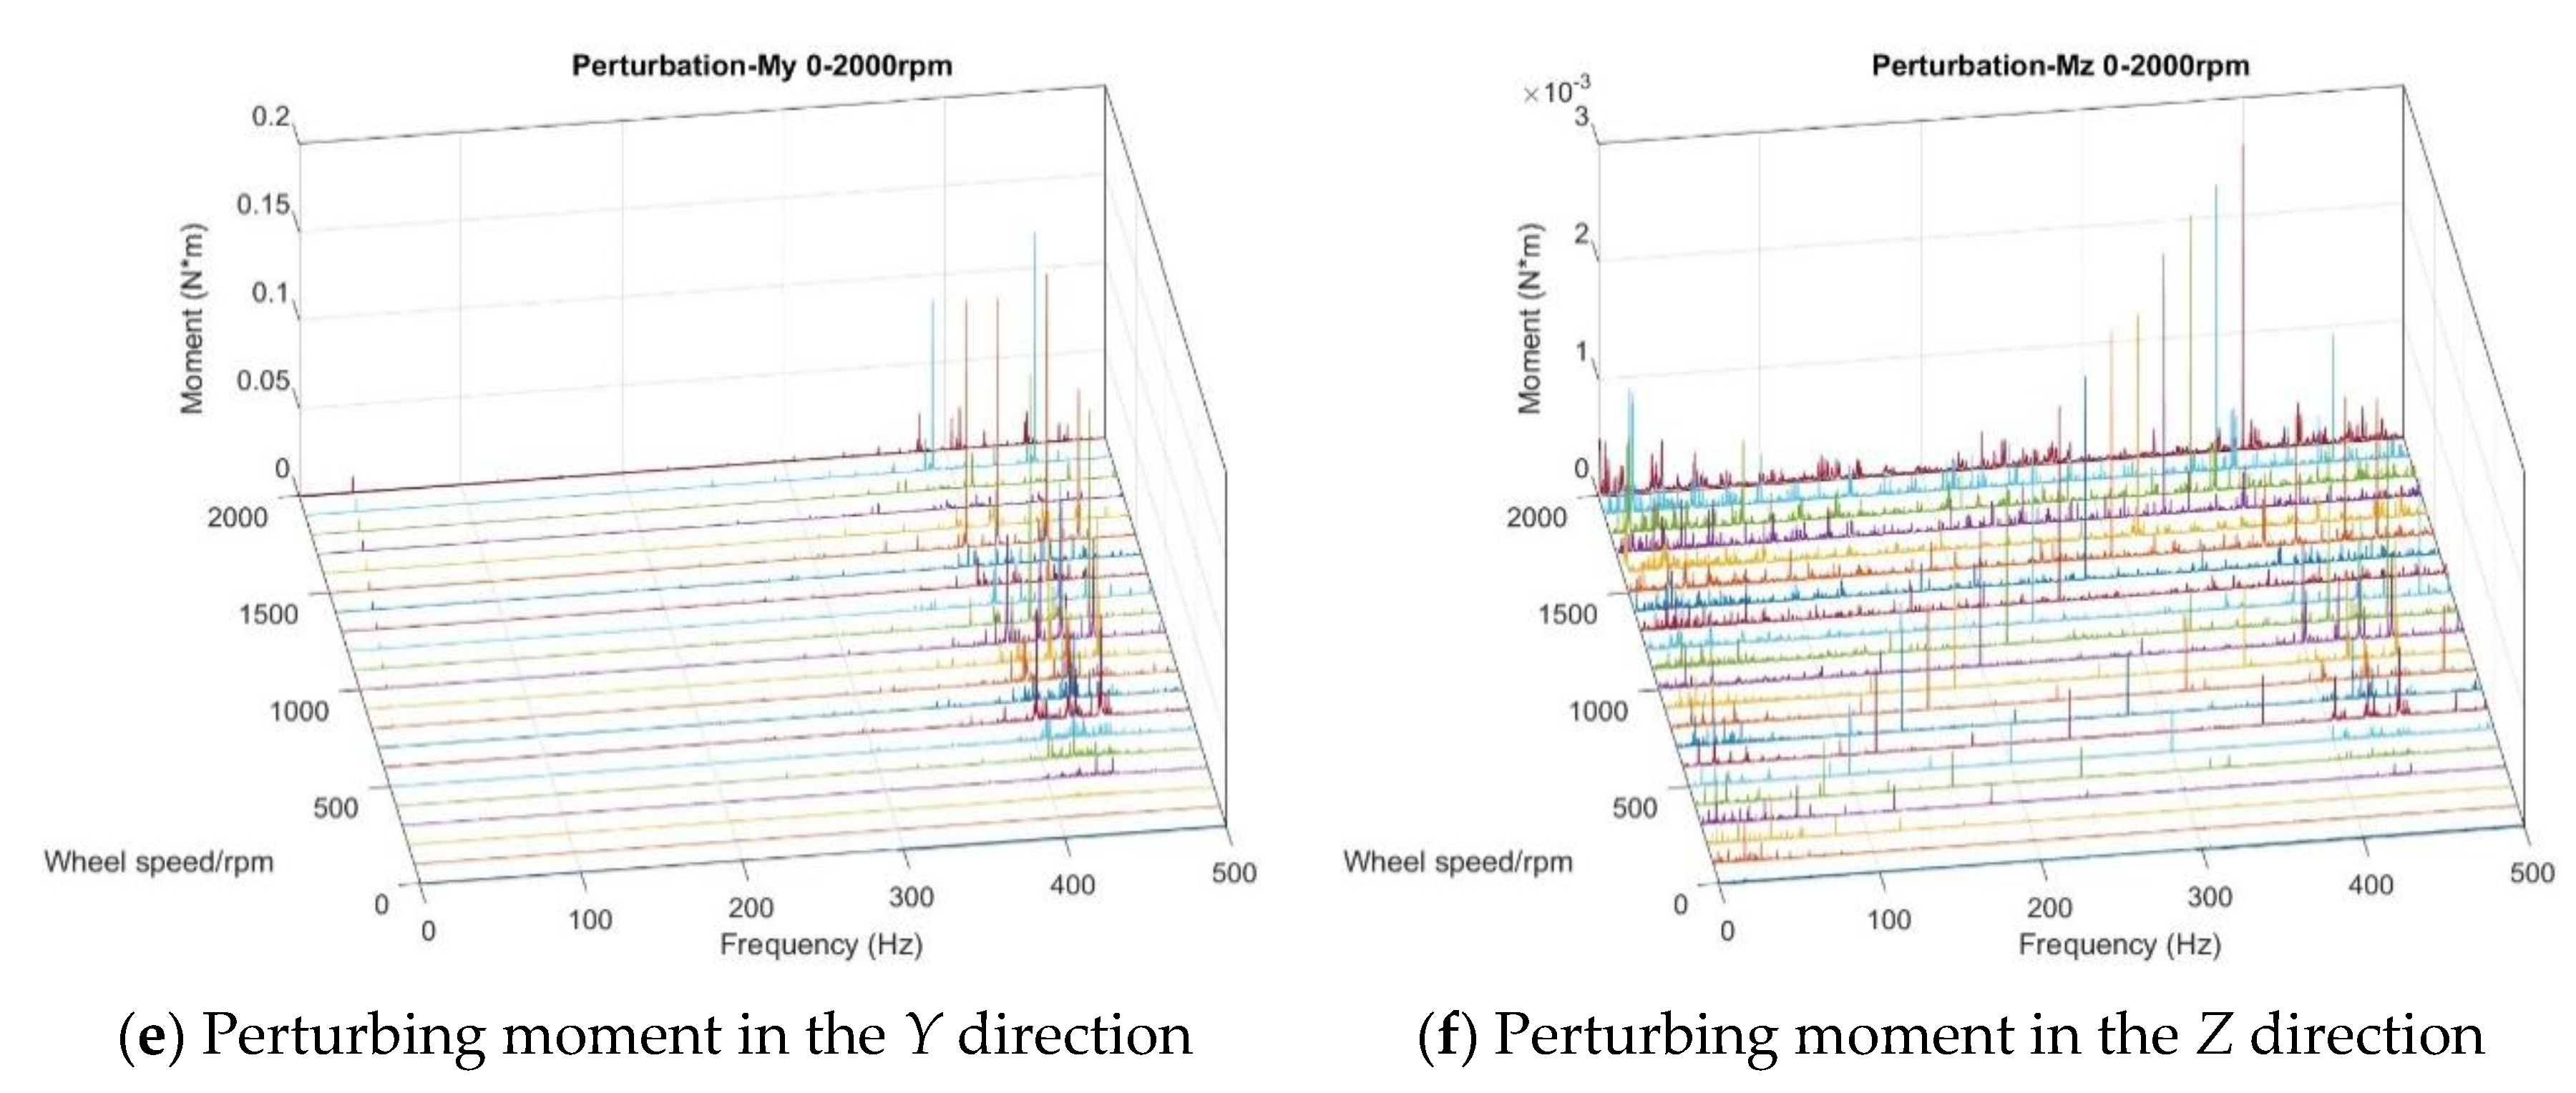
3.1. Testing Flywheel Perturbation
3.2. Integrated Analysis
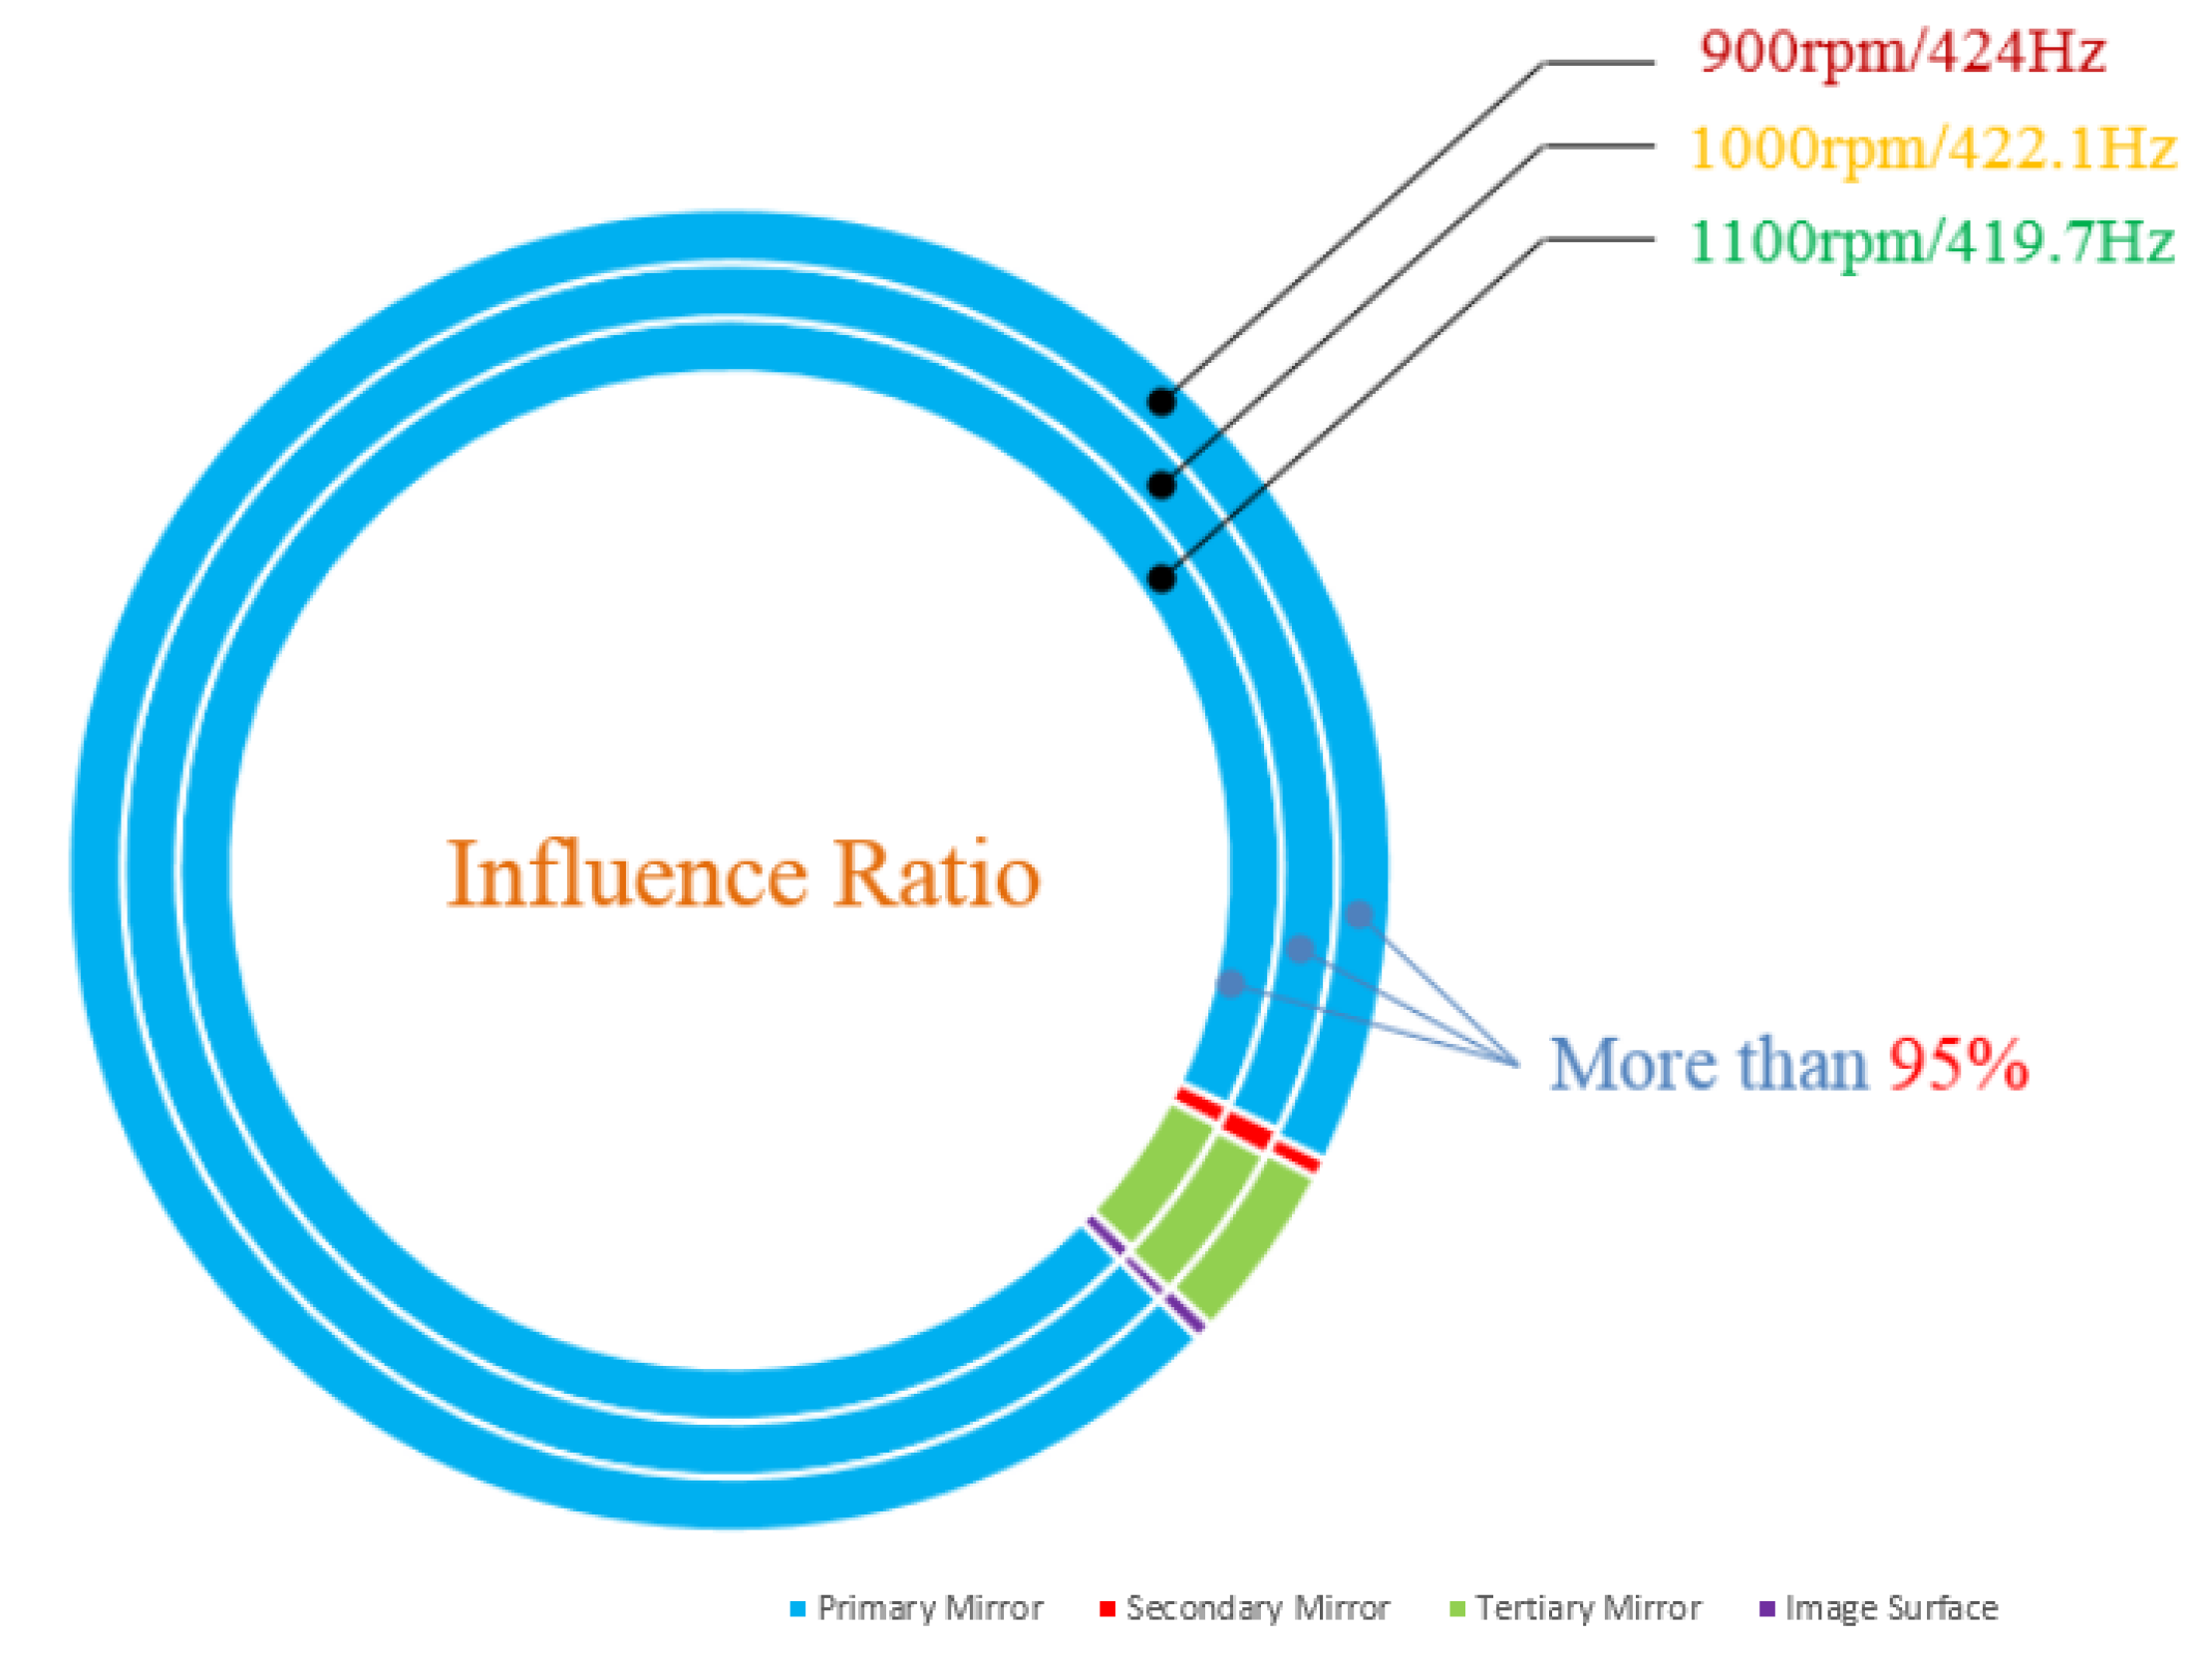
3.3. Influence Ratio of Each Optical Component
4. Experiment
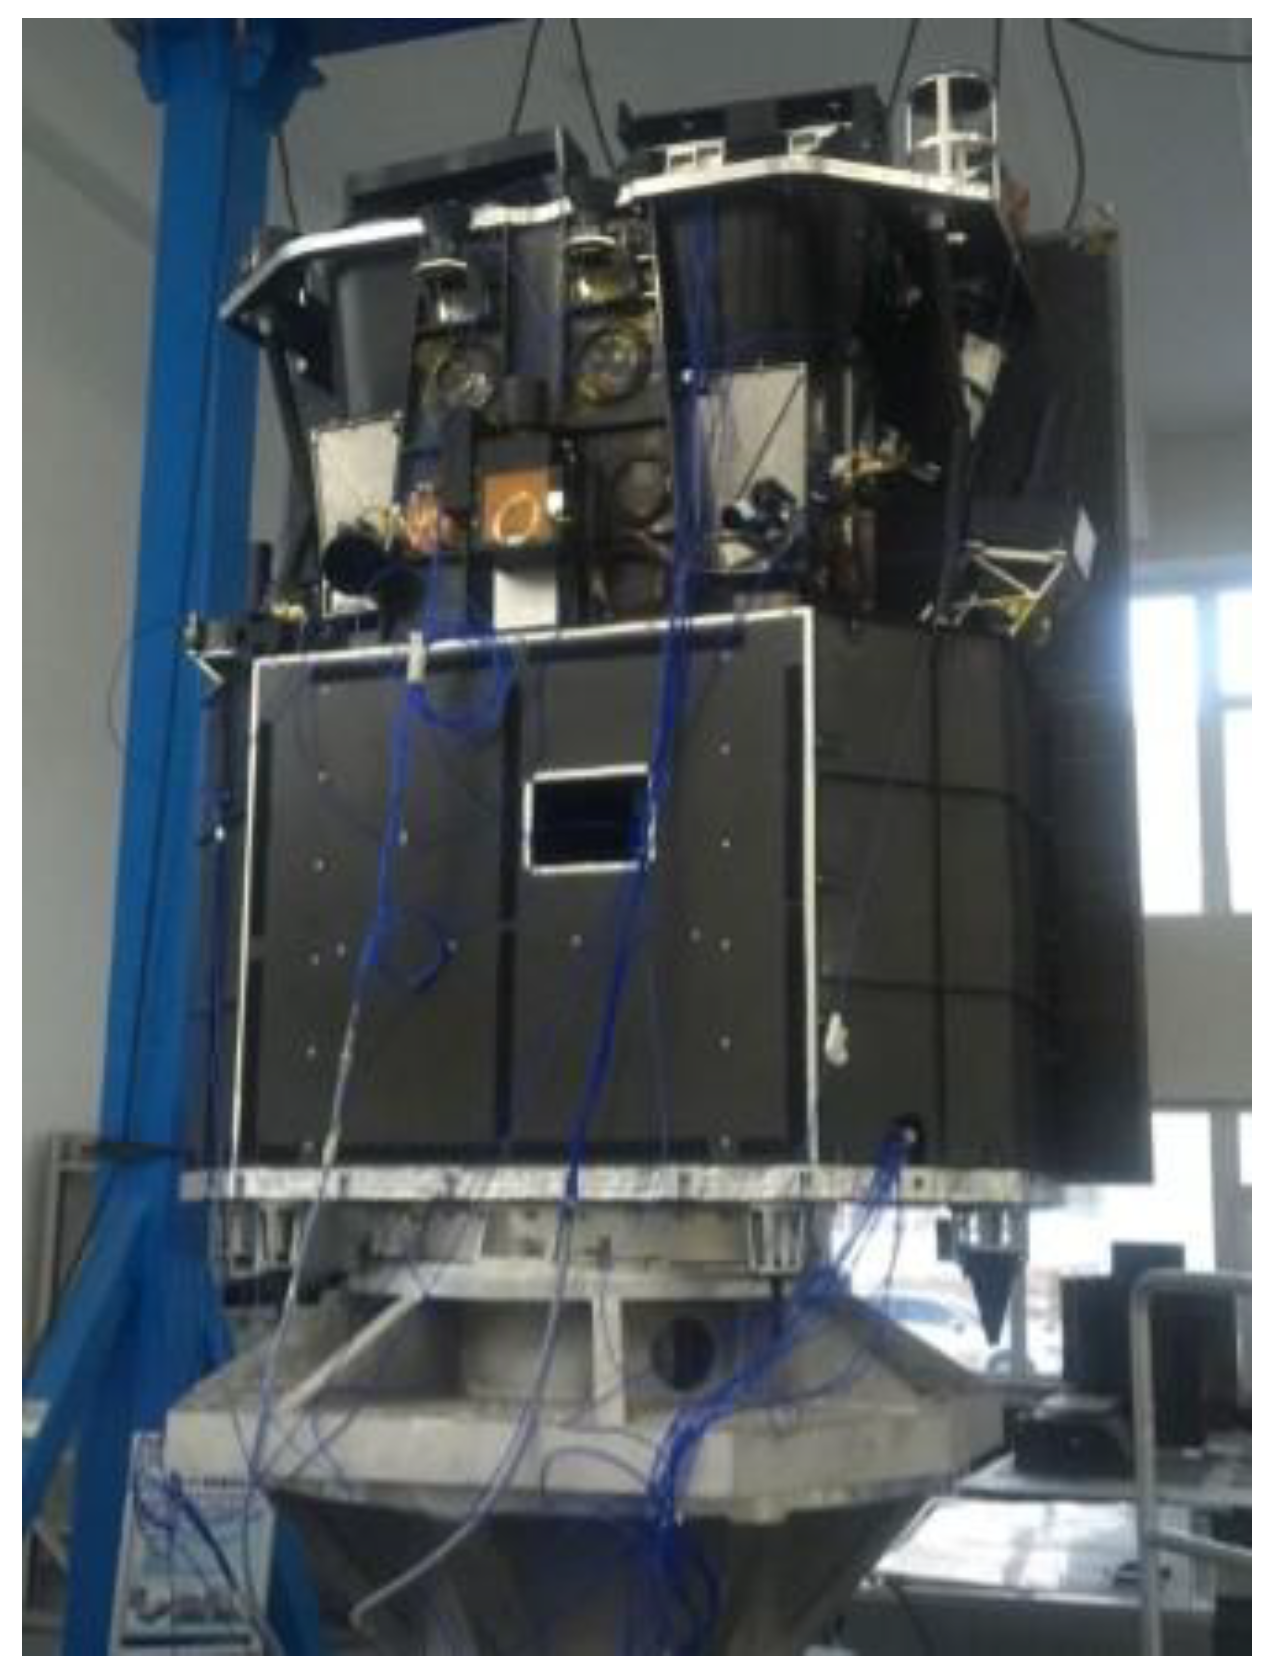
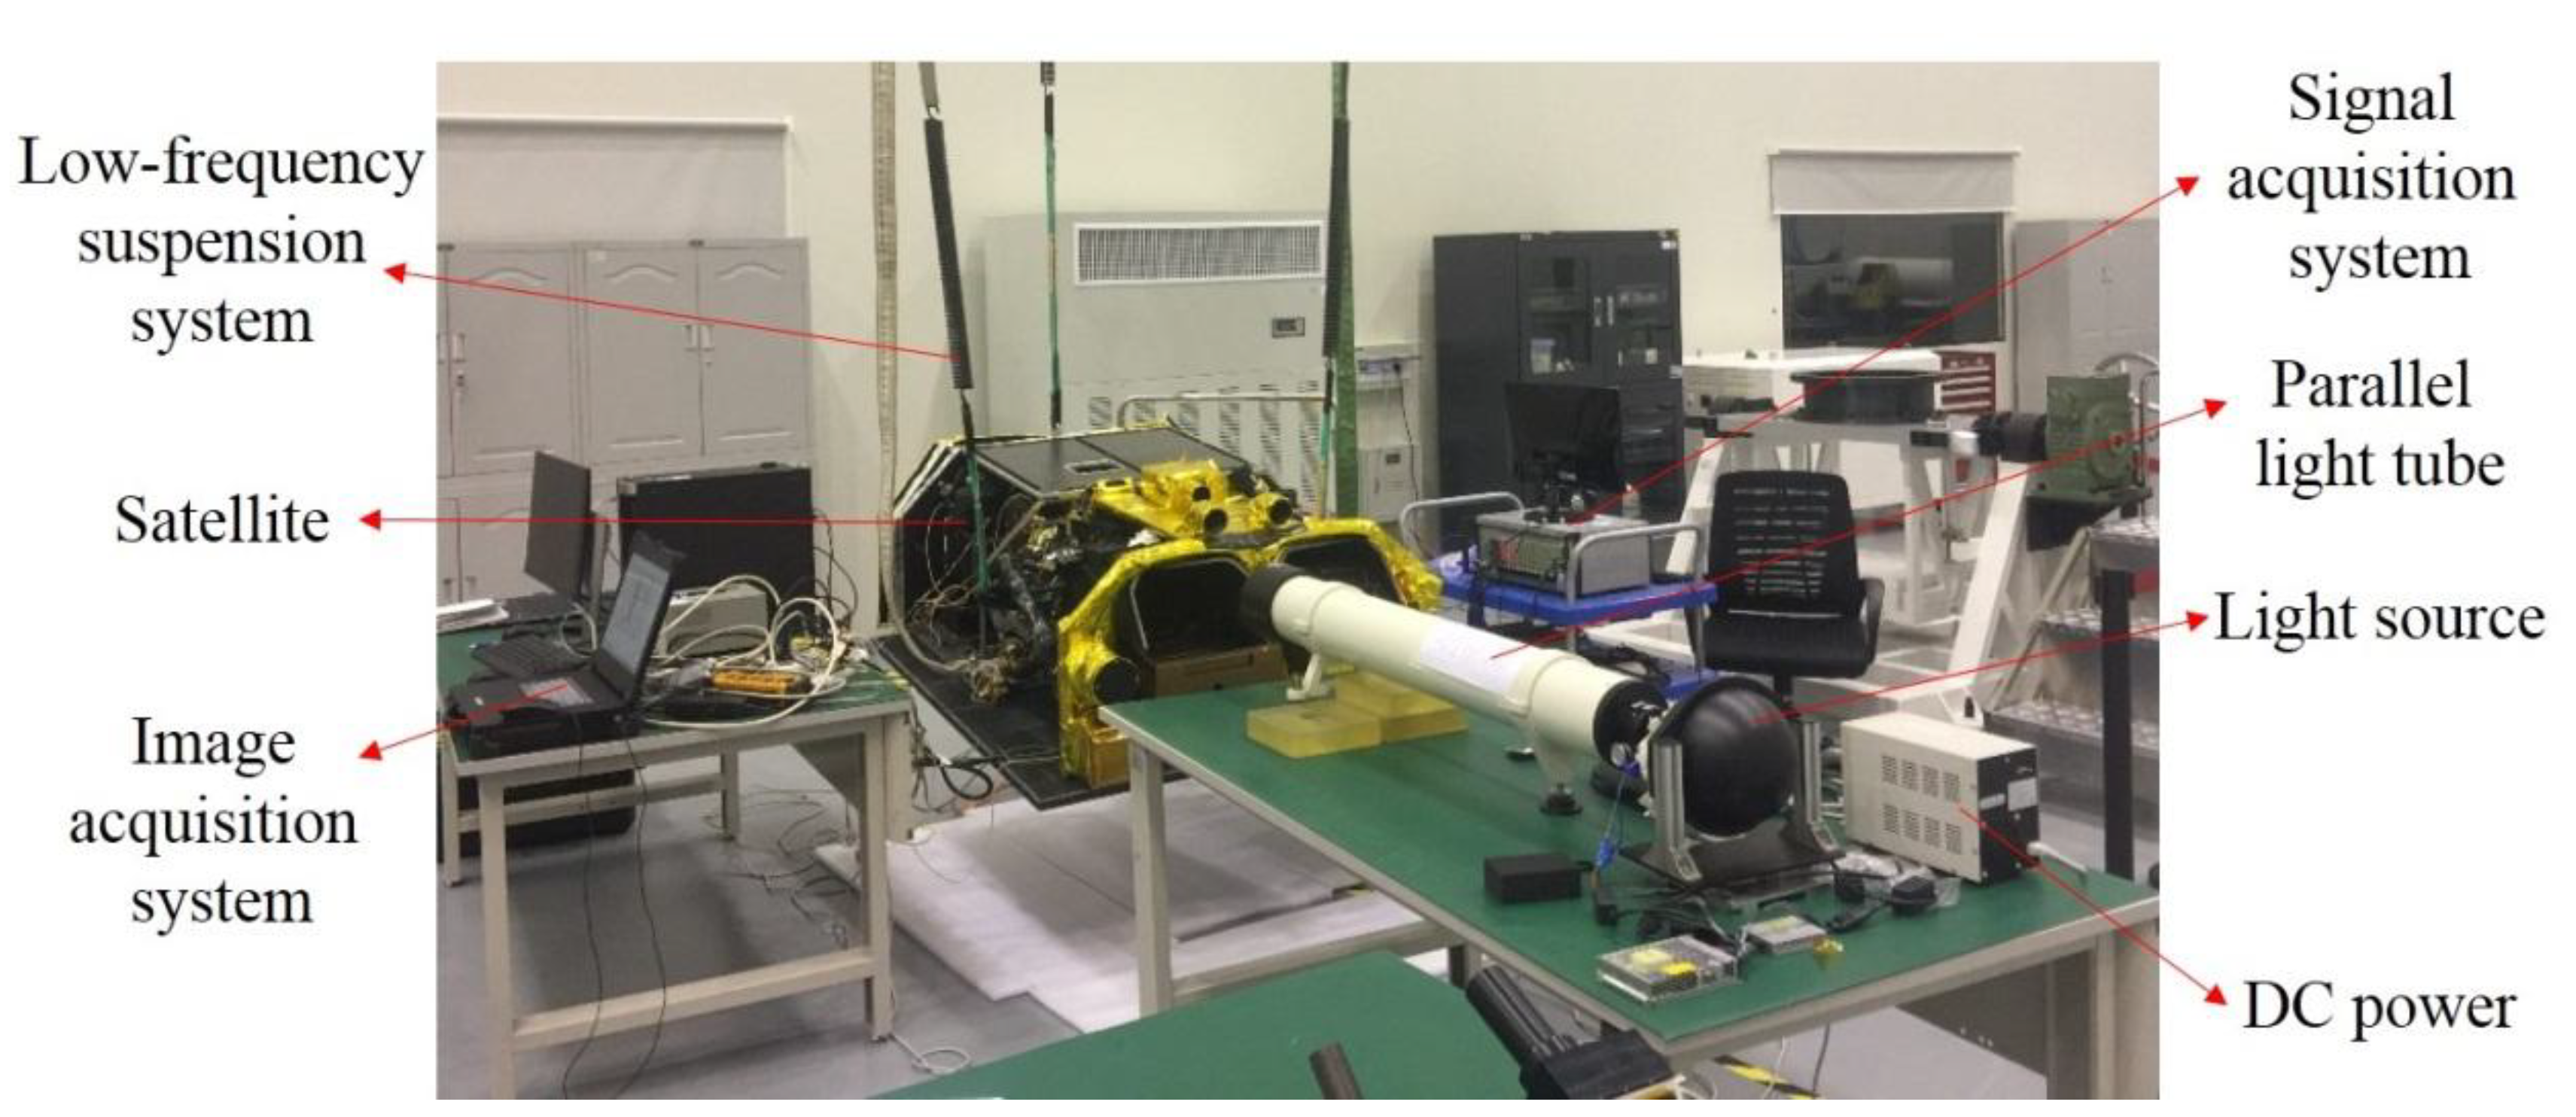
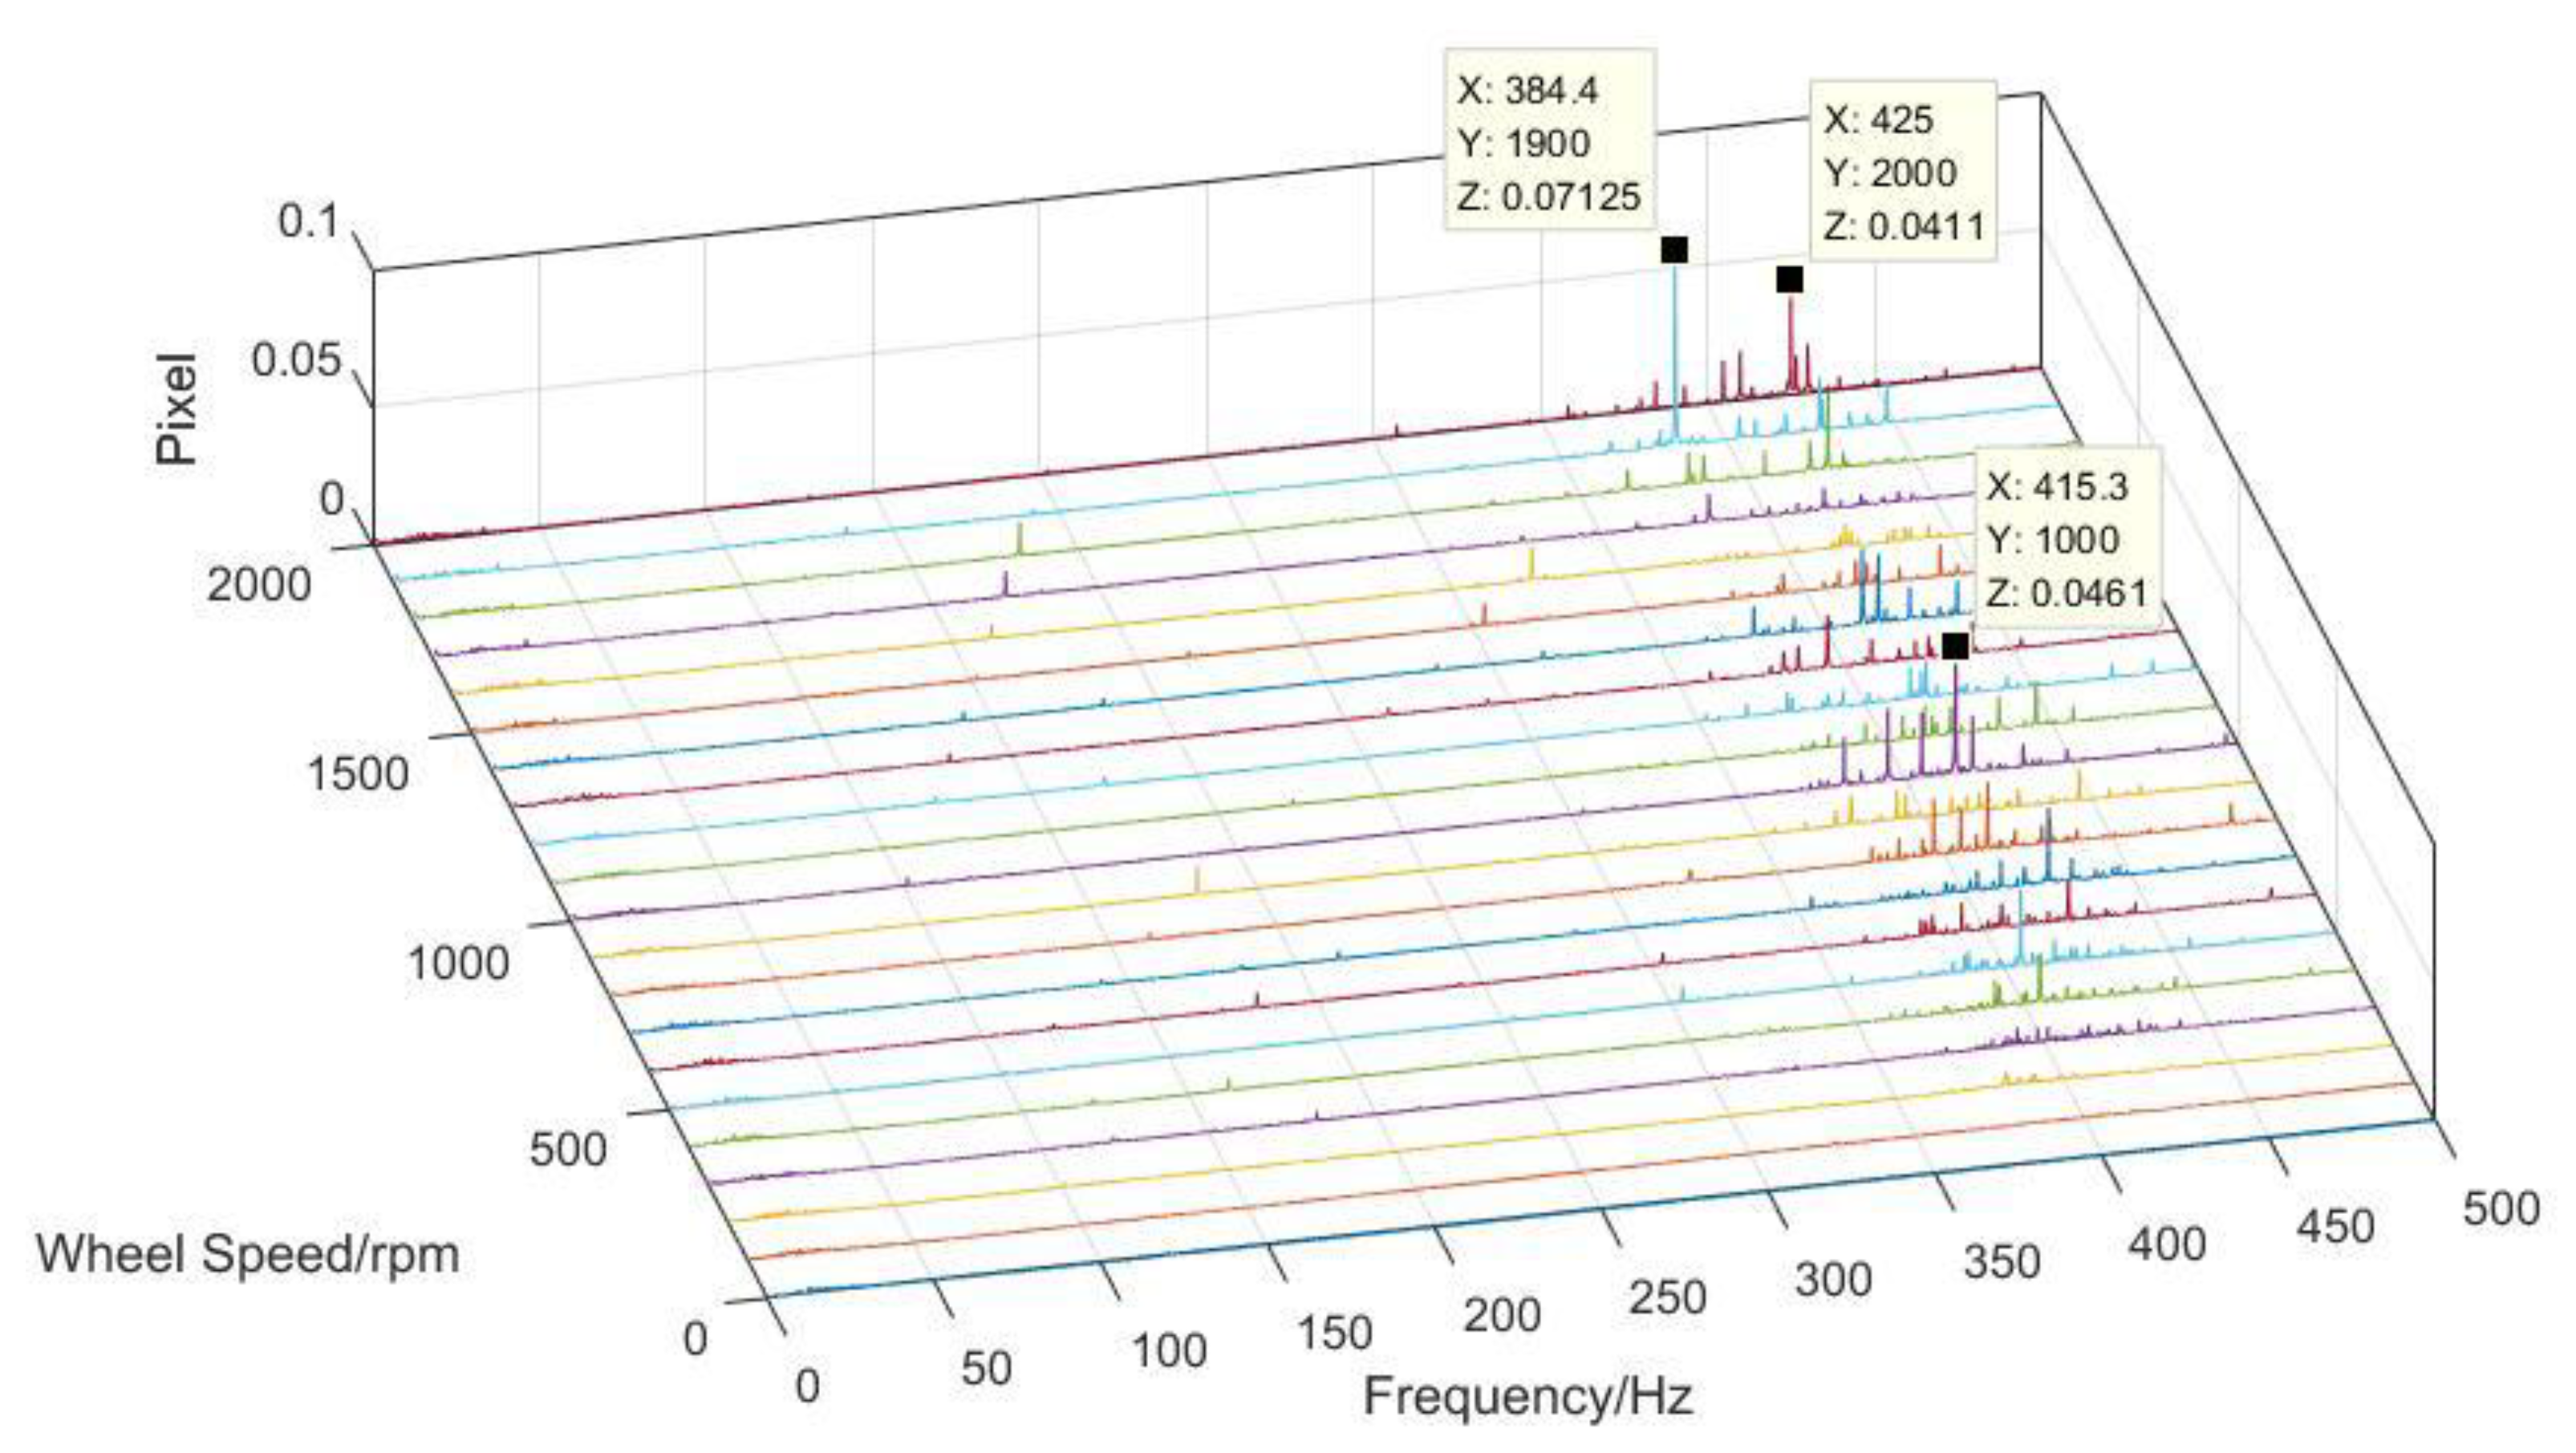
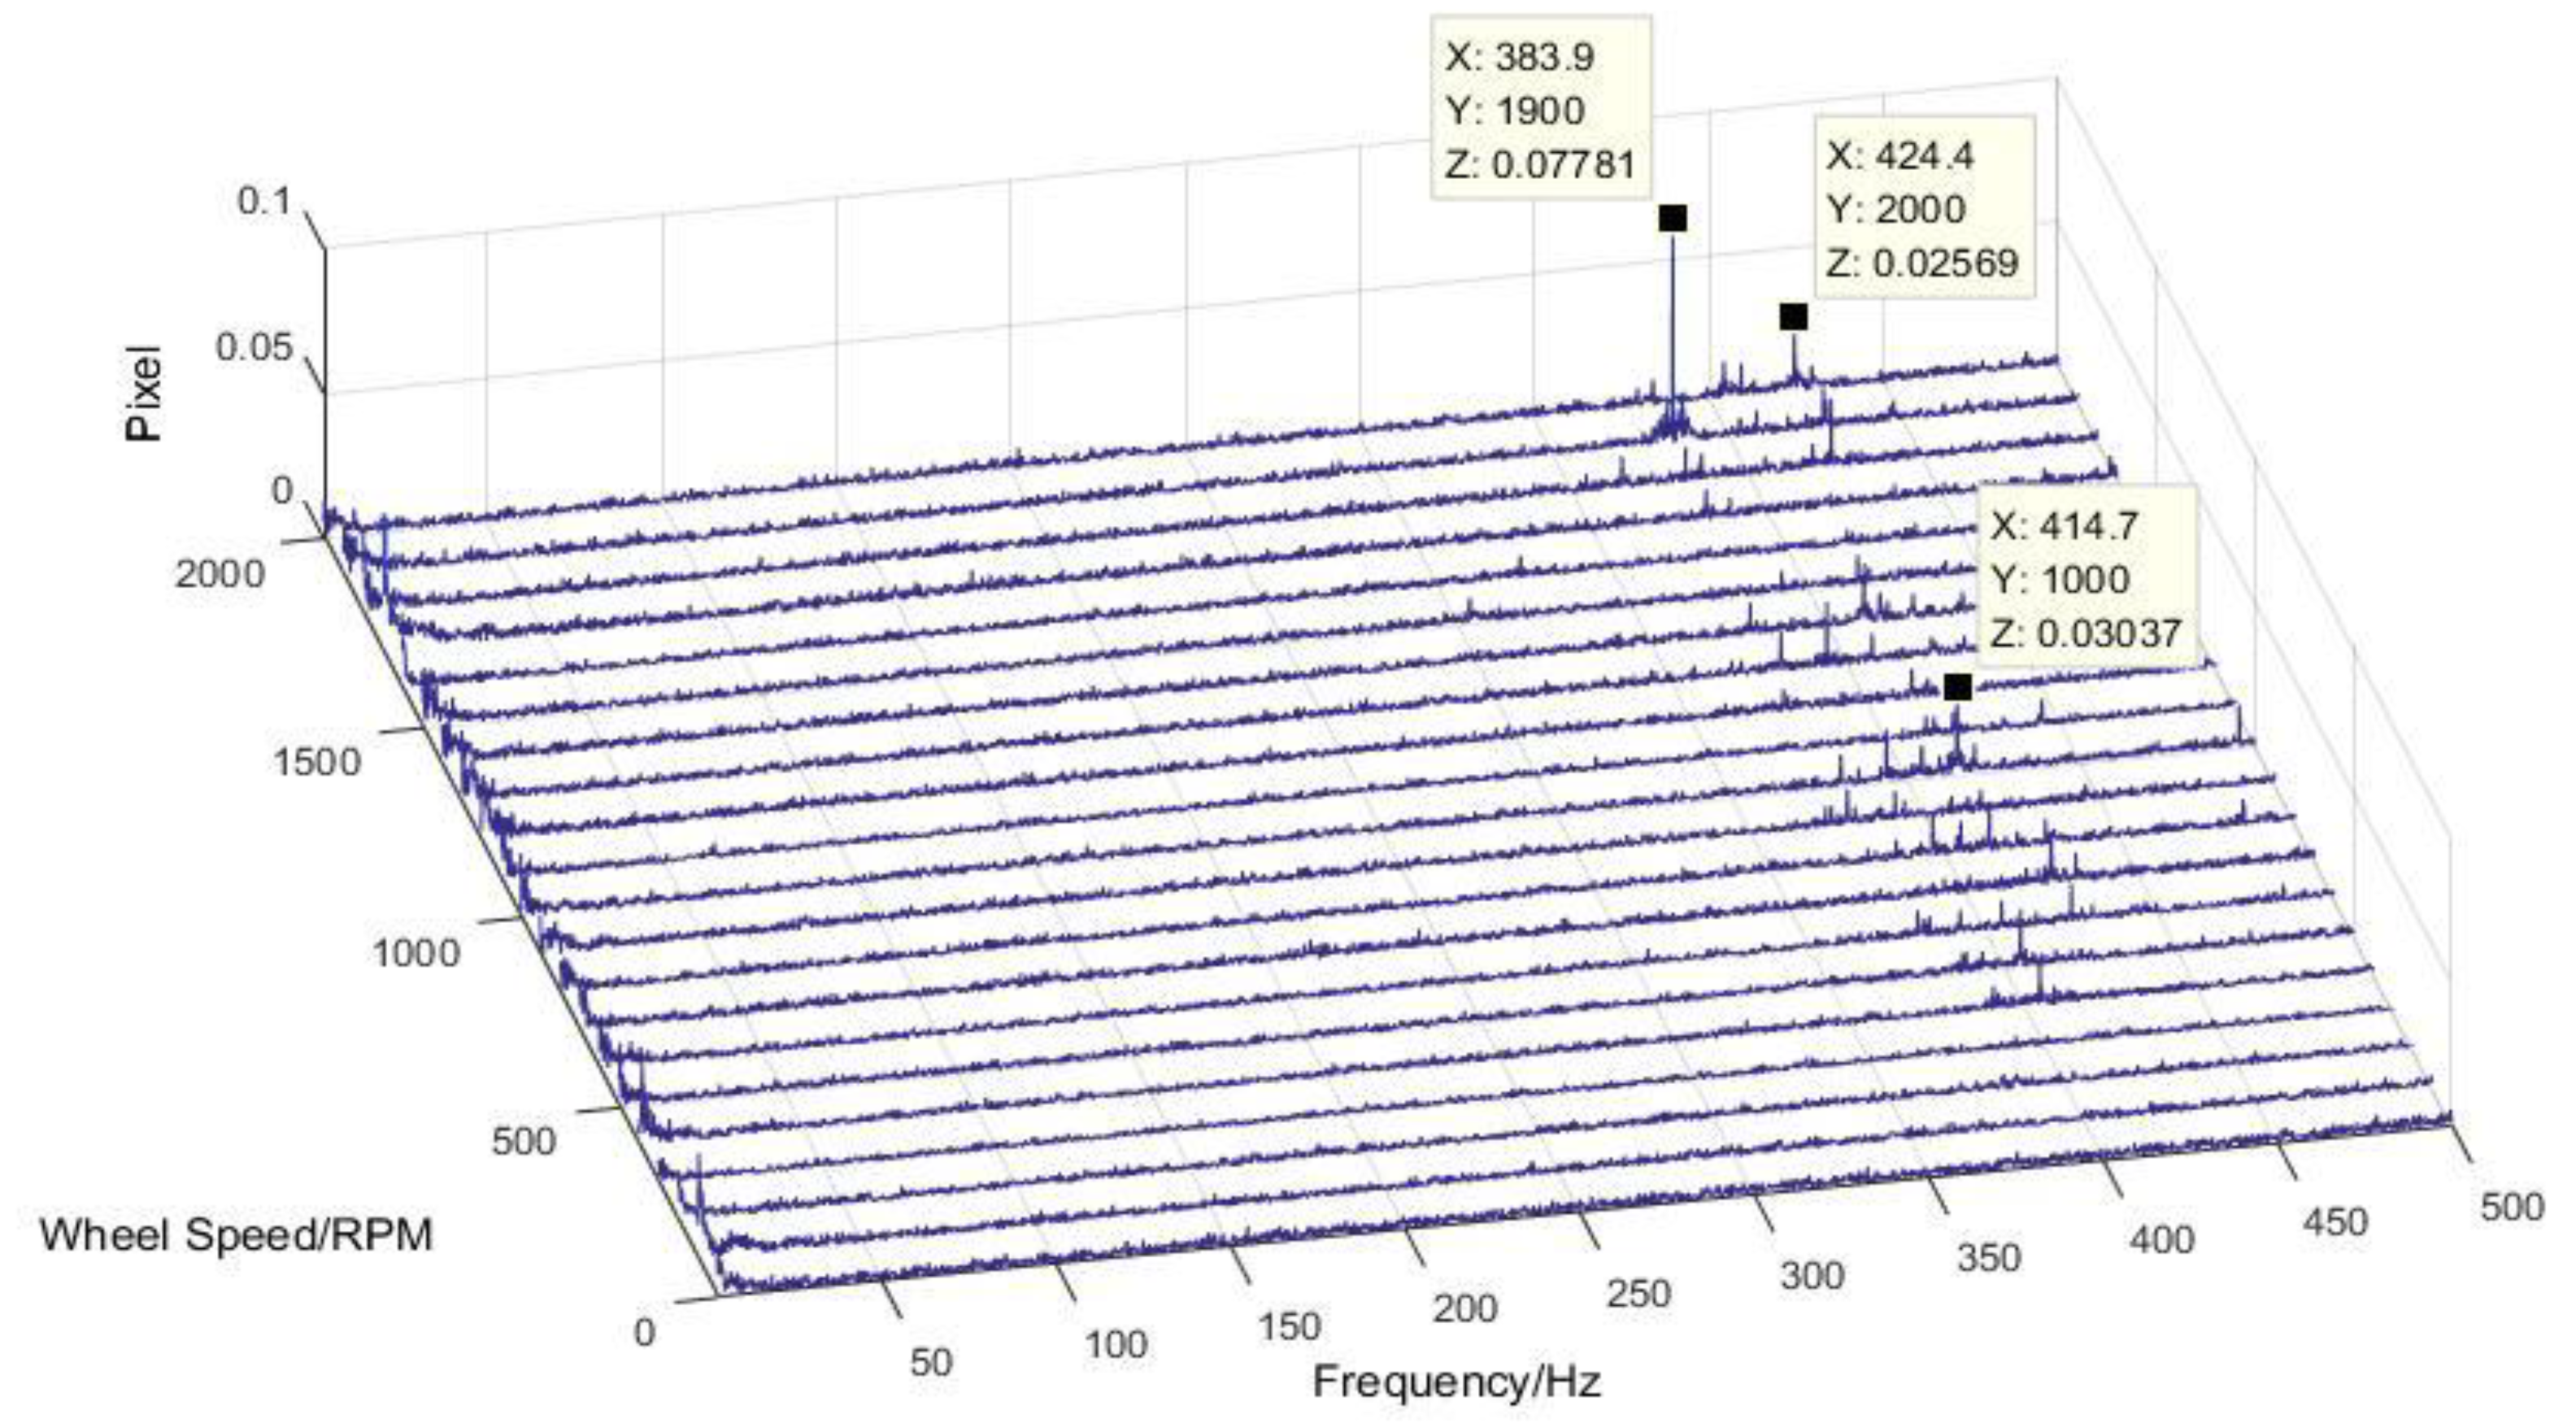
4.1. Test Process
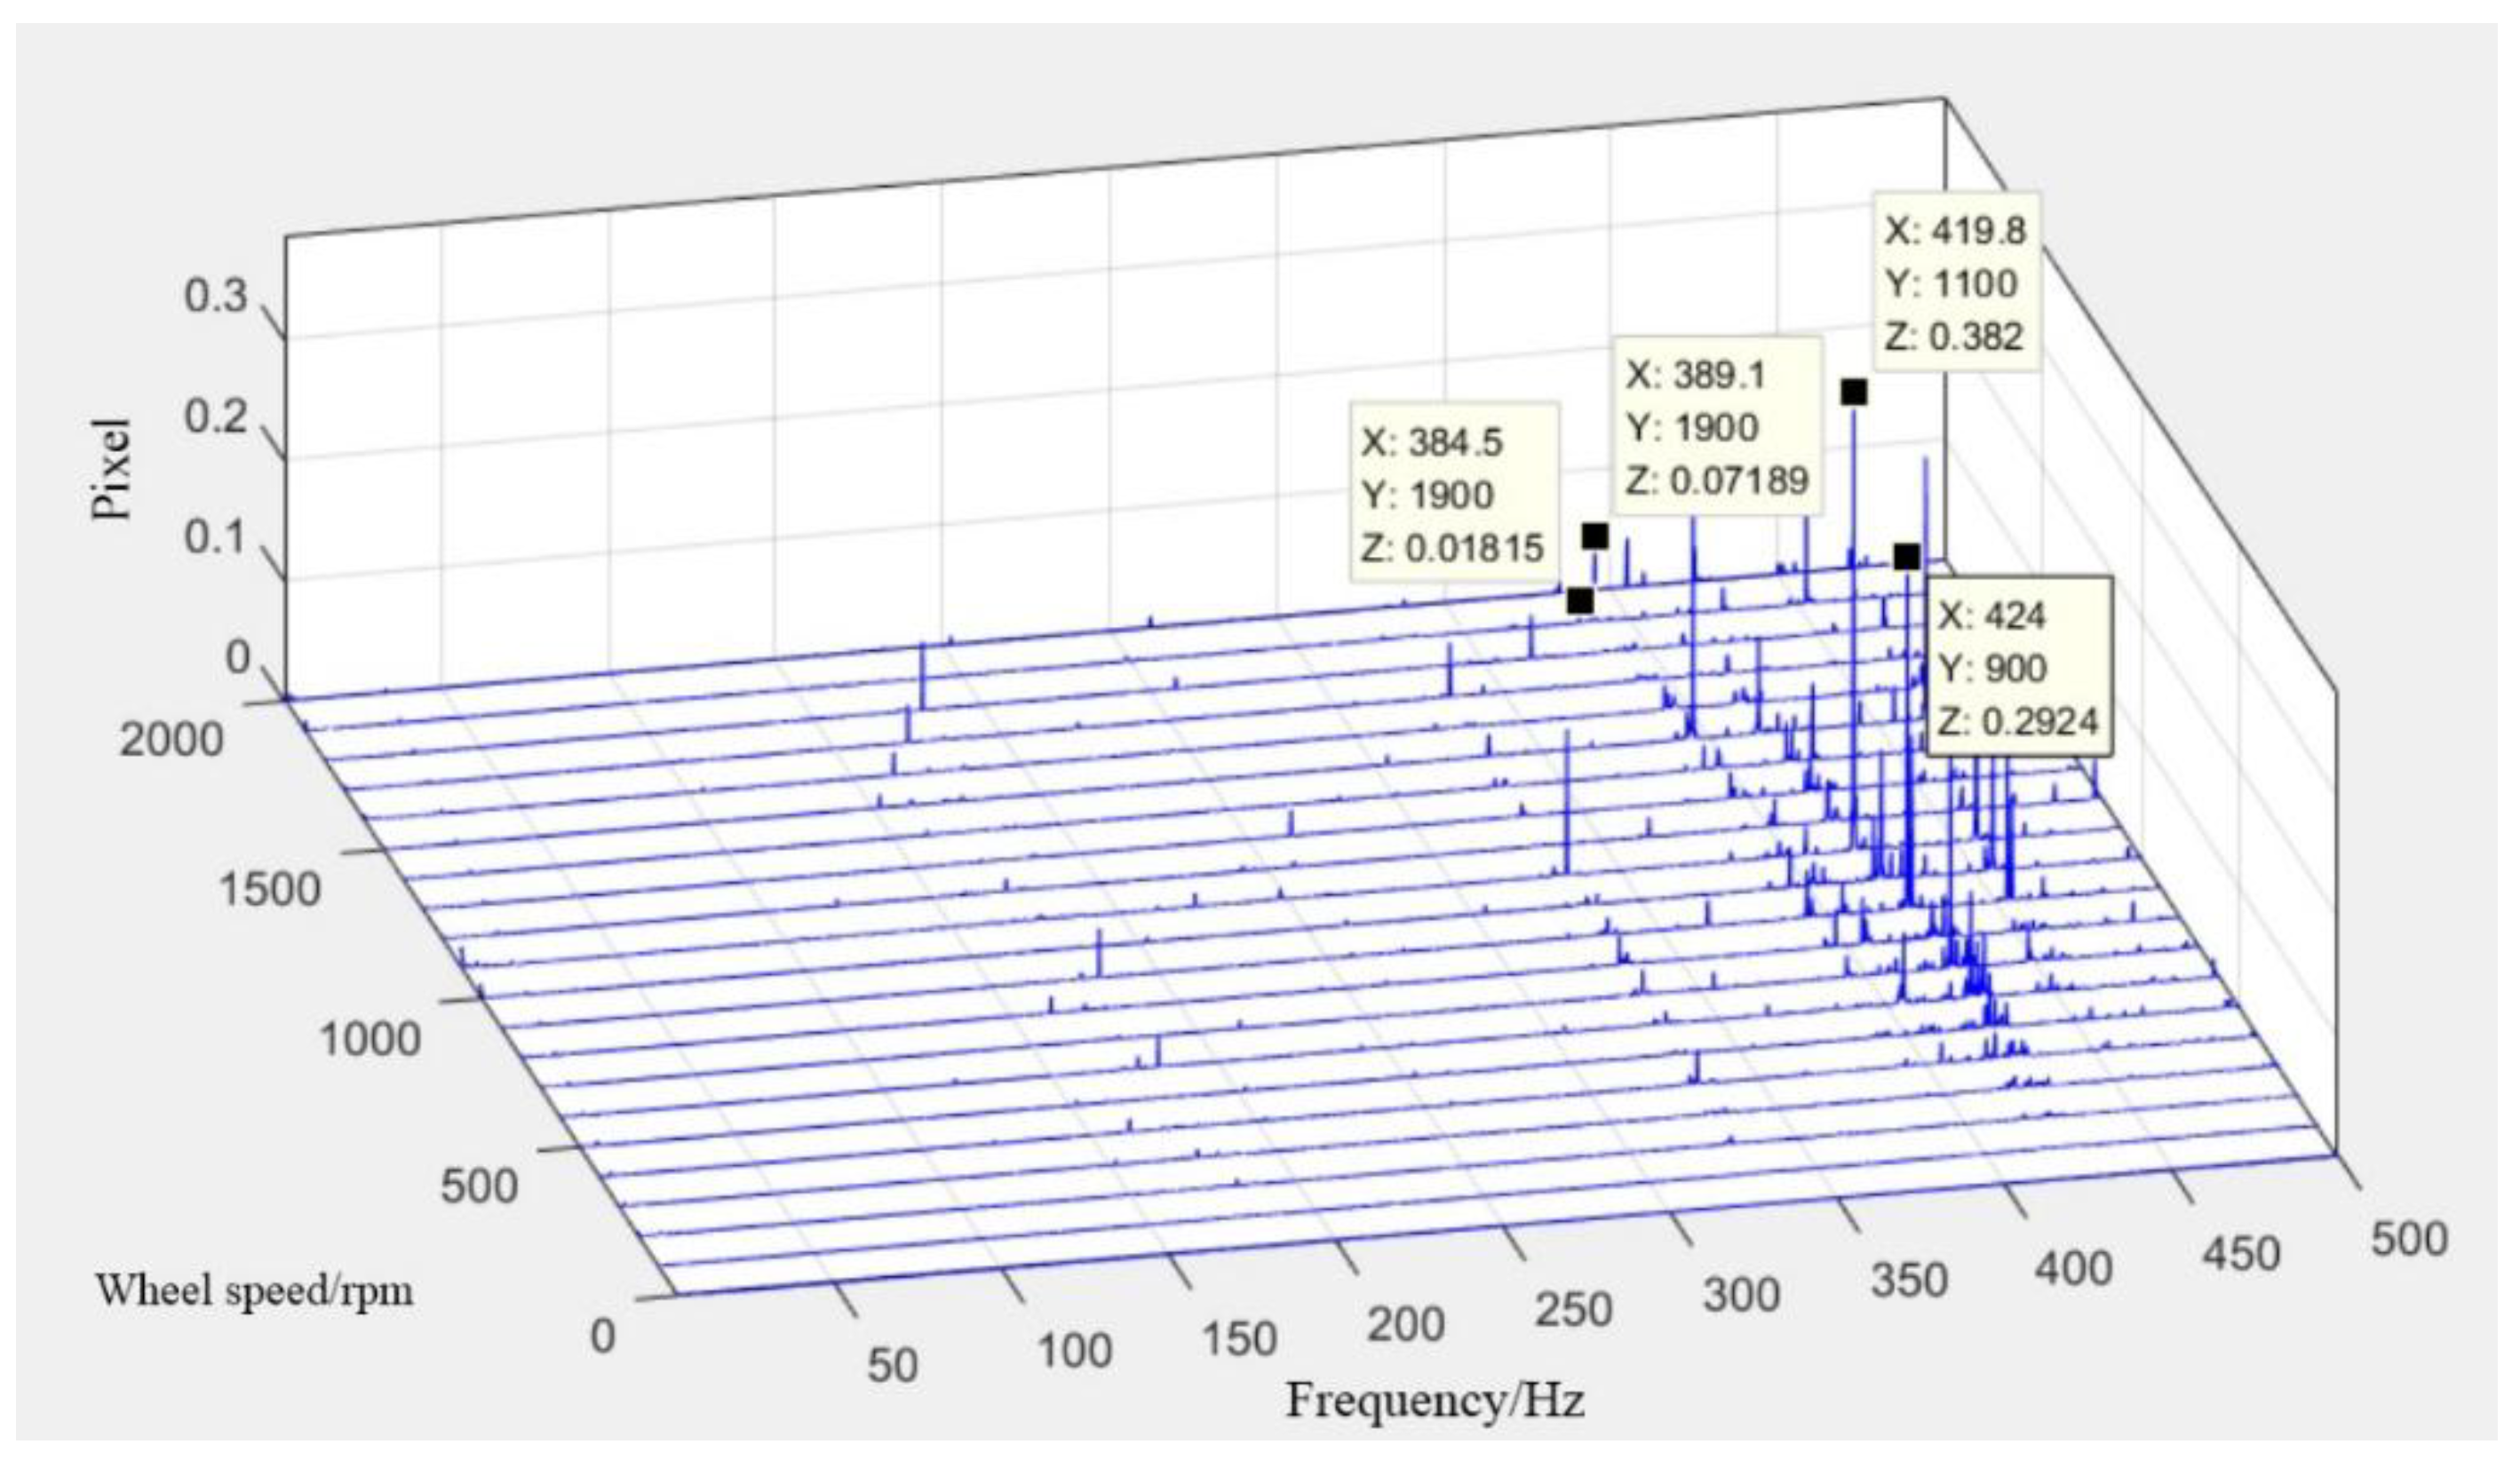
4.2. Data Processing
4.3. Comparison of the Two Test Results and the Simulation
5. Conclusions
Author Contributions
Funding
Conflicts of Interest
References
- Cobb, R.G.; Sullivan, J.M.; Das, A.; Davis, L.P.; Hyde, T.T.; Davis, T.; Rahman, Z.H.; Spanos, J.T. Vibration isolation and suppression system for precision payloads in space. Smart Mater. Struct. 1999, 8, 798–812. [Google Scholar] [CrossRef]
- Kamesh, D.; Pandiyan, R.; Ghosal, A. Modeling, design and analysis of low frequency platform for attenuating micro-vibration in spacecraft. J. Sound Vib. 2010, 329, 3431–3450. [Google Scholar] [CrossRef]
- Nagabhushan, V.; Fitz-Coy, N.G. On-orbit jitter control in momentum actuators using a three-flywheel system. Acta Astronaut. 2013, 95, 61–81. [Google Scholar] [CrossRef]
- Dae-Kwan, K. Micro-vibration model and parameter estimation method of a reaction wheel assembly. J. Sound Vib. 2014, 333, 4214–4231. [Google Scholar] [CrossRef]
- Zhou, W.Y.; Aglietti, G.S.; Zhang, Z. Modelling and testing of a soft suspension design for a reaction/momentum wheel assembly. J. Sound Vib. 2011, 330, 4596–4610. [Google Scholar] [CrossRef]
- Bronowicki, A.J. Vibration Isolator for Large Space Telescopes. J. Spacecr. Rockets 2006, 43, 45–53. [Google Scholar] [CrossRef]
- Miller, D.W.; de Weck, O.L.; Uebelhart, S.A.; Grogan, R.; Basdogan, I. Integrated dynamics and controls modeling for the space interferometry mission (SIM). In Proceedings of the IEEE Aerospace Conference, Big Sky, MT, USA, 10–17 March 2001; pp. 42089–42102. [Google Scholar]
- Seungchol, C.; Horie, M. Simulation and vibration test for a micro-spiral beam device. In Proceedings of the International Conference on Industrial Engineering and Applications (ICIEA), Nagoya, Japan, 21–23 April 2017. [Google Scholar]
- Toyoshima, M.; Takayama, Y.; Kunimori, H.; Jono, T.; Yamakawa, S. In-orbit measurements of spacecraft microvibrations for satellite laser communication links. Opt. Eng. 2010, 49, 083604. [Google Scholar] [CrossRef]
- Kawak, B. Development of a low-cost, low micro-vibration cmg for small agile satellite applications. Acta Astronaut. 2017, 131, 113–122. [Google Scholar] [CrossRef]
- Genberg, V.L.; Michels, G.J.; Doyle, K.B. Integrated modeling of jitter MTF due to random loads. In Optical Modeling and Performance Predictions V; SPIE 8127; International Society for Optics and Photonic: San Diego, CA, USA, 2011. [Google Scholar]
- LoBosco, D.M. Integrated modeling of optical performance for the Terrestrial Planet Finder structurally connected interferometer. In Modeling and Systems Engineering for Astronomy; SPIE 5497; International Society for Optics and Photonic: Glasgow, UK, 2004; pp. 278–289. [Google Scholar]
- Park, G.; Dae-Oen, L.; Jae-Hung, H. Development of multi-degree-of-freedom micro vibration emulator for efficient jitter test of spacecraft. J. Intell. Mater. Syst. Struct. 2014, 25, 1069–1081. [Google Scholar] [CrossRef]
- Li, L.; Tan, L.; Kong, L.; Wang, D.; Yang, H. The influence of flywheel micro vibration on space camera and vibration suppression. Mech. Syst. Signal Process. 2018, 100, 360–370. [Google Scholar] [CrossRef]
- Wang, D.; Jiang, S.; Zhang, P.; Zhang, B. The research micro-vibration detecting optical imaging system verification. In Proceedings of the International Conference on Insulating Materials, Material Application and Electrical Engineering, Melbourne, Australia, 15–16 September 2018. [Google Scholar]
- Pang, S.; Pan, T.; Mao, Y.; Li, X.; Zhang, M. Study and verification of micro-vibration test for a satellite. Spacecr. Environ. Eng. 2016, 33, 305–311. [Google Scholar]
- Mosier, G.E.; Howard, J.M.; Johnston, J.D.; Parrish, K.A.; Hyde, T.T.; McGinnis, M.A.; Bluth, A.M.; Kim, K.; Ha, K.Q. The role of integrated modeling in the design and verification of the James Webb Space Telescope. In Space Systems Engineering and Optical Alignment Mechanisms; SPIE 5528; International Society for Optics and Photonic: Denver, CO, USA, 2004; pp. 96–108. [Google Scholar]
- Howard, J.M. Optical modeling activities for the James Webb Space Telescope (JWST) project: I. The linear optical model. In Optical Modeling and Performance Predictions; SPIE 5178; International Society for Optics and Photonic: San Diego, CA, USA, 2004. [Google Scholar]
- Hyde, T.T.; Ha, K.Q.; Johnston, J.D.; Howard, J.M.; Mosier, G.E. Integrated modeling activities for the James Webb Space Telescope: Optical jitter analysis. In Optical, Infrared, and Millimeter Space Telescopes; SPIE 5487; International Society for Optics and Photonic: Glasgow, UK, 2004. [Google Scholar]
- Wacker, T.; Weimer, L.; Eckert, K. GOCE platform micro-vibration verification by test and analysis. In Proceedings of the European Conference on Spacecraft Structures, Materials and Mechanical Testing, Noordwijk, The Netherland, 10–12 May 2005. [Google Scholar]
- Taniwaki, S.; Ohkami, Y. Experimental and numerical analysis of reaction wheel perturbations. JSME Int. J. 2003, 46, 519–526. [Google Scholar] [CrossRef]
- Zhou, W.Y.; Li, D.X.; Luo, Q.; Liu, K. Analysis and testing of micro-vibrations produced by momentum wheel assemblies. Chin. J. Aeronaut. 2012, 25, 640–649. [Google Scholar] [CrossRef]
- Toyoshima, M.; Jono, T.; Takahashi, N.; Yamawaki, T.; Nakagawa, K.; Arai, K. Transfer functions of micro vibrational disturbances on a satellite. In Proceedings of the 21st International Communications Satellite Systems Conference and Exhibit, Washington, DC, USA, 15–19 April 2003; p. 2406. [Google Scholar]
- Wang, C.G.; Liu, Y.P.; Tan, H.F. Global and local interactive buckling behavior of a stiff film/compliant substrate system. Int. J. Solids Struct. 2016, 102–103, 176–185. [Google Scholar] [CrossRef]
- Kamesh, D.; Pandiyan, R.; Ghosal, A. Passive vibration isolation of reaction wheel perturbations using a low frequency flexible space platform. J. Sound Vib. 2012, 331, 1310–1330. [Google Scholar] [CrossRef]
- Lee, D.O.; Yoon, J.S.; Han, J.H. Development of integrated simulation tool for jitter analysis. Int. J. Aeronaut. Space Sci. 2012, 13, 64–73. [Google Scholar] [CrossRef]
- Doyle, K.B. Structural line-of-sight jitter analysis for MLCD. In New Developments in Optomechanics; SPIE 6665; International Society for Optics and Photonic: San Diego, CA, USA, 2007. [Google Scholar]
- Serief, C. Estimate of the effect of micro-vibration on the performance of the Algerian satellite (Alsat-1B) imager. Opt. Laser Technol. 2017, 96, 147–152. [Google Scholar] [CrossRef]
- Matsko, A.B.; Savchenkov, A.A.; Maleki, L. Stability of resonant opto-mechanical oscillators. Opt. Express 2012, 20, 16234–16244. [Google Scholar] [CrossRef]
- Zhang, Z.; Du, C.; Jiang, Q. Structural Dynamics, 1st ed.; Hohai University Press: Nan Jing, China, 2001; pp. 36–39. [Google Scholar]
- Liu, Y.P.; Guo, K.; Wang, C.G.; Gao, H.J. Wrinkling and ratcheting of a thin film on cyclically deforming plastic substrate: Mechanical instability of the solid-electrolyte interphase in Li-ion batteries. J. Mech. Phys. Solids 2018, 123, 103–118. [Google Scholar] [CrossRef]
- Zhu, G.; Yao, X.R.; Sun, Z.B.; Qiu, P.; Wang, C.; Zhai, G.J.; Zhao, Q. A High-Speed Imaging Method Based on Compressive Sensing for Sound Extraction Using a Low-Speed Camera. Sensors 2018, 18, 1524. [Google Scholar] [CrossRef]
- Wang, B.; Zhi, Q.C.; Zhang, Z.; Geng, G.; Zhou, M. Computation of Center of Mass for Gray Level Image Based on Differential Moments Factor. J. Comput. Aided Des. Comput. Graphics 2004, 16, 1360–1365. [Google Scholar]


| Unit Transition/Tilt of Optical Component | Image Motion of the Central Image Point on the Focal Plane (mm) | |||||||
|---|---|---|---|---|---|---|---|---|
| Primary Mirror | Secondary Mirror | Tertiary Mirror | Image Surface | |||||
| +X | +Y | +X | +Y | +X | +Y | +X | +Y | |
| Transition in +X direction/mm | 0.98 | 0 | −1.4 | 0 | 1.36 | 0 | −1 | 0 |
| Tilt about +X direction/° | 0 | −20.66 | 0 | 9.09 | 0 | −13.46 | 0 | 0 |
| Transition in +Y direction/mm | 0 | 1 | 0 | −1.33 | 0 | 1.35 | 0 | −1 |
| Tilt about +Y direction/° | 21.17 | 0 | −9.2 | 0 | 13.72 | 0 | 0 | 0 |
| Transition in +Z direction/mm | 0.3 | 0 | −0.13 | 0 | 0.05 | 0 | −0.05 | 0 |
| Tilt about +Z direction/° | 0 | 0 | 0 | 0 | 0 | 0 | 0 | 0 |
© 2019 by the authors. Licensee MDPI, Basel, Switzerland. This article is an open access article distributed under the terms and conditions of the Creative Commons Attribution (CC BY) license (http://creativecommons.org/licenses/by/4.0/).
Share and Cite
Chen, S.-B.; Xuan, M.; Zhang, L.; Gu, S.; Gong, X.-X.; Sun, H.-Y. Simulating and Testing Microvibrations on an Optical Satellite Using Acceleration Sensor-Based Jitter Measurements. Sensors 2019, 19, 1797. https://doi.org/10.3390/s19081797
Chen S-B, Xuan M, Zhang L, Gu S, Gong X-X, Sun H-Y. Simulating and Testing Microvibrations on an Optical Satellite Using Acceleration Sensor-Based Jitter Measurements. Sensors. 2019; 19(8):1797. https://doi.org/10.3390/s19081797
Chicago/Turabian StyleChen, Shan-Bo, Ming Xuan, Lei Zhang, Song Gu, Xiao-Xue Gong, and Hong-Yu Sun. 2019. "Simulating and Testing Microvibrations on an Optical Satellite Using Acceleration Sensor-Based Jitter Measurements" Sensors 19, no. 8: 1797. https://doi.org/10.3390/s19081797
APA StyleChen, S.-B., Xuan, M., Zhang, L., Gu, S., Gong, X.-X., & Sun, H.-Y. (2019). Simulating and Testing Microvibrations on an Optical Satellite Using Acceleration Sensor-Based Jitter Measurements. Sensors, 19(8), 1797. https://doi.org/10.3390/s19081797