A Computer Vision-Based Roadside Occupation Surveillance System for Intelligent Transport in Smart Cities


Abstract
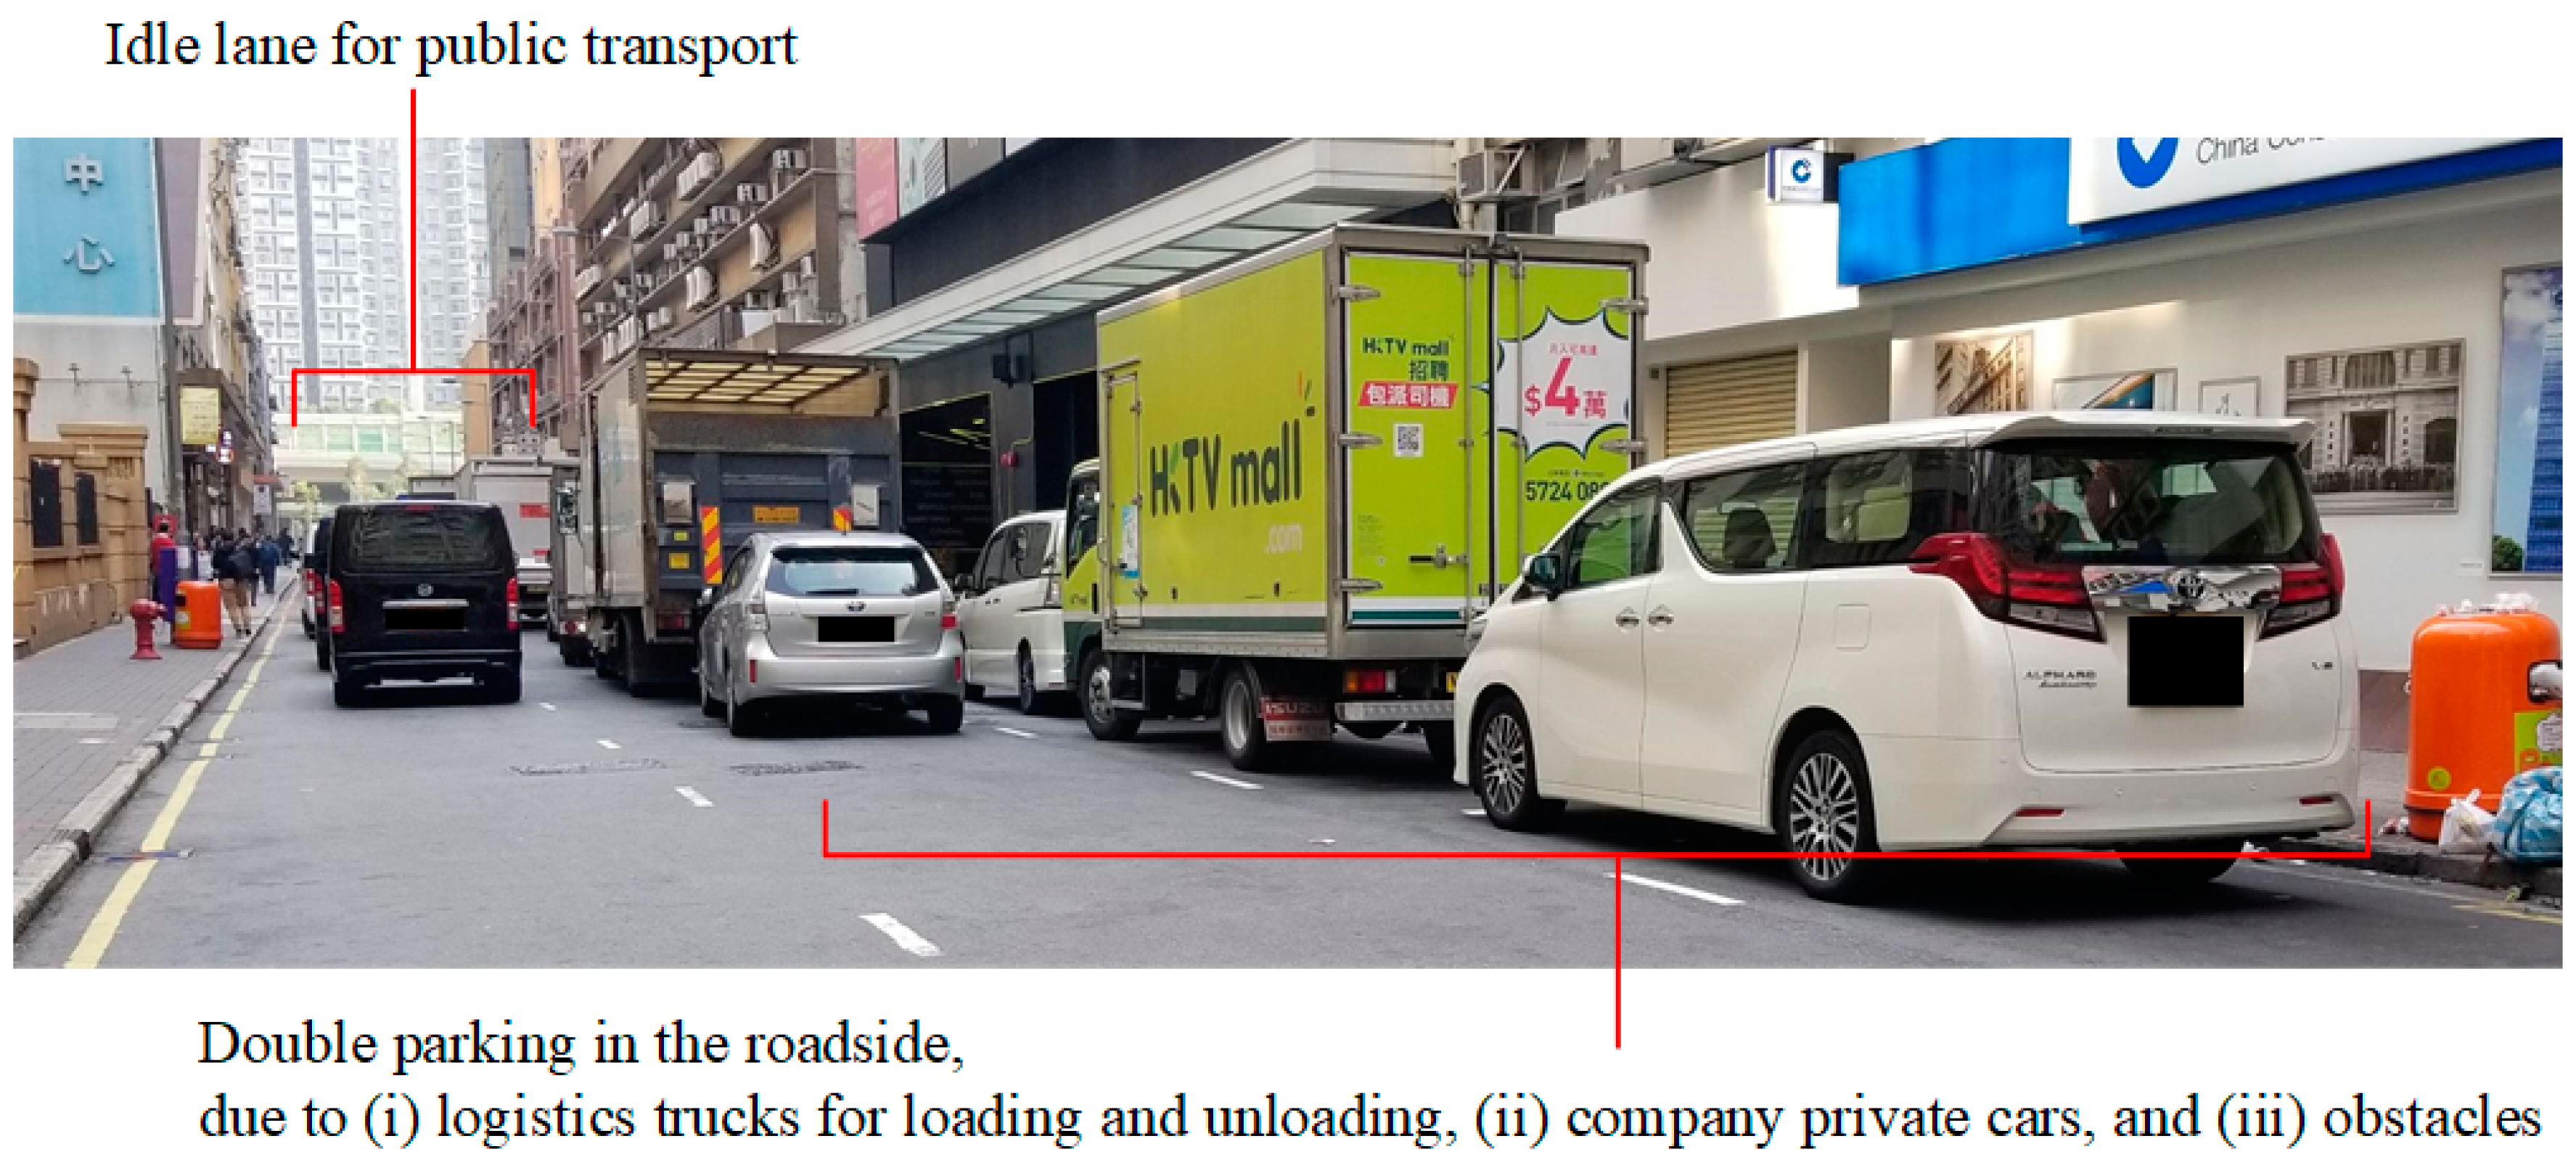
1. Introduction
2. Literature Review
2.1. Overview of Roadside Surveillance Systems
2.2. Methods of Roadside Surveillance Systems
2.3. IoT Technologies for Roadside Surveillance
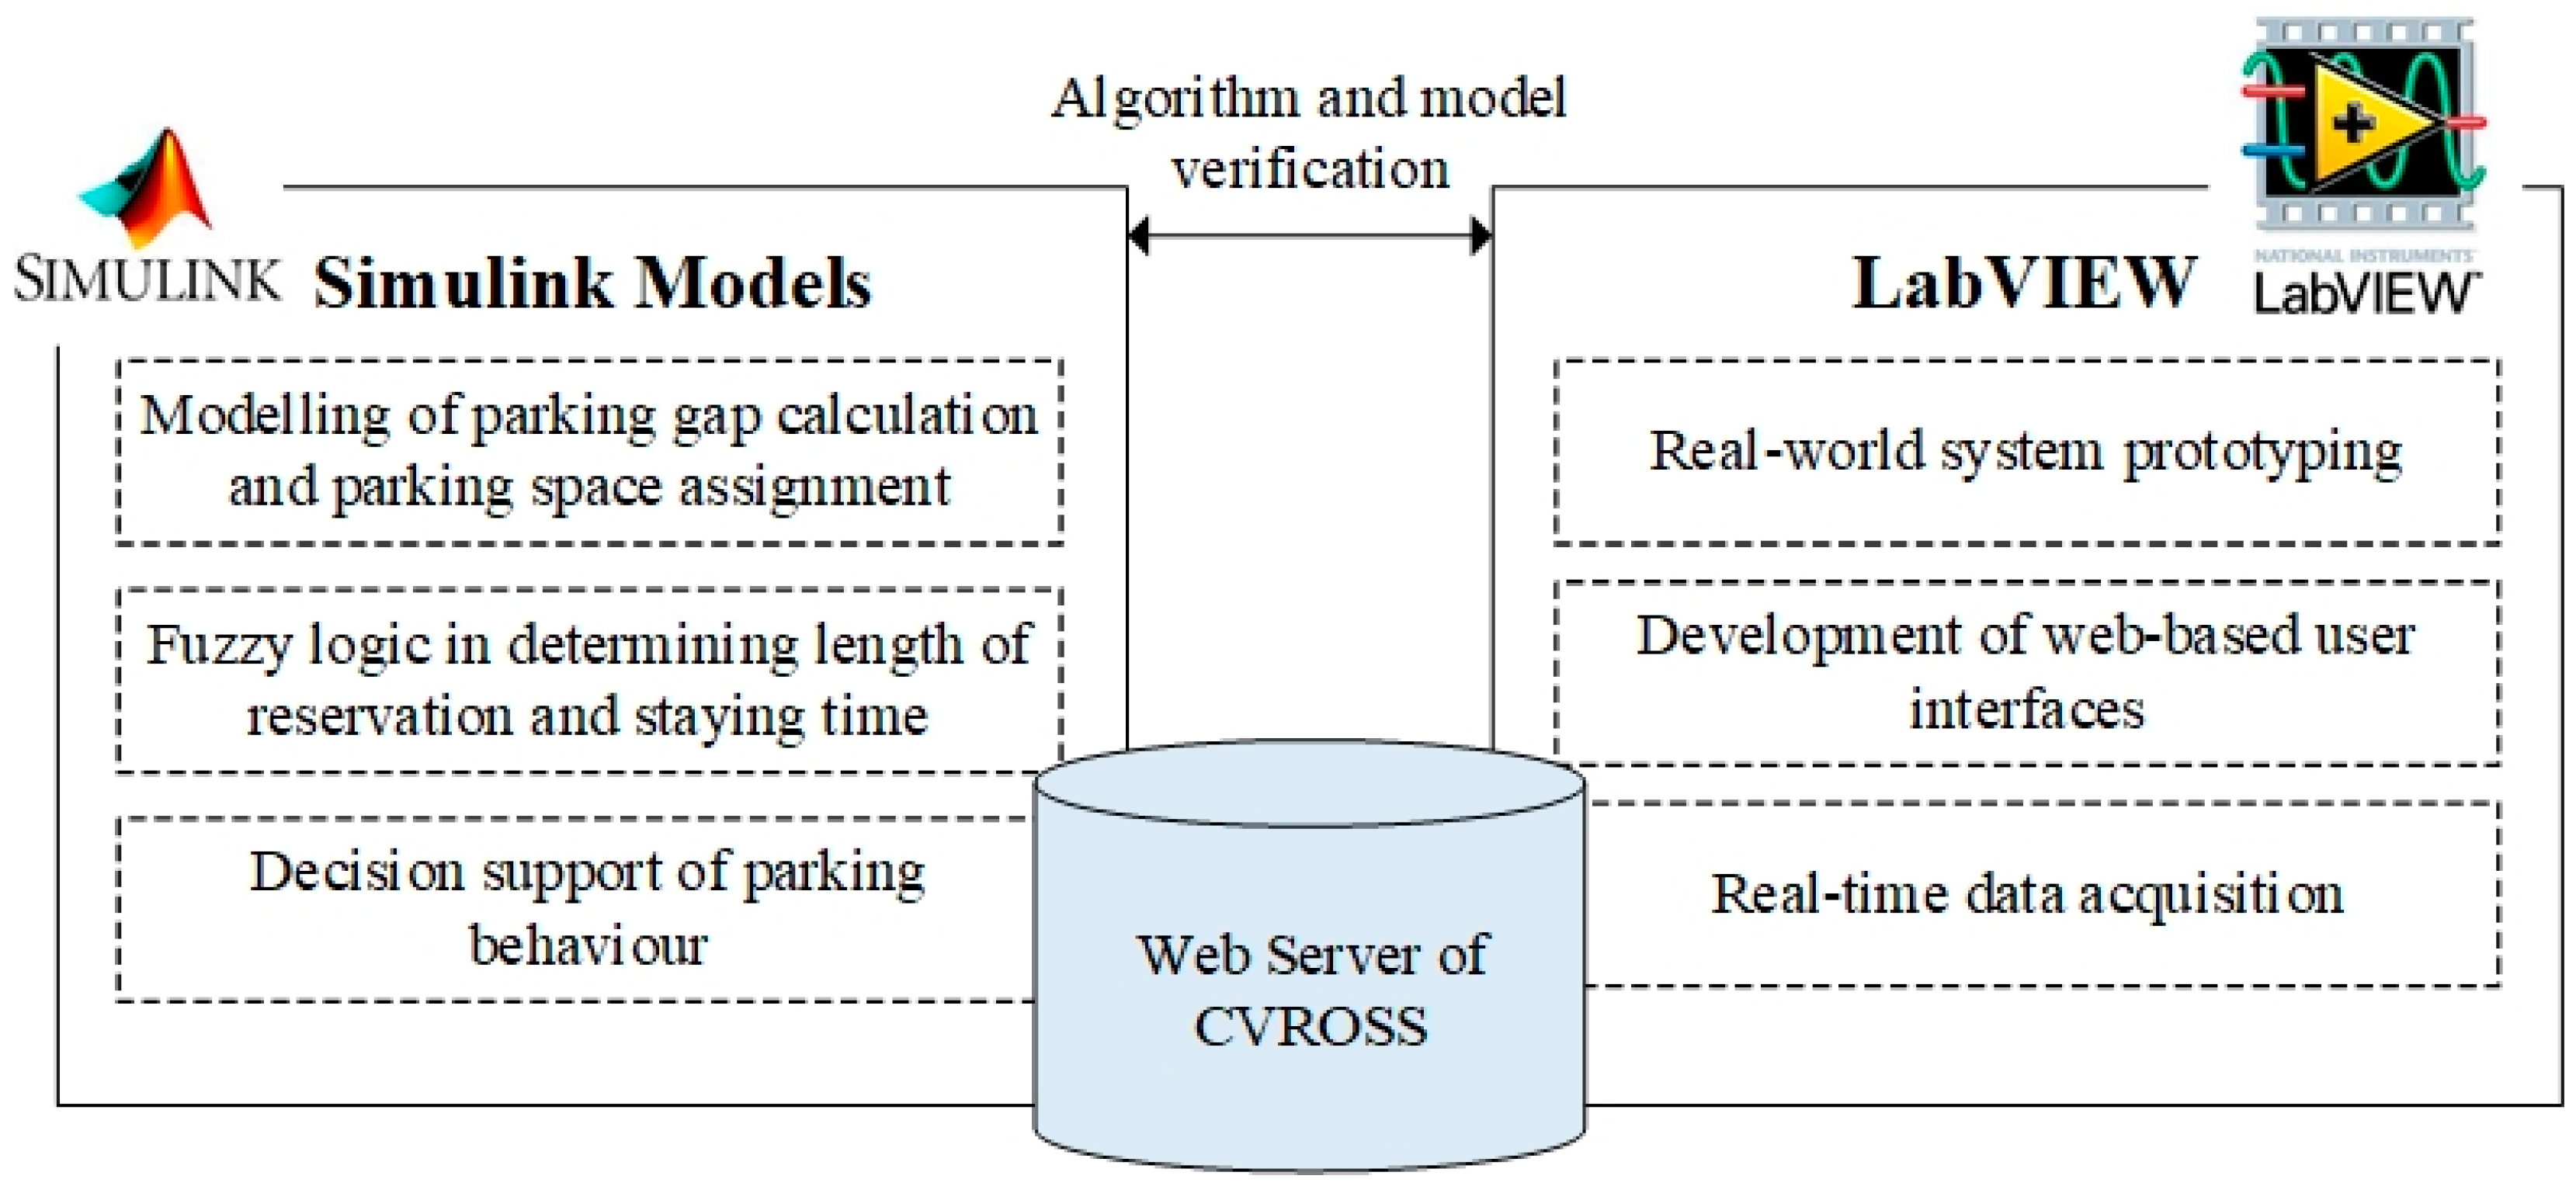
3. Design of a Computer Vision-Based Roadside Occupation Surveillance System (CVROSS)
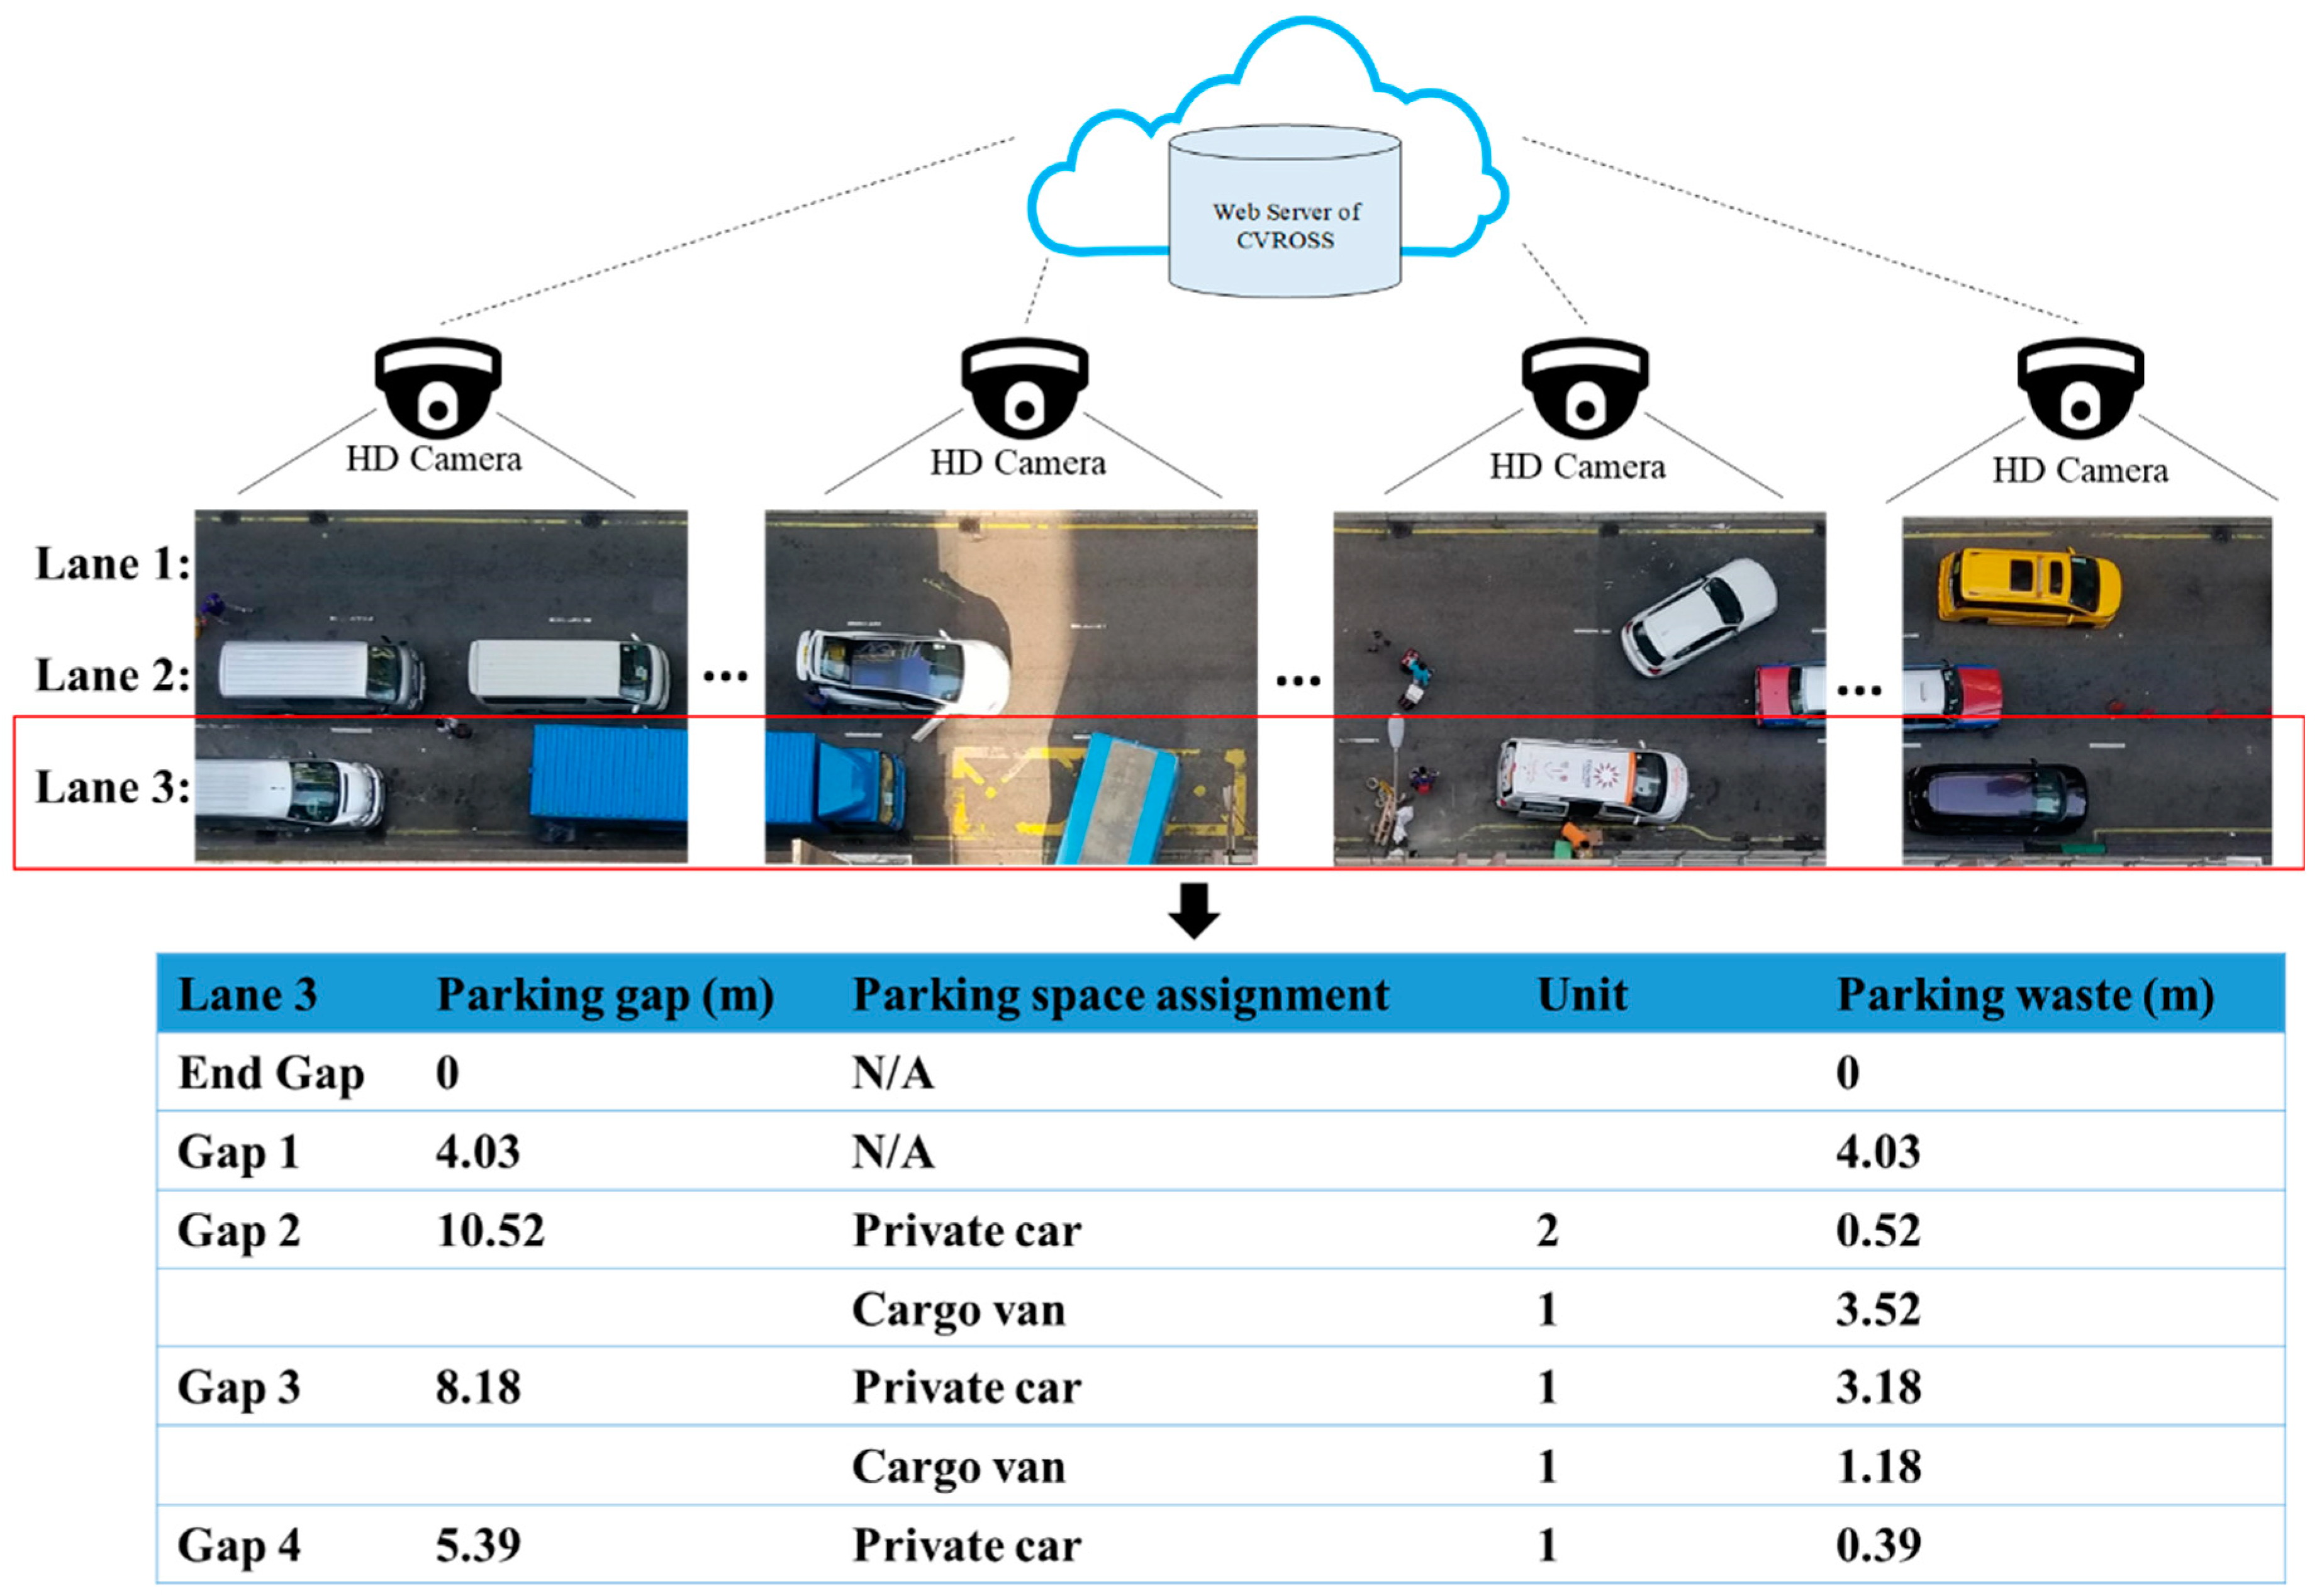
3.1. Roadside Surveillance Technology Using the IoT
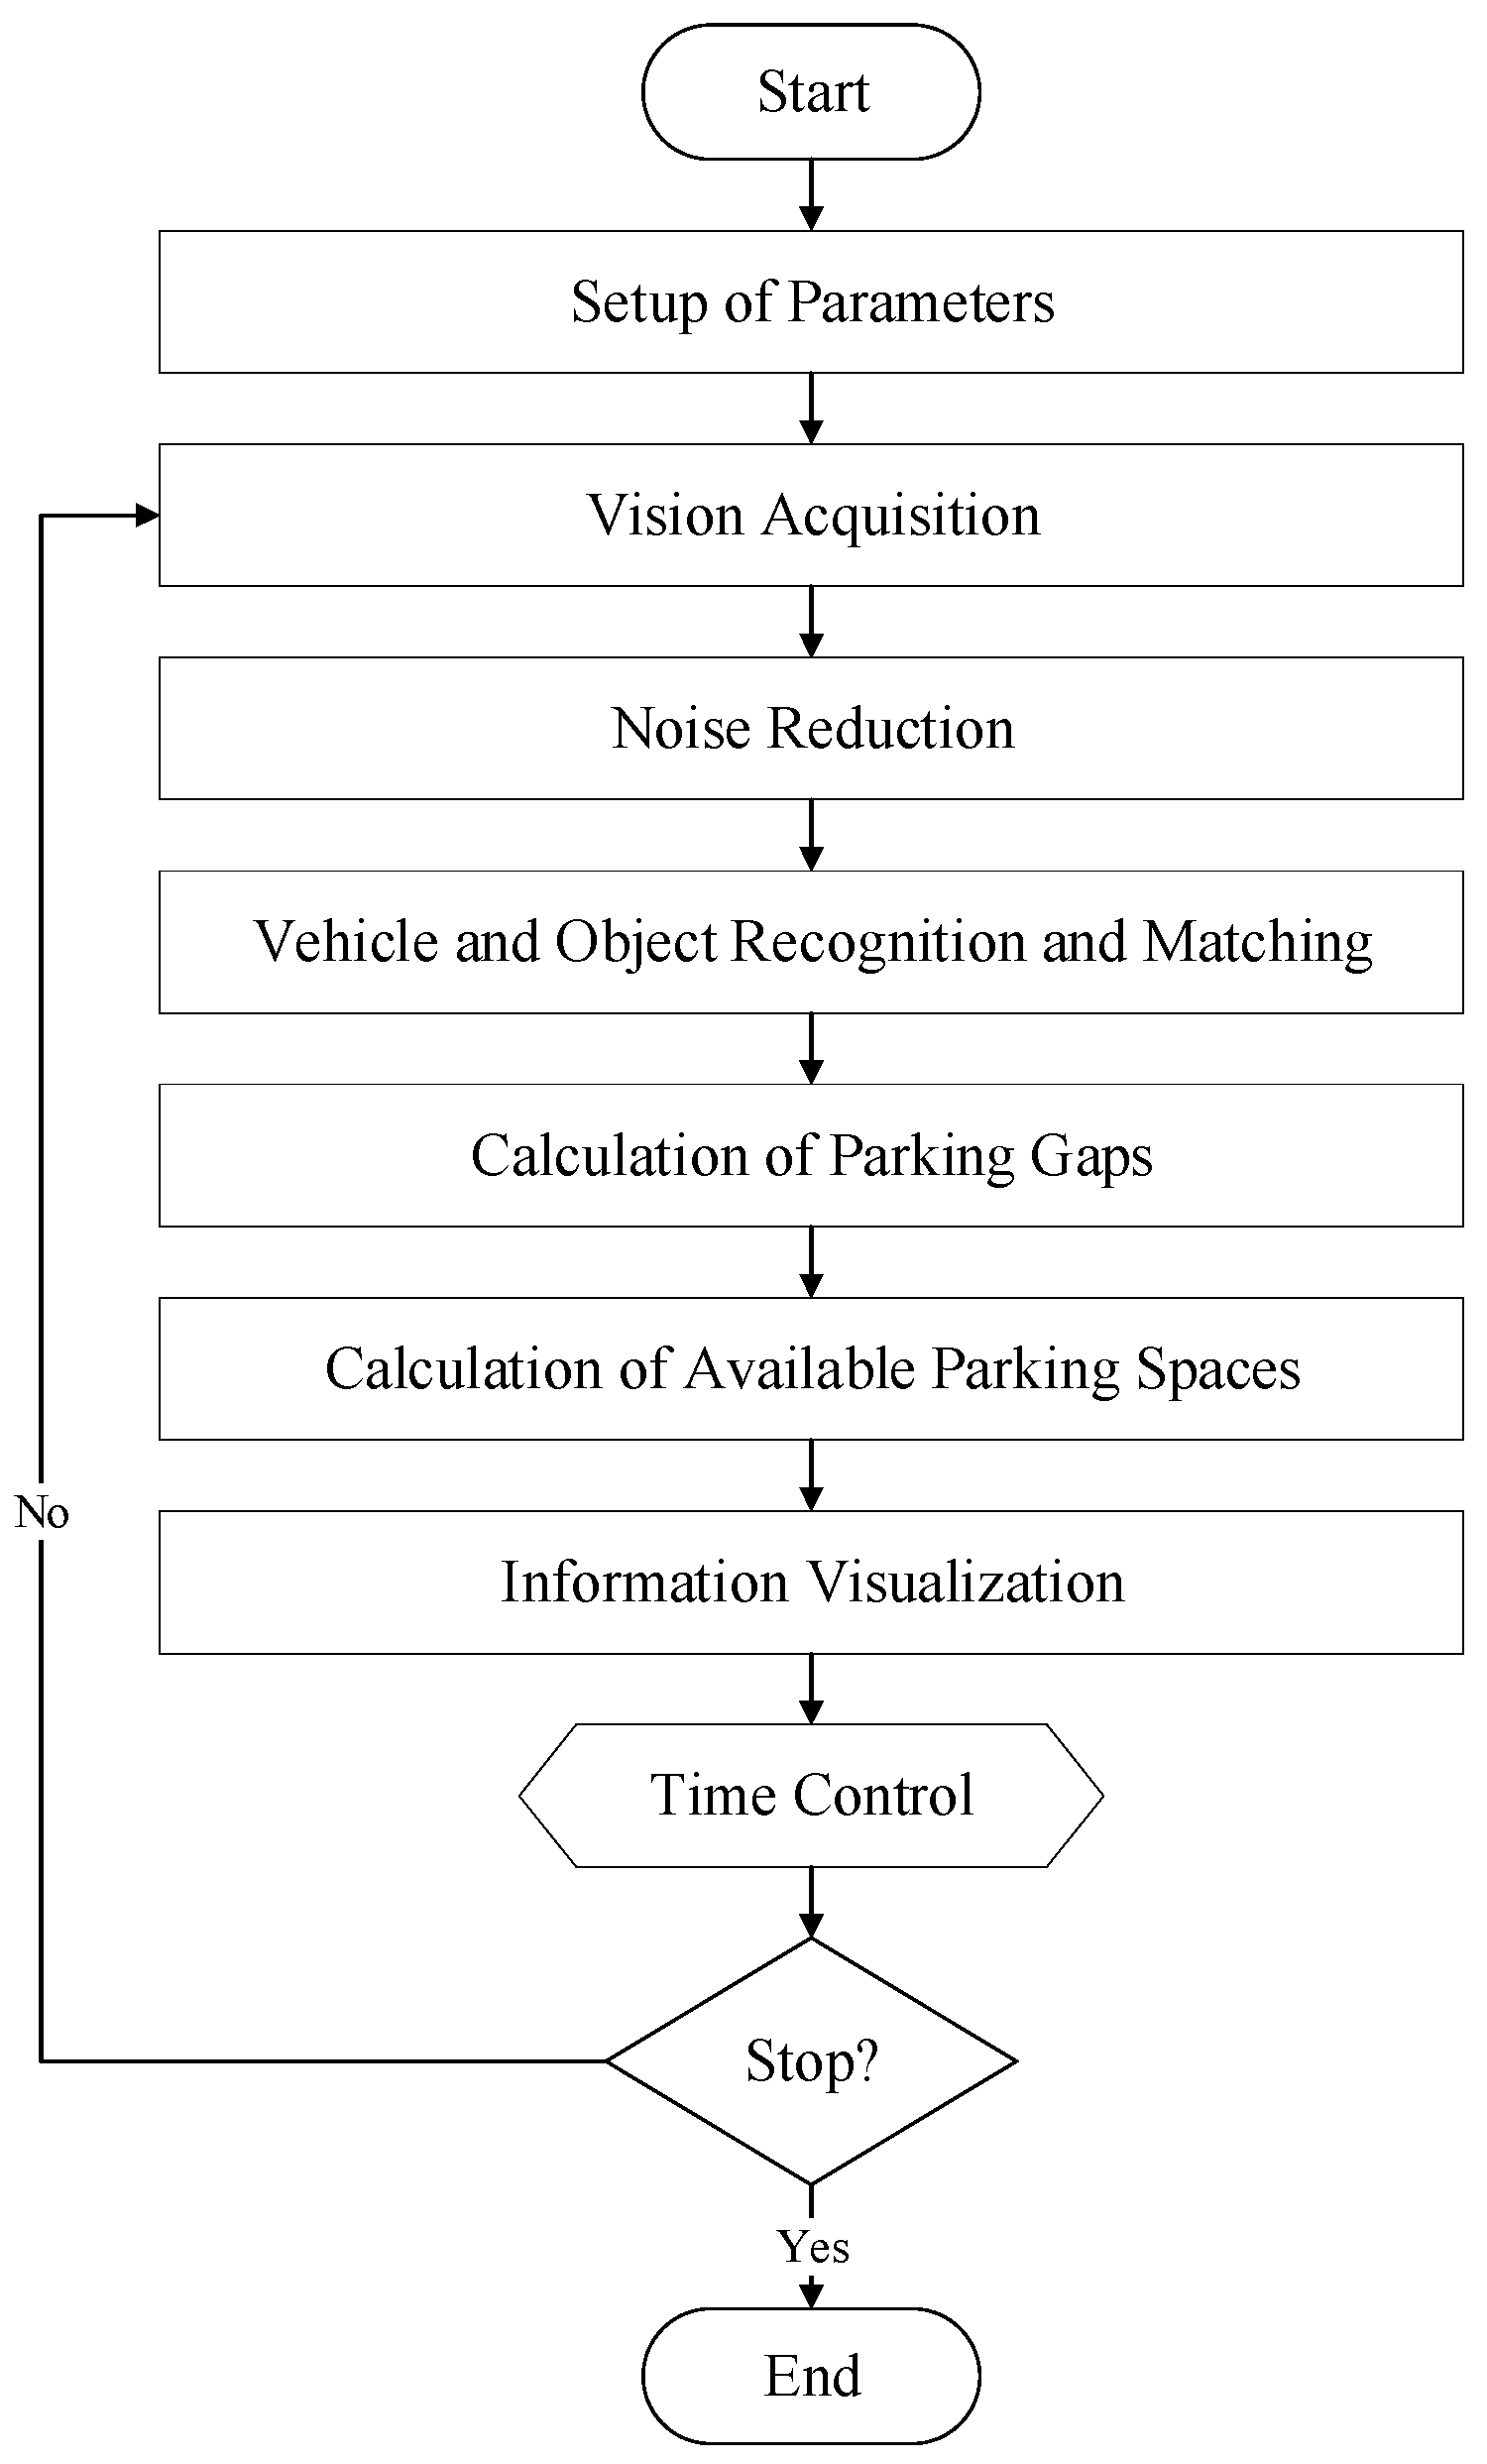
3.2. Data Preprocessing in the CVROSS
- 640 × 480 pixels for the entire coverage of the vision device
- 11 m of regulated parking space per truck
- 7 m of regulated parking space per cargo van
- 5 m of regulated parking space per private car
- 6.75 m for the minimum width of traffic lanes
- templates of all possible vehicles and objects
- a confidence score, which indicates the confidence of the disparity for each pixel for each template (image scores return values between 0 and 1000, where 1000 indicates the highest confidence).
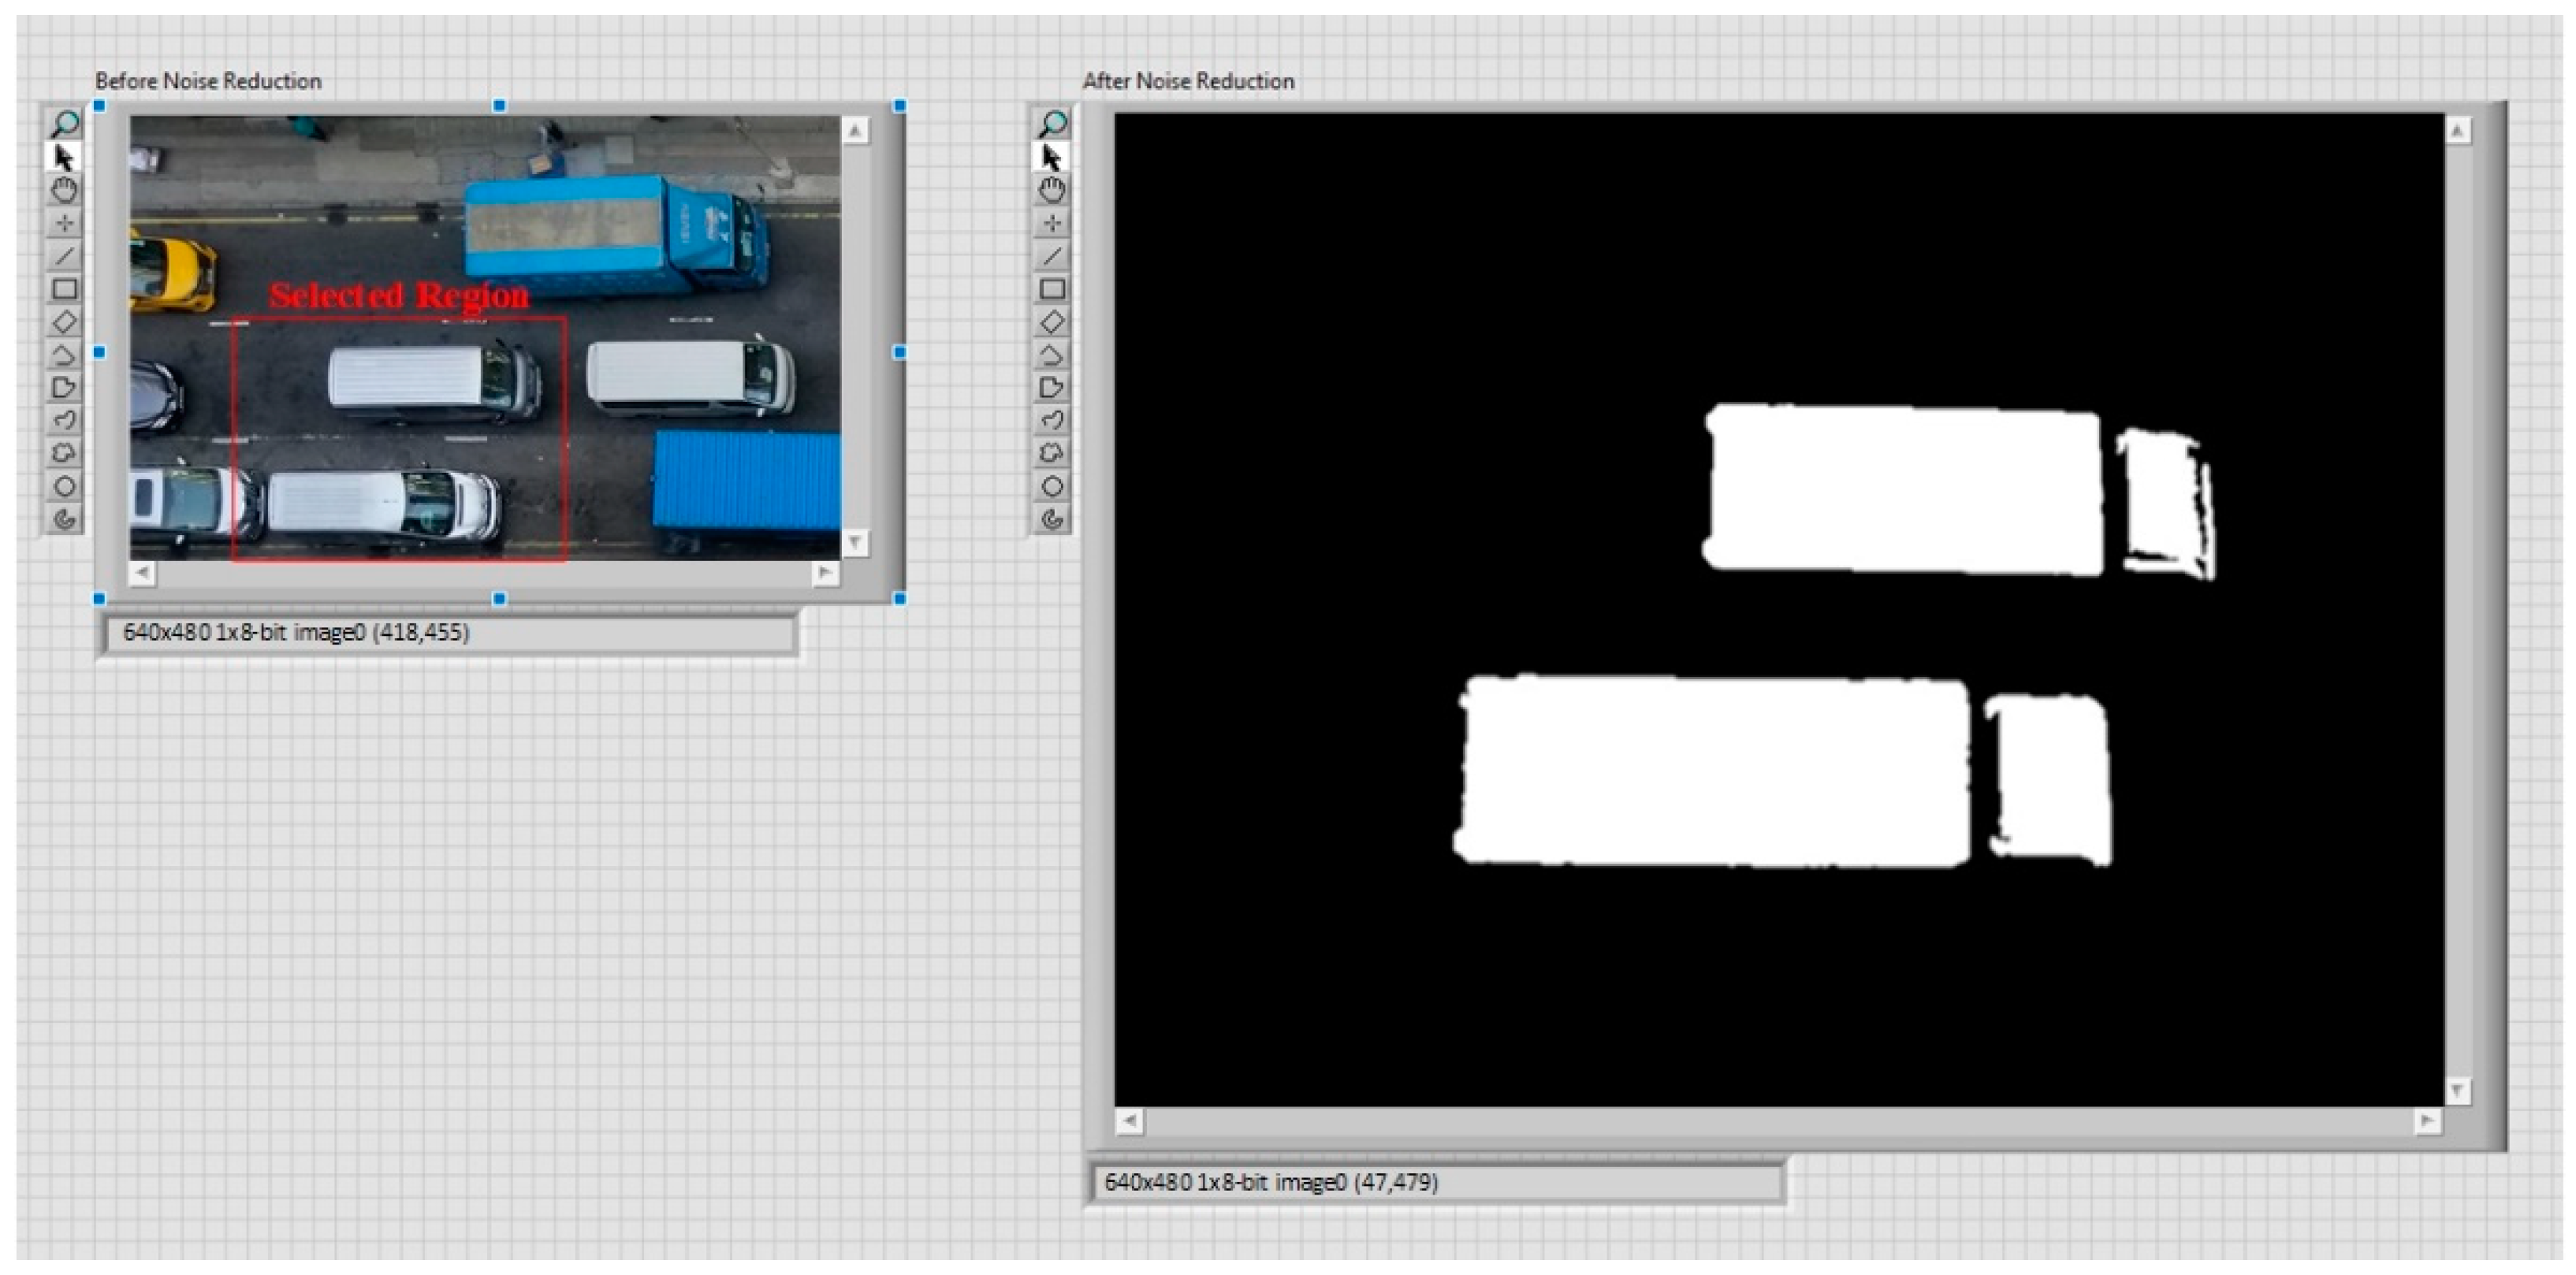
3.2.1. Noise Reduction
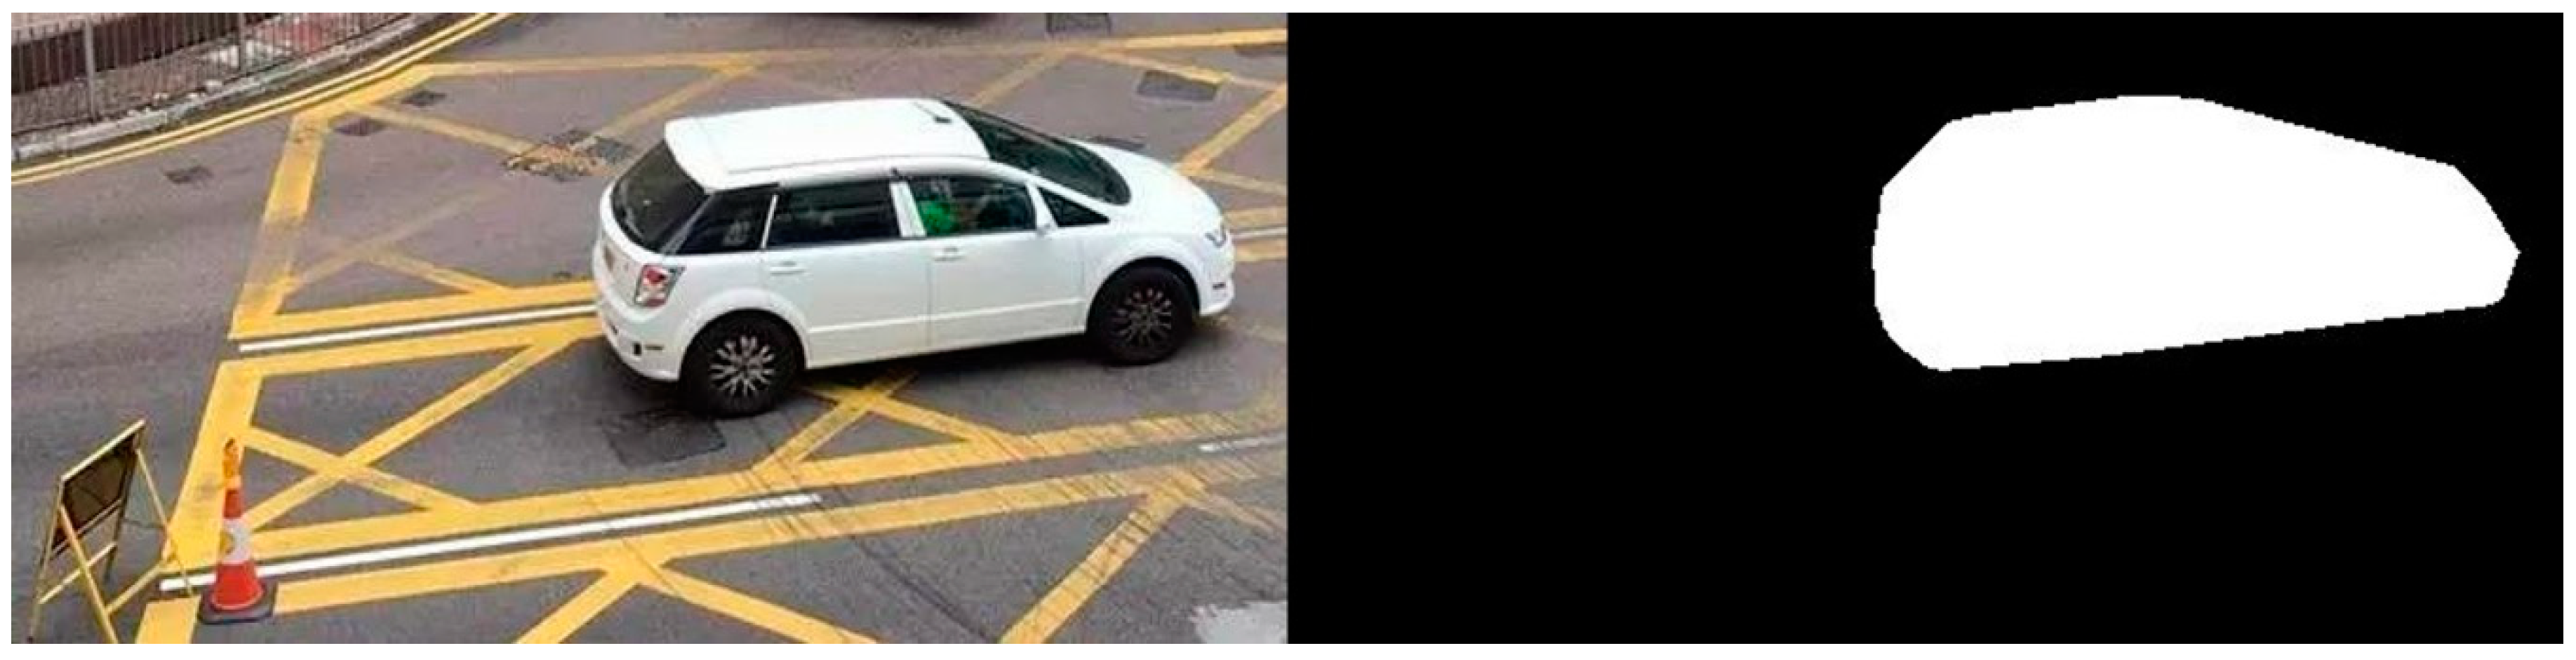
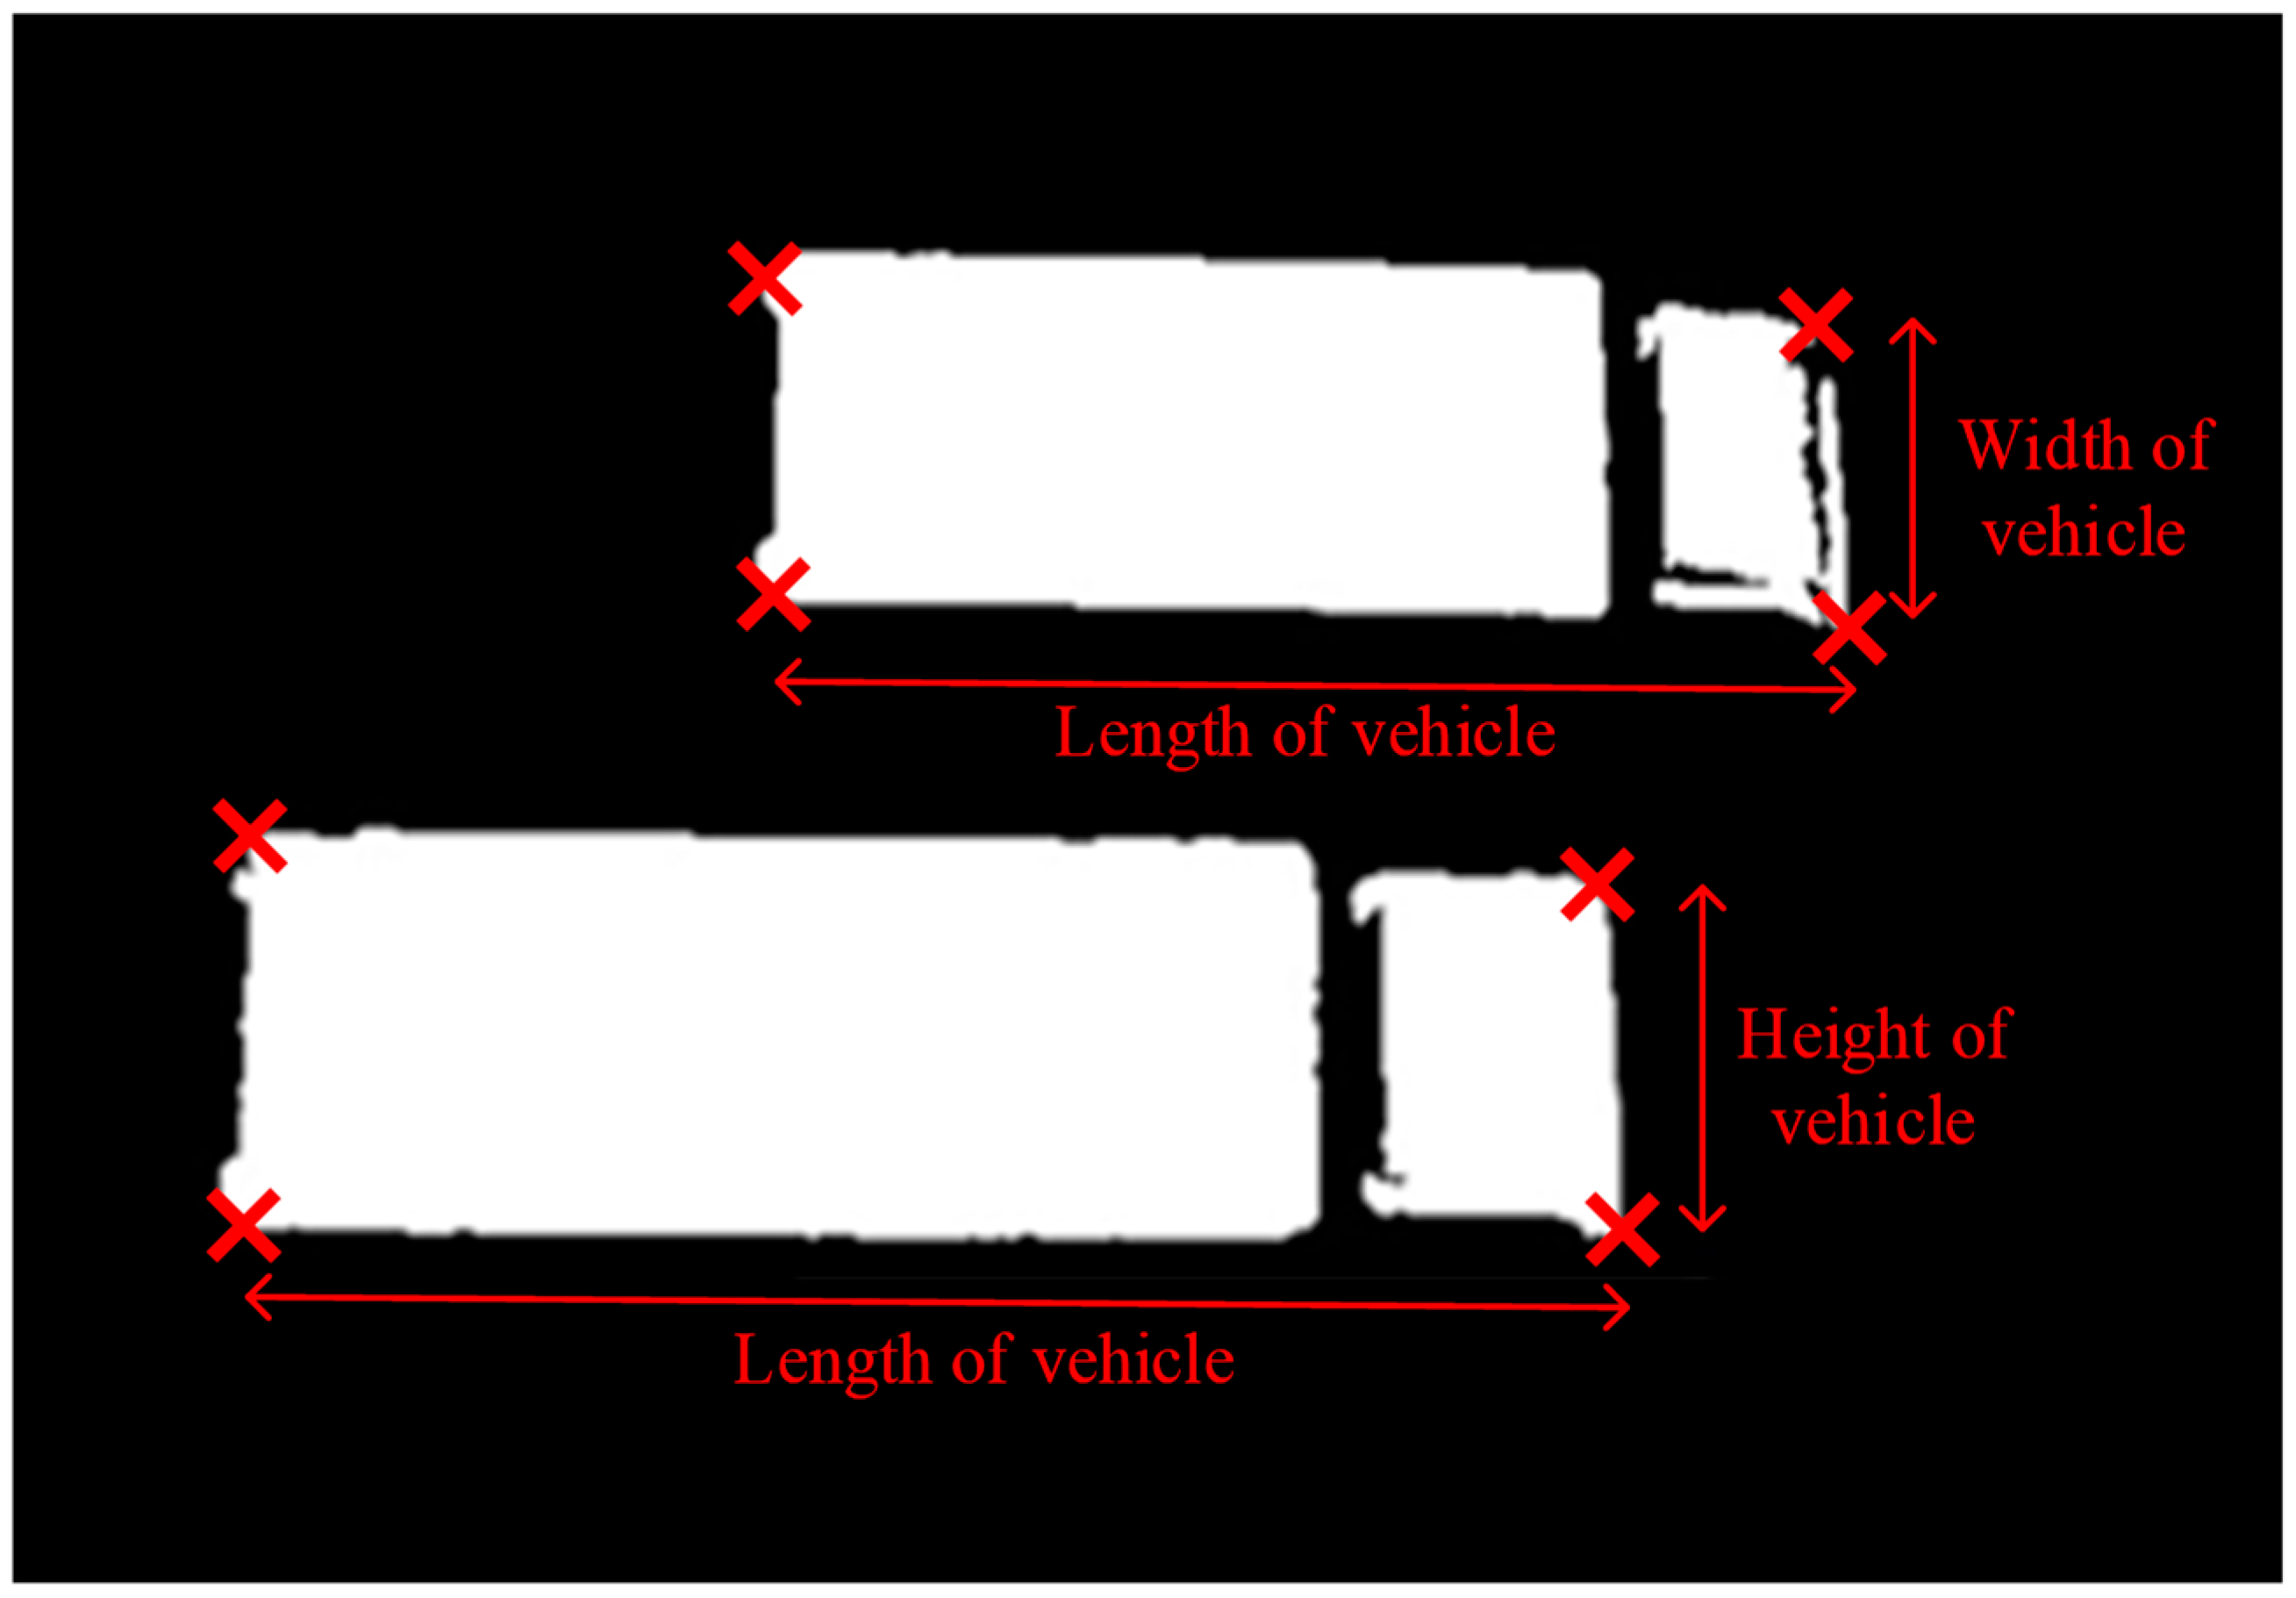
3.2.2. Vehicle and Object Recognition and Matching
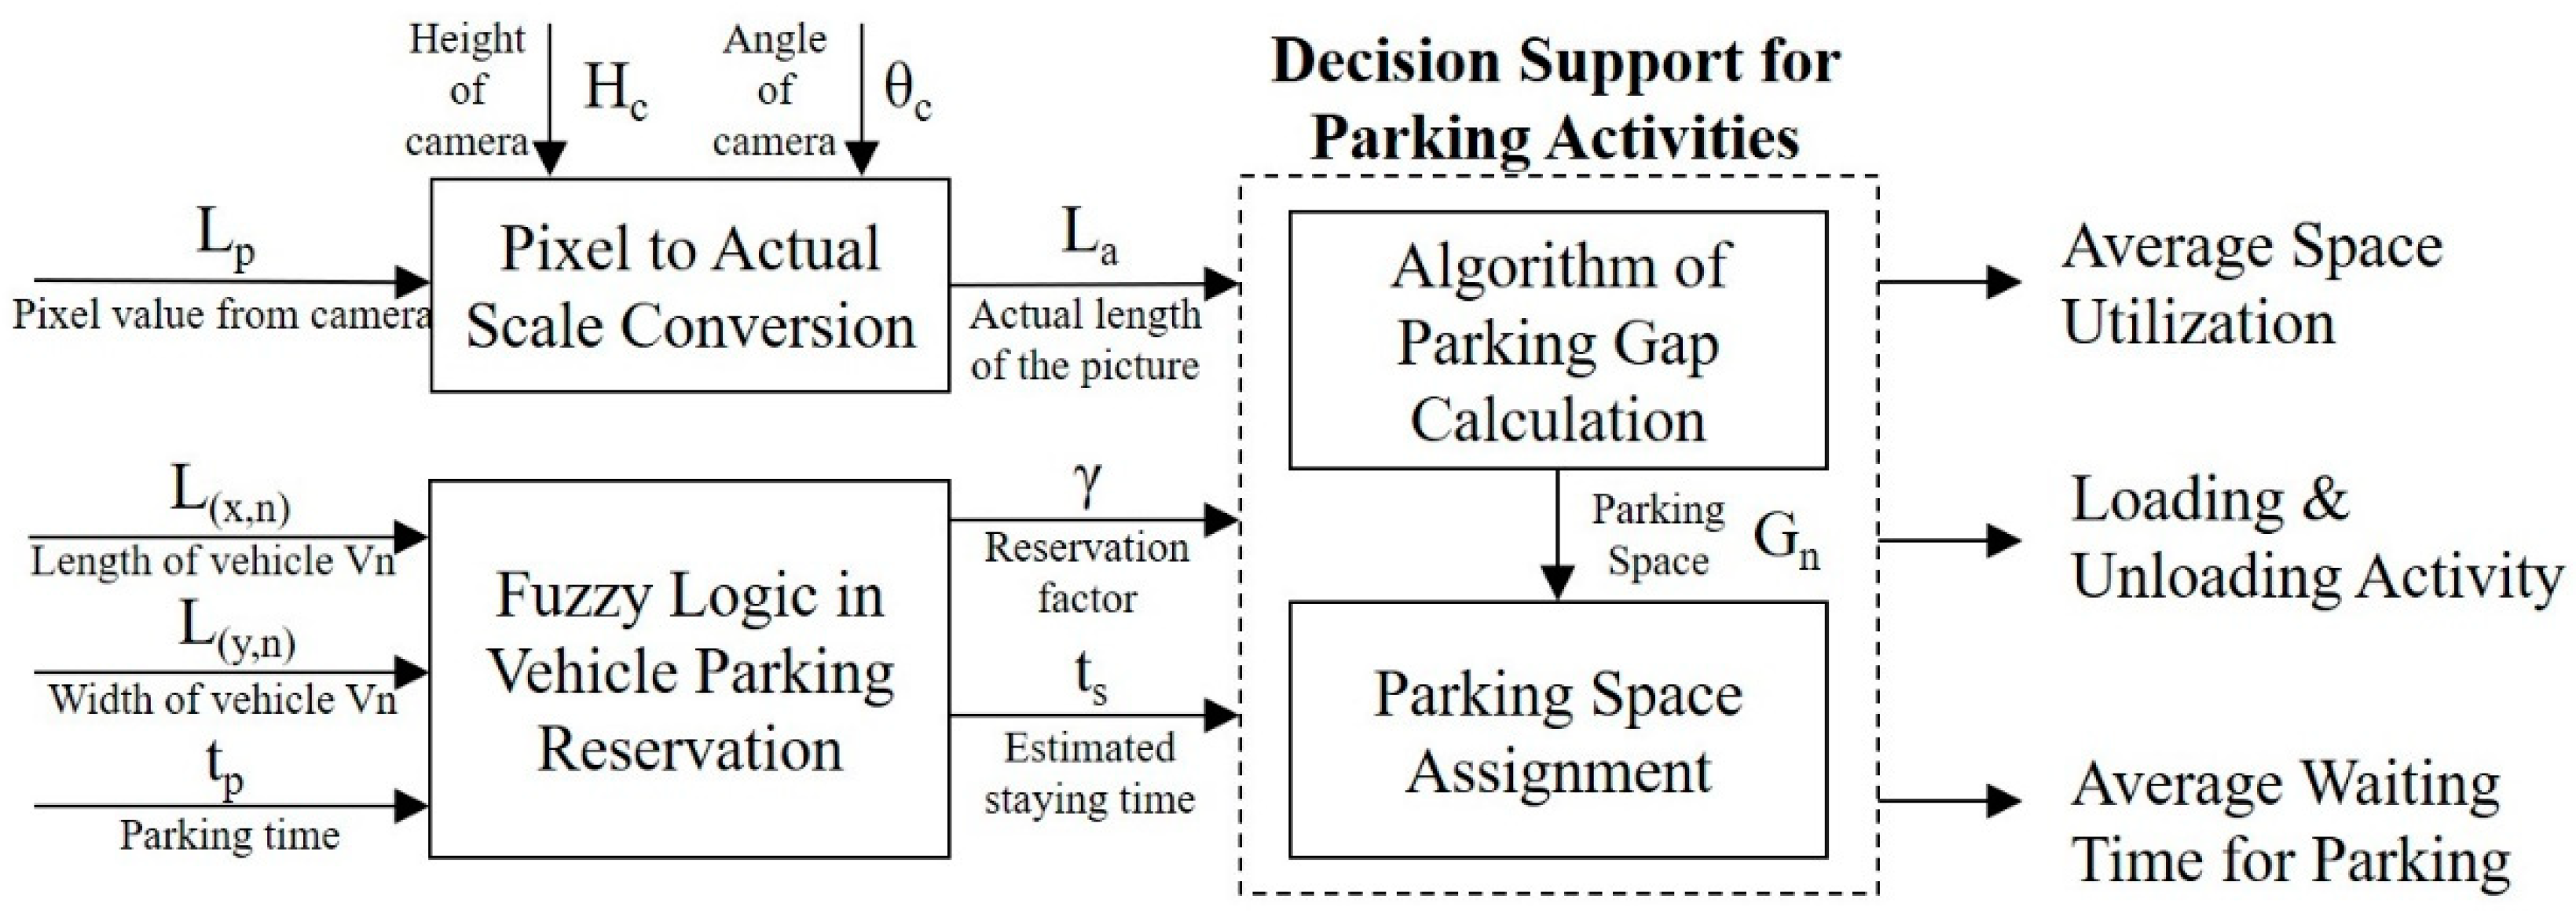
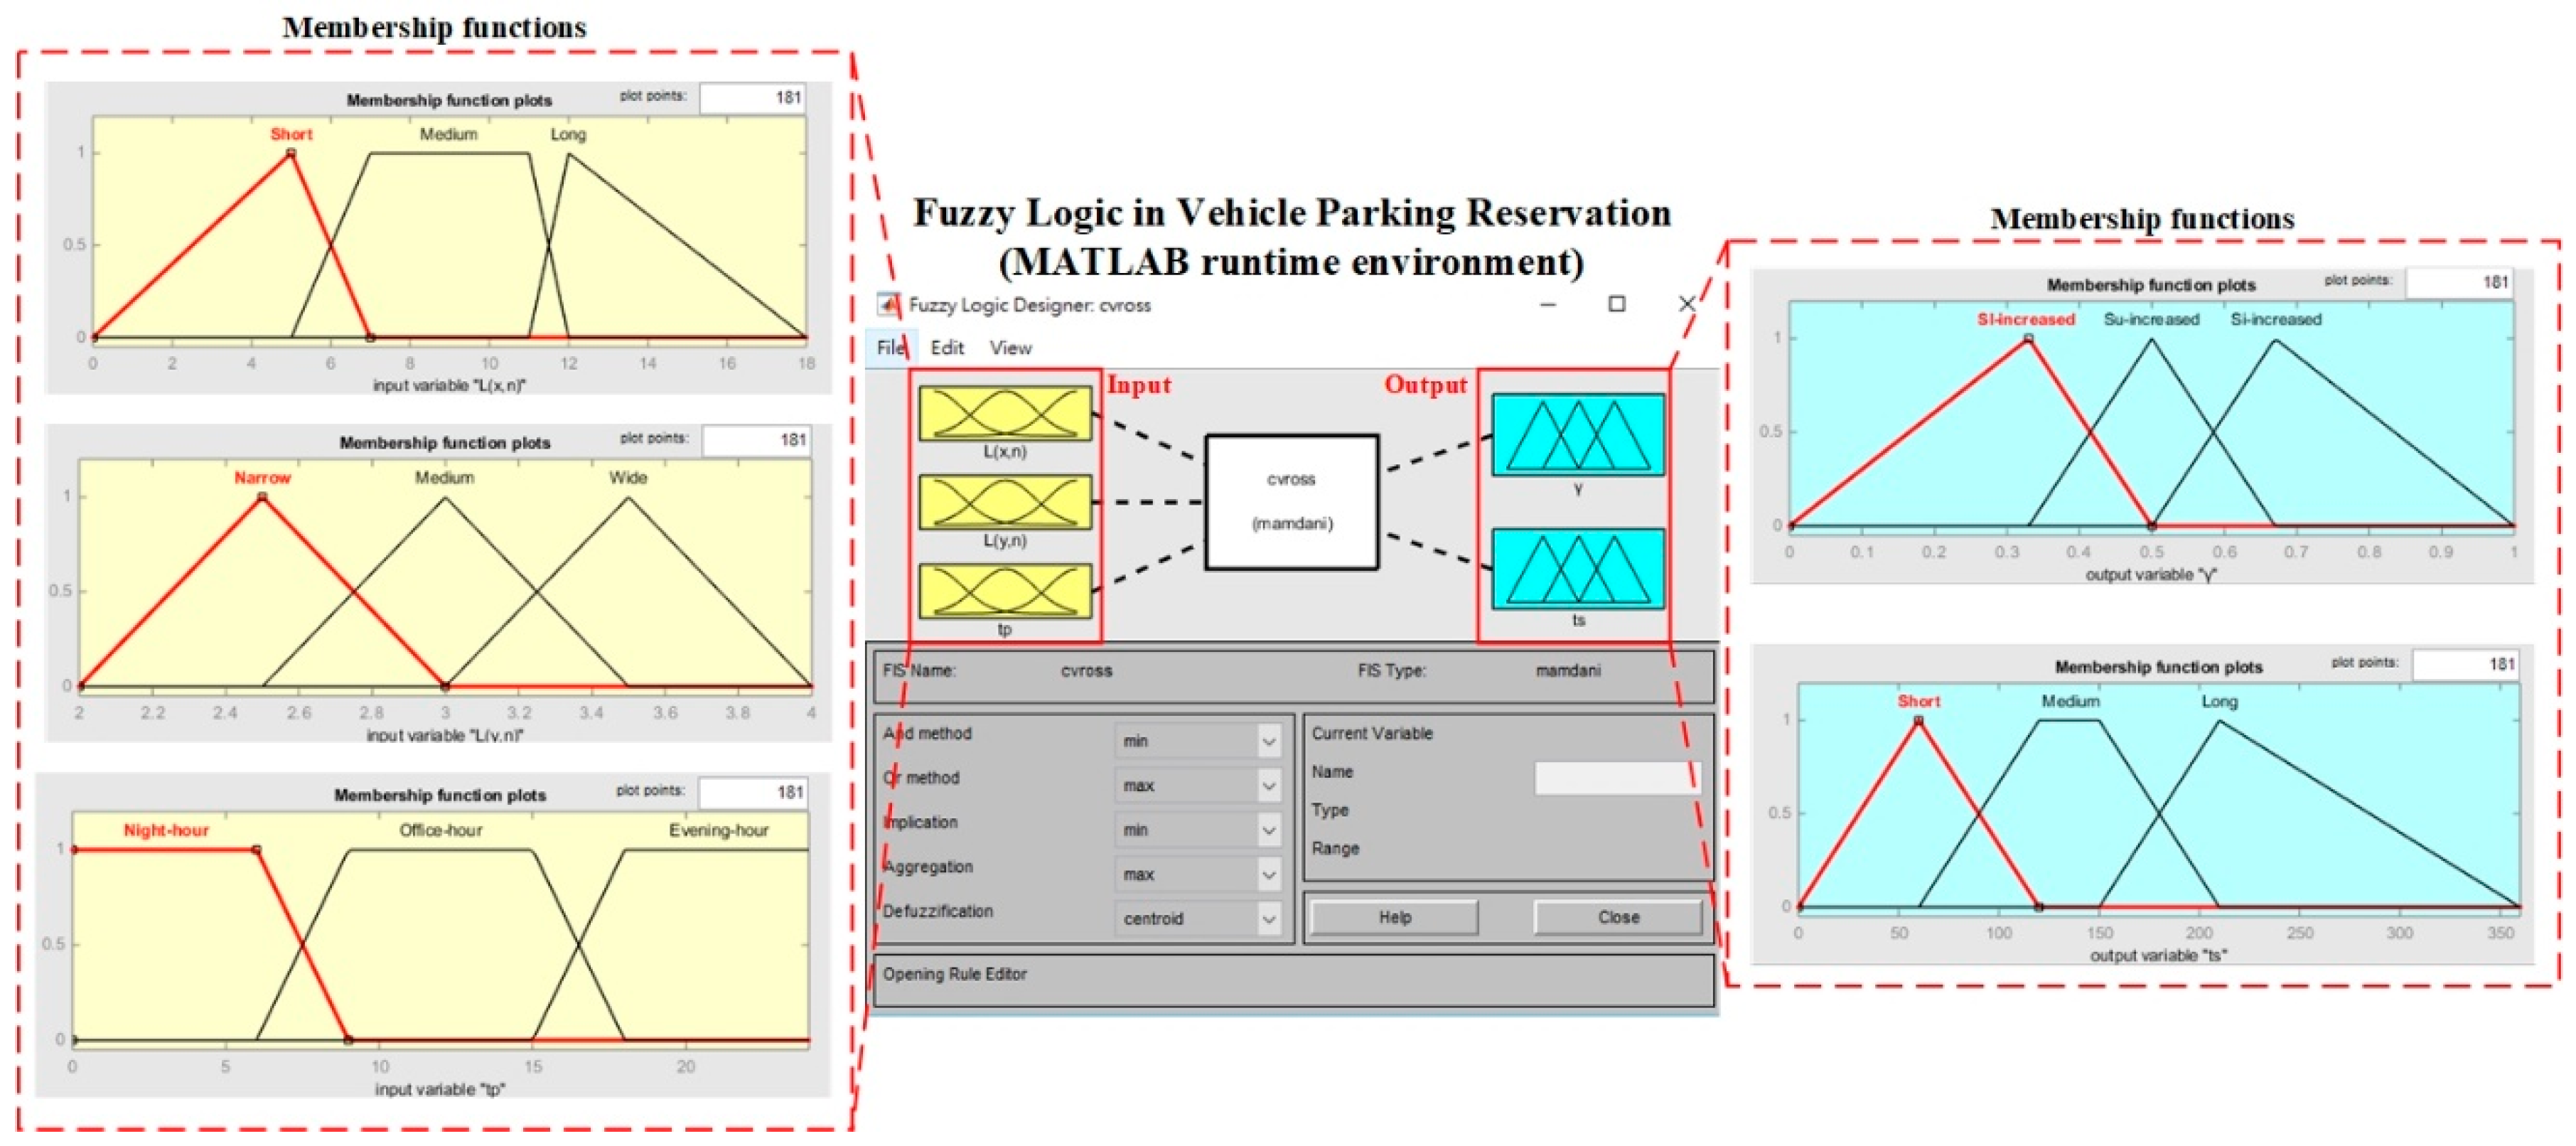
3.3. Decision Support in Roadside Parking
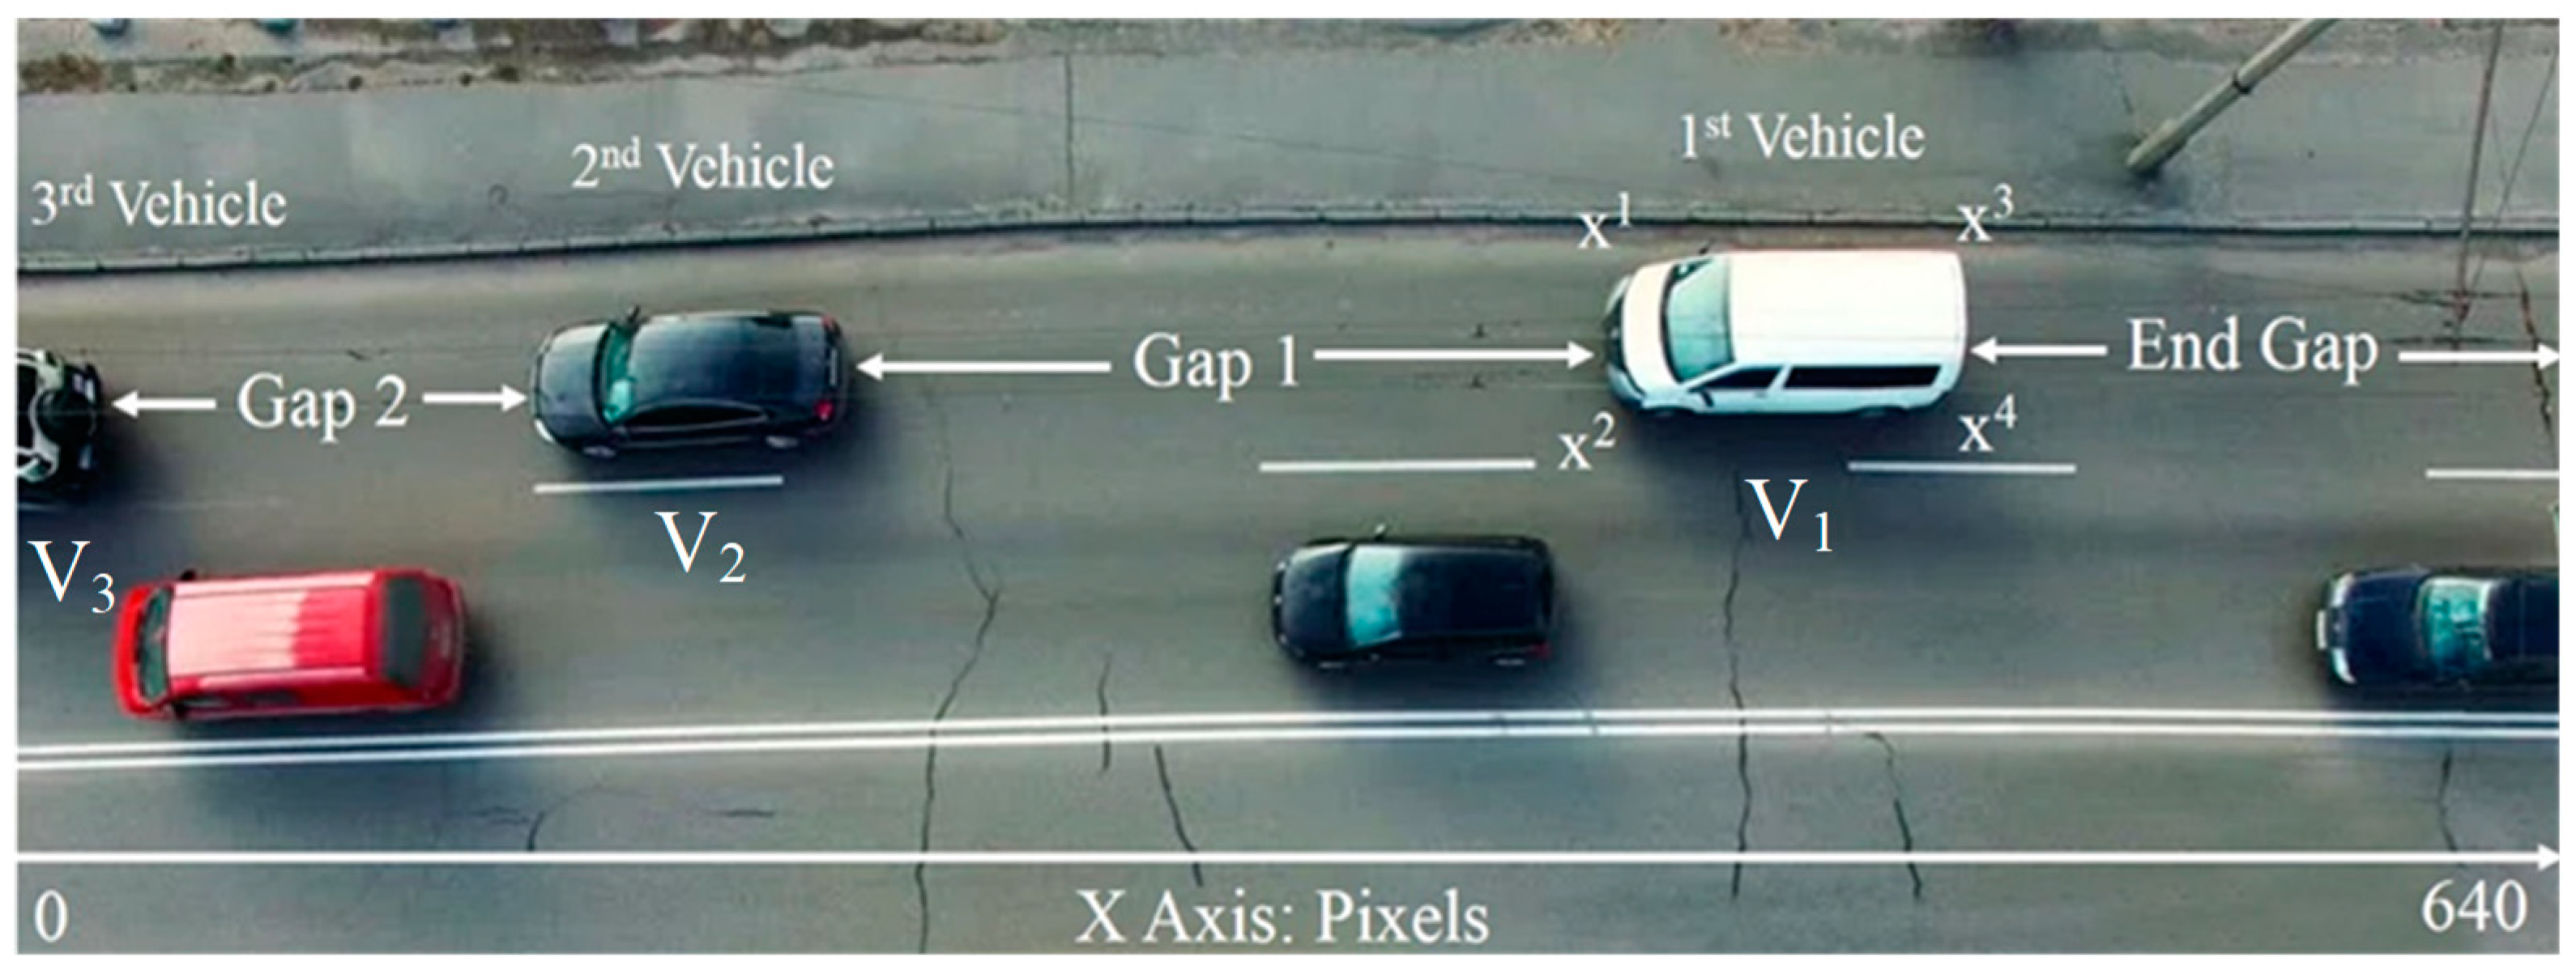
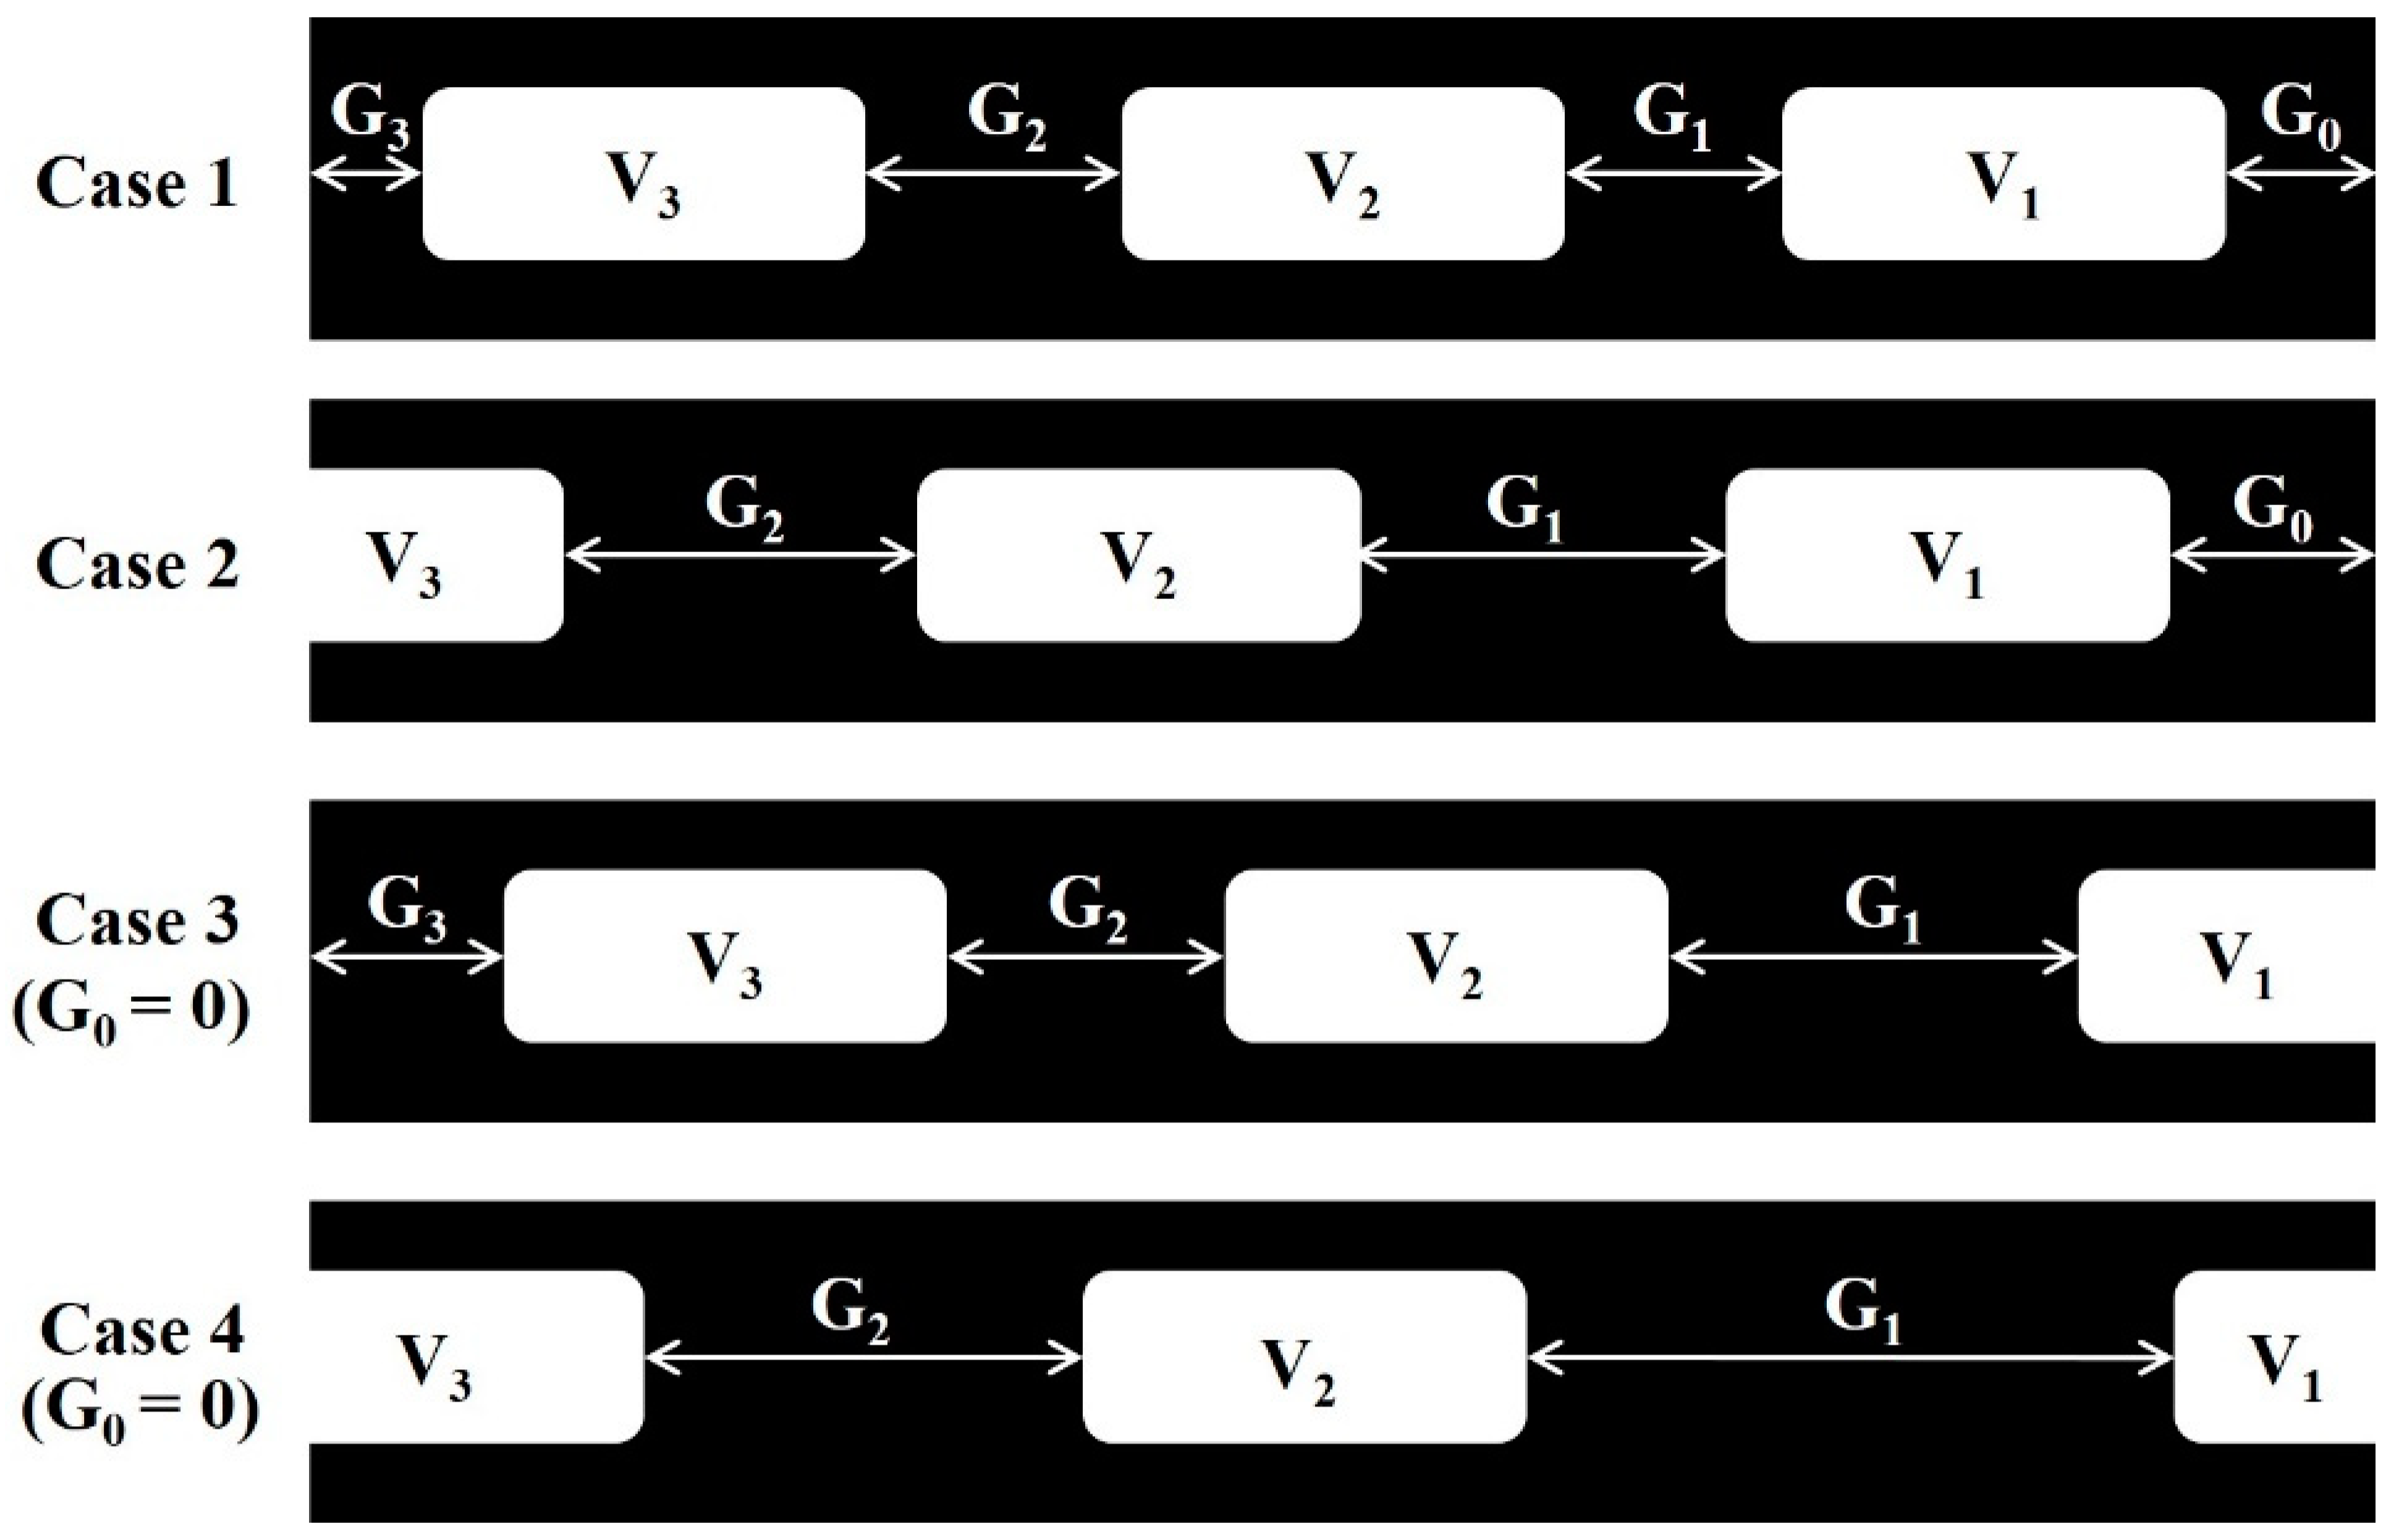
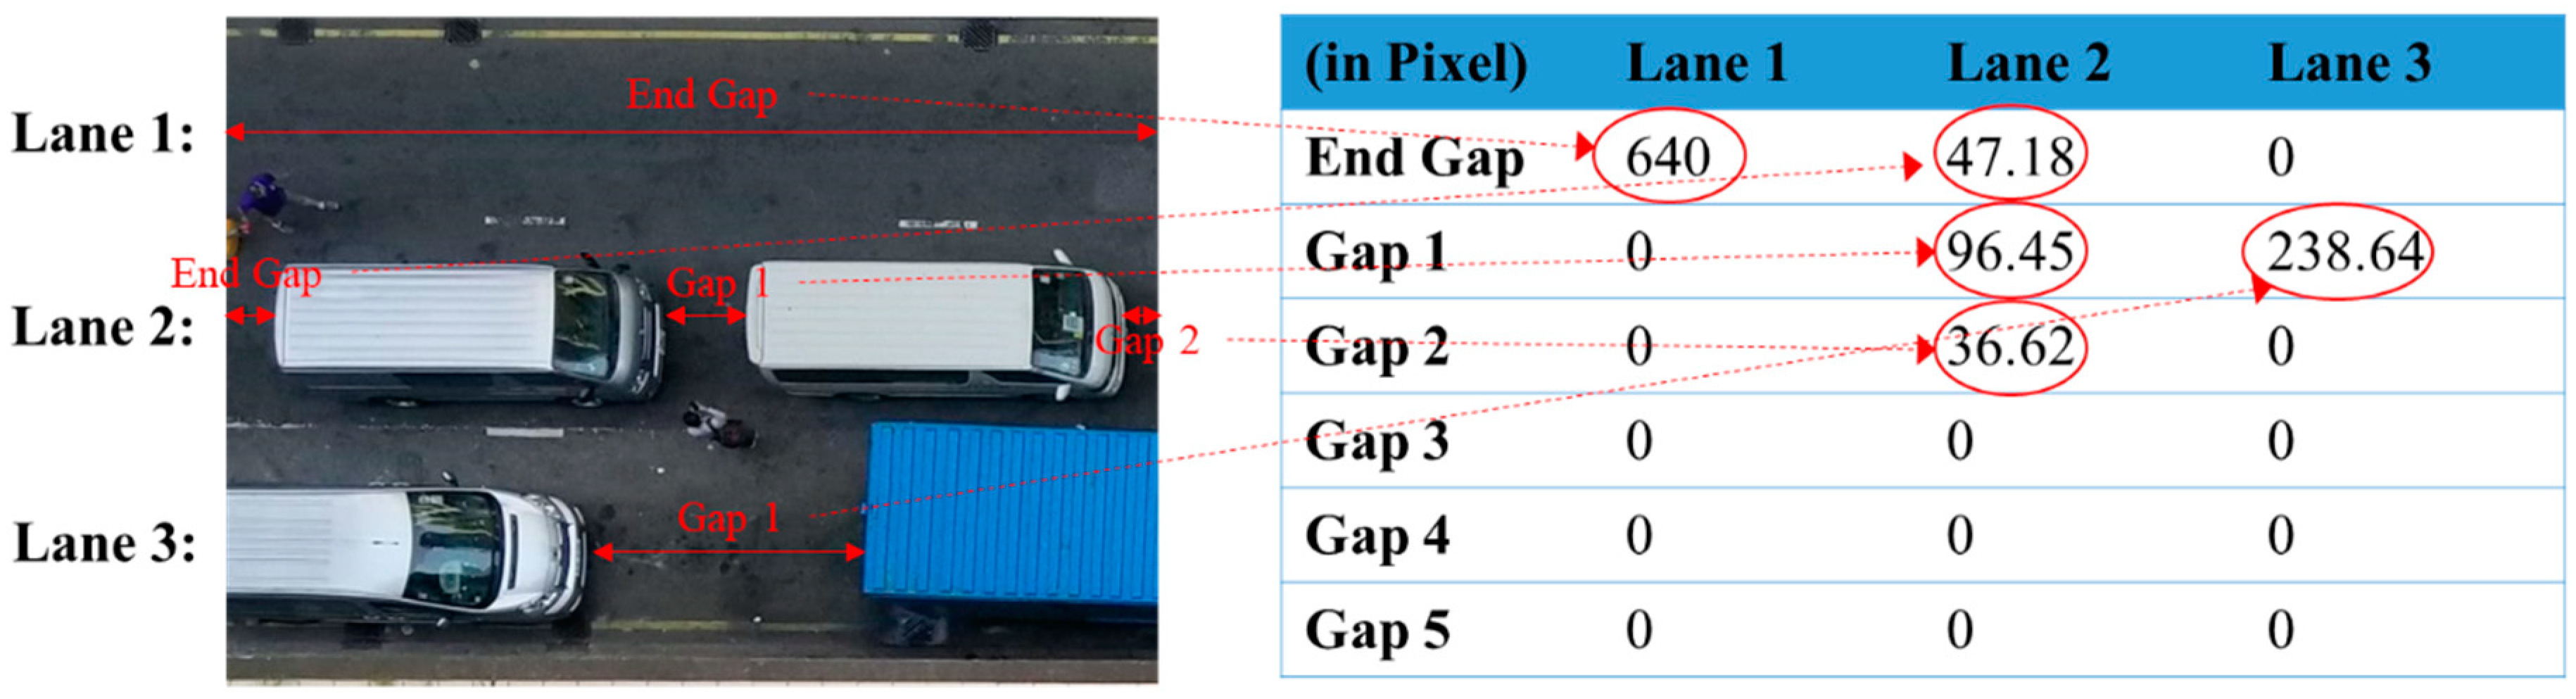
3.3.1. Evaluation of Parking Gaps
3.3.2. Parking Spaces and Decision Support Functionalities
3.4. Evaluation of the Proposed System
4. Case Study
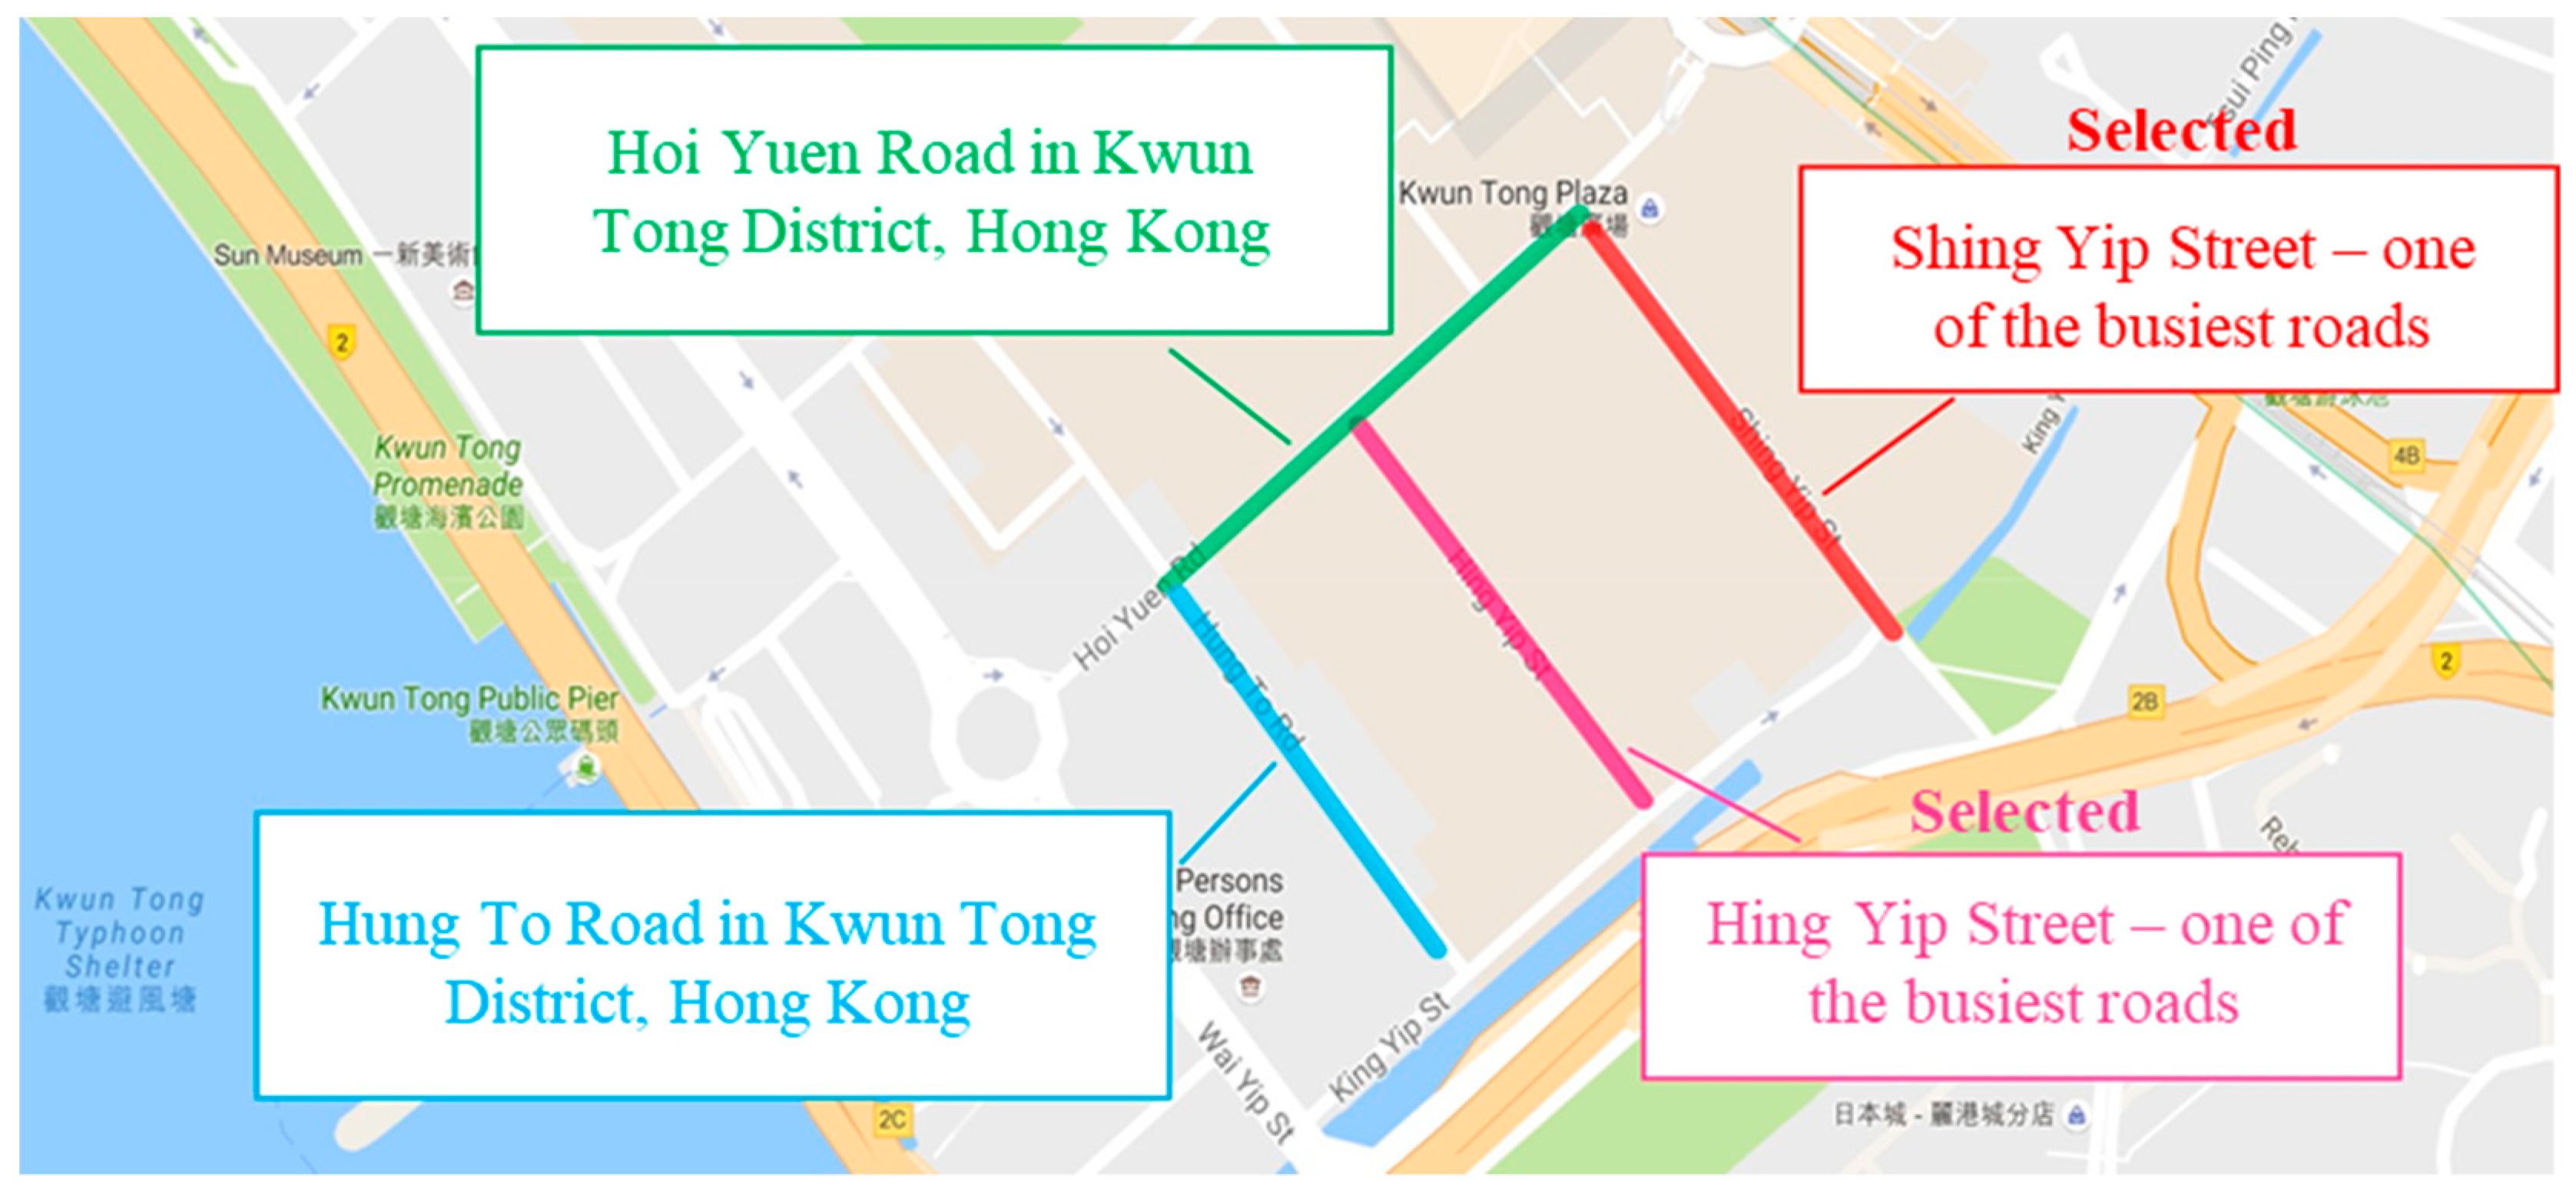
4.1. Site Selection
4.2. Deployment of the CVROSS
4.2.1. Noise Reduction
4.2.2. Vehicle Recognition
4.2.3. Calculation of Parking Gaps
4.2.4. Calculation of Available Parking Spaces
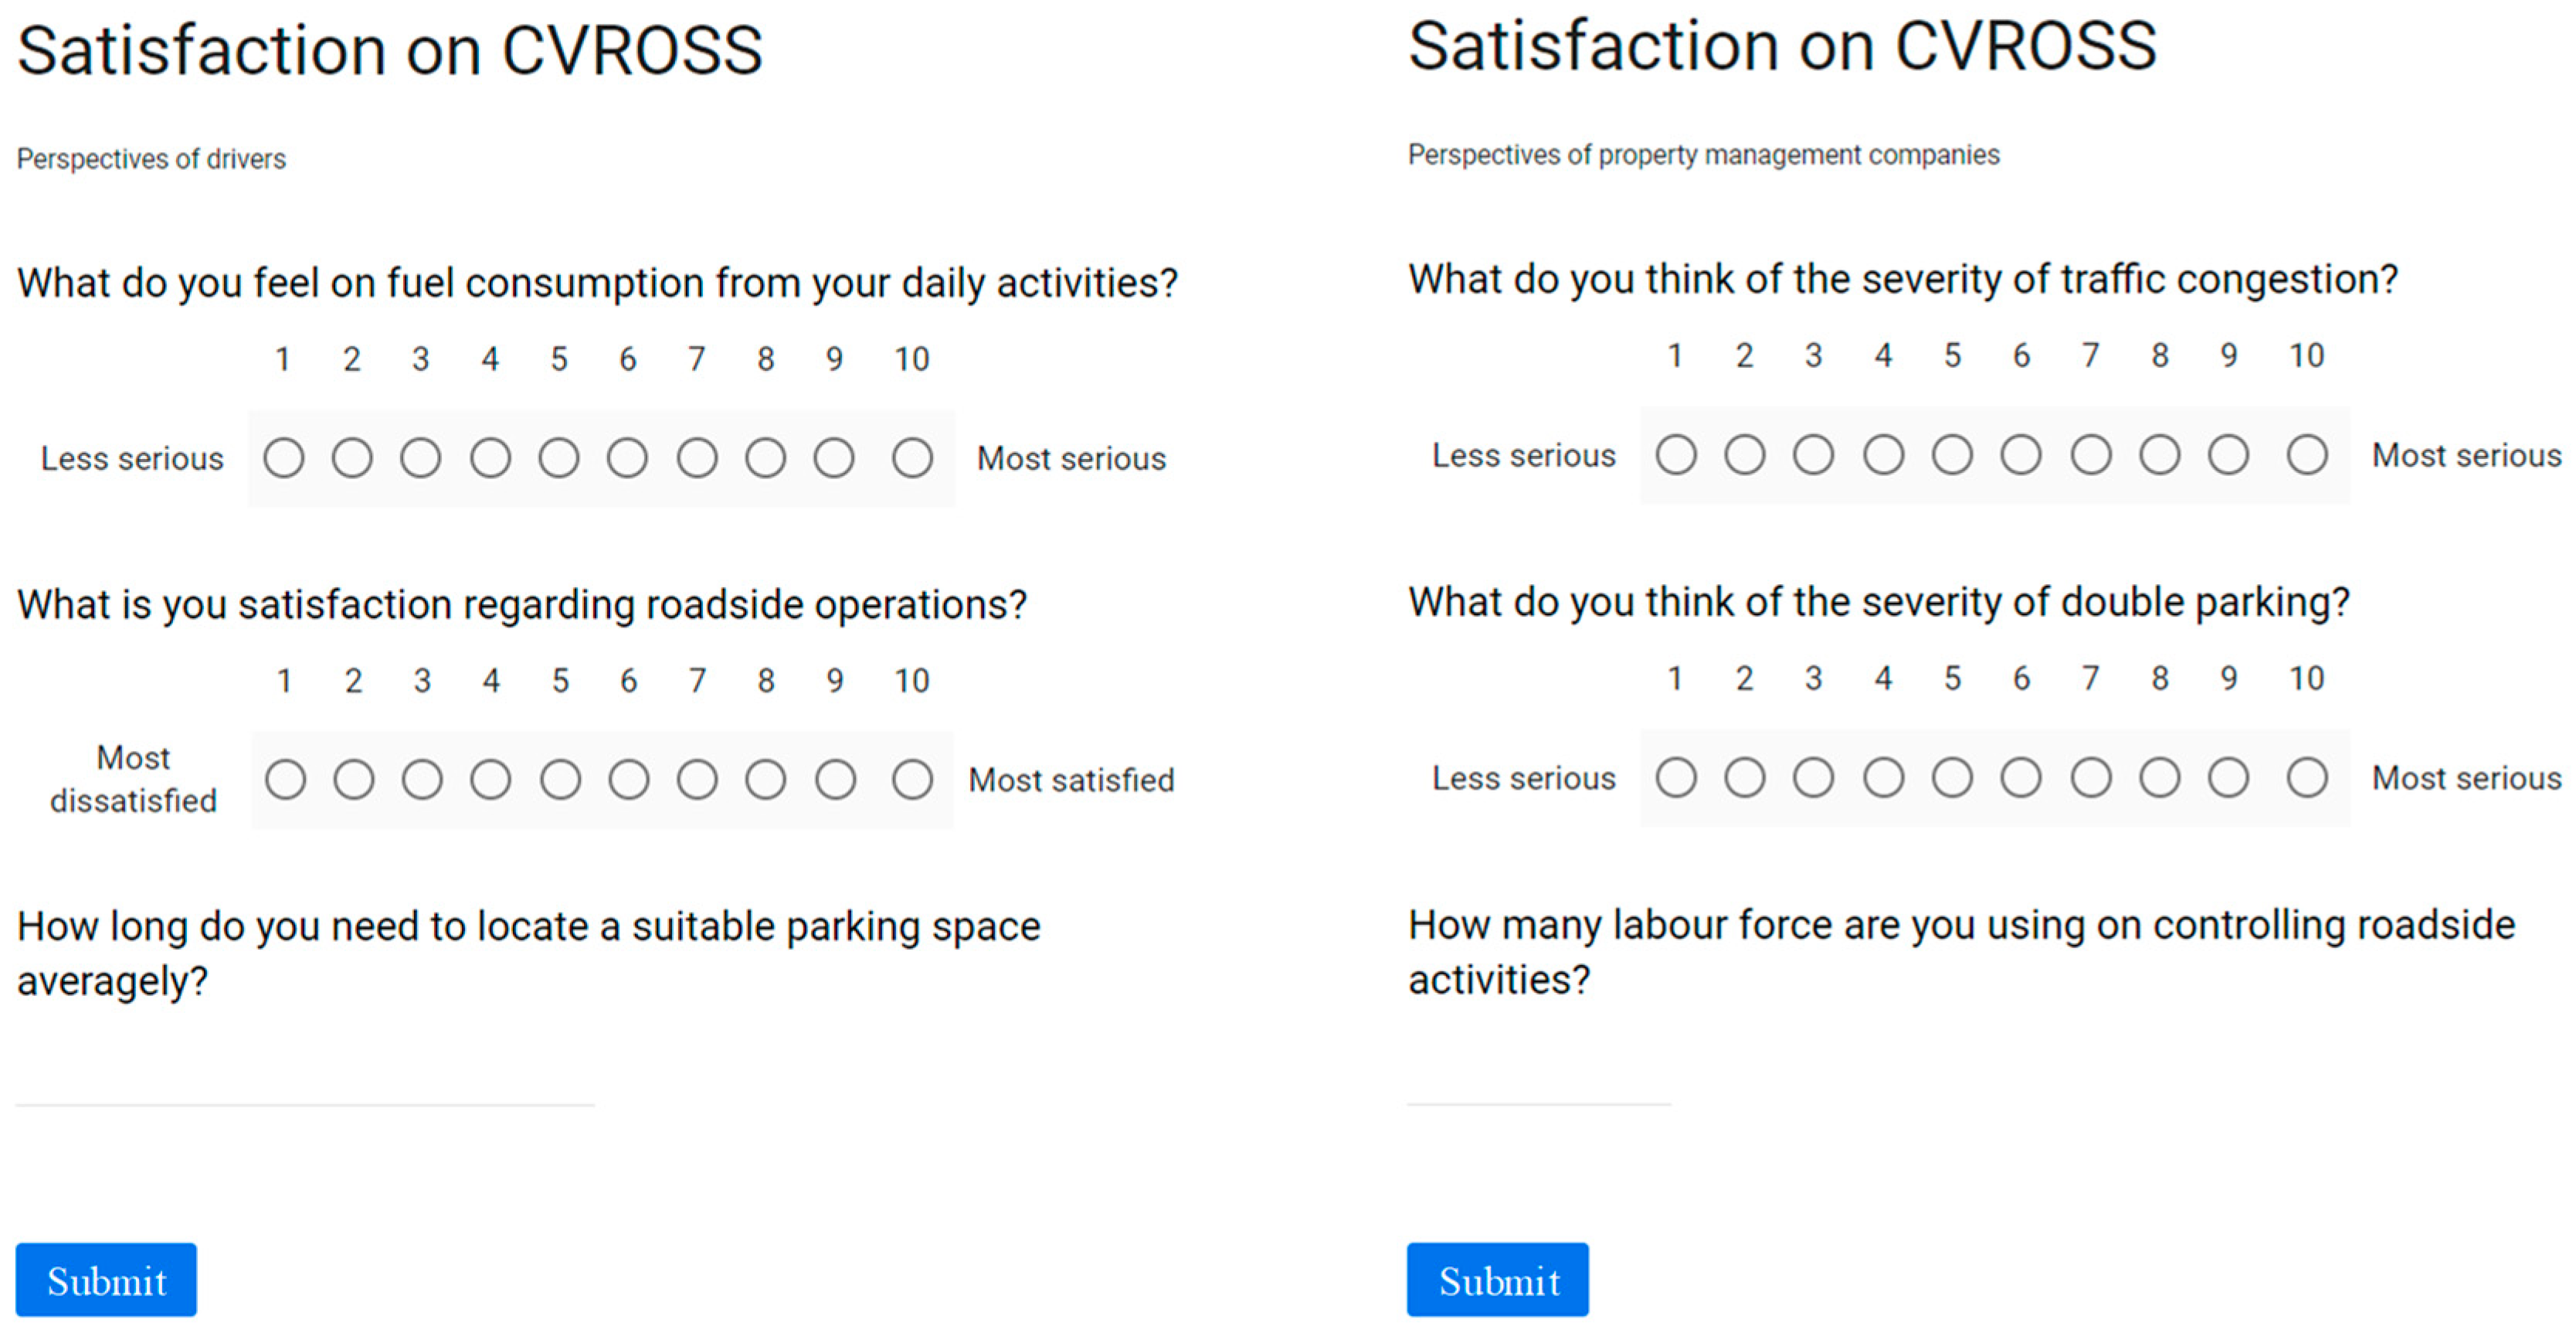
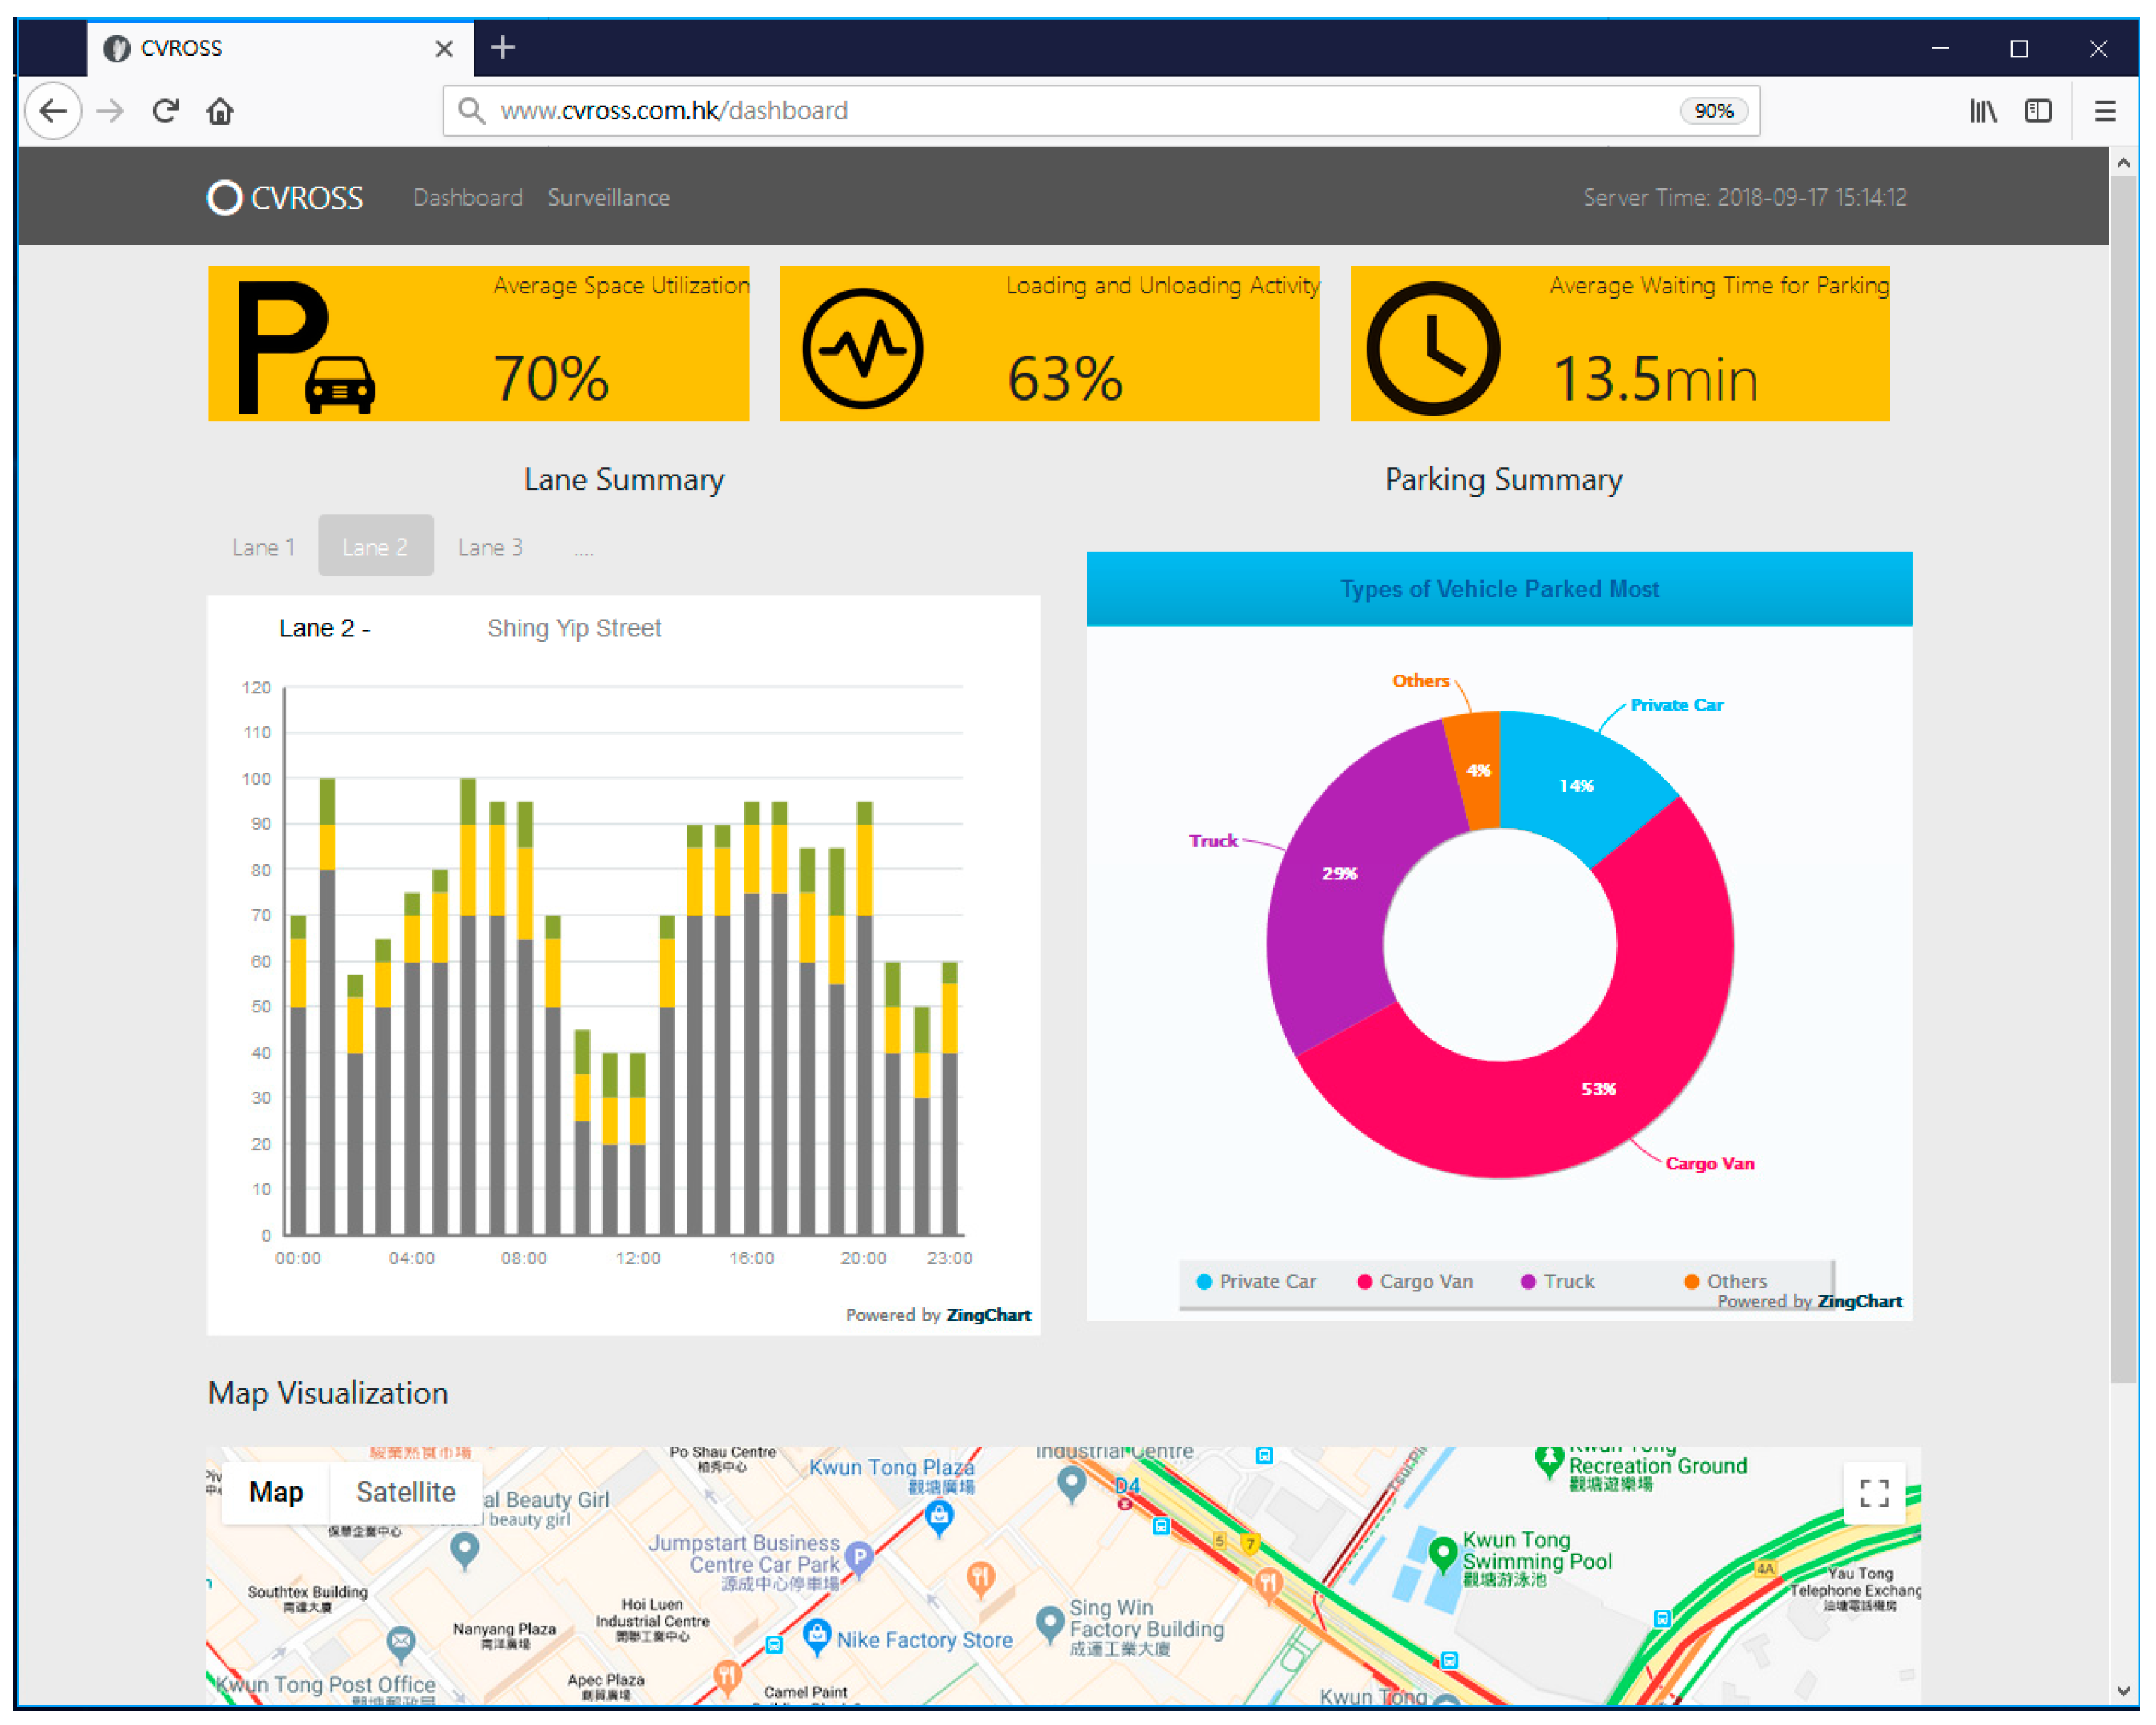
4.3. Establishment of Web-Based User Interface
5. Results and Discussion
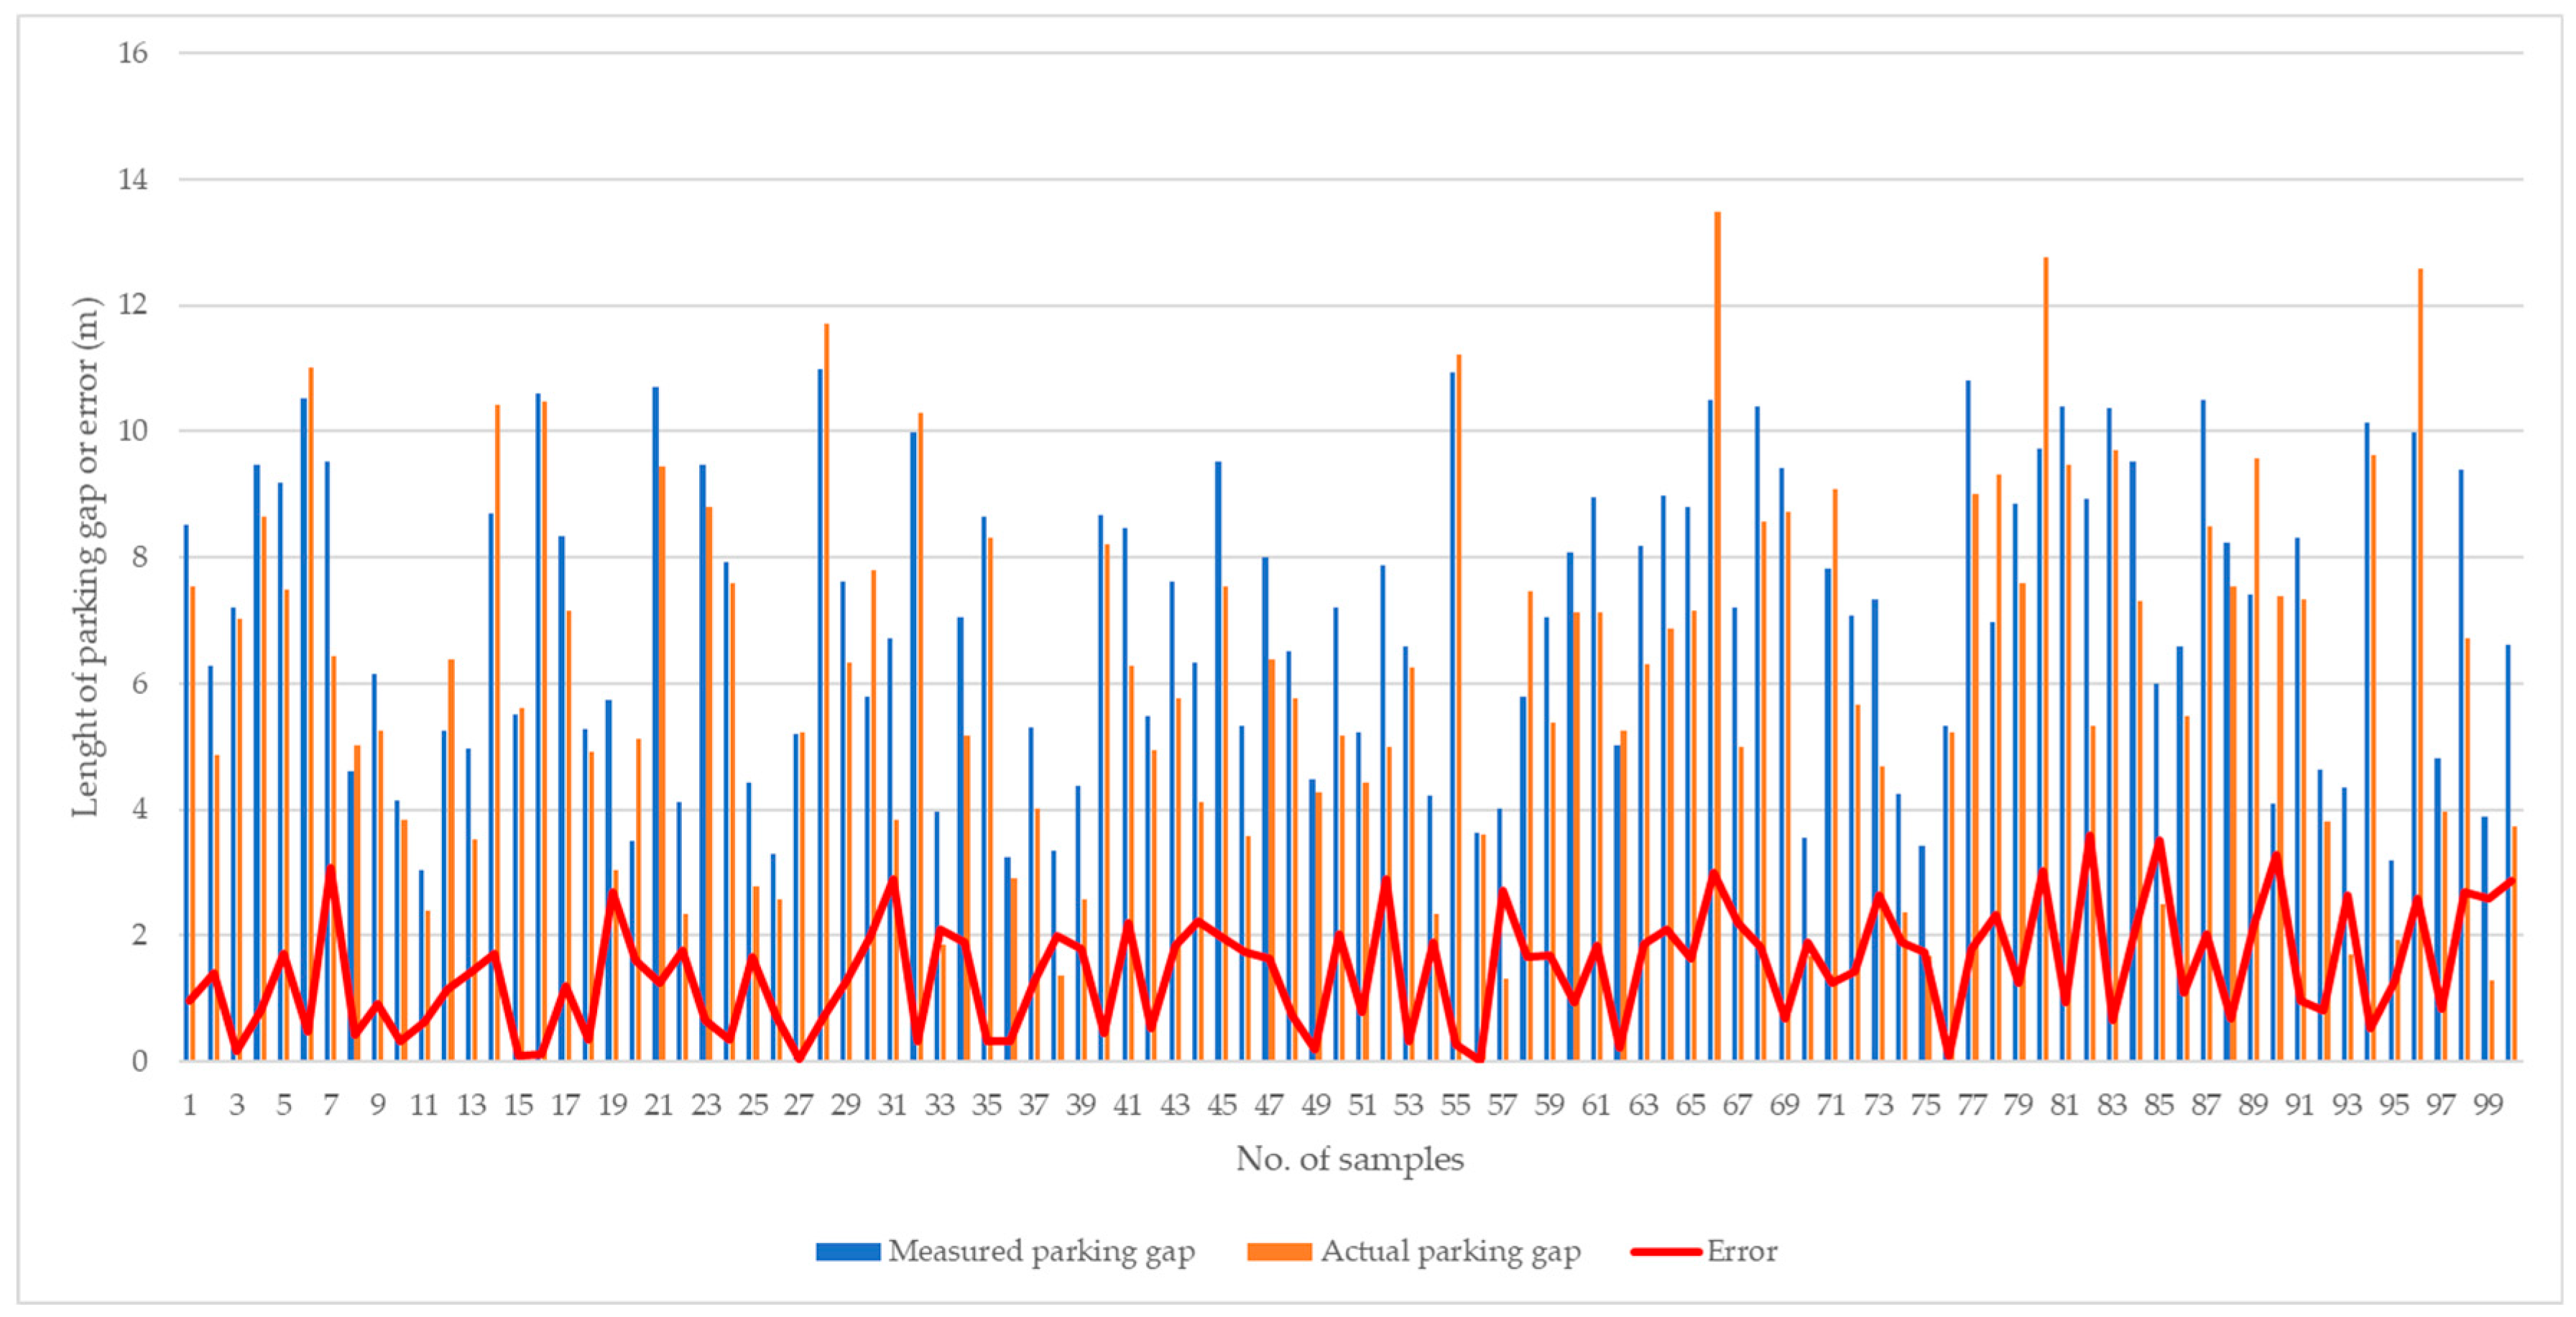
5.1. Comparative Analysis of the CVROSS
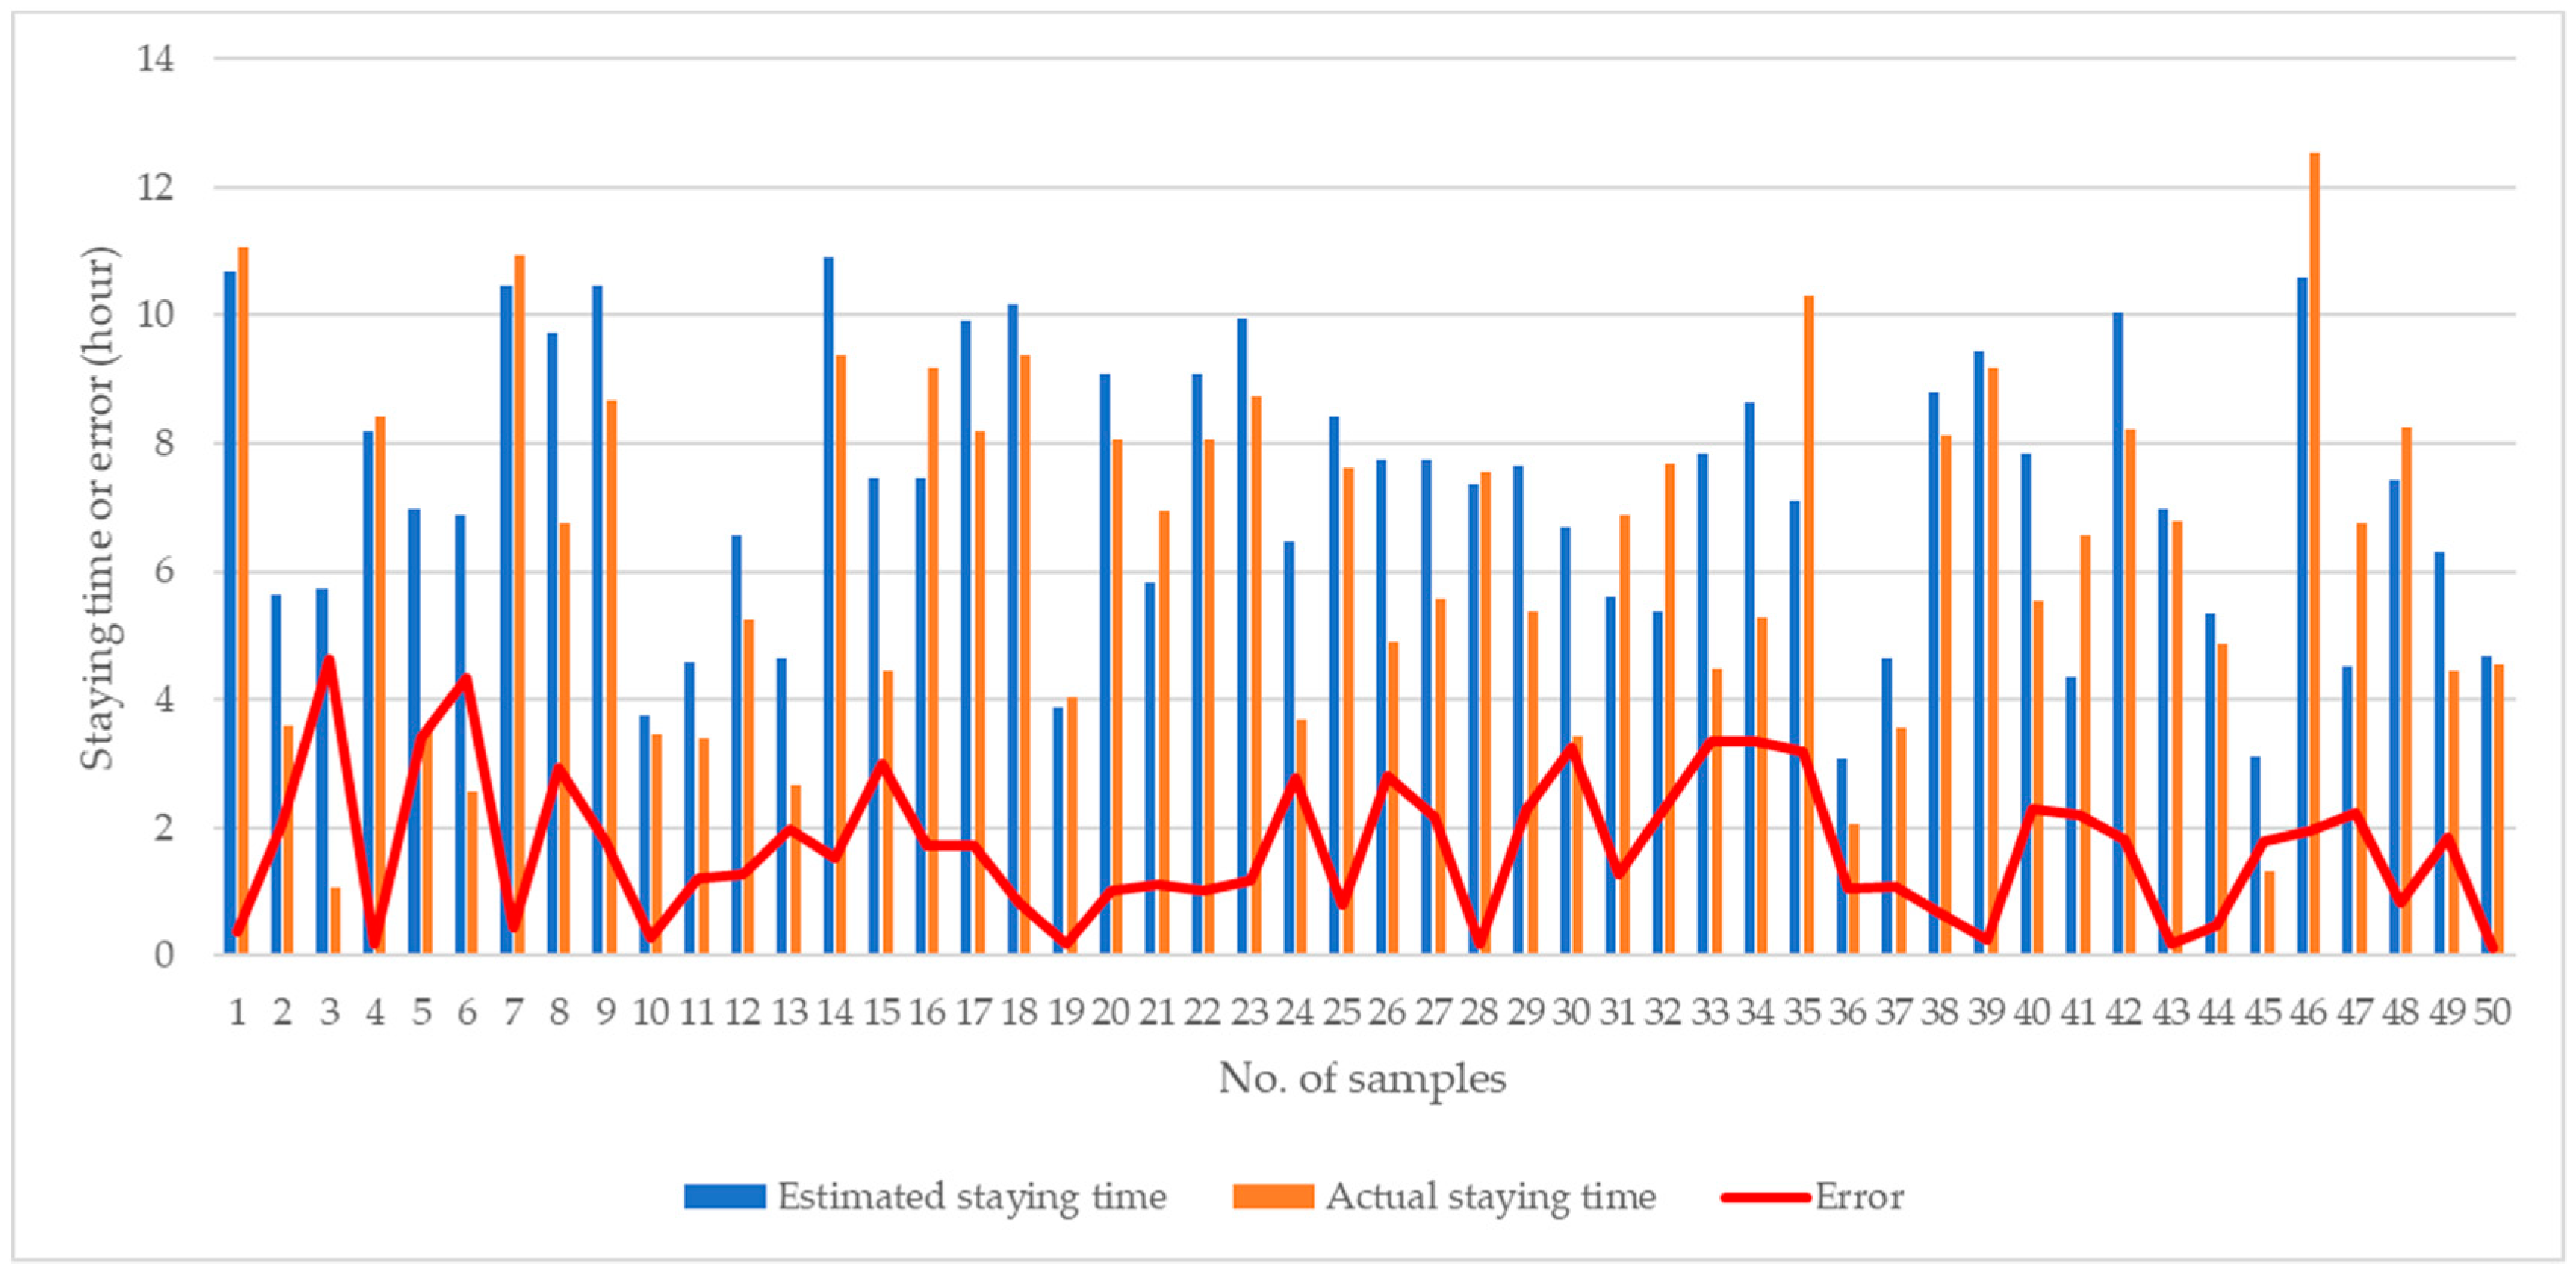
5.2. Timestamp Control of the CVROSS
5.3. Significance of the CVROSS
5.3.1. Smart Parking for Roadside Operations
5.3.2. Applied Artificial Intelligence for Roadside Parking Activities
5.3.3. Green Business Model Using the IoT
6. Conclusions
Author Contributions
Funding
Conflicts of Interest
References
- Cerchecci, M.; Luti, F.; Mecocci, A.; Parrino, S.; Peruzzi, G.; Pozzebon, A. A low power IoT sensor node architecture for waste management within smart cities context. Sensors 2018, 18, 1282. [Google Scholar] [CrossRef]
- Inglis, R.P.S.; Brenner, R.P.; Puzo, E.L.; Walker, T.O.; Anderson, C.R.; Thomas, R.W.; Martin, R.K. A secure wireless network for roadside surveillance using radio tomographic imaging. In Proceedings of the 2012 6th International Conference on Signal Processing and Communication Systems, Gold Coast, Australia, 12–14 December 2012. [Google Scholar]
- Samuel, A.L. Some studies in machine learning using the game of checkers. IBM J. Res. Dev. 2000, 44, 206–226. [Google Scholar] [CrossRef]
- Lyon, D. Surveillance Studies: An Overview; Polity Press: Cambridge, UK, 2007; pp. 13–18. [Google Scholar]
- Valera, M.; Velastin, S.A. Intelligent distributed surveillance systems: A review. IEE P-Vis. Image Sign. 2005, 152, 192–204. [Google Scholar] [CrossRef]
- Figueiredo, L.; Jesus, I.; Machado, J.T.; Ferreira, J.R.; De Carvalho, J.M. Towards the development of intelligent transportation systems. In Proceedings of the ITSC 2001. 2001 IEEE Intelligent Transportation Systems, Oakland, CA, USA, 25–29 August 2001. [Google Scholar]
- Problems in the Urban Environment: Traffic Congestion and Its Effects. Available online: https://ro.uow.edu.au/wollgeo/14/ (accessed on 1 March 2019).
- Qin, M.; Wang, Y.; Cui, Z.; Zhu, Y. The design and realization of an advanced urban traffic surveillance and management system. In Proceedings of the 2006 6th World Congress on Intelligent Control and Automation, Dalian, China, 21–23 June 2006. [Google Scholar]
- Gualotuña, T.; Macías, E.; Suárez, Á.; Rivadeneira, A. Low Cost Efficient Deliverying Video Surveillance Service to Moving Guard for Smart Home. Sensors 2018, 18, 745. [Google Scholar] [CrossRef] [PubMed]
- Maha Vishnu, V.C.; Rajalakshmi, M. Road side video surveillance in traffic scenes using map-reduce framework for accident analysis. Biomed. Res. 2016, 27, 257–266. [Google Scholar]
- Huang, L. Roadside camera calibration and its application in length-based vehicle classification. In Proceedings of the 2010 2nd International Asia Conference on Informatics in Control, Automation and Robotics (CAR 2010), Wuhan, China, 6–7 March 2010. [Google Scholar]
- Coifman, B.; Beymer, D.; McLauchlan, P.; Malik, J. A real-time computer vision system for vehicle tracking and traffic surveillance. Transport. Res. C-Emer. 1998, 6, 271–288. [Google Scholar] [CrossRef]
- Saran, K.B.; Sreelekha, G. Traffic video surveillance: Vehicle detection and classification. In Proceedings of the 2015 International Conference on Control Communication & Computing India (ICCC), Trivandrum, India, 19–21 November 2015. [Google Scholar]
- Wu, Q.; Zhang, Y. Parking Lots Space Detection. Available online: https://pdfs.semanticscholar.org/569c/55651e2f978fe9b0801799aa02cc587a2640.pdf (accessed on 1 January 2019).
- Lin, S.F.; Chen, Y.Y.; Liu, S.C. A vision-based parking lot management system. In Proceedings of the 2006 IEEE International Conference on Systems, Man and Cybernetics, Taipei, Taiwan, 8–11 October 2006. [Google Scholar]
- Micheloni, C.; Foresti, G.L.; Snidaro, L. A cooperative multicamera system for video-surveillance of parking lots. In Proceedings of the IEE Symposium on Intelligent Distributed Surveillance Systems, London, UK, 23–26 February 2003. [Google Scholar]
- Wilson, J.; Patwari, N. Radio tomographic imaging with wireless networks. IEEE T Mobile Comput. 2010, 9, 621–632. [Google Scholar] [CrossRef]
- Martin, R.K.; Anderson, C.; Thomas, R.W.; King, A.S. Modelling and analysis of radio tomography. In Proceedings of the 2011 4th IEEE International Workshop on Computational Advances in Multi-Sensor Adaptive Processing, San Juan, Puerto Rico, 12–15 December 2011. [Google Scholar]
- Anderson, C.R.; Martin, R.K.; Walker, T.O.; Thomas, R.W. Radio tomography for roadside surveillance. IEEE J. Sel. Topics Signal Process 2014, 8, 66–79. [Google Scholar] [CrossRef]
- Wohwe Sambo, D.; Yenke, B.O.; Förster, A.; Dayang, P. Optimized Clustering Algorithms for Large Wireless Sensor Networks: A Review. Sensors 2019, 19, 322. [Google Scholar] [CrossRef] [PubMed]
- Cheung, S.Y.; Ergen, S.C.; Varaiya, P. Traffic surveillance with wireless magnetic sensors. In Proceedings of the 12th ITS world congress, San Francisco, CA, USA, 6–10 November 2005. [Google Scholar]
- Traffic Surveillance by Wireless Sensor Networks: Final Report. Available online: http://citeseerx.ist.psu.edu/viewdoc/download?doi=10.1.1.84.6488&rep=rep1&type=pdf (accessed on 2 March 2019).
- Tiwari, P.; Saxena, V.P.; Mishra, R.G.; Bhavsar, D. Wireless sensor networks: Introduction, advantages, applications and research challenges. Int. J. Technol. Innovations Res. 2015, 14, 1–11. [Google Scholar]
- Buch, N.; Velastin, S.A.; Orwell, J. A review of computer vision techniques for the analysis of urban traffic. IEEE Trans. Intell. Transp. Syst. 2011, 12, 920–939. [Google Scholar] [CrossRef]
- Computer Vision: Evolution and Promise. Available online: http://cds.cern.ch/record/400313/files/p21.pdf (accessed on 2 March 2019).
- Perallos, A.; Hernandez-Jayo, U.; Zuazola, I.J.G.; Onieva, E. Intelligent Transport Systems: Technologies and Applications; John Wiley & Sons: New York, NY, USA, 2015. [Google Scholar]
- Beymer, D.; McLauchlan, P.; Coifman, B.; Malik, J. A real-time computer vision system for measuring traffic parameters. In Proceedings of the IEEE Computer Society Conference on Computer Vision and Pattern Recognition, San Juan, Puerto Rico, 17–19 June 1997. [Google Scholar]
- Huang, M.C.; Yen, S.H. A real-time and color-based computer vision for traffic monitoring system. In Proceedings of the 2004 IEEE International Conference on Multimedia and Expo, Taipei, Taiwan, 27–30 June 2004. [Google Scholar]
- Neethu, N.J.; Anoop, B.K. Role of Computer Vision in Automatic Inspection Systems. Int. J. Comp. App. 2015, 123, 28–31. [Google Scholar]
- Zander, S.; Nguyen, T.; Armitage, G. Automated traffic classification and application identification using machine learning. In Proceedings of the IEEE Conference on Local Computer Networks 30th Anniversary, Sydney, Australia, 17 November 2005. [Google Scholar]
- Rosten, E.; Porter, R.; Drummond, T. Faster and better: A machine learning approach to corner detection. IEEE Trans. Pattern Anal. Mach. Intell. 2010, 32, 105–119. [Google Scholar] [CrossRef] [PubMed]
- Hong Kong Planning Standards and Guidelines. Available online: https://www.pland.gov.hk/pland_en/tech_doc/hkpsg/sum/pdf/sum.pdf (accessed on 2 March 2019).
- Brailean, J.C.; Kleihorst, R.P.; Efstratiadis, S.; Katsaggelos, A.K.; Lagendijk, R.L. Noise reduction filters for dynamic image sequences: A review. Proc. IEEE 1995, 83, 1272–1292. [Google Scholar] [CrossRef]
- Public Lighting Design Manual Third Edition. Available online: https://www.hyd.gov.hk/en/publications_and_publicity/publications/technical_document/public_lighting_design_manual/doc/PLDM_2016.pdf (accessed on 2 March 2019).
- Lin, C.-C.; Wang, M.-S. A Vision Based Top-View Transformation Model for a Vehicle Parking Assistant. Sensors 2012, 12, 4431–4446. [Google Scholar] [CrossRef] [PubMed]
- Chen, L.W.; Ho, Y.F. Centimeter-Grade Metropolitan Positioning for Lane-Level Intelligent Transportation Systems Based on the Internet of Vehicles. IEEE T. Ind. Inform. 2019, 15, 1474–1485. [Google Scholar] [CrossRef]
- Hamzah, A.; Shurman, M.; Al-Jarrah, O.; Taqieddin, E. Energy-Efficient Fuzzy-Logic-Based Clustering Technique for Hierarchical Routing Protocols in Wireless Sensor Networks. Sensors 2019, 19, 561. [Google Scholar] [CrossRef] [PubMed]


| Parameter/Unit | Range | Fuzzy Class | Membership Function | Type |
|---|---|---|---|---|
| Input: | ||||
| L(x,n)/m | [0, 18] | Short | [0, 5, 7] | trimf 1 |
| Medium | [5, 7, 11, 12] | trapmf 2 | ||
| Long | [11, 12, 18] | trimf 1 | ||
| L(y,n)/m | [2, 4] | Narrow | [2, 2.5, 3] | trimf 1 |
| Medium | [2.5, 3, 3.5] | trimf 1 | ||
| Wide | [3, 3.5, 4] | trimf 1 | ||
| tp/h | [0, 24] | Night hour | [0, 0, 6, 9] | trapmf 2 |
| Office hour | [6, 9, 15, 18] | trapmf 2 | ||
| Evening hour | [15, 18, 24, 24] | trapmf 2 | ||
| Output: | ||||
| γ | [0, 1] | Slightly increased | [0, 0.33, 0.5] | trimf 1 |
| Substantially increased | [0.33, 0.5, 0.67] | trimf 1 | ||
| Significantly increased | [0.5, 0.67, 1] | trimf 1 | ||
| ts/min | [0, 360] | Short | [0, 60, 120] | trimf 1 |
| Medium | [60, 120, 150, 210] | trapmf 2 | ||
| Long | [150, 210, 360] | trimf 1 | ||
| No. | Area | UoM a | Before Using CVROSS | After Using CVROSS | % of Improvement |
|---|---|---|---|---|---|
| Perspectives from property management companies | |||||
| 1 | Severity of traffic congestion | Scale (1–10) b | 8.5 | 5.0 | −41.2% |
| 2 | Severity of double parking | Scale (1–10) b | 9.7 | 6.5 | −33.0% |
| 3 | Labour force on controlling roadside activities | people per shift | 10 | 6 | −40.0% |
| Perspectives from drivers and truckers | |||||
| 1 | Average fuel saving | Scale (1–10) b | 7.8 | 5.1 | −34.6% |
| 2 | Average time to locate suitable parking space | min | 18.2 | 8.8 | −51.6% |
| 3 | Average driver satisfaction | Scale (1–10) b | 6.1 | 8.2 | +34.4% |
© 2019 by the authors. Licensee MDPI, Basel, Switzerland. This article is an open access article distributed under the terms and conditions of the Creative Commons Attribution (CC BY) license (http://creativecommons.org/licenses/by/4.0/).
Share and Cite
Ho, G.T.S.; Tsang, Y.P.; Wu, C.H.; Wong, W.H.; Choy, K.L. A Computer Vision-Based Roadside Occupation Surveillance System for Intelligent Transport in Smart Cities. Sensors 2019, 19, 1796. https://doi.org/10.3390/s19081796
Ho GTS, Tsang YP, Wu CH, Wong WH, Choy KL. A Computer Vision-Based Roadside Occupation Surveillance System for Intelligent Transport in Smart Cities. Sensors. 2019; 19(8):1796. https://doi.org/10.3390/s19081796
Chicago/Turabian StyleHo, George To Sum, Yung Po Tsang, Chun Ho Wu, Wai Hung Wong, and King Lun Choy. 2019. "A Computer Vision-Based Roadside Occupation Surveillance System for Intelligent Transport in Smart Cities" Sensors 19, no. 8: 1796. https://doi.org/10.3390/s19081796
APA StyleHo, G. T. S., Tsang, Y. P., Wu, C. H., Wong, W. H., & Choy, K. L. (2019). A Computer Vision-Based Roadside Occupation Surveillance System for Intelligent Transport in Smart Cities. Sensors, 19(8), 1796. https://doi.org/10.3390/s19081796