Peak Detection Algorithm for Vital Sign Detection Using Doppler Radar Sensors †


Abstract
1. Introduction
2. Theory and Methods
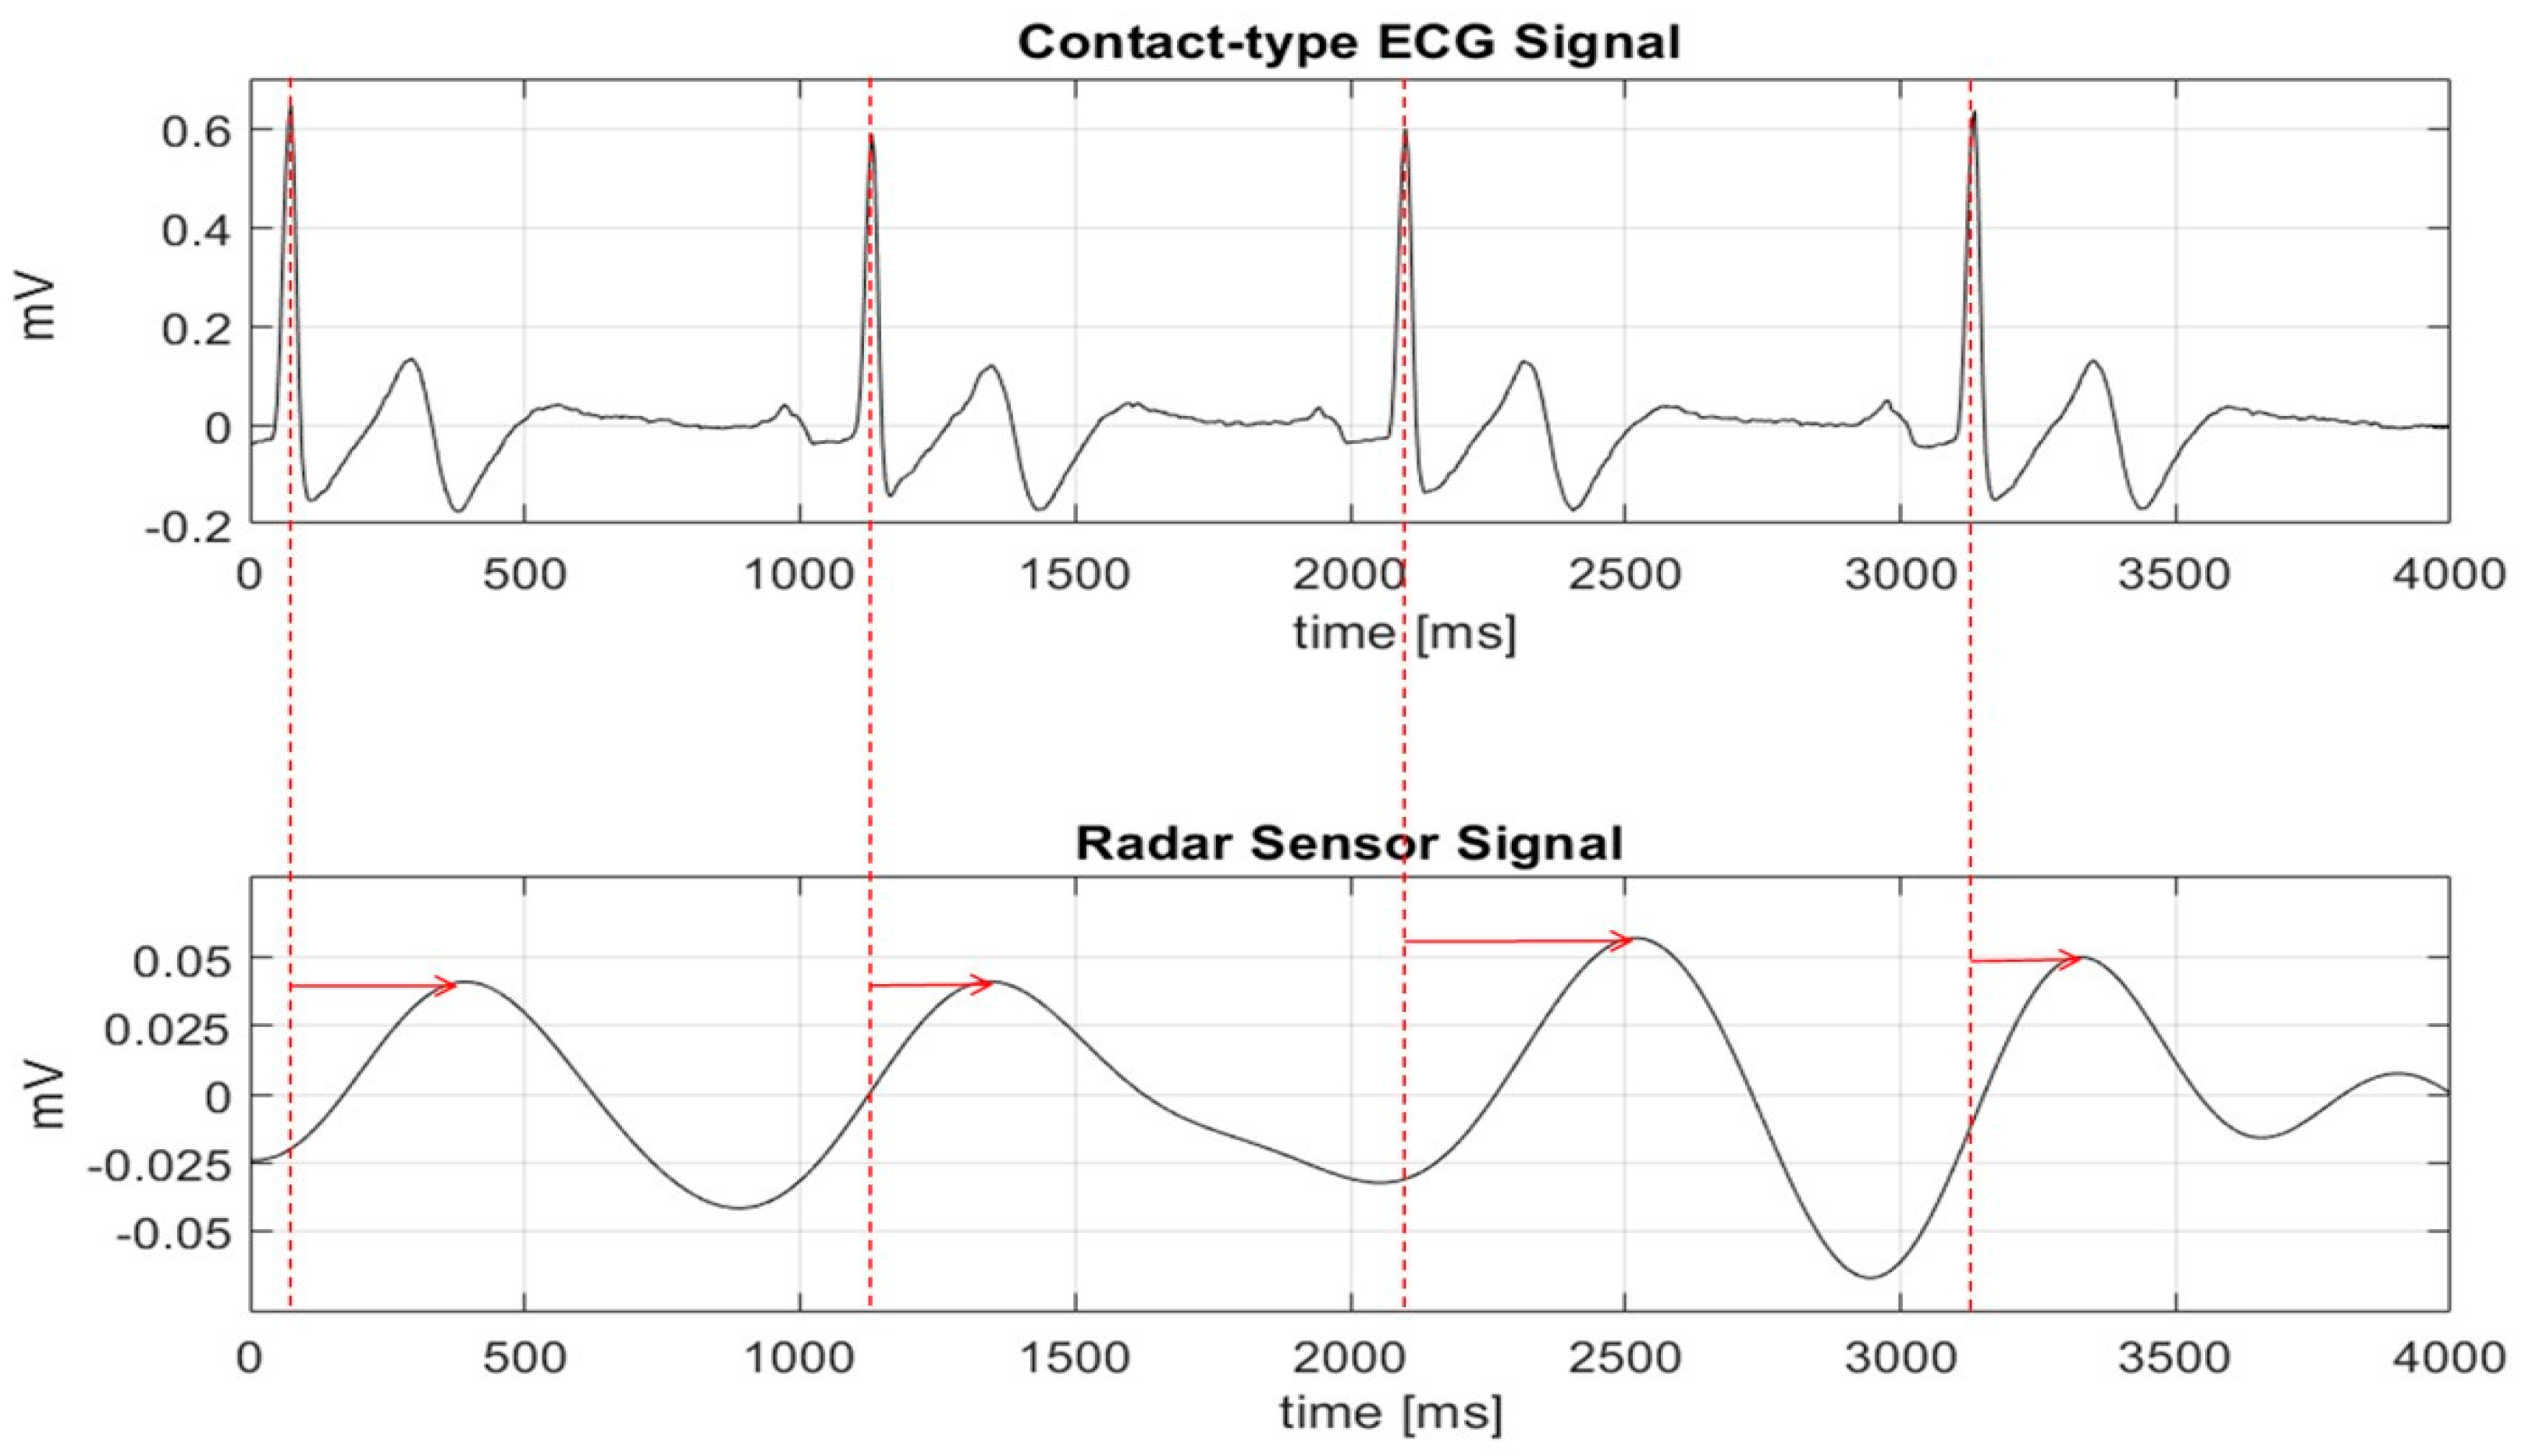
2.1. Differences between Radar Sensor Output and ECG Signals
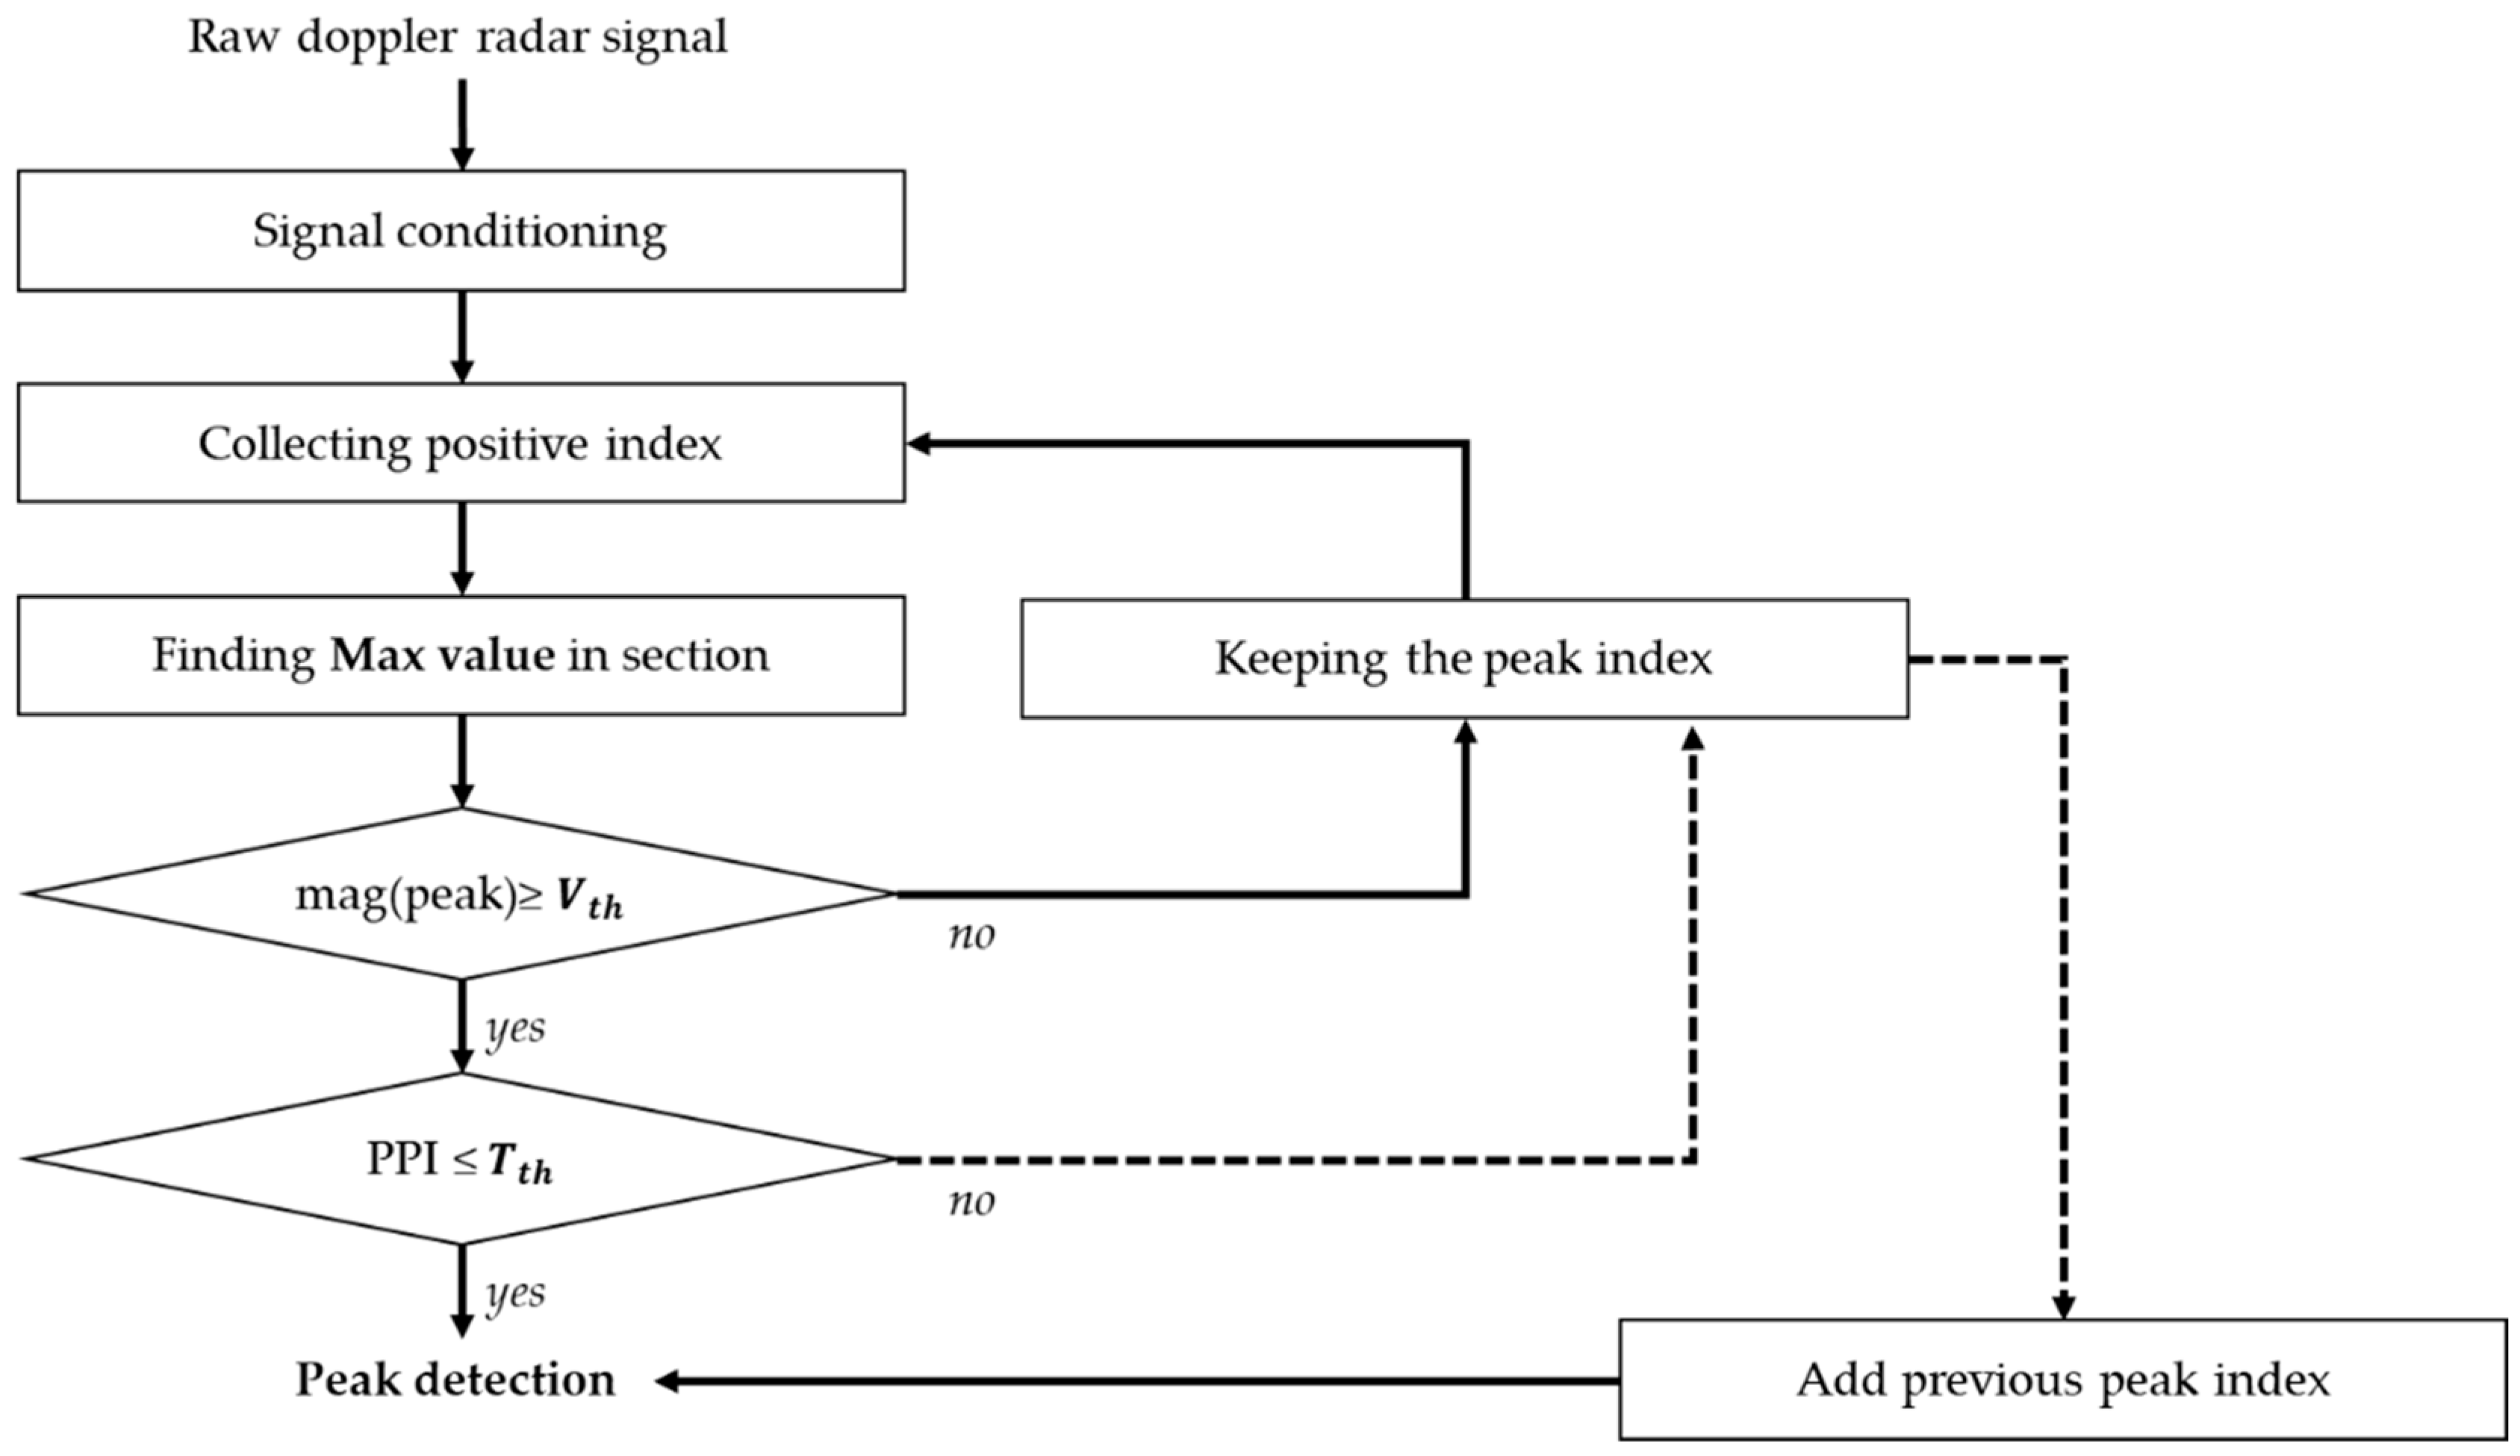
2.2. Proposed Peak Detection Algorithm
2.3. Drowsiness Prediction Based HRV Analysis
3. Experiments
3.1. Subjects
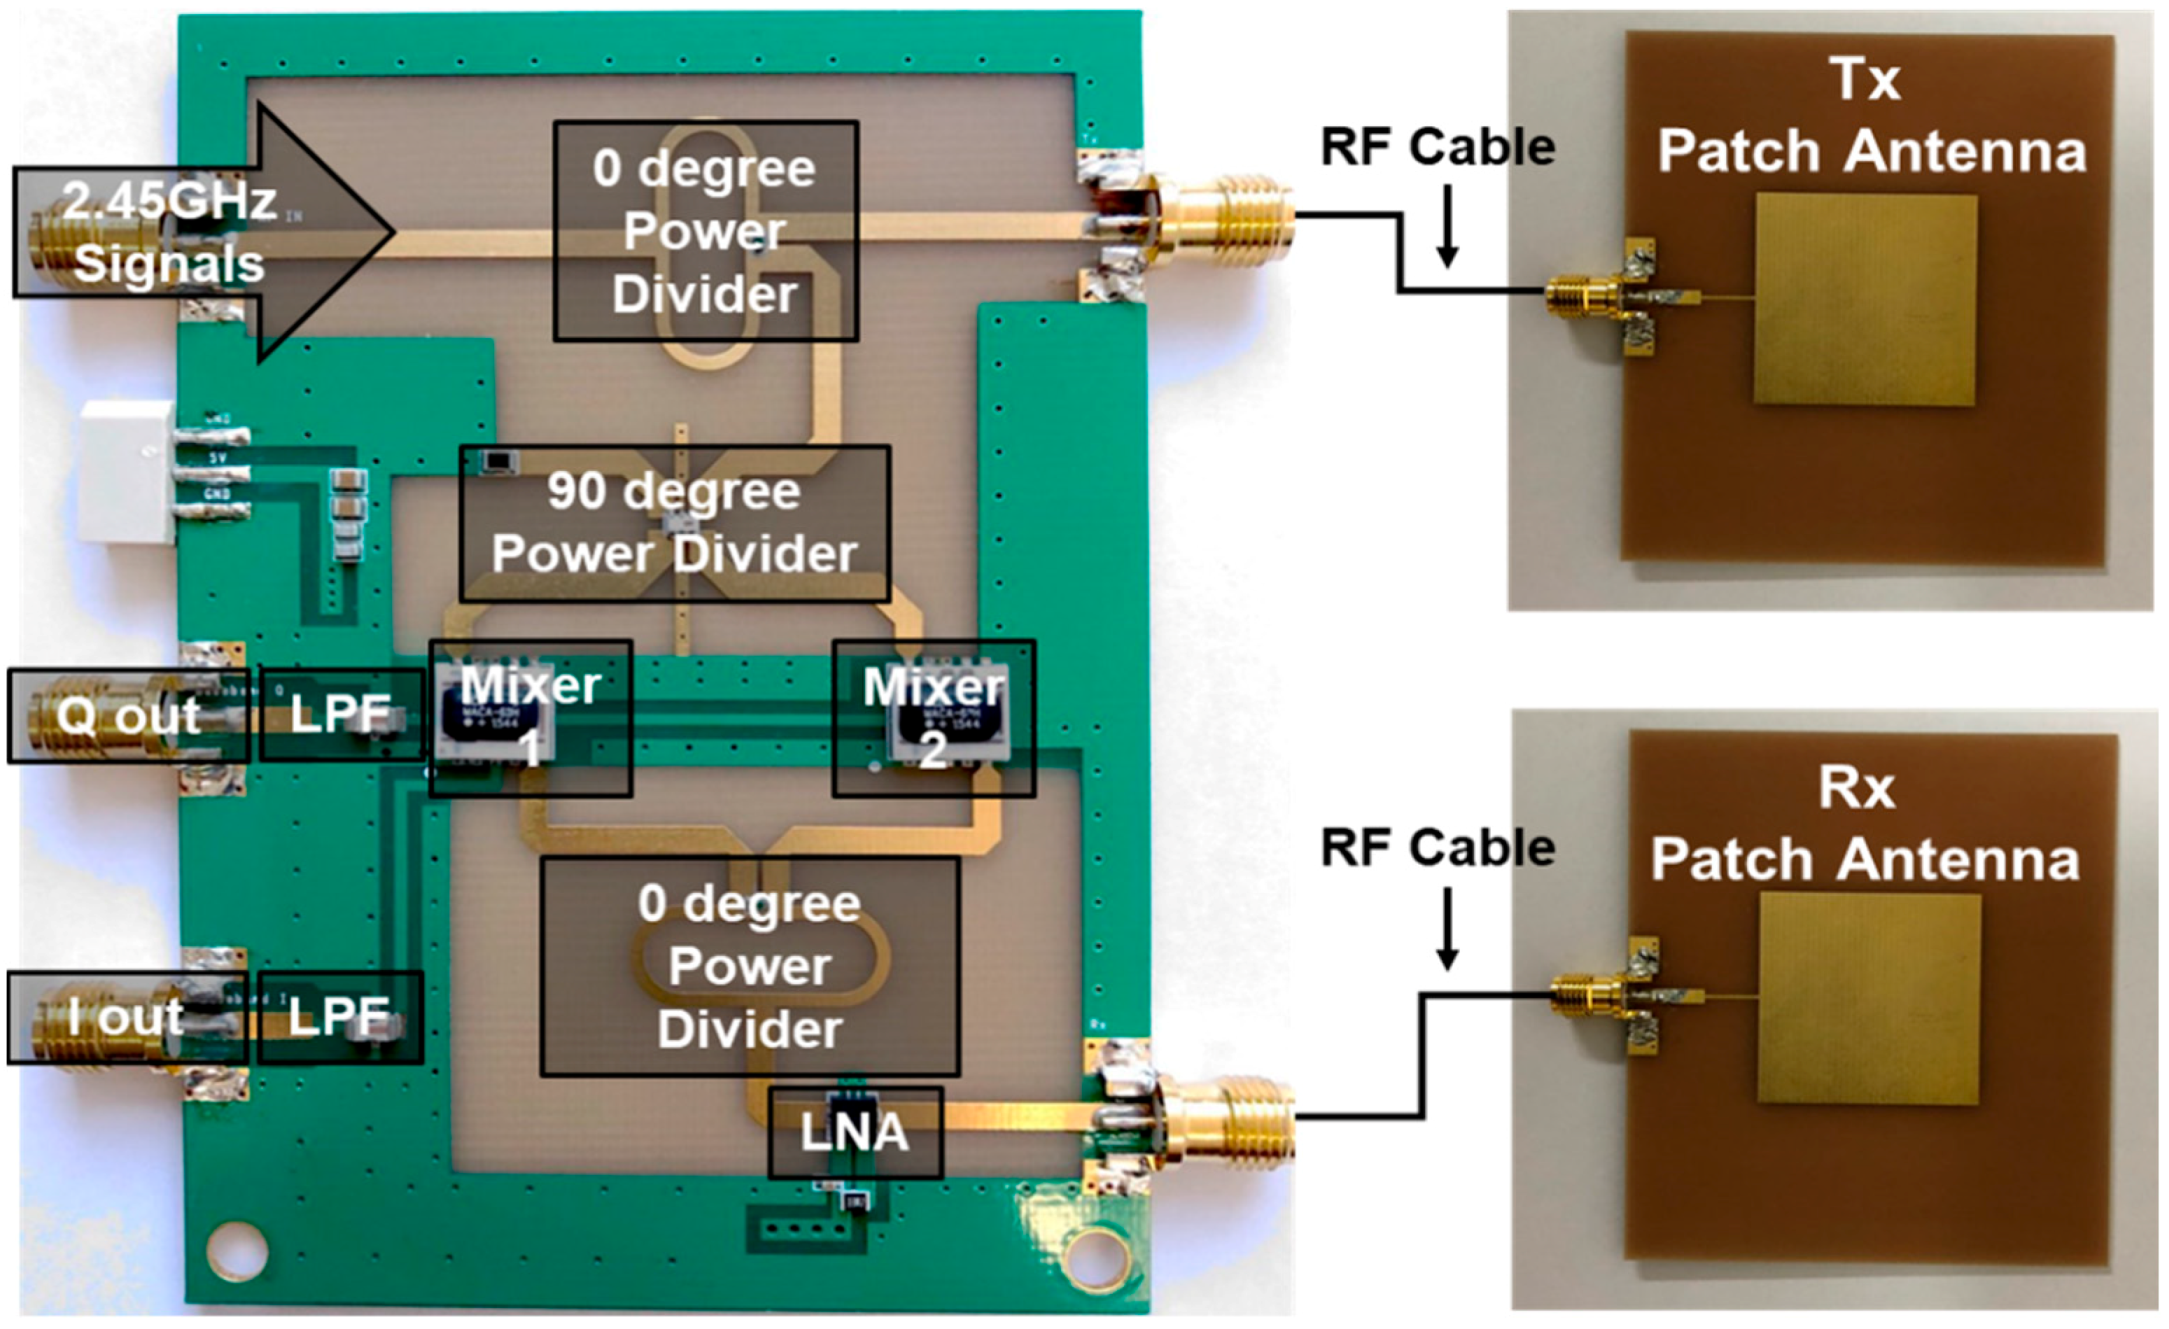
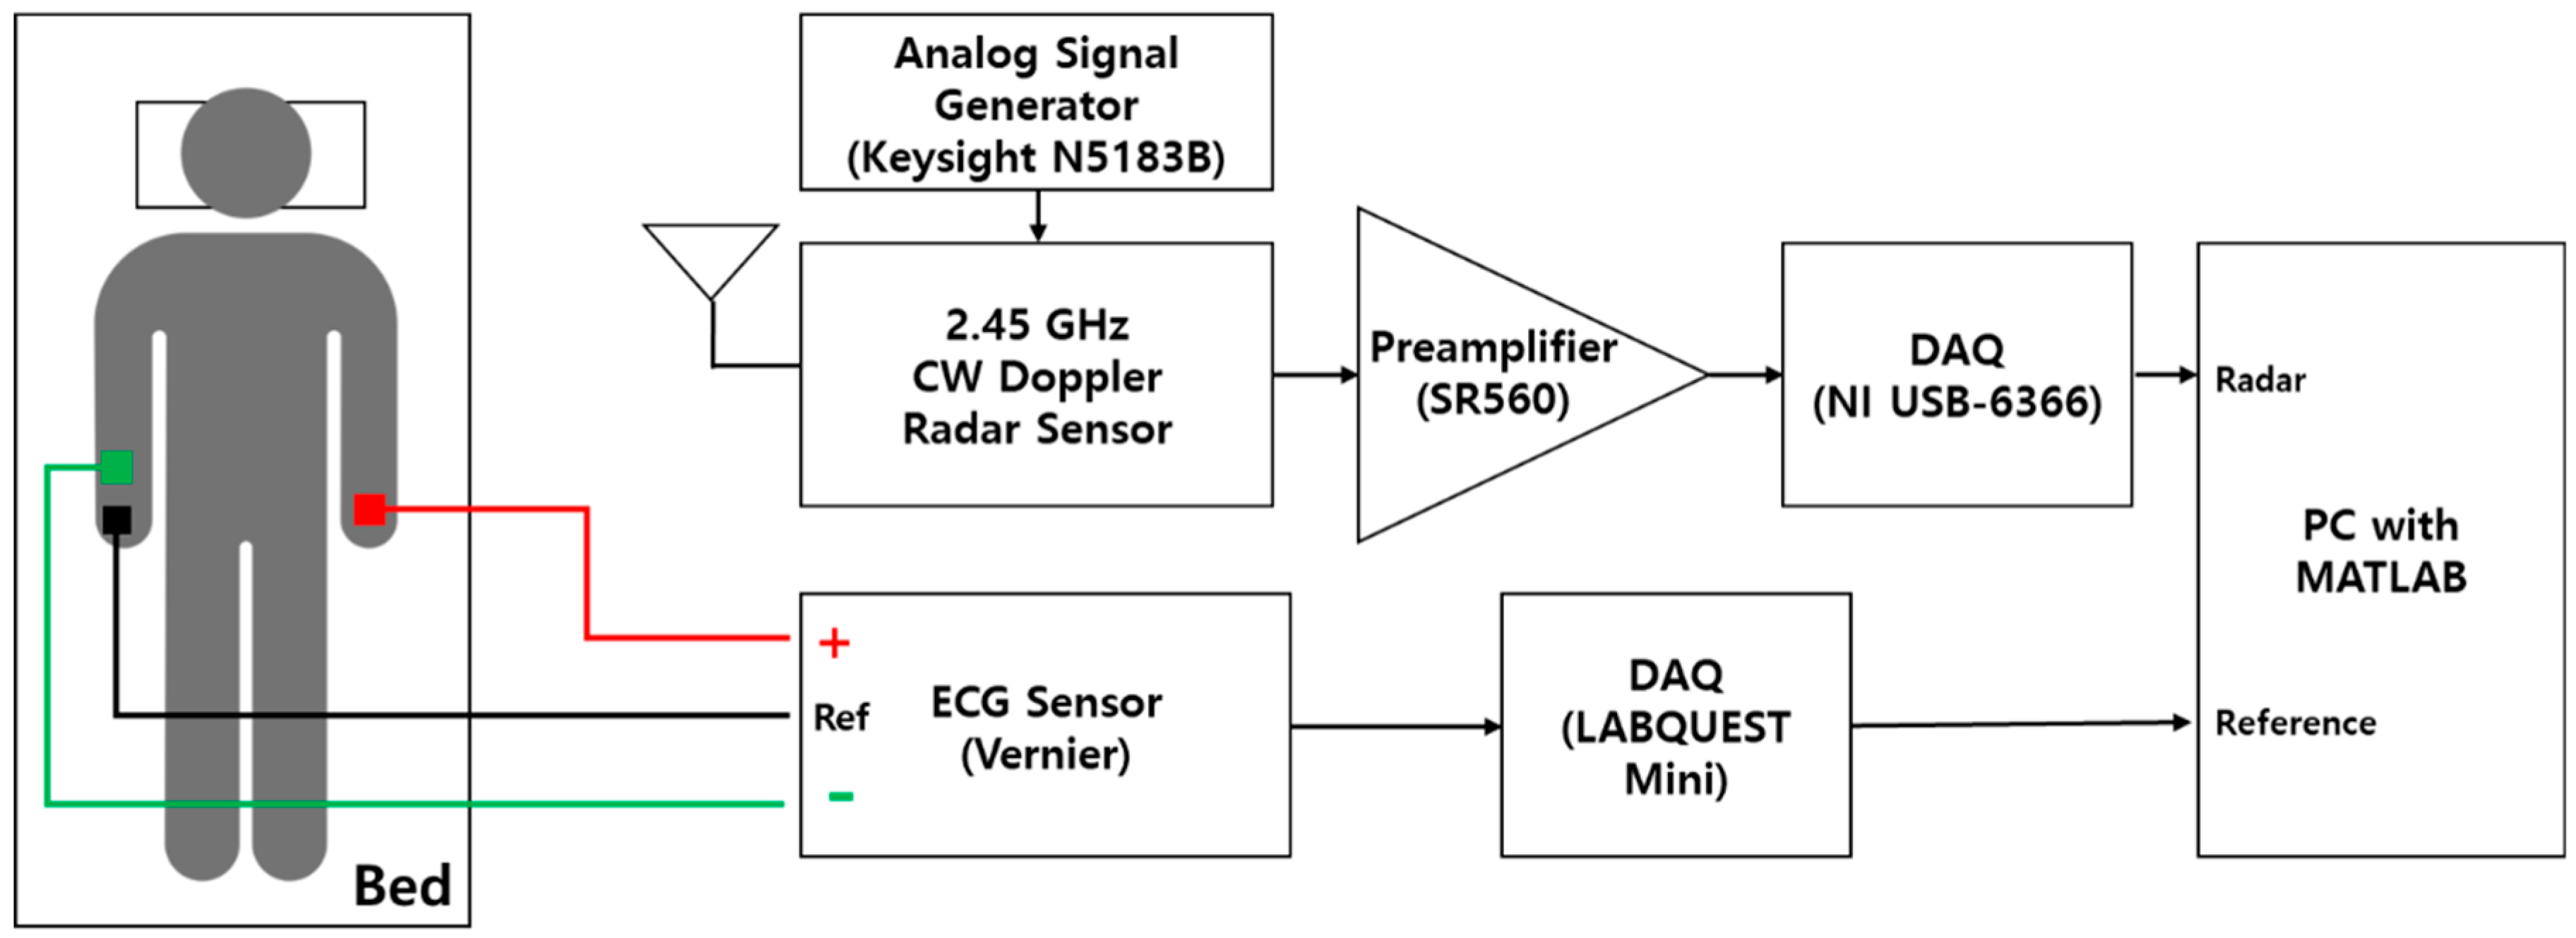
3.2. Radar Sensor and Measurement Environment
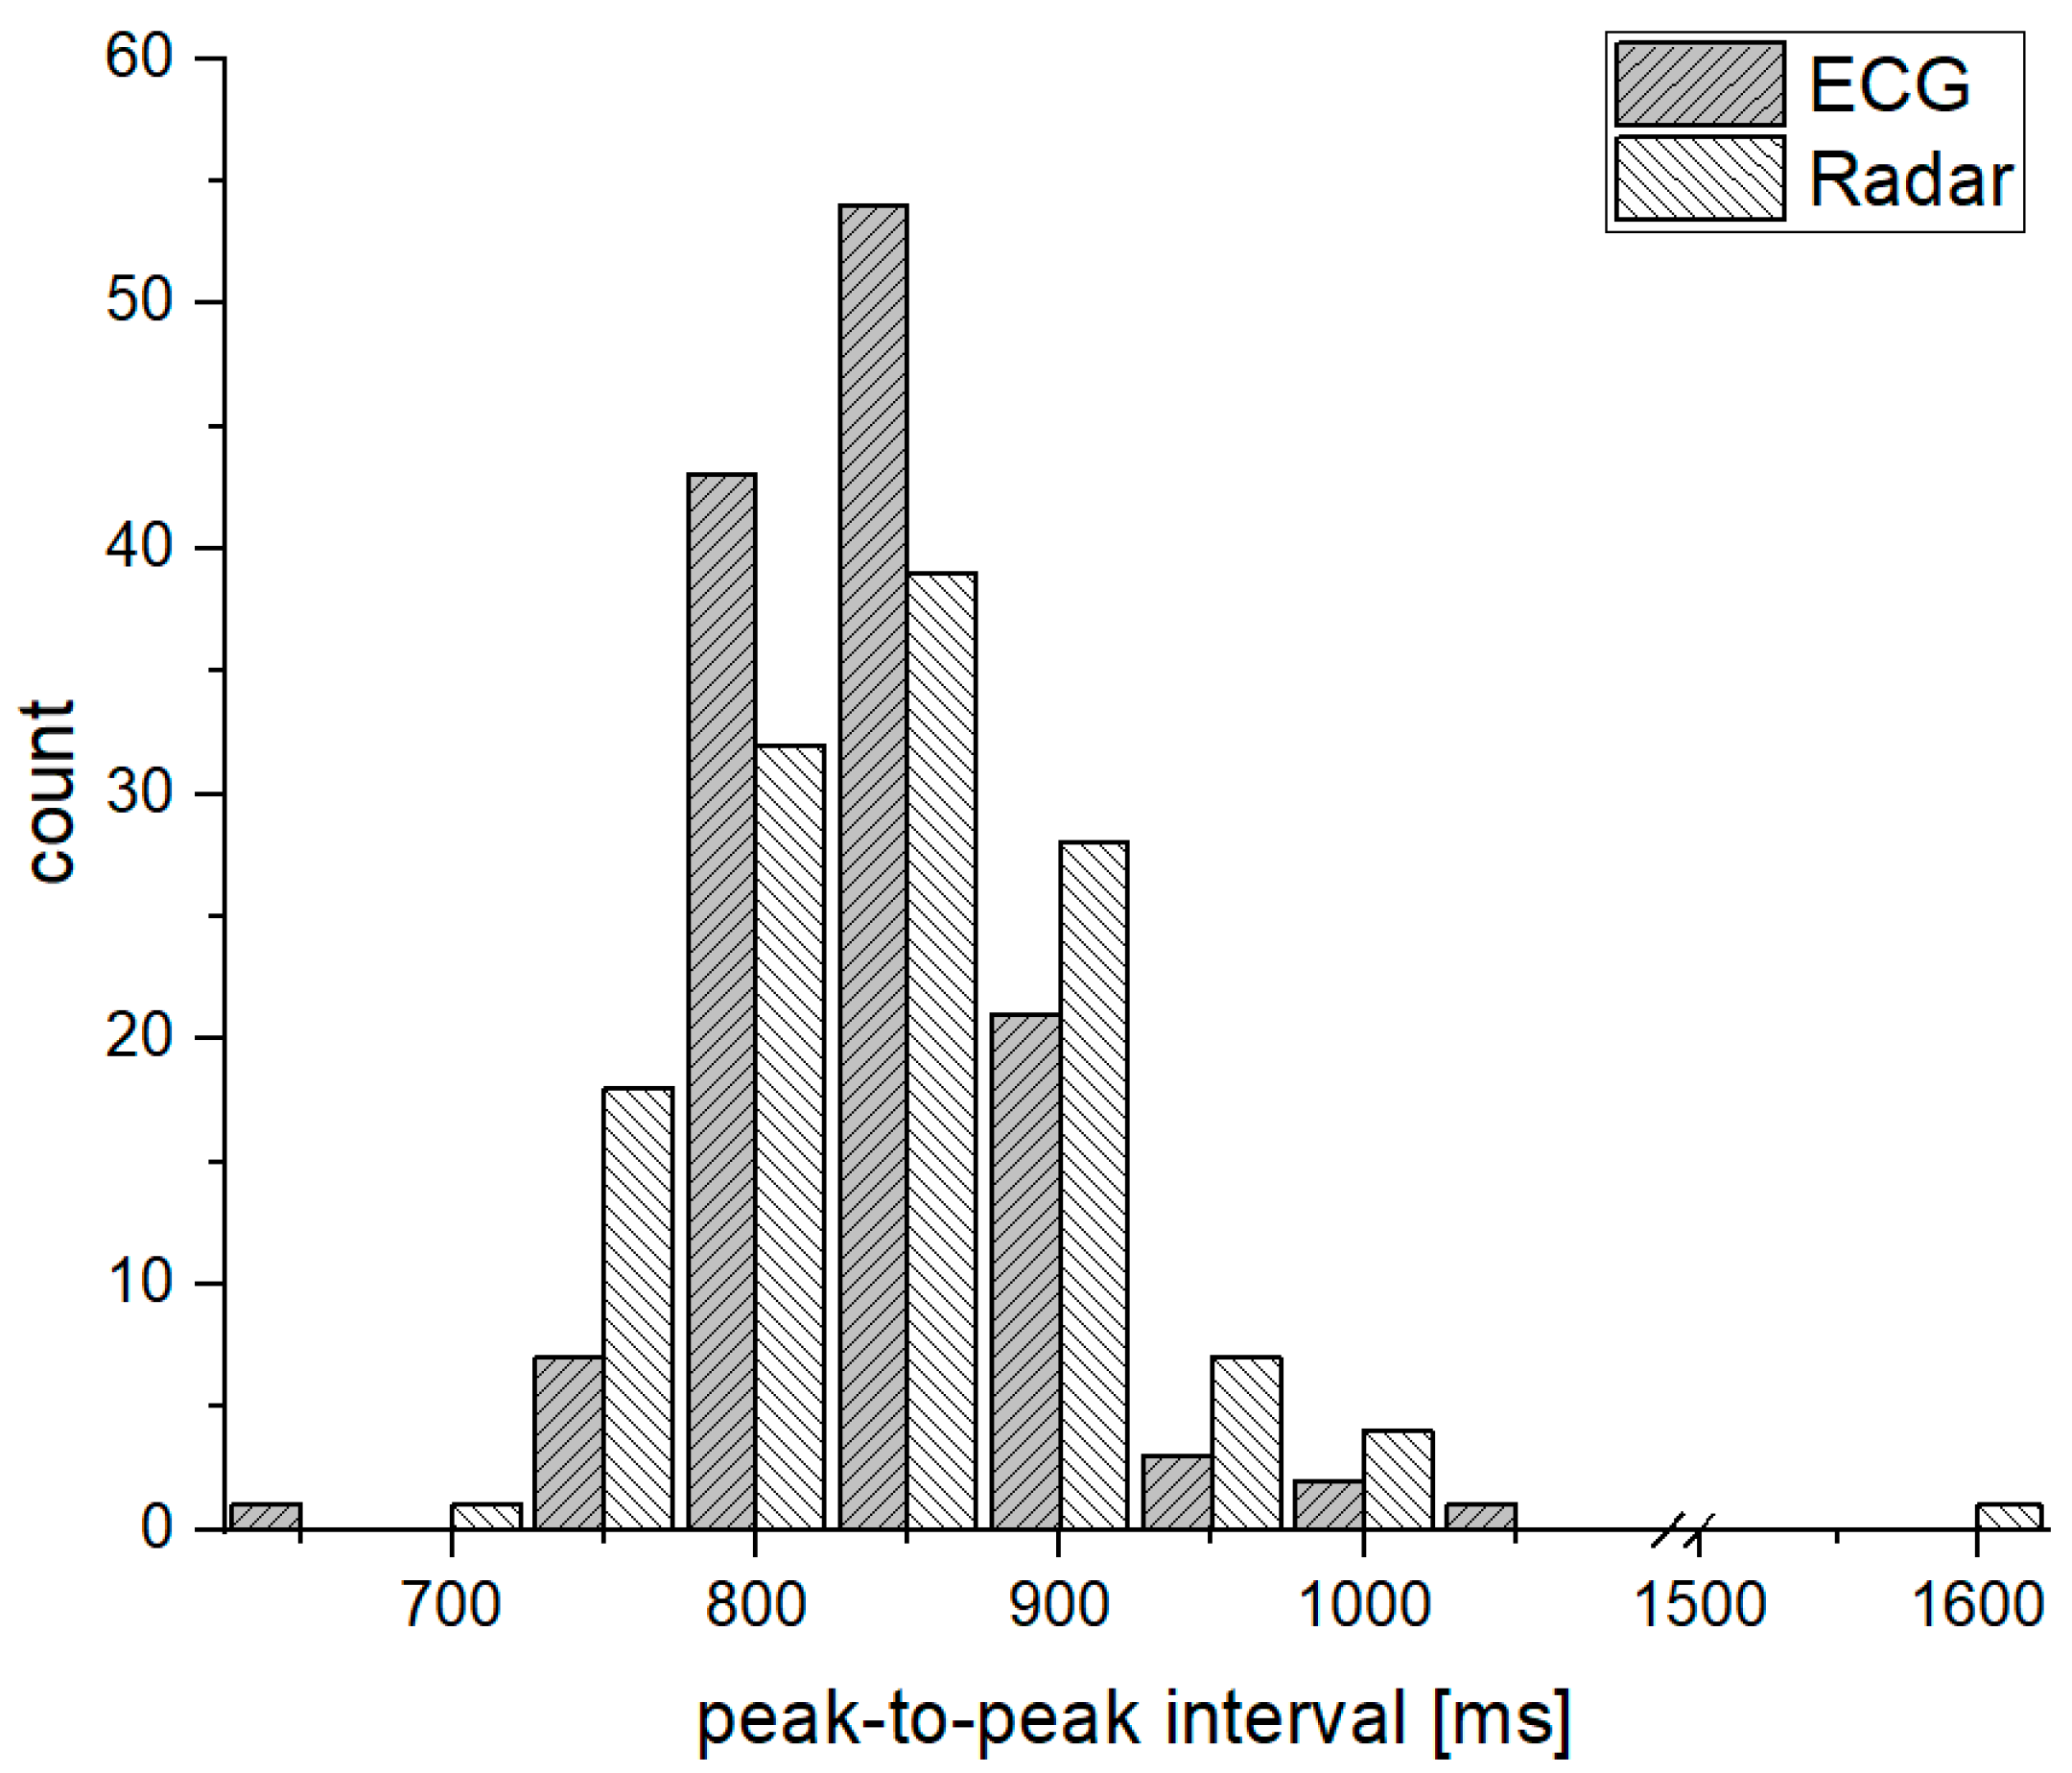
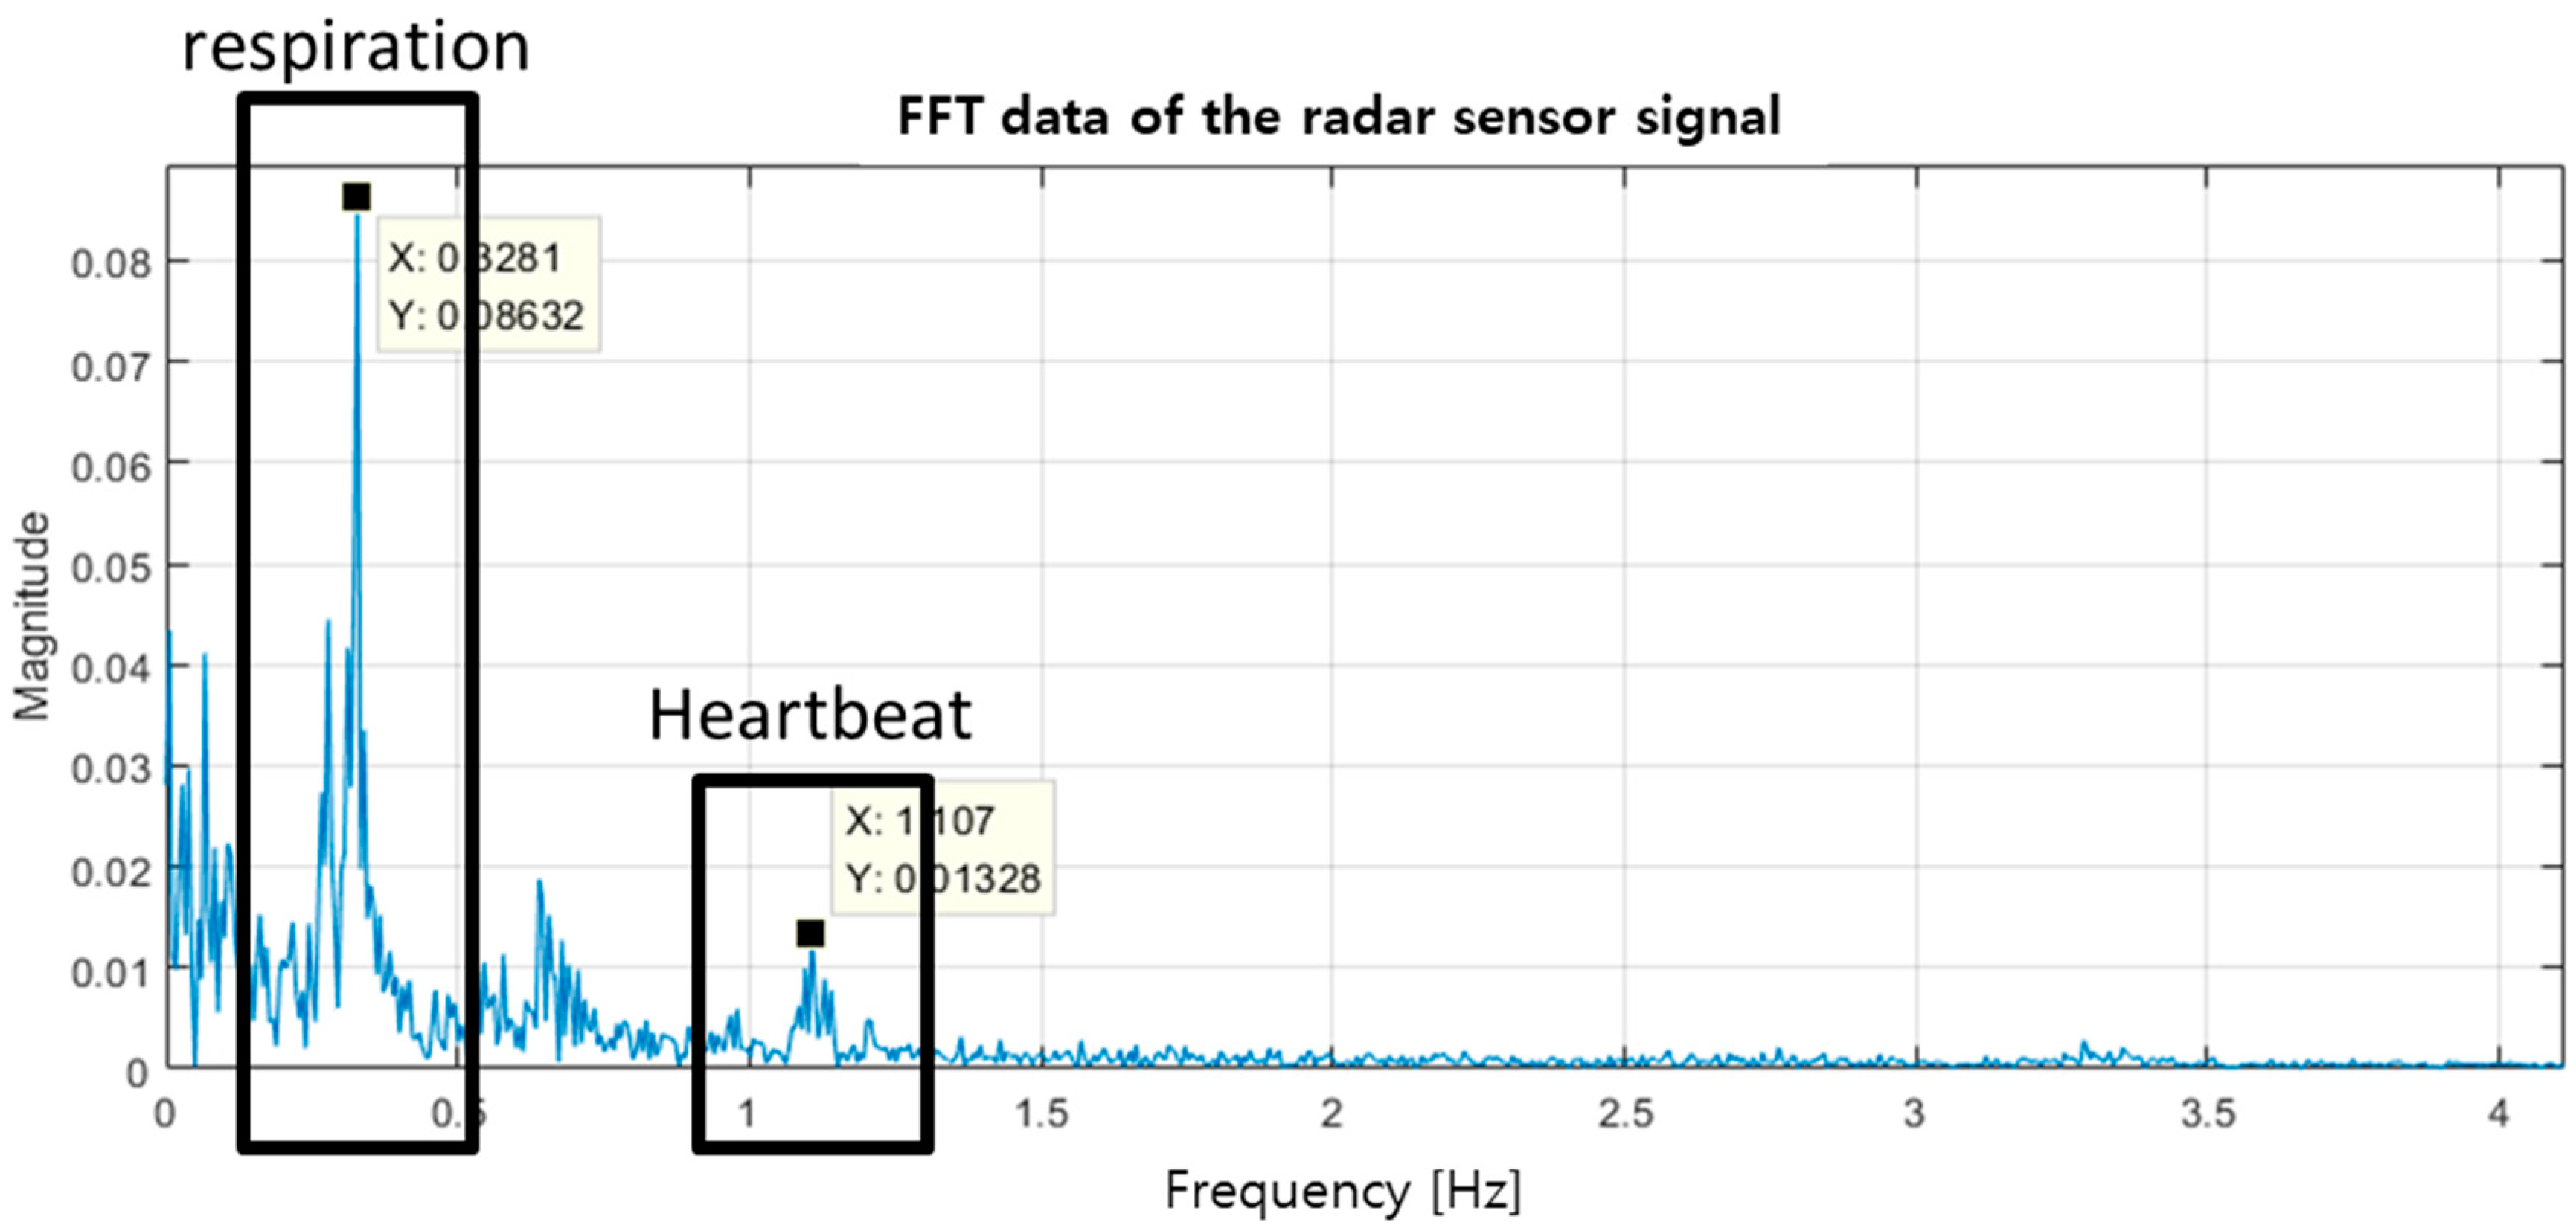
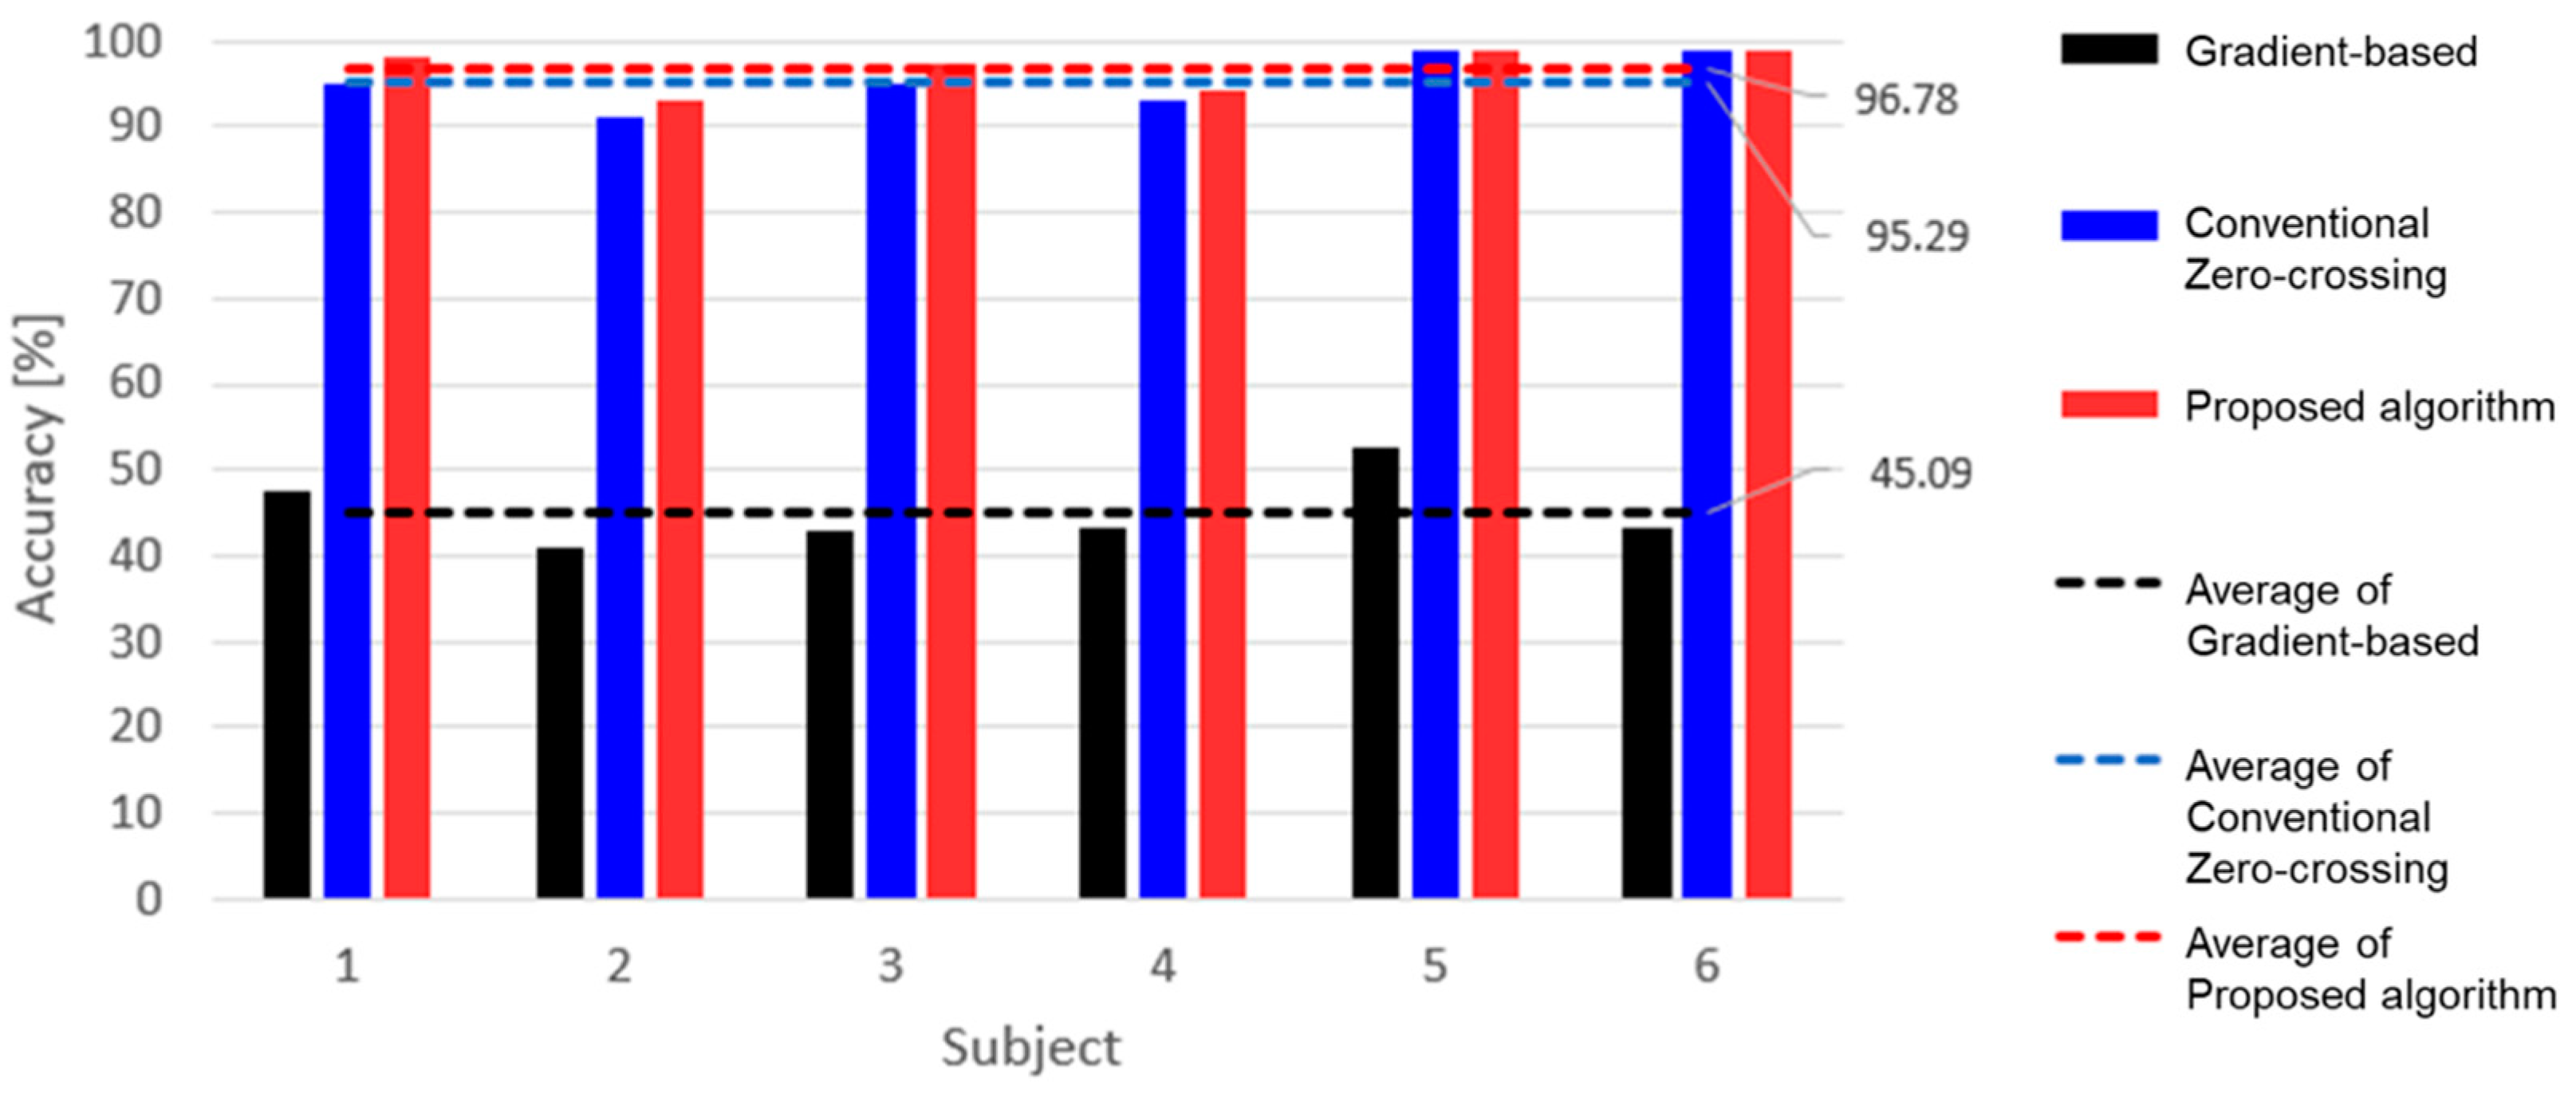
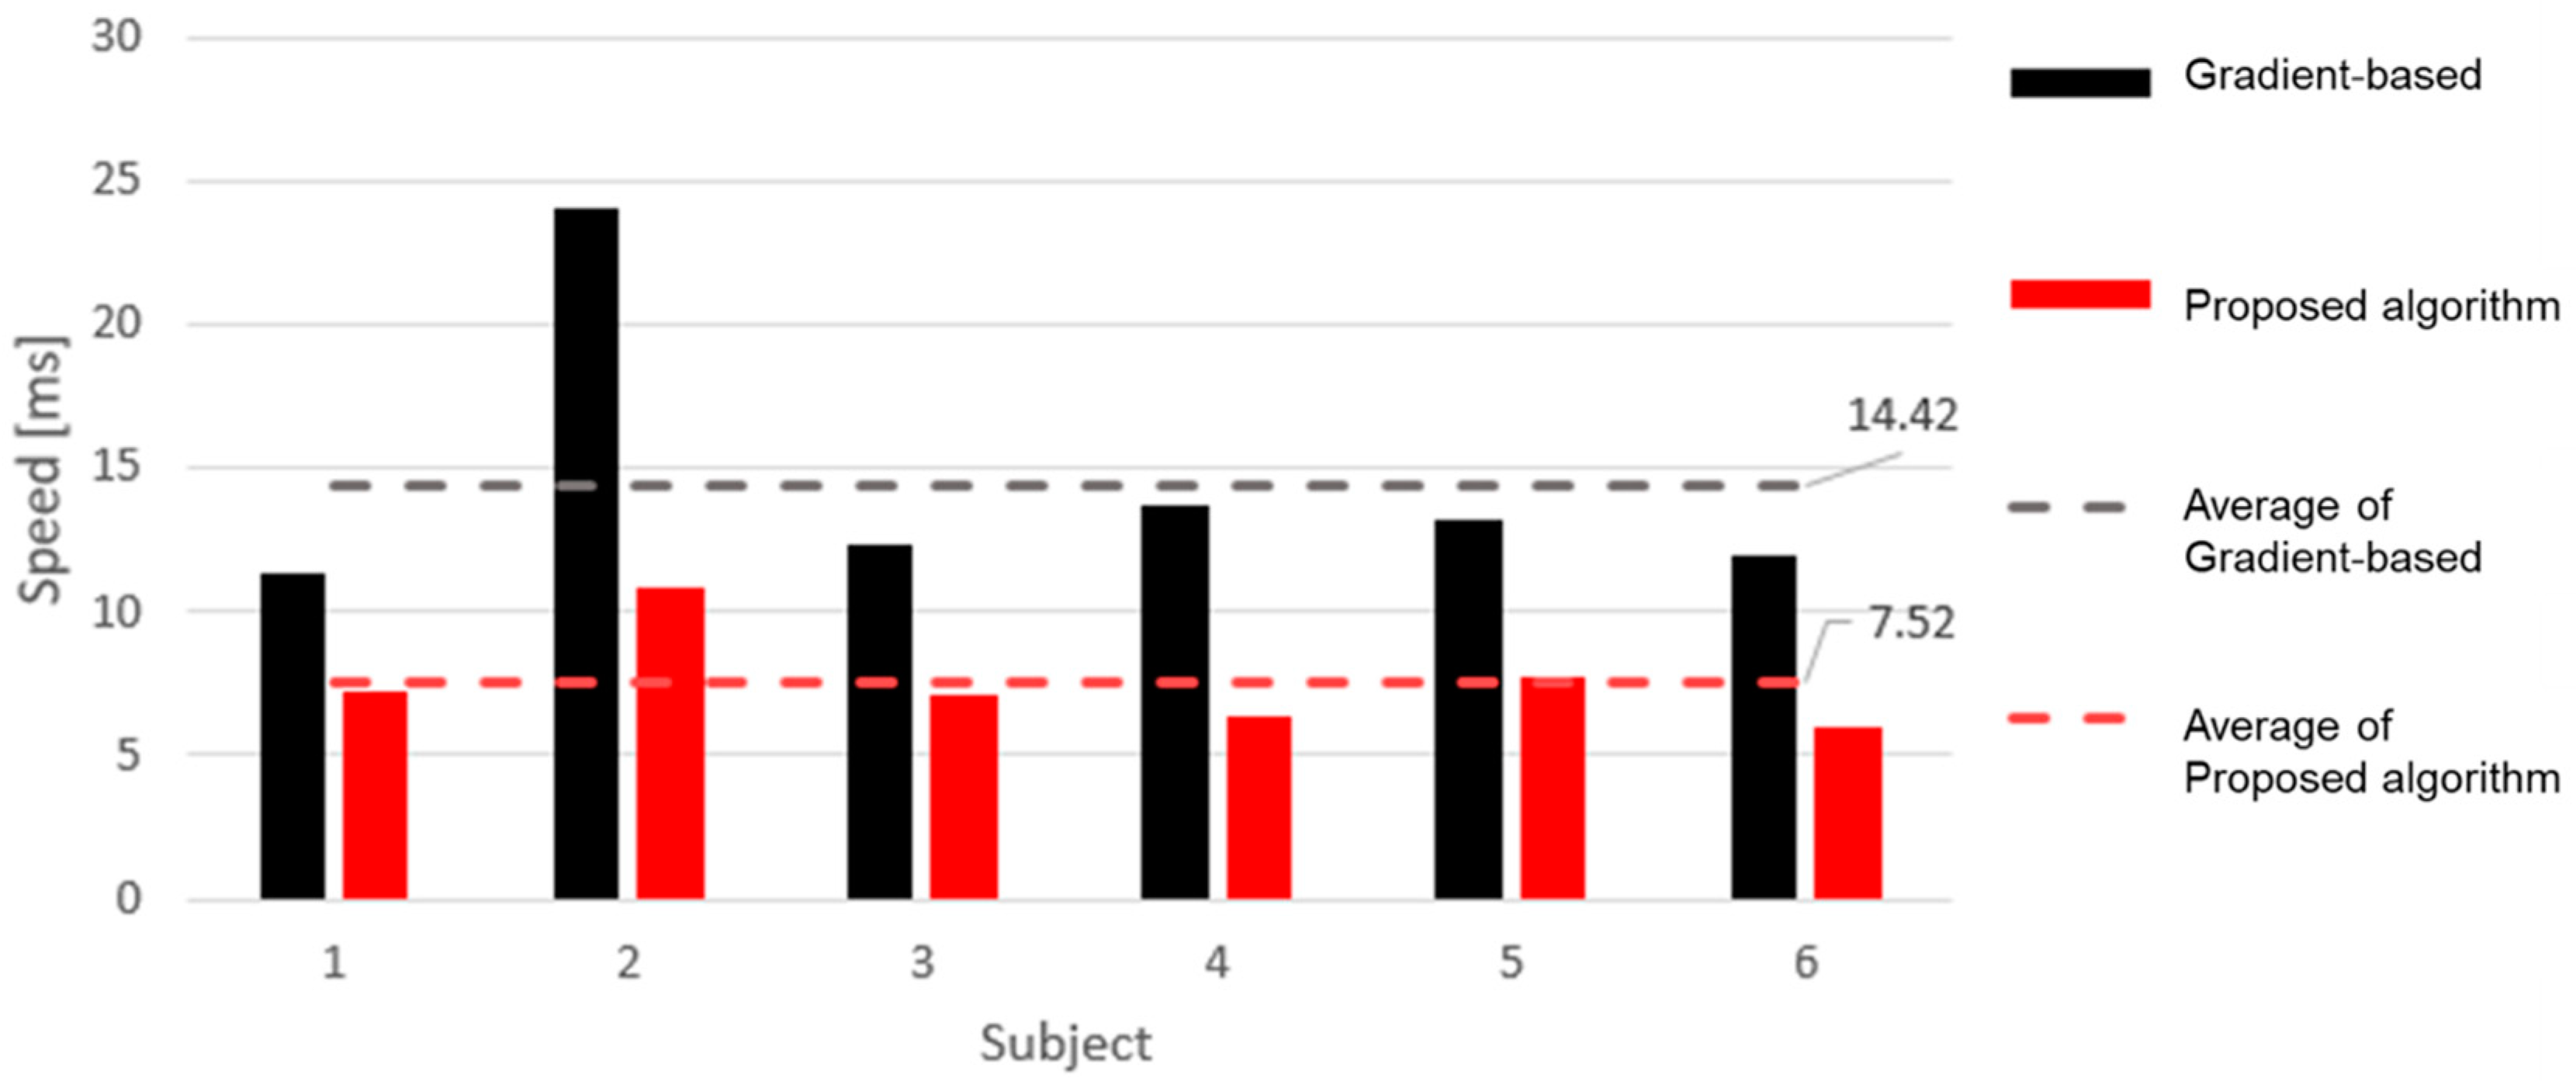
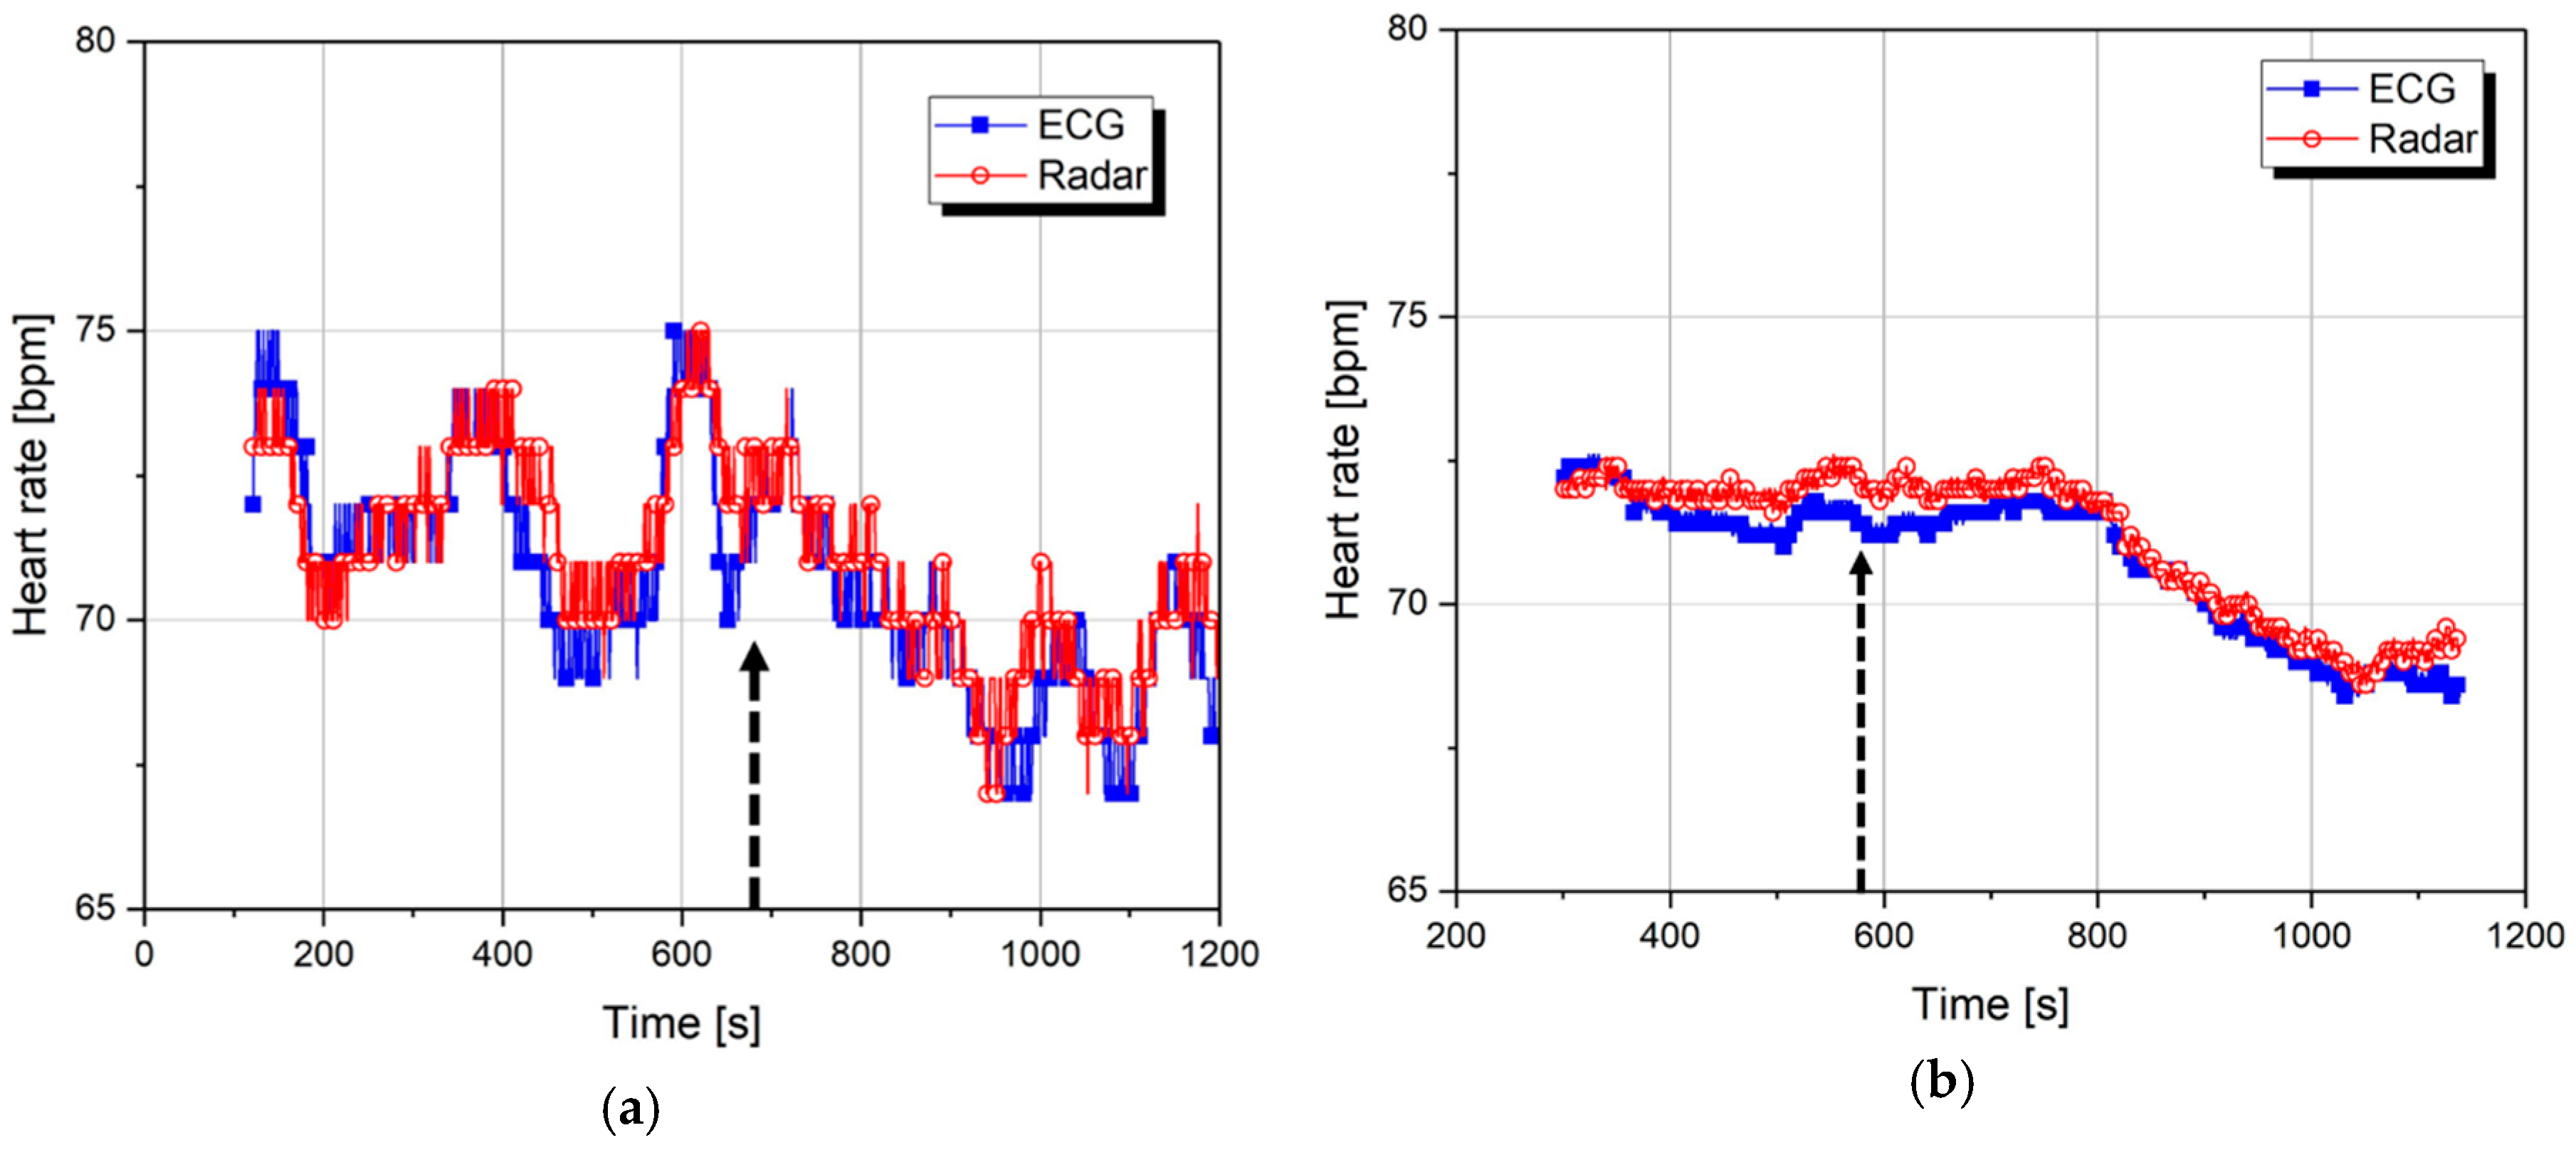
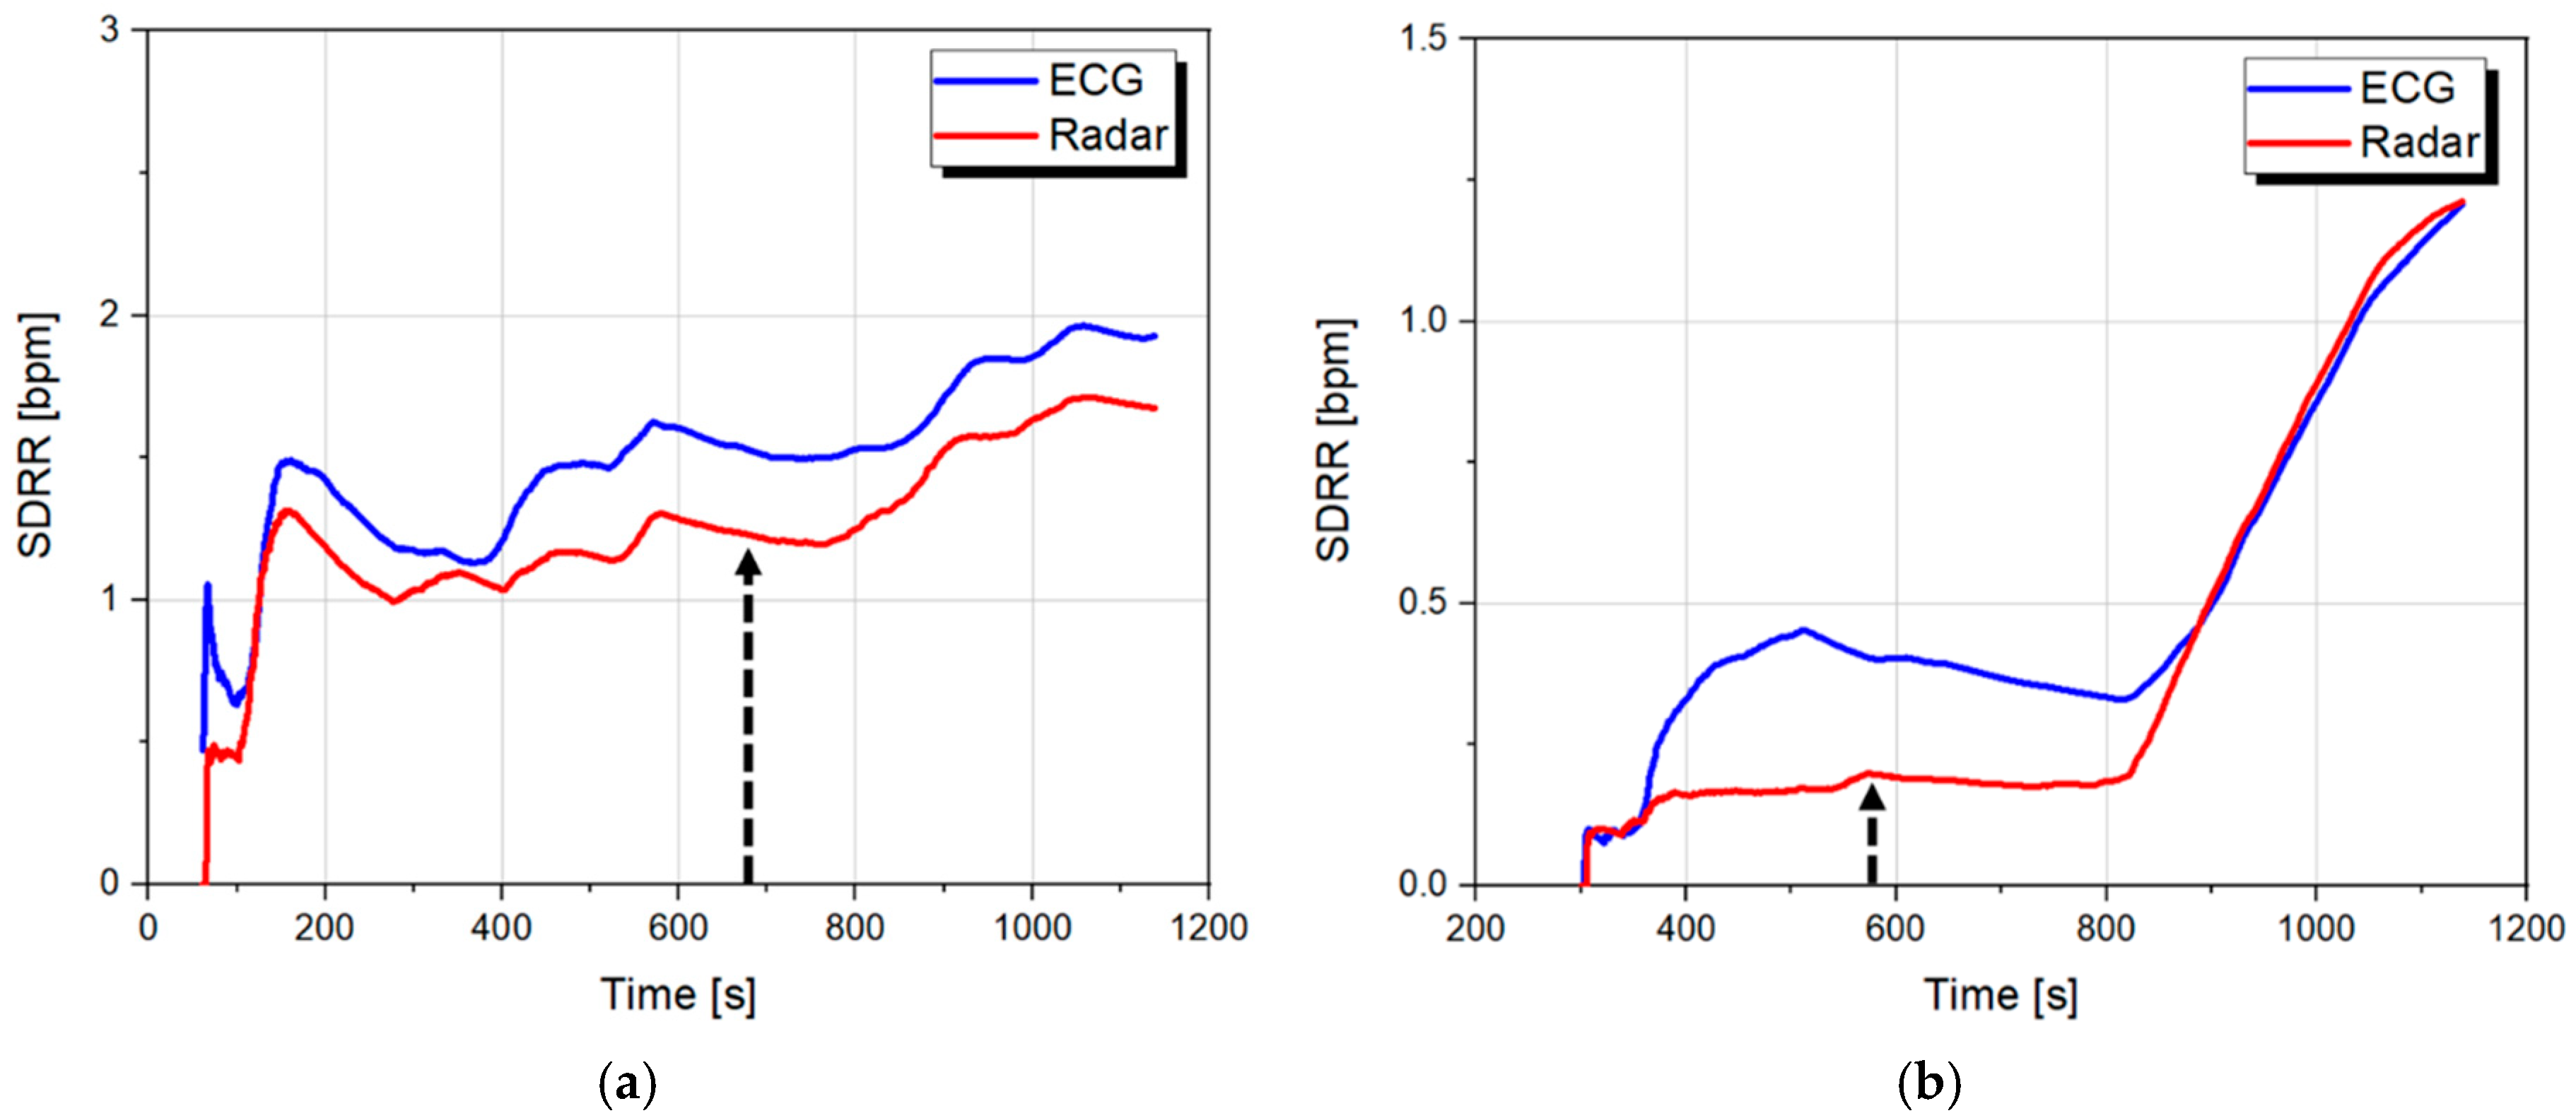
4. Results and Discussion
5. Conclusions
Author Contributions
Funding
Conflicts of Interest
References
- Stutts, J.C.; Wilkins, J.W.; Osberg, S.J.; Vaughn, B.V. Driver risk factors for sleep-related crashes. Accid. Anal. Prev. 2003, 25, 321–331. [Google Scholar] [CrossRef]
- Sahayadha, A.; Sundaraj, K.; Murugappan, M. Detecting Driver Drowsiness Based on Sensors: A Review. Sensors 2012, 12, 16937–16953. [Google Scholar] [CrossRef] [PubMed]
- Zhang, N.; Fard, M.; Bhuiyan, M.H.U.; Verhagen, D.; Azari, M.F.; Robinson, S.R. The effects of physical vibration on heart rate variability as a measure of drowsiness. Ergonomics 2018, 61, 1259–1272. [Google Scholar] [CrossRef] [PubMed]
- Brown, T.; Lee, J.; Schwarz, C.; Dary Fiorentino, D.; McDonald, A. Assessing the feasibility of vehicle-based sensors to detect drowsy driving; Report No. DOT HS 811 886; National Highway Traffic Safety Administration: Washington, DC, USA, February 2014. Available online: https://www.nhtsa.gov/sites/nhtsa.dot.gov/files/811886-assess_veh-based_sensors_4_drowsy-driving_detection.pdf (accessed on 24 December 2018).
- Noda, A.; Miyaji, M.; Wakuda, Y.; Hara, Y.; Yasuma, F.; Fukuda, T.; Iwamoto, K.; Ozak, N. Simultaneous Measurement of Heart Rate Variability and Blinking Duration to Predict Sleep Onset and Drowsiness in Drivers. J. Sleep Disord. Ther. 2015, 4, 1000213–1000215. [Google Scholar] [CrossRef]
- Kaida, K.; Akerstedt, T.; Kecklund, G.; Nilsson, J.P.; Axelsson, J. Use of Subjective and Physiological Indicators of Sleepiness to Predict Performance during a Vigilance Task. Ind. Health 2007, 45, 520–526. [Google Scholar] [CrossRef] [PubMed]
- Rodriguez-Ibañez, N.; García-Gonzalez, M.; Aurora-Filigran, M.; Fernández-Chimeno, M.; Ramos-Castro, J. Changes in Heart Rate Variability Indexes due to Drowsiness in Professional Drivers Measured in a Real Environment. In Proceedings of the 2012 Computing in Cardiology, Krakow, Poland, 9–12 September 2012. [Google Scholar]
- Michail, E.; Kokonozi, A.; Chouvarda, L.; Maglaveras, N. EEG and HRV markers of sleepiness and loss of control during car driving. In Proceedings of the 30th Annual International Conference of the IEEE Engineering in Medicine and Biology Society, Vancouver, BC, Canada, 20–24 August 2008. [Google Scholar]
- Kryger, M.; Roth, T.; Dement, W. Principles and Practice of Sleep Medicine, 5th ed.; Elsevier Saunders: Philadelphia, PA, USA, 2011; pp. 16–26. ISBN 978-1-4160-6645-3. [Google Scholar]
- Cantero, J.L.; Atienza, M.; Salas, R.M. Human alpha ocsillations in wakefulness, drowsiness period, and REM sleep: Different electroencephalographic phenomena within the alpha band. Neurophysiol. Clin. 2002, 32, 54–71. [Google Scholar] [CrossRef]
- Sun, Y.; Yu, X. An Innovative Nonintrusive Driver Assistance System for Vital Signal Monitoring. IEEE J. Biomed. Health Inform. 2014, 18, 1932–1939. [Google Scholar] [CrossRef] [PubMed]
- Luz, E.J.S.; Schwartz, W.R.; Cámara-Chávez, G.; Menoii, D. ECG-based heartbeat classification for arrhythmia detection: A survey. Comput. Methods Programs Biomed. 2016, 127, 144–164. [Google Scholar] [CrossRef] [PubMed]
- Acharya, U.R.; Joseph, K.P.; Kannathal, N.; Lim, C.M.; Suri, J.S. Heart rate variability: A review. Med. Biol. Eng. Comput. 2006, 44, 1031–1051. [Google Scholar] [CrossRef] [PubMed]
- Das, S.; Mukherjee, S.; Chatterjee, S.; Chatterjee, H.K. Noise Elimination and ECG R peak detection using wavelet transform. In Proceedings of the IEEE 7th Annual Ubiquitous Computing, Electronics & Mobile Communication Conference, New York, NY, USA, 20–22 October 2016. [Google Scholar]
- Rodríguez-Ibáñez, N.; García-González, M.A.; Fernández-Chimeno, M.; Ramos-Castro, J. Drowsiness Detection by Thoracic Effort Signal Analysis in Real Driving Environment. In Proceedings of the 33rd Annual International Conference of the IEEE Engineering in Medicine and Biology Society, Boston, MA, USA, 30 August–3 September 2011. [Google Scholar]
- Boric-Lubecke, O.; Lubecke, V.M.; Host-Madsen, A.; Samardzija, D.; Cheung, K. Doppler Radar Sensing of Multiple Subjects in Single and Multiple Antenna Systems. In Proceedings of the 2005 IEEE 7th International Conference on Telecommunication in Modern Satellite, Cable and Broadcasting Services, Nis, Serbia, 28–30 September 2005. [Google Scholar]
- Rissacher, D.; Galy, D. Cardiac Radar for Biometric Identification using Nearest Neighbour of Continuous Wavelet Transform Peaks. In Proceedings of the IEEE International Conference on Identity, Security and Behavior Analysis, Hong Kong, China, 23–25 March 2015. [Google Scholar]
- Mader, S.S.; Windelspecht, M. Human Biology, 12th ed.; McGraw Hill: New York, NY, USA, 2012; pp. 71–73. ISBN 978-0073525464. [Google Scholar]
- Boric-Lubecke, O.; Lubecke, V.M.; Droitcour, A.D.; Park, B.K.; Singh, A. Doppler Radar Physiological Sensing; John Wiley: Canada, 2016; pp. 48–50. ISBN 978-1-118-02402-7. [Google Scholar]
- Choe, S.-R.; Cho, W.-D. Simplified real-time heartbeat detection in ballistocardiography using a dispersion-maximum method. Biomed. Res. 2017, 28, 3974–3985. [Google Scholar]
- Ye, C.; Toyoda, K.; Ohtsuki, T. Robust heartbeat detection with Doppler radar based on stochastic gradient approach. In Proceedings of the IEEE International Conference on Communications, Kansas City, MO, USA, 20–24 May 2018. [Google Scholar]
- Brodsky, M.; Wu, D.; Denes, P.; Kanakis, C.; Rosen, K.M. Arrhythmias documented by 24 hour continuous electrocardiographic monitoring in 50 male medical students without apparent heart disease. Am. J. Cardiol. 1977, 39, 390–395. [Google Scholar] [CrossRef]
- Goldberger, A.L.; Amaral, L.A.N.; Glass, L.; Hausdorff, J.M.; Ivanov, P.C.; Mark, R.G.; Mietus, J.E.; Moody, G.B.; Peng, C.-K.; Stanley, H.E. Components of a New Research Resource for Complex Physiologic Signals. Circulation 2000, 101, 215–220. [Google Scholar] [CrossRef]
- Kim, H.G.; Cheon, E.J.; Bai, D.S.; Lee, Y.H.; Koo, B.H. Stress and Heart Rate Variability: A Meta-Analysis and Review of the Literature. Psychiatry Investig. 2018, 15, 235–245. [Google Scholar] [CrossRef] [PubMed]
- Min, K.B.; Min, J.Y.; Paek, D.; Cho, S.I.; Son, M. Is 5-Minute Heart Rate Variability a Useful Measure for Monitoring the Autonomic Nervous System of Workers? Int. Heart J. 2008, 49, 175–181. [Google Scholar] [CrossRef] [PubMed]
- Flores, M.J.; Armingol, J.M.; Escalera, A. Real-Time Drowsiness Detection System for an Intelligent Vehicle. In Proceedings of the 2008 IEEE Intelligent Vehicles Symposium, Eindhoven, The Netherlands, 4–6 June 2008. [Google Scholar]
- Wilkinson, V.E.; Jackson, M.L.; Westlake, J.; Stevens, B.; Barnes, M.; Swann, P.; Rajaratnam, S.M.W.; Howard, M.E. The Accuracy of Eyelid Movement Parameters for Drowsiness Detection. J. Clin. Sleep Med. 2013, 9, 1315–1324. [Google Scholar] [CrossRef] [PubMed]
- Park, B.-K.; Boric-Lubecke, O.; Lubecke, V.M. Arctanget Demodulation With DC Offset Compensation in Quadrature Doppler Radar Receiver Systems. IEEE Trans. Microw. Theory Tech. 2007, 55, 1073–1079. [Google Scholar] [CrossRef]
- Kiriazi, J.E.; Boric-Lubecke, O.; Lubecke, V.M. Dual-Frequency Technique for Assessment of Cardiopulmonary Effective RCS and Displacement. IEEE Sens. J. 2012, 12, 574–582. [Google Scholar] [CrossRef]
- Chan, K.H.; Lin, J.C. Microprocessor-based cardiopulmonary rate monitor. Med. Biol. Eng. Comput. 1987, 25, 41–44. [Google Scholar] [CrossRef] [PubMed]
- Massagram, W.; Lubecke, V.M.; Høst-Madsen, A.; Boric-Lubecke, O. Assessment of Heart Rate Variability and Respiratory Sinus Arrhythmia via Doppler Radar. IEEE Trans. Microw. Theory Tech. 2009, 57, 2542–2549. [Google Scholar] [CrossRef]
- Long, X.; Arends, J.B.; Aarts, R.M.; Haakma, R.; Fonseca, P.; Rolink, J. Time delay between cardiac and brain activity during sleep transitions. Appl. Phys. Lett. 2015, 106, 143702. [Google Scholar] [CrossRef]


| Variable | Units | Definition | Characteristics |
|---|---|---|---|
| SDNN | ms | Standard deviation of all N-N intervals | It reflects all the long-term components and changes in the 24-h cycle rhythm. |
| RMSSD | ms | The square root of the mean of the sum of the squares of differences between adjacent N-N intervals | It is associated with short-term HRV changes and reflects changes in autonomic tone, independent of day and night changes. |
| Subjects | Age | Gender (M/F) | Drinking Condition | Smoking Condition | Caffeine Consumption Condition |
|---|---|---|---|---|---|
| 1 | 23 | F | None for the month | Non-smoker | None for 12 h |
| 2 | 23 | F | None for the week | Non-smoker | None for 12 h |
| 3 | 25 | M | None for the week | Non-smoker | None for 12 h |
| 4 | 23 | F | None for the week | Non-smoker | None for 16 h |
| 5 | 22 | F | None for the month | Non-smoker | None for 20 h |
| 6 | 22 | M | None for the week | Non-smoker | None for 20 h |
| Subject | Heart Rate by 60 s Window (BPM) | Heart Rate by 300 s Window (BPM) | ||||||
|---|---|---|---|---|---|---|---|---|
| ECG | Radar | ECG | Radar | |||||
| Wake | Drowsiness | Wake | Drowsiness | Wake | Drowsiness | Wake | Drowsiness | |
| 1 | 67.00 | 66.10 | 67.00 | 65.19 | 68.60 | 65.73 | 68.40 | 65.93 |
| 2 | 81.12 | 82.35 | 74.44 | 74.02 | 81.32 | 81.48 | 76.10 | 74.60 |
| 3 | 84.09 | 73.85 | 81.17 | 73.29 | 84.72 | 75.67 | 81.31 | 75.26 |
| 4 | 86.23 | 84.08 | 76.83 | 79.60 | 87.00 | 83.65 | 79.00 | 80.04 |
| 5 | 71.87 | 69.05 | 72.04 | 69.57 | 71.69 | 69.94 | 72.02 | 70.24 |
| 6 | 75.32 | 63.63 | 75.41 | 63.85 | 73.80 | 64.79 | 73.20 | 64.87 |
| Subject | SDRR by 60 s Window (BPM) | SDRR by 300 s Window (BPM) | ||||||
|---|---|---|---|---|---|---|---|---|
| ECG | Radar | ECG | Radar | |||||
| Wake | Drowsiness | Wake | Drowsiness | Wake | Drowsiness | Wake | Drowsiness | |
| 1 | * | 1.57 | * | 1.69 | * | 1.03 | * | 0.88 |
| 2 | 2.00 | 1.96 | 2.79 | 3.19 | 0.55 | 0.71 | 0.83 | 1.31 |
| 3 | 1.74 | 4.72 | 2.51 | 3.76 | 0.42 | 3.45 | 0.48 | 2.24 |
| 4 | 0.68 | 2.29 | 1.08 | 2.68 | * | 1.28 | * | 0.89 |
| 5 | 1.27 | 1.74 | 1.05 | 1.49 | 0.32 | 0.67 | 0.15 | 0.64 |
| 6 | 0.57 | 4.63 | 0.64 | 4.23 | * | 2.70 | * | 2.40 |
| Subject | SDNN by 60 s Window (ms) | SDNN by 300 s Window (ms) | ||||||
|---|---|---|---|---|---|---|---|---|
| ECG | Radar | ECG | Radar | |||||
| Wake | Drowsiness | Wake | Drowsiness | Wake | Drowsiness | Wake | Drowsiness | |
| 1 | 63.96 | 80.74 | 92.10 | 293.10 | 55.32 | 86.20 | 80.17 | 276.33 |
| 2 | 45.67 | 48.24 | 282.66 | 284.73 | 53.80 | 67.25 | 230.69 | 260.10 |
| 3 | 48.91 | 64.03 | 157.02 | 296.04 | 45.79 | 67.02 | 160.97 | 242.32 |
| 4 | 25.38 | 32.32 | 222.52 | 195.04 | 34.85 | 37.40 | 240.13 | 207.84 |
| 5 | 51.38 | 60.55 | 125.68 | 201.96 | 52.05 | 66.48 | 122.68 | 203.76 |
| 6 | 37.60 | 50.80 | 114.41 | 94.15 | 51.81 | 54.98 | 149.19 | 103.00 |
| Subject | RMSSD by 60 s window (ms) | RMSSD by 300 s window (ms) | ||||||
|---|---|---|---|---|---|---|---|---|
| ECG | Radar | ECG | Radar | |||||
| Wake | Drowsiness | Wake | Drowsiness | Wake | Drowsiness | Wake | Drowsiness | |
| 1 | 87.77 | 88.42 | 122.80 | 484.09 | 65.75 | 91.06 | 112.69 | 456.19 |
| 2 | 57.74 | 54.98 | 436.97 | 451.69 | 45.47 | 61.82 | 369.81 | 425.13 |
| 3 | 41.43 | 59.67 | 235.31 | 498.14 | 36.94 | 60.59 | 243.03 | 394.42 |
| 4 | 15.64 | 28.31 | 357.80 | 319.81 | 38.53 | 29.12 | 380.74 | 326.17 |
| 5 | 57.62 | 66.45 | 204.09 | 319.75 | 49.92 | 67.50 | 199.46 | 322.03 |
| 6 | 34.87 | 57.53 | 392.29 | 378.55 | 36.94 | 60.95 | 243.03 | 162.50 |
© 2019 by the authors. Licensee MDPI, Basel, Switzerland. This article is an open access article distributed under the terms and conditions of the Creative Commons Attribution (CC BY) license (http://creativecommons.org/licenses/by/4.0/).
Share and Cite
Kim, J.-Y.; Park, J.-H.; Jang, S.-Y.; Yang, J.-R. Peak Detection Algorithm for Vital Sign Detection Using Doppler Radar Sensors. Sensors 2019, 19, 1575. https://doi.org/10.3390/s19071575
Kim J-Y, Park J-H, Jang S-Y, Yang J-R. Peak Detection Algorithm for Vital Sign Detection Using Doppler Radar Sensors. Sensors. 2019; 19(7):1575. https://doi.org/10.3390/s19071575
Chicago/Turabian StyleKim, Ju-Yeon, Jae-Hyun Park, Se-Young Jang, and Jong-Ryul Yang. 2019. "Peak Detection Algorithm for Vital Sign Detection Using Doppler Radar Sensors" Sensors 19, no. 7: 1575. https://doi.org/10.3390/s19071575
APA StyleKim, J.-Y., Park, J.-H., Jang, S.-Y., & Yang, J.-R. (2019). Peak Detection Algorithm for Vital Sign Detection Using Doppler Radar Sensors. Sensors, 19(7), 1575. https://doi.org/10.3390/s19071575