A Flexible 5-In-1 Microsensor for Internal Microscopic Diagnosis of Vanadium Redox Flow Battery Charging Process


Abstract
:1. Introduction
2. Sensing Principle of Flexible 5-In-1 Microsensor
2.1. Micro Temperature Sensor
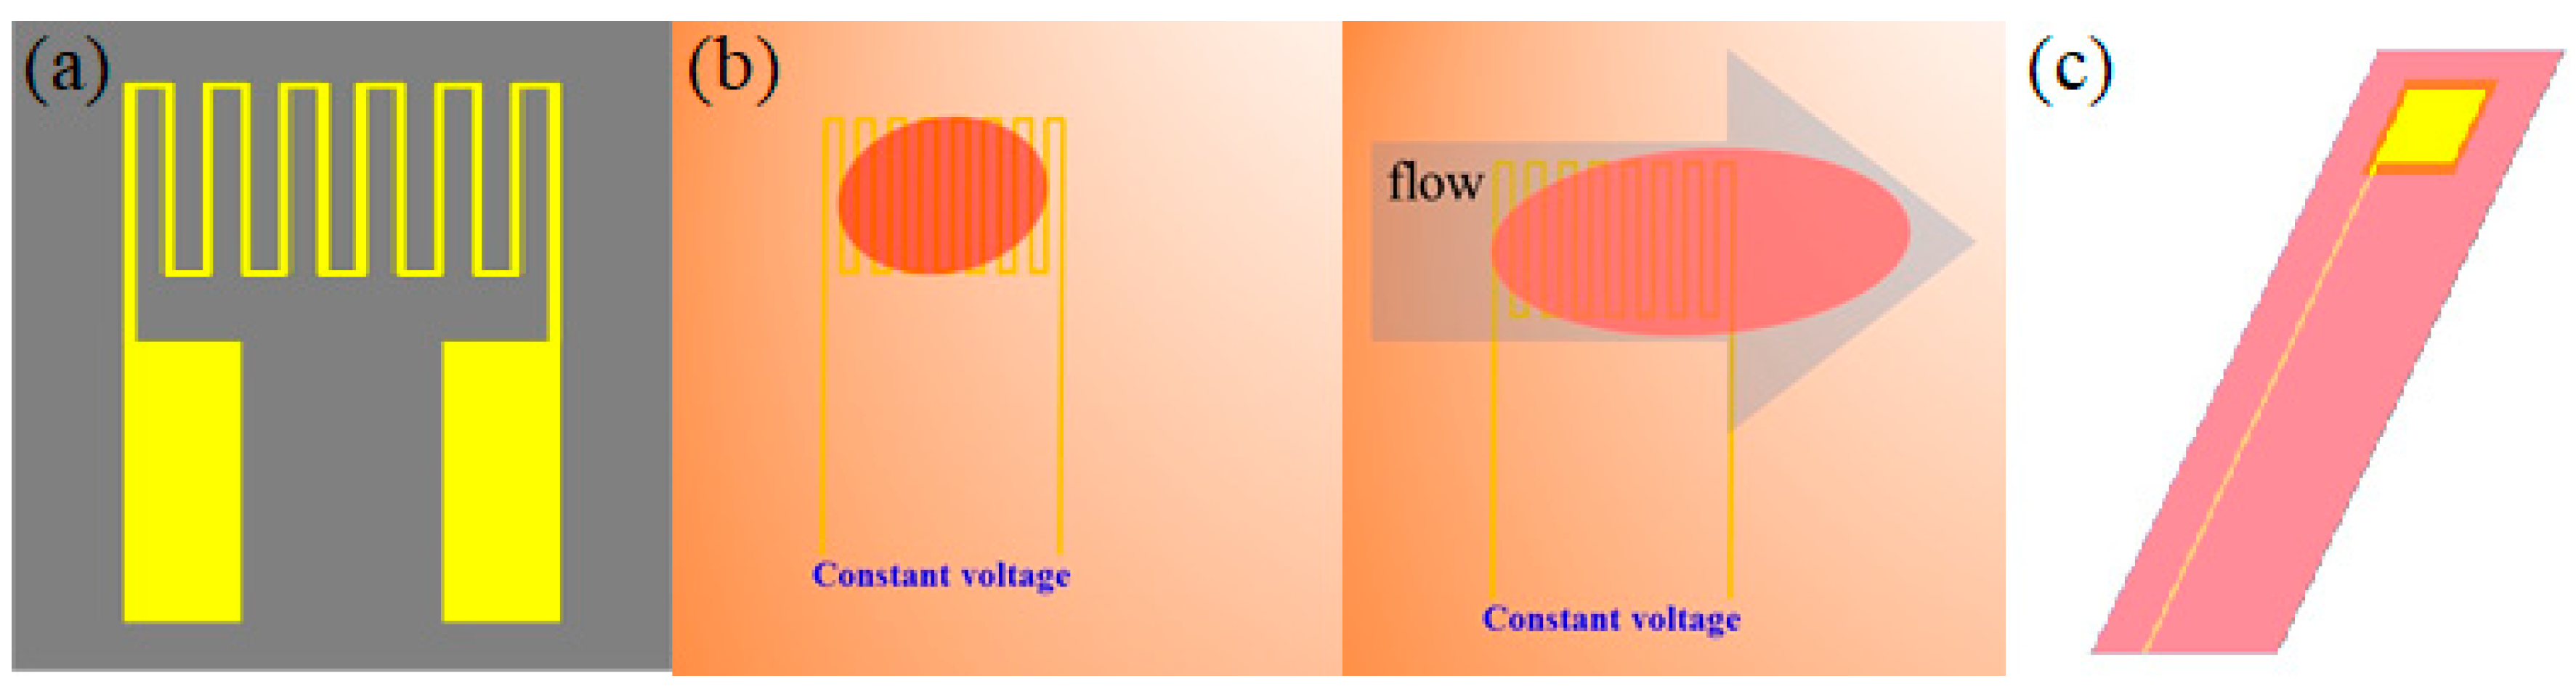
2.2. Micro Flow Sensor
2.3. Micro Voltage Sensor
2.4. Micro Current Sensor
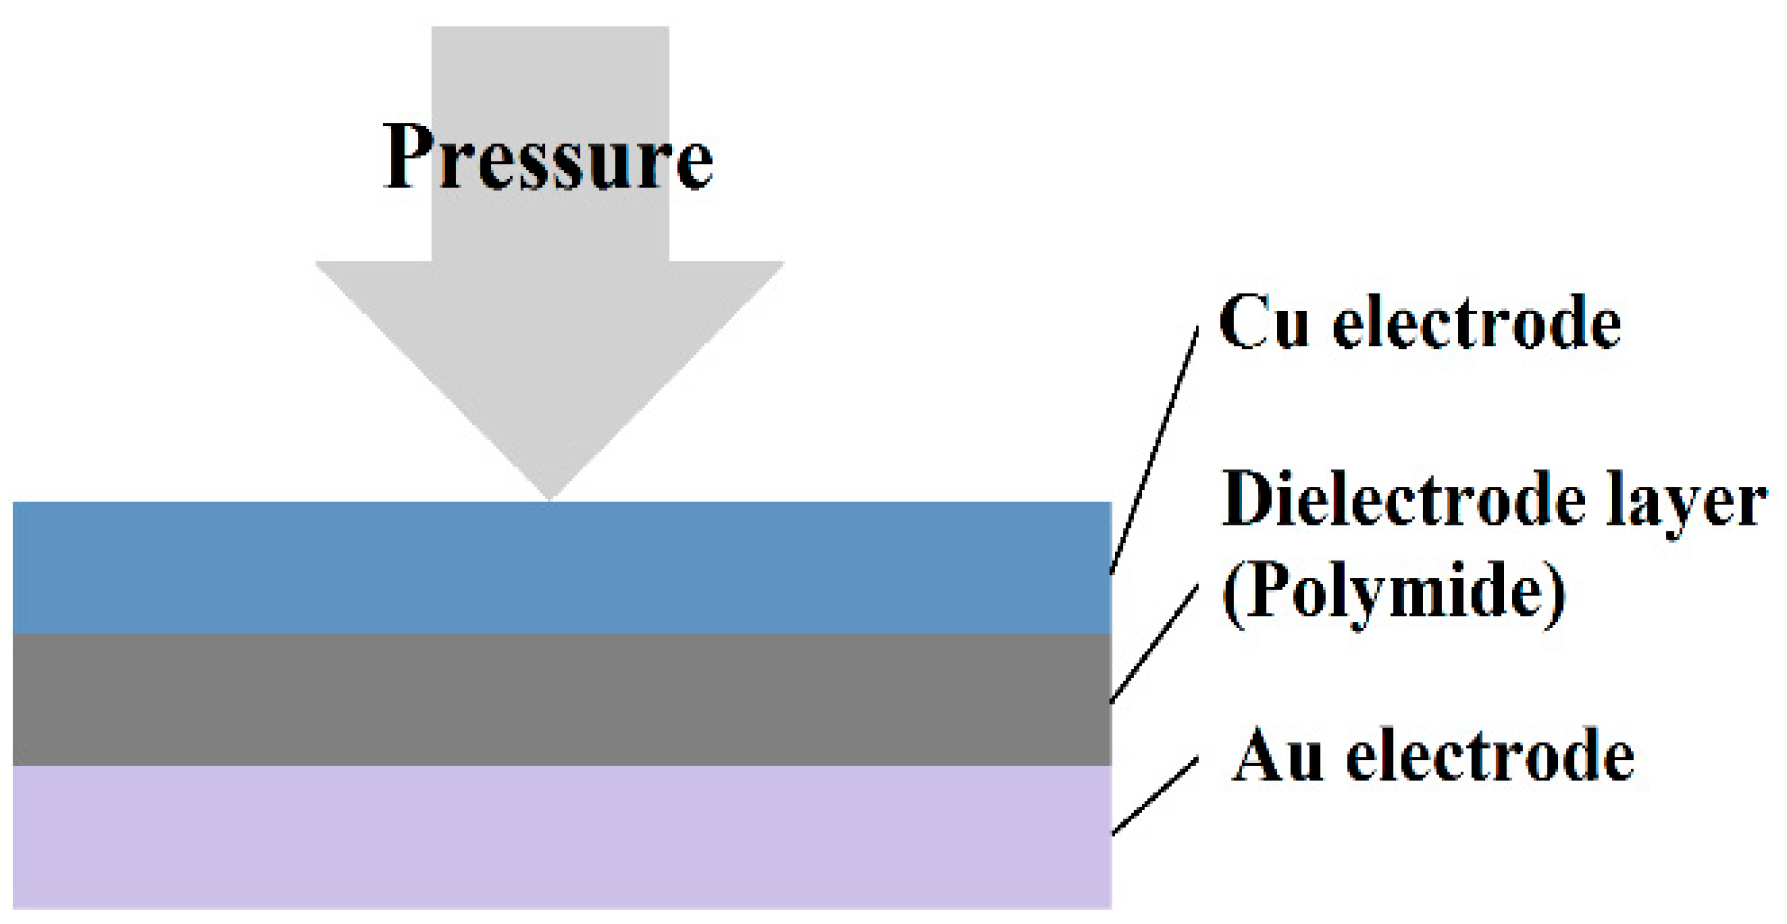
2.5. Micro Pressure Sensor
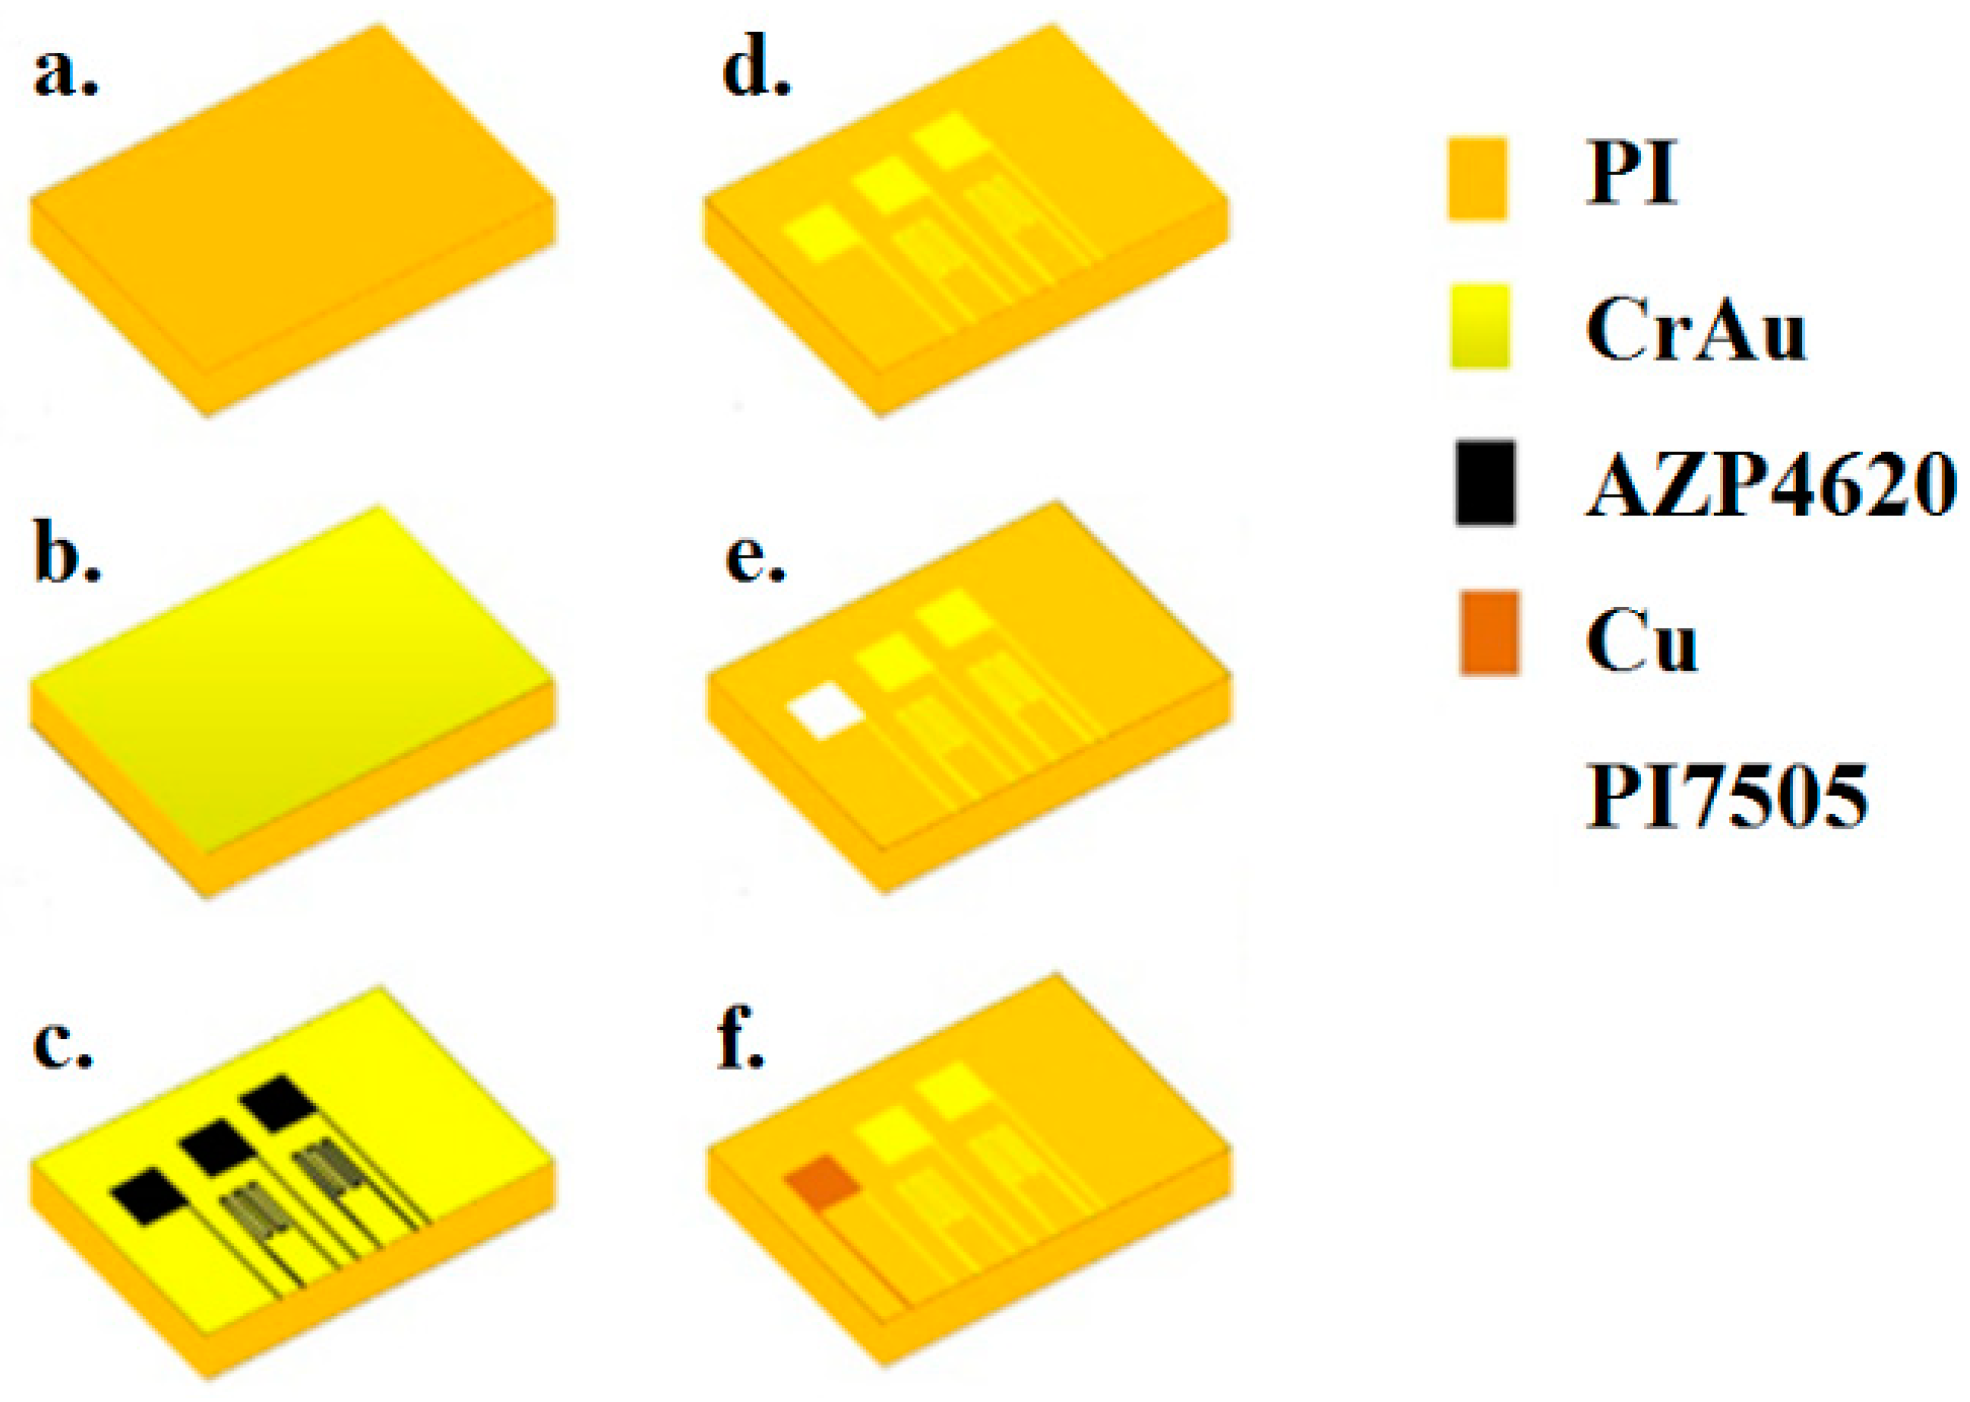
3. Fabrication and Correction of Flexible 5-in-1 Microsensor
3.1. Design of Flexible 5-In-1 Microsensor
3.2. Process of Flexible 5-In-1 Microsensor
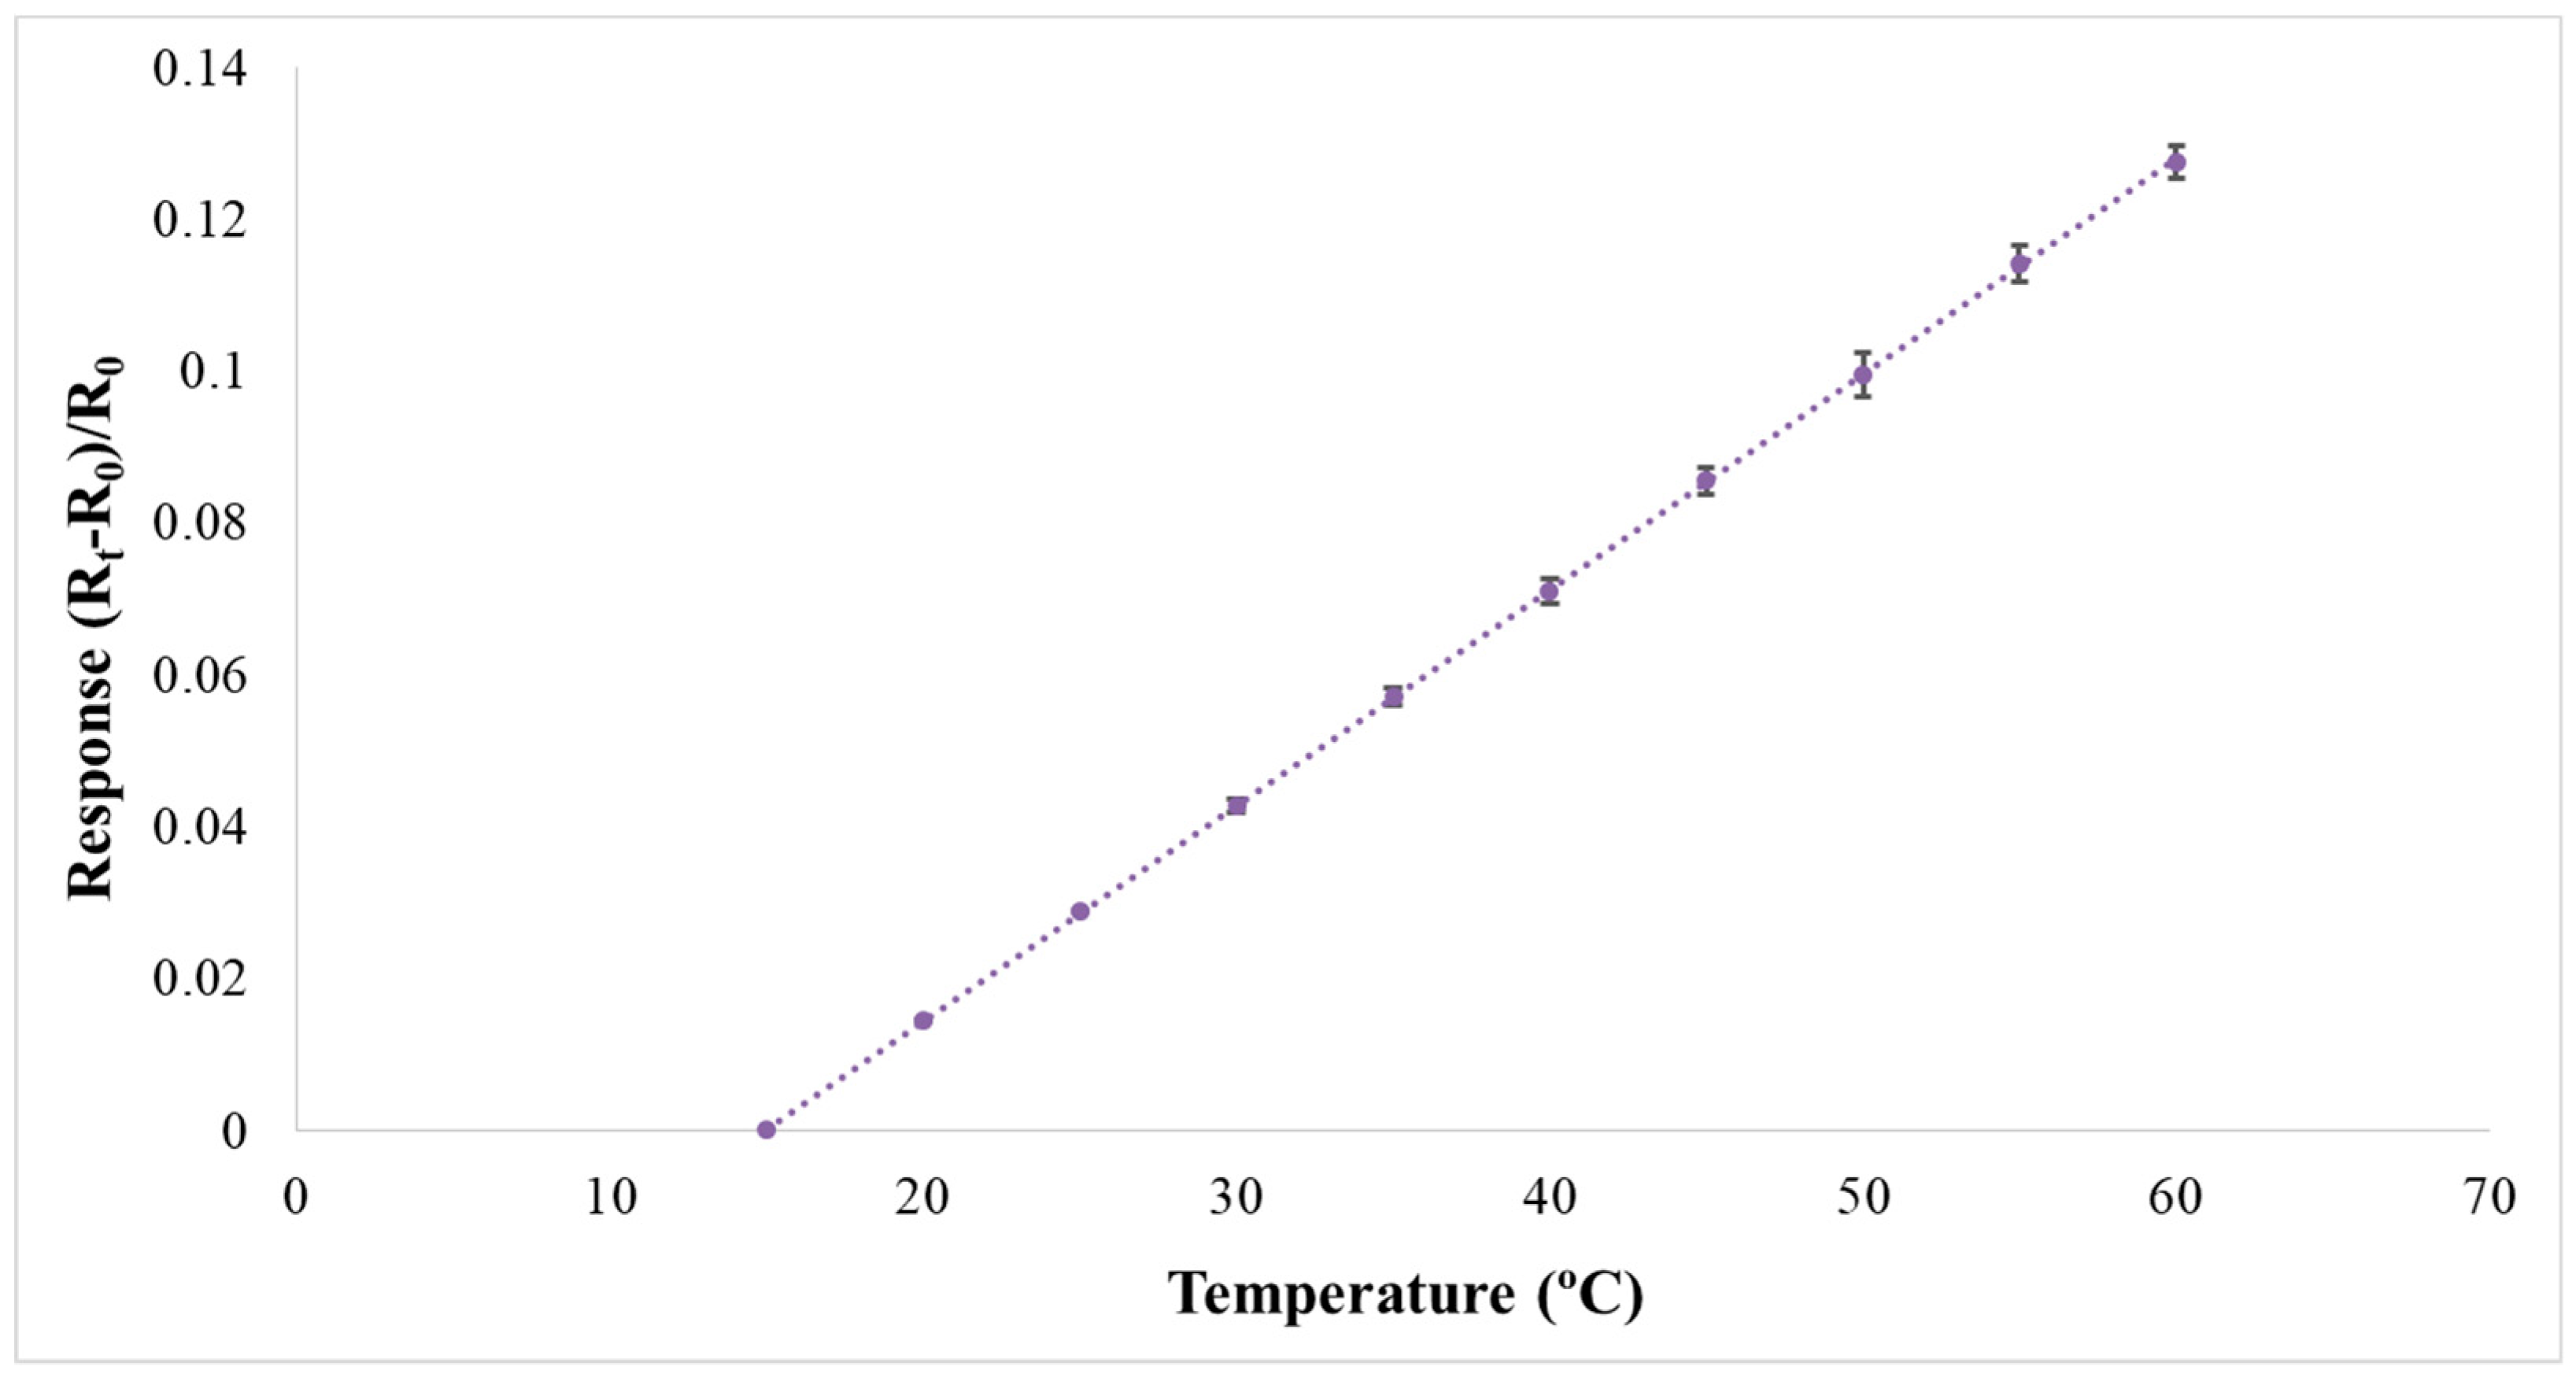
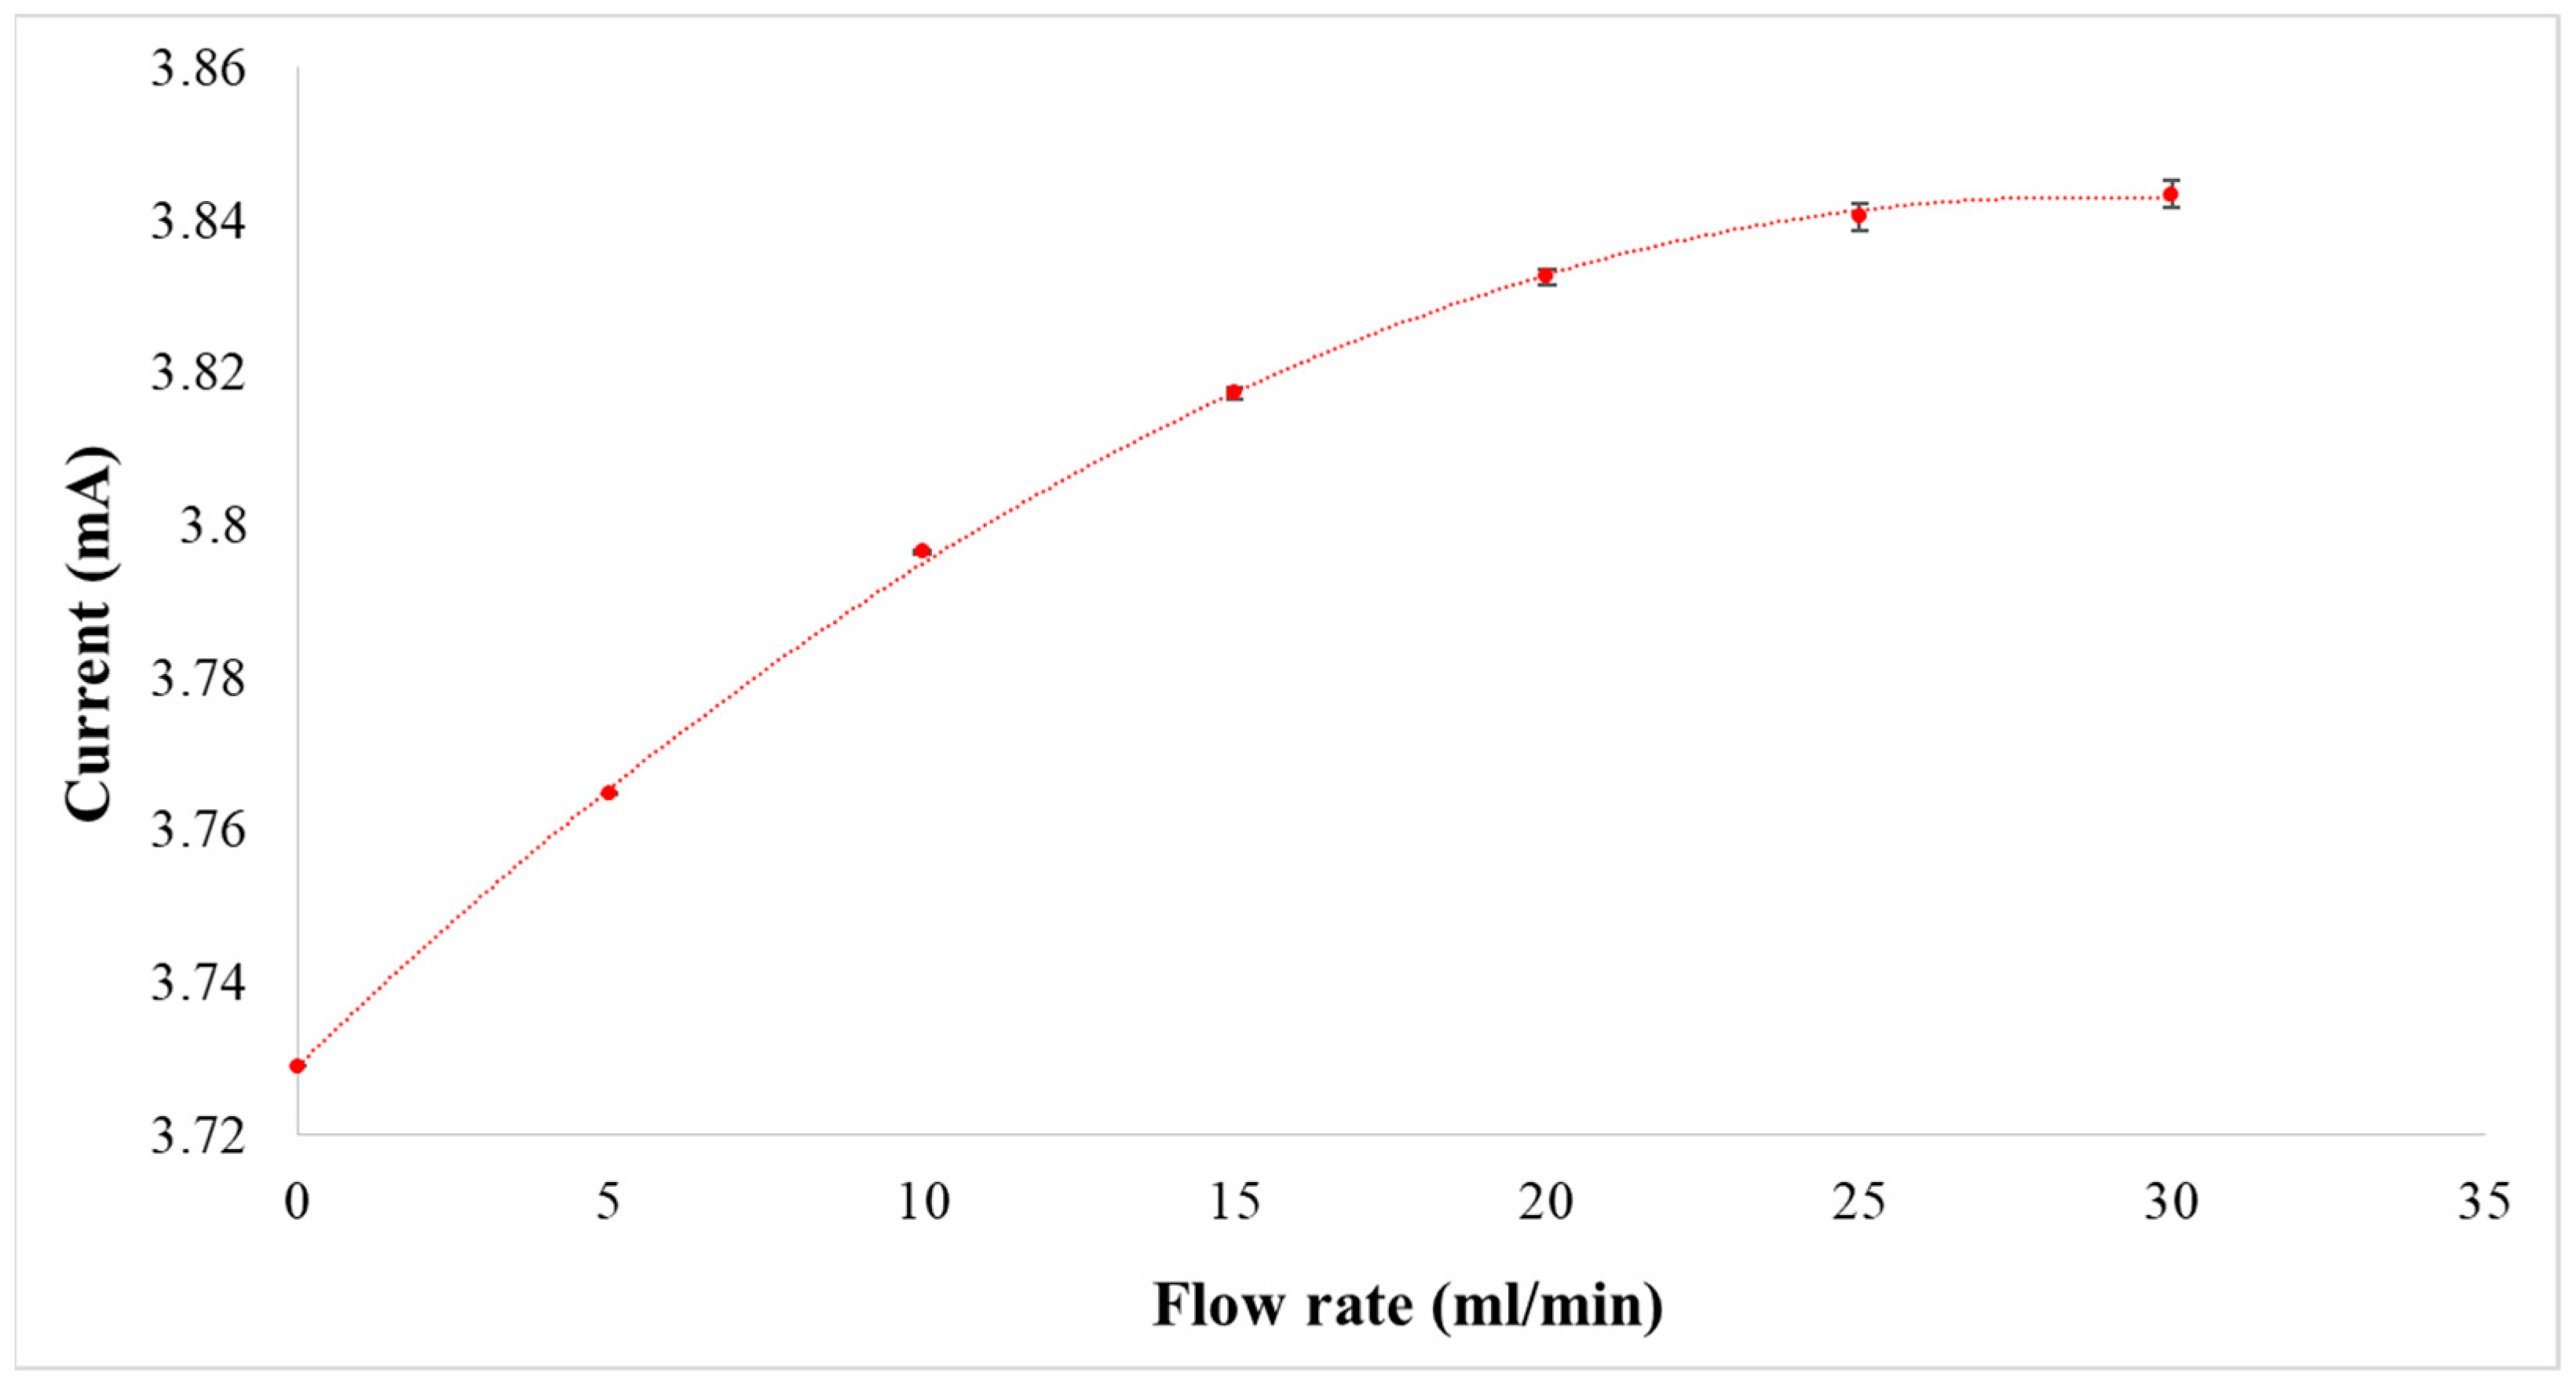
3.3. Correction of Flexible 5-In-1 Microsensor
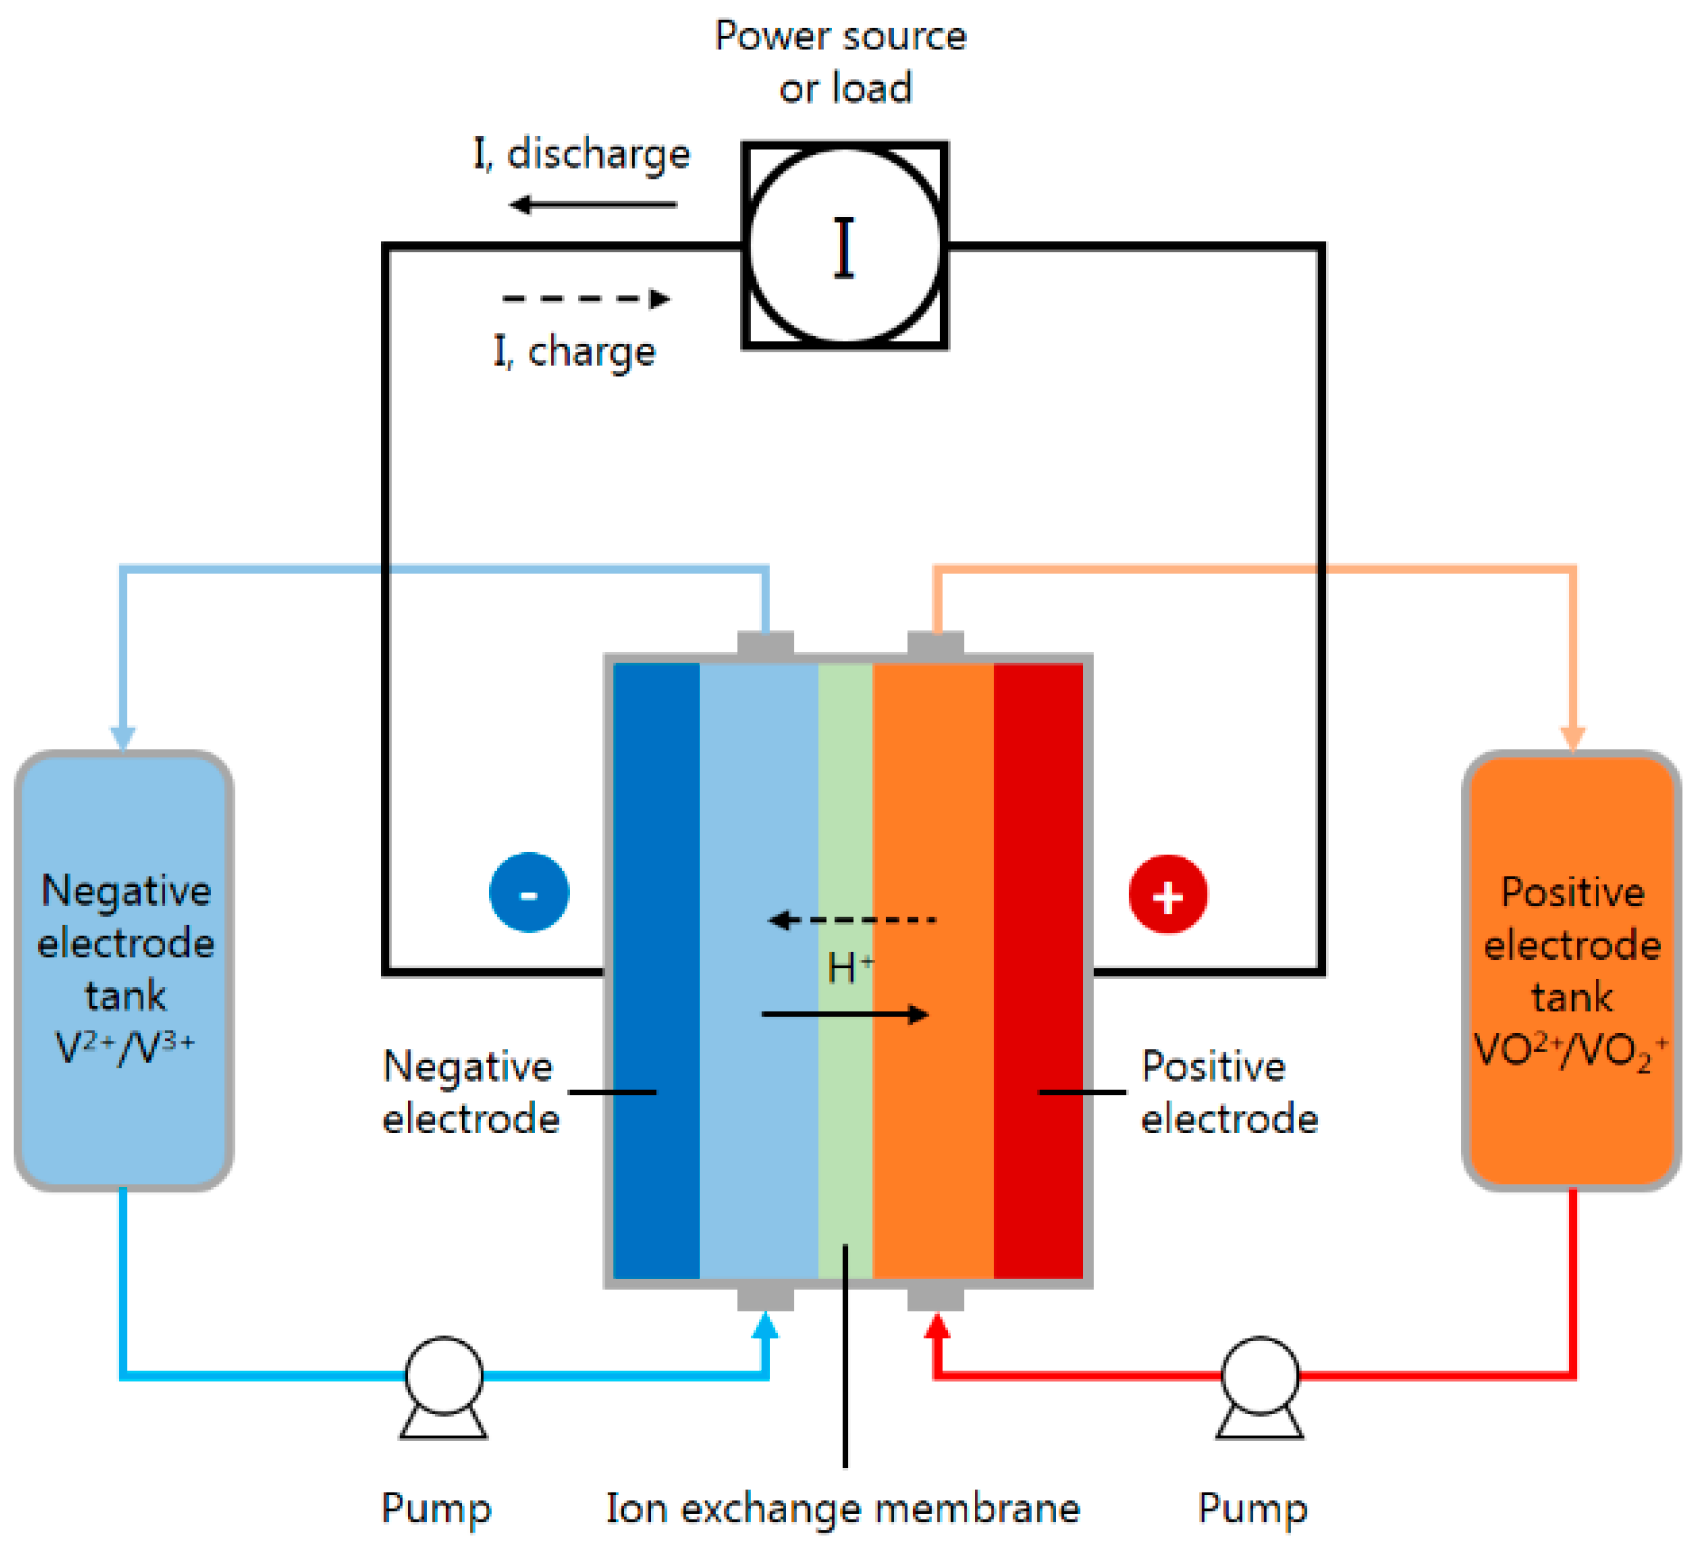
4. Real-Time Microscopic Diagnosis in the VRFB
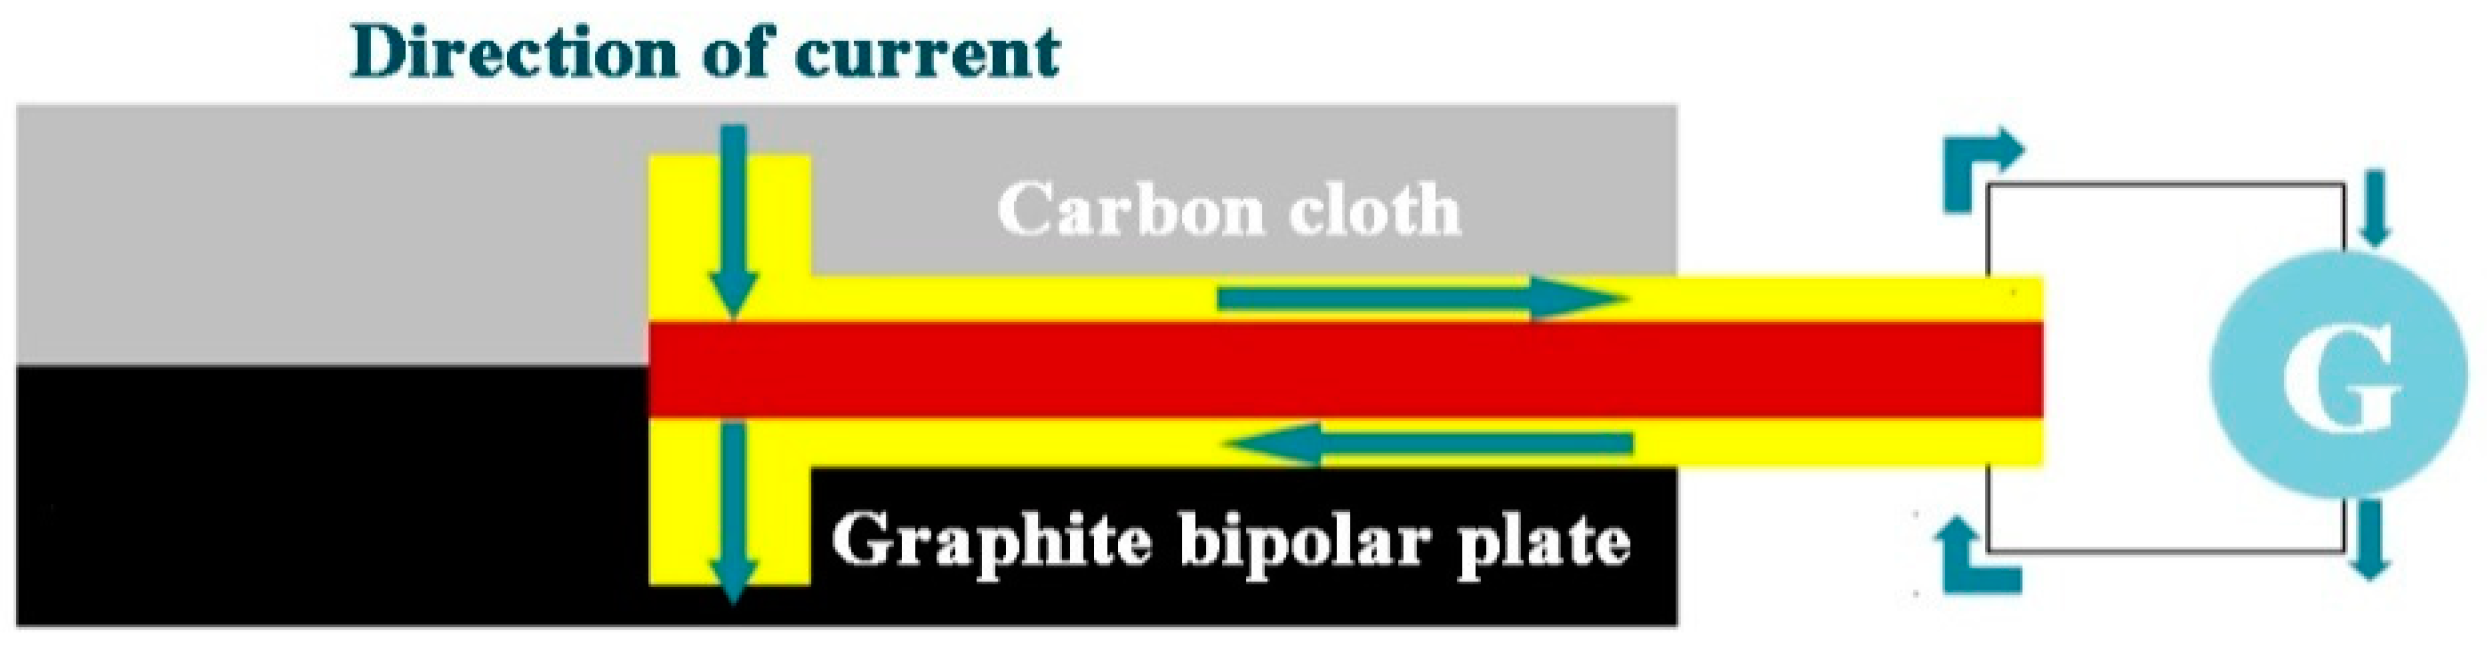
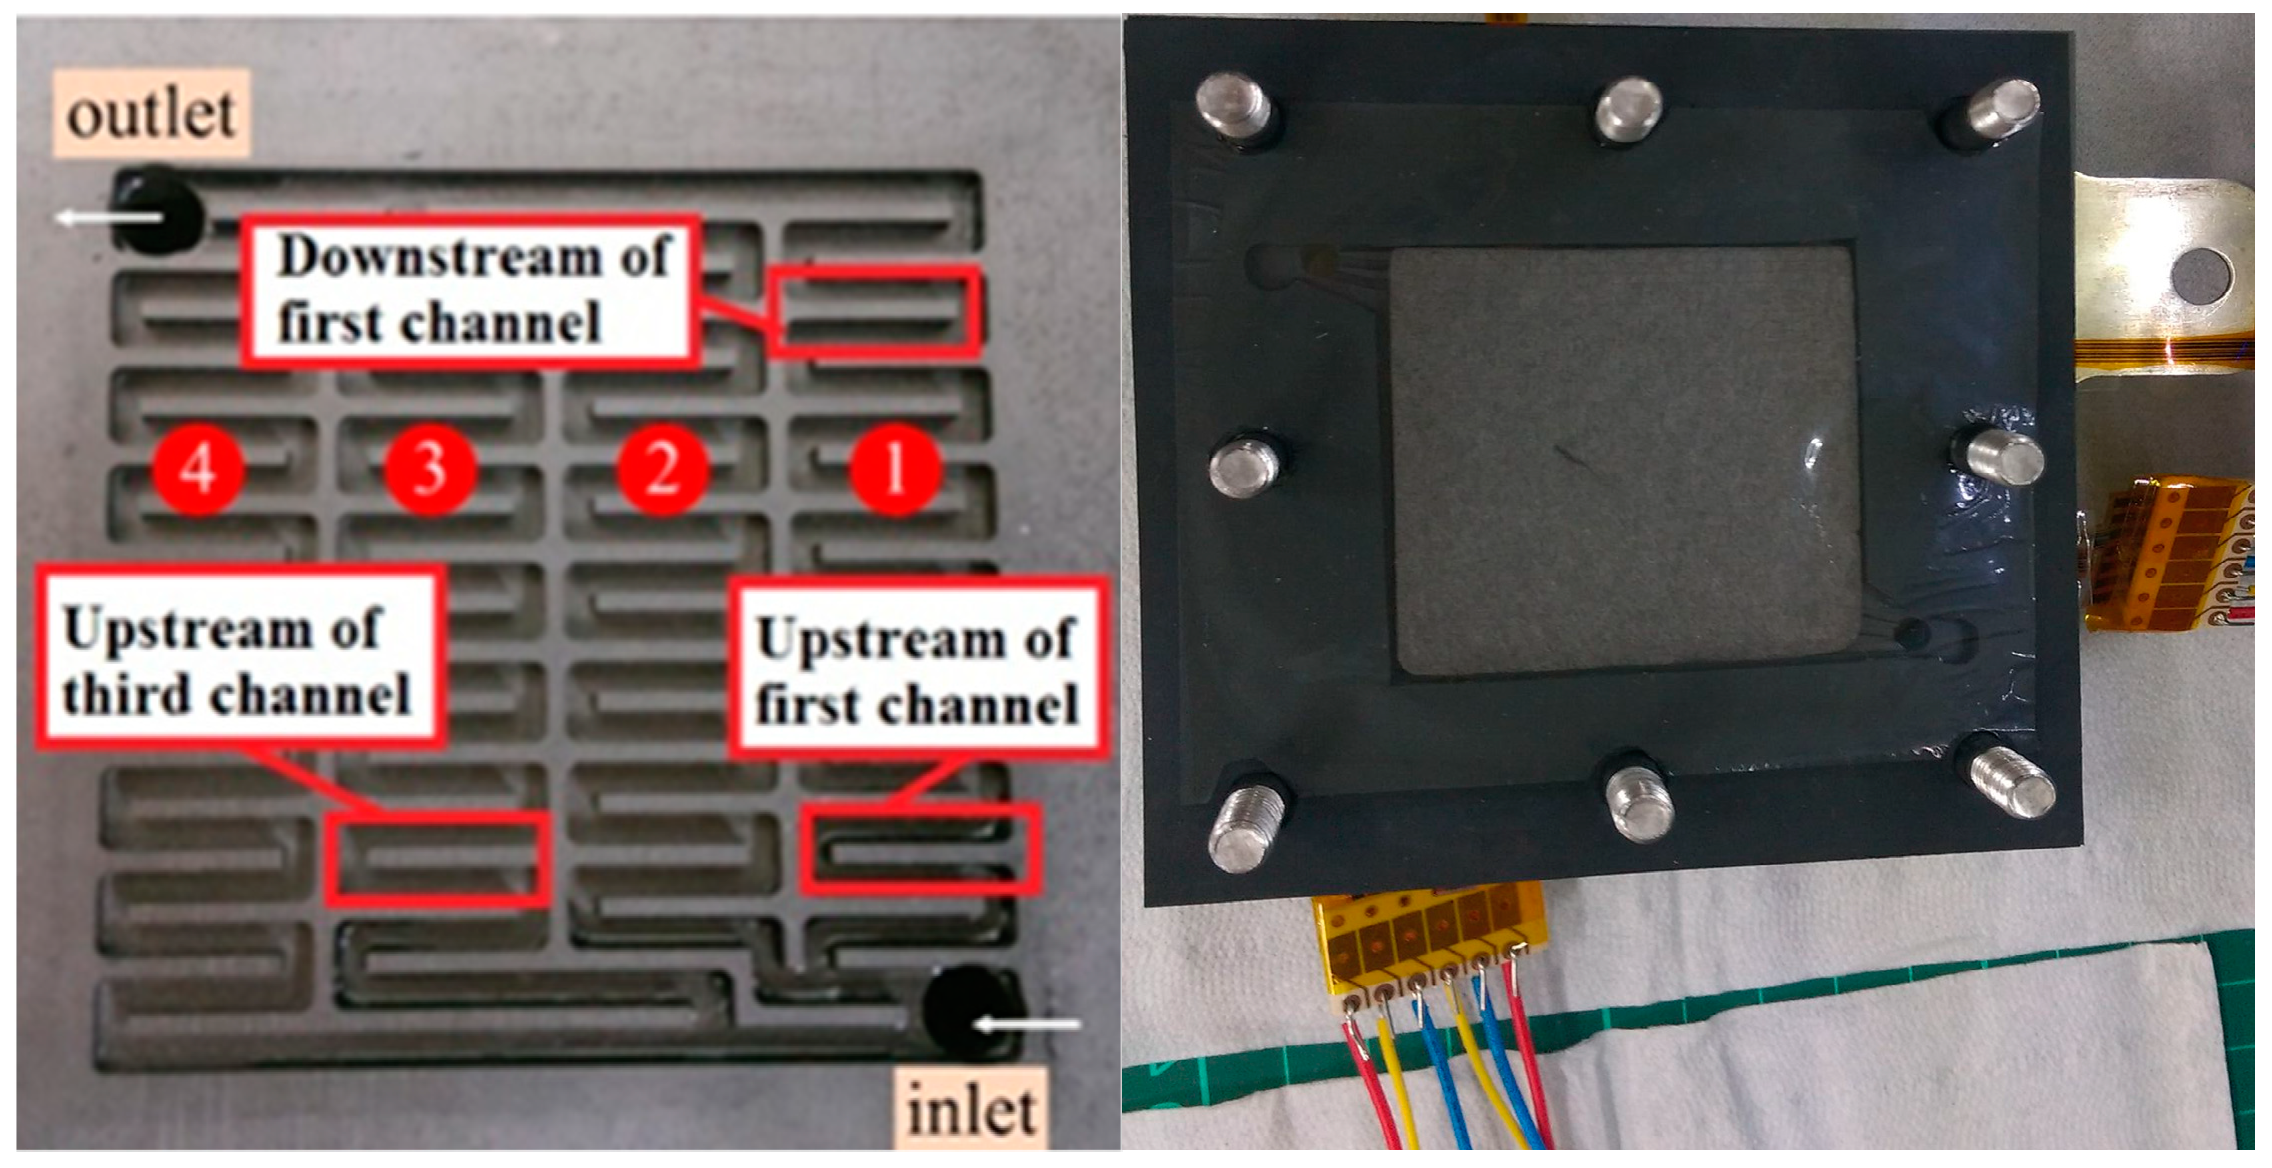
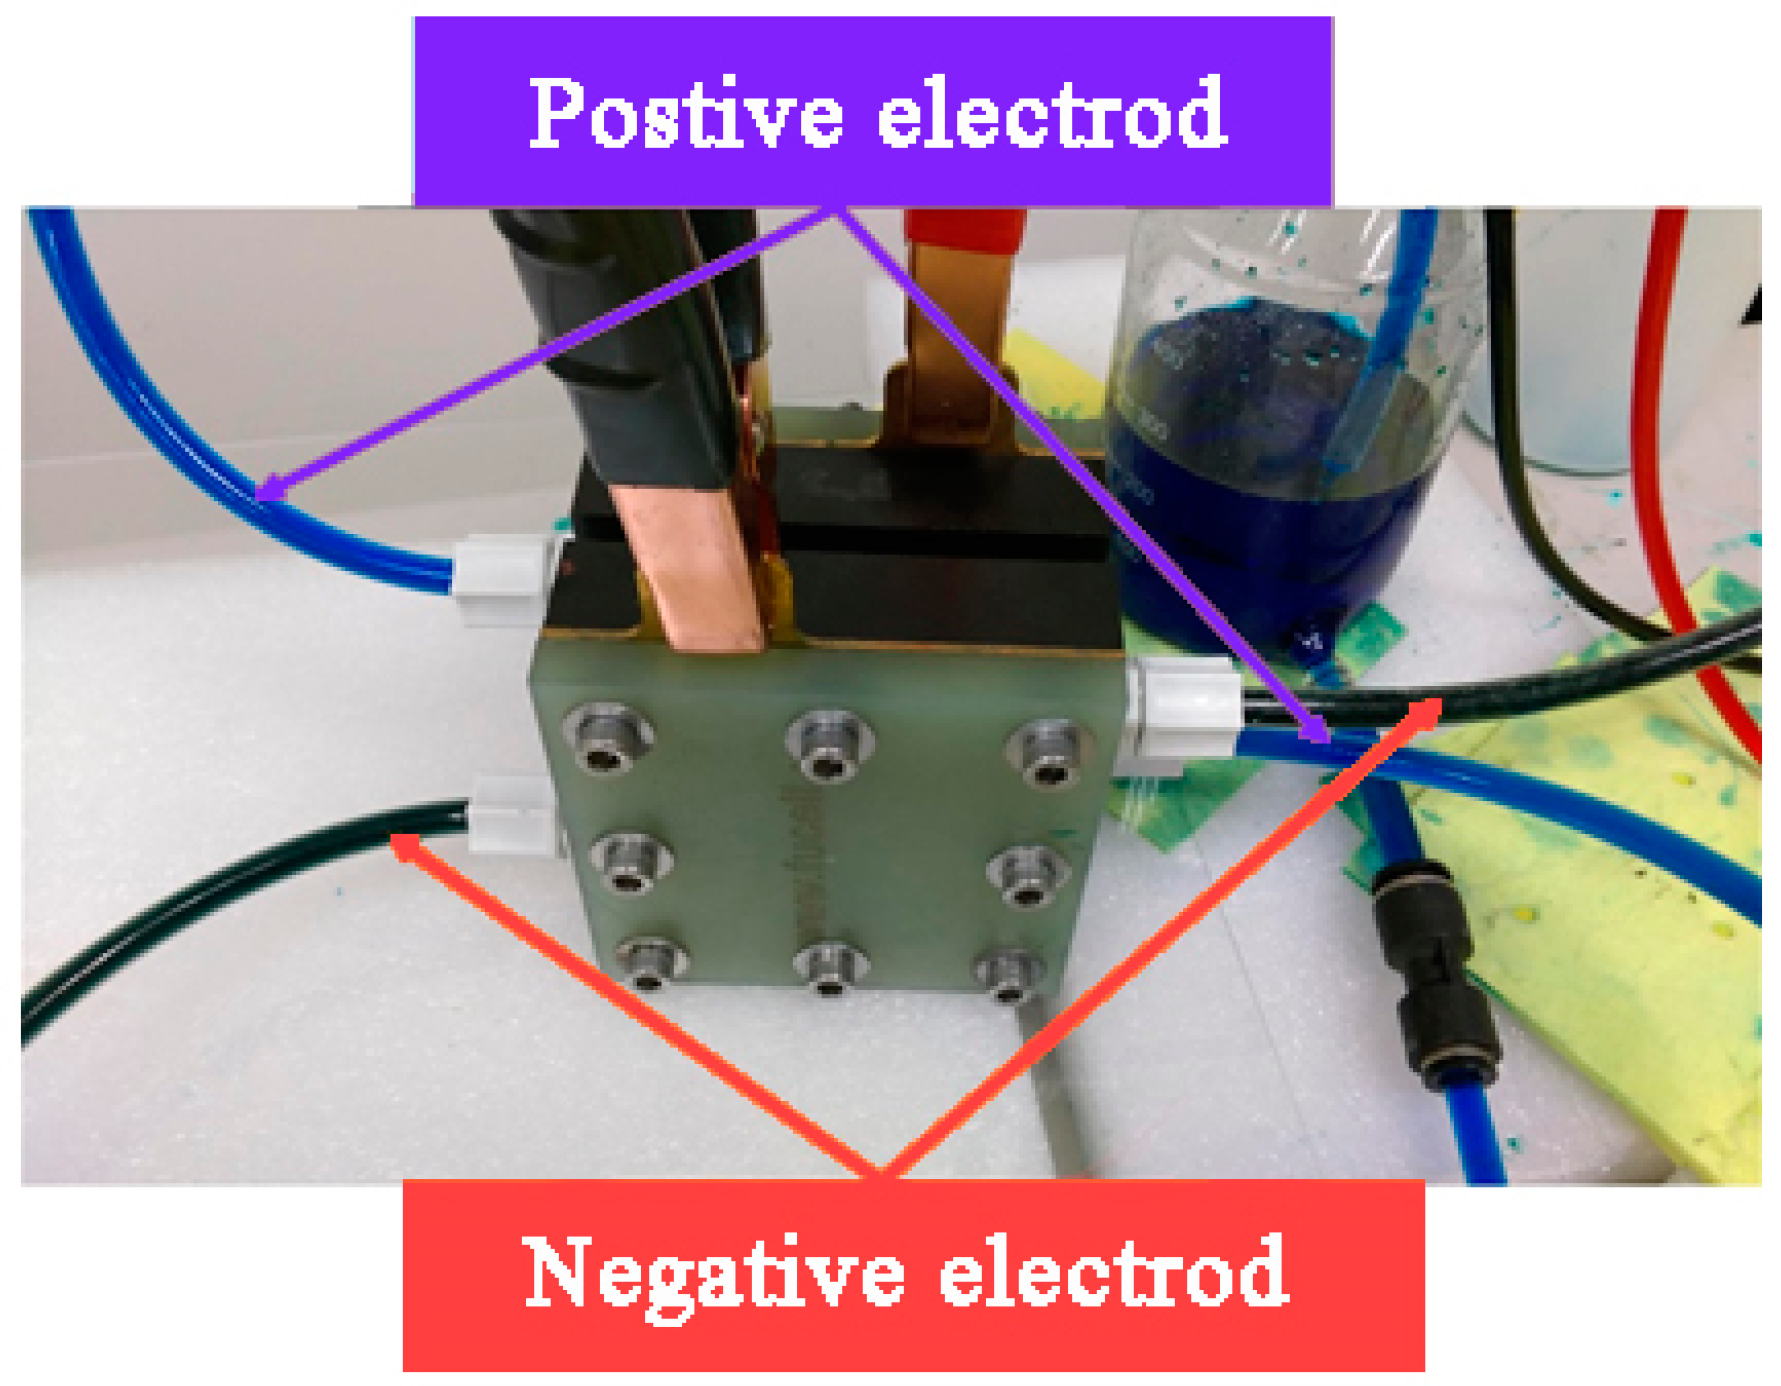
4.1. Location of the Flexible 5-In-1 Microsensor
4.2. VRFB Precharge
4.3. VRFB Charge Test
4.4. Real-Time Microscopic Diagnosis in the VRFB
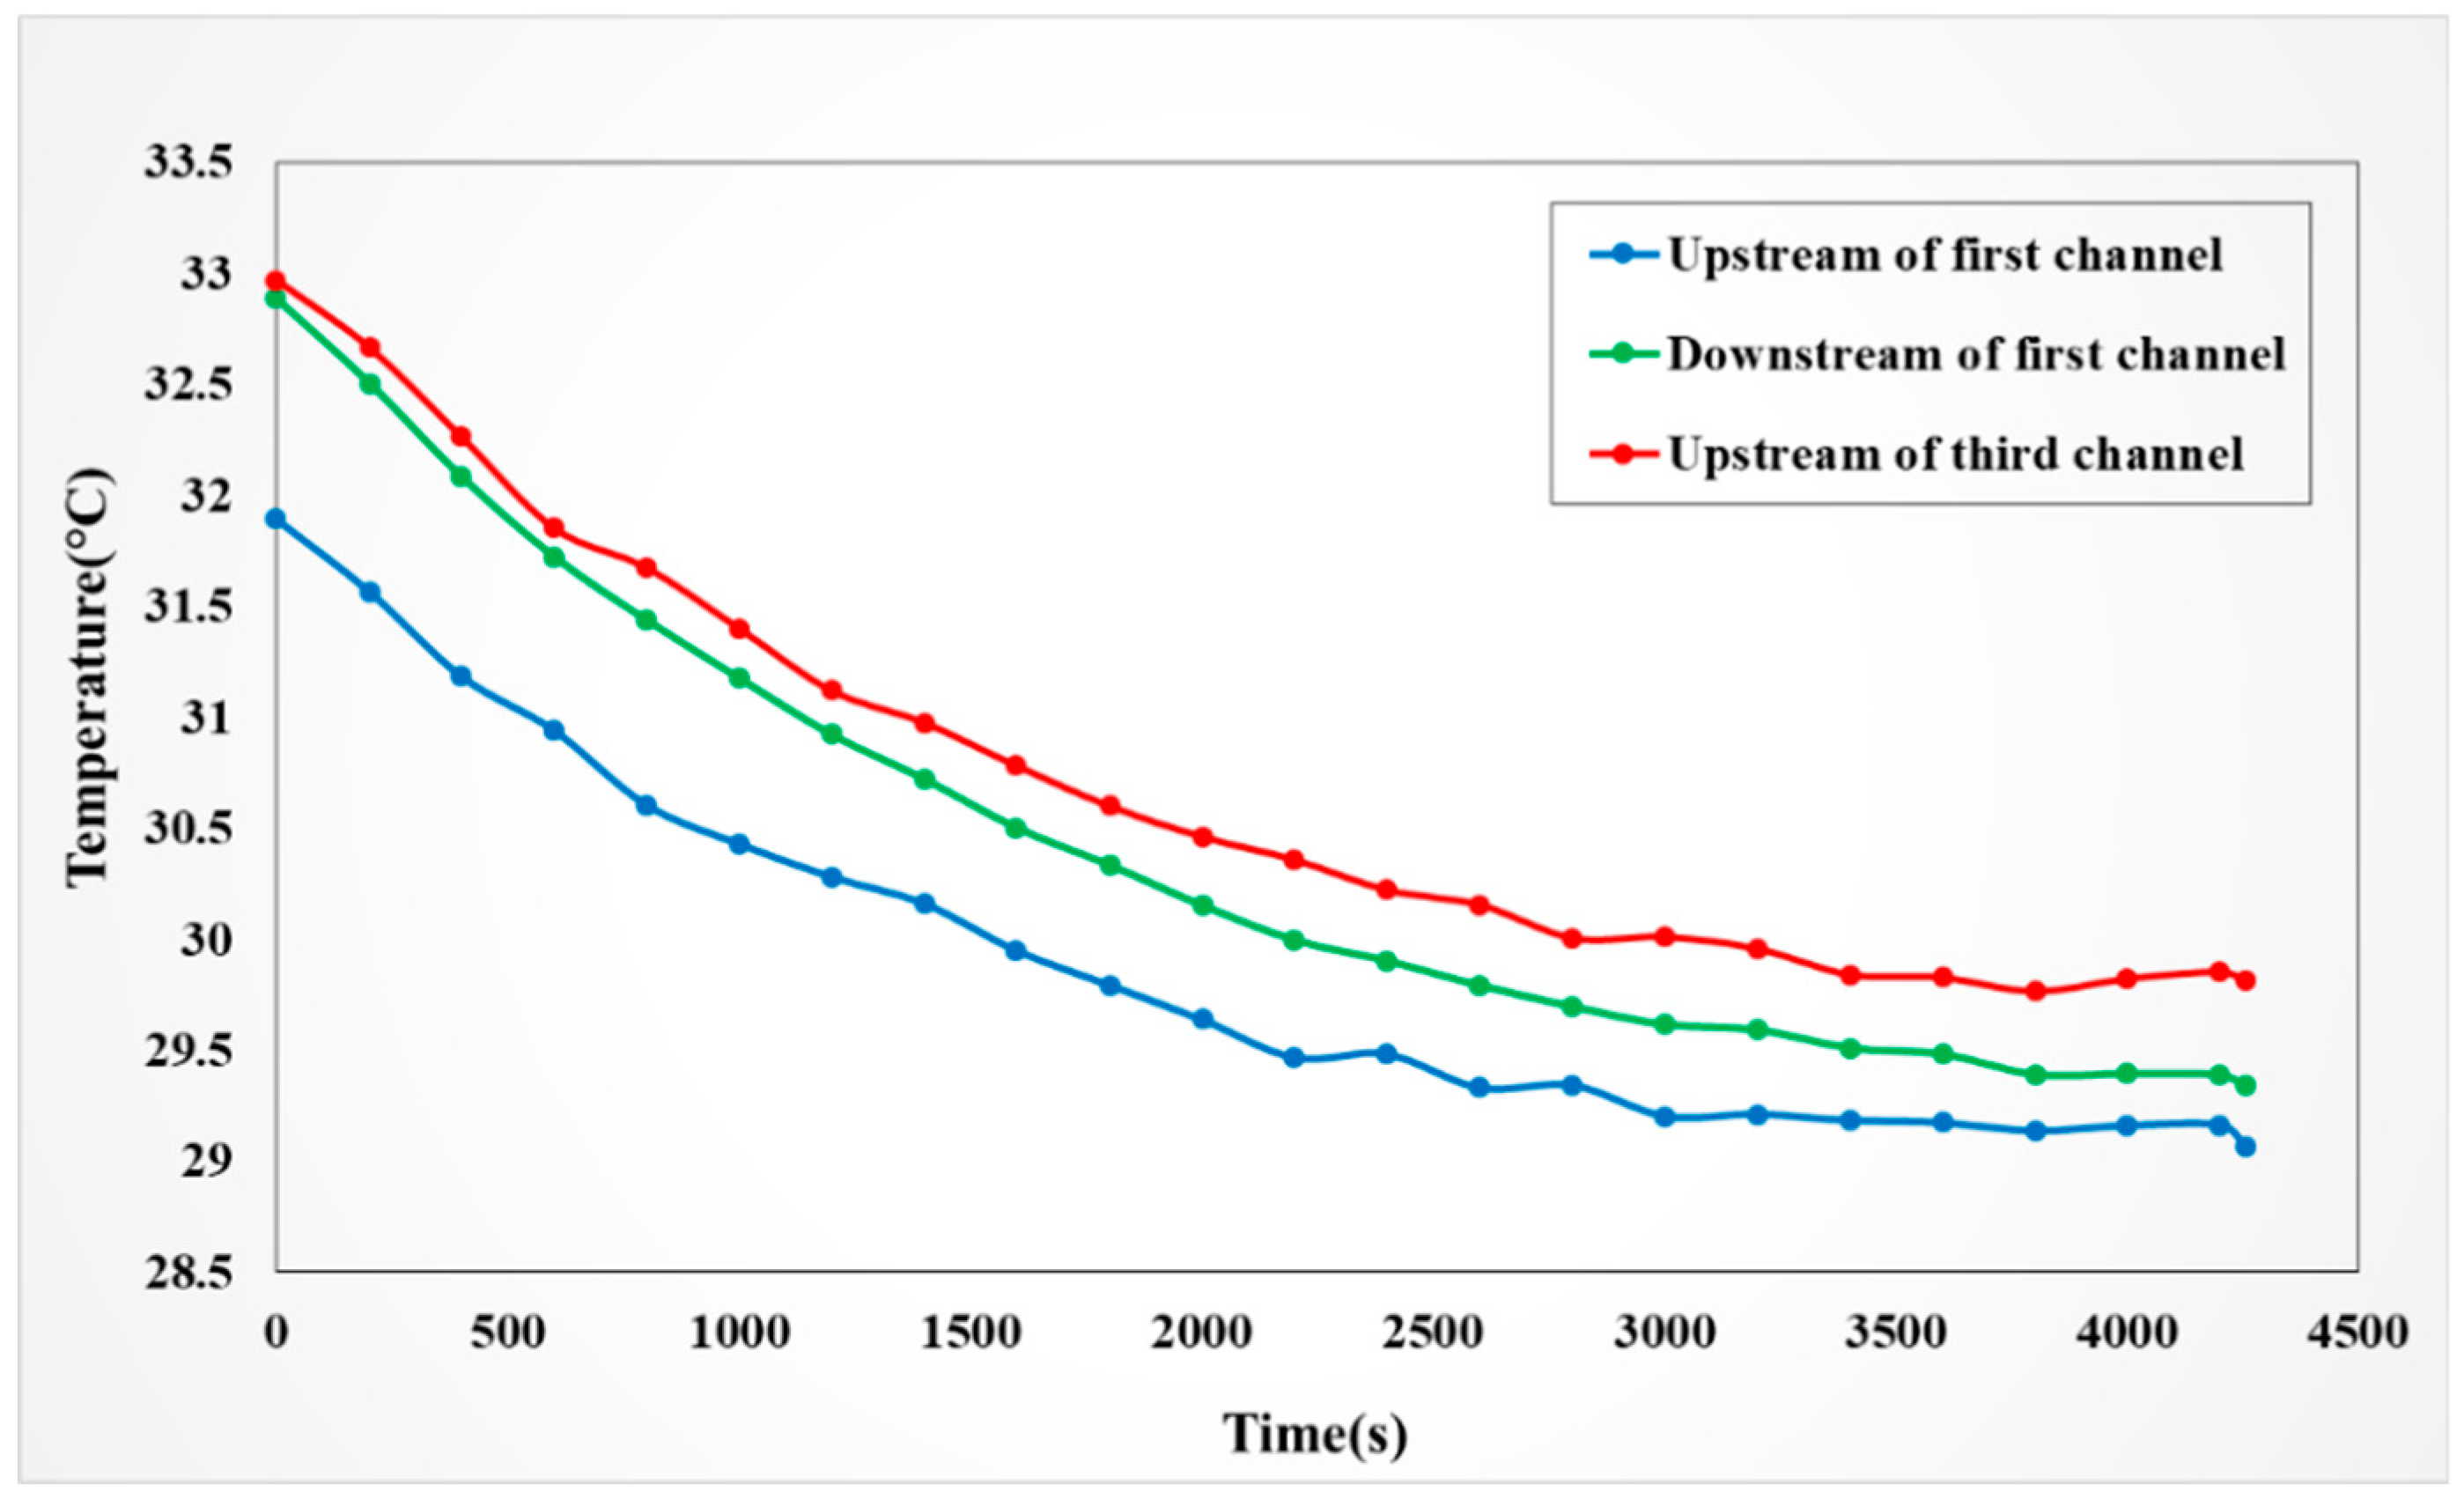
4.4.1. Observation on Internal Temperature of the VRFB
4.4.2. Observation on Internal Flow of the VRFB
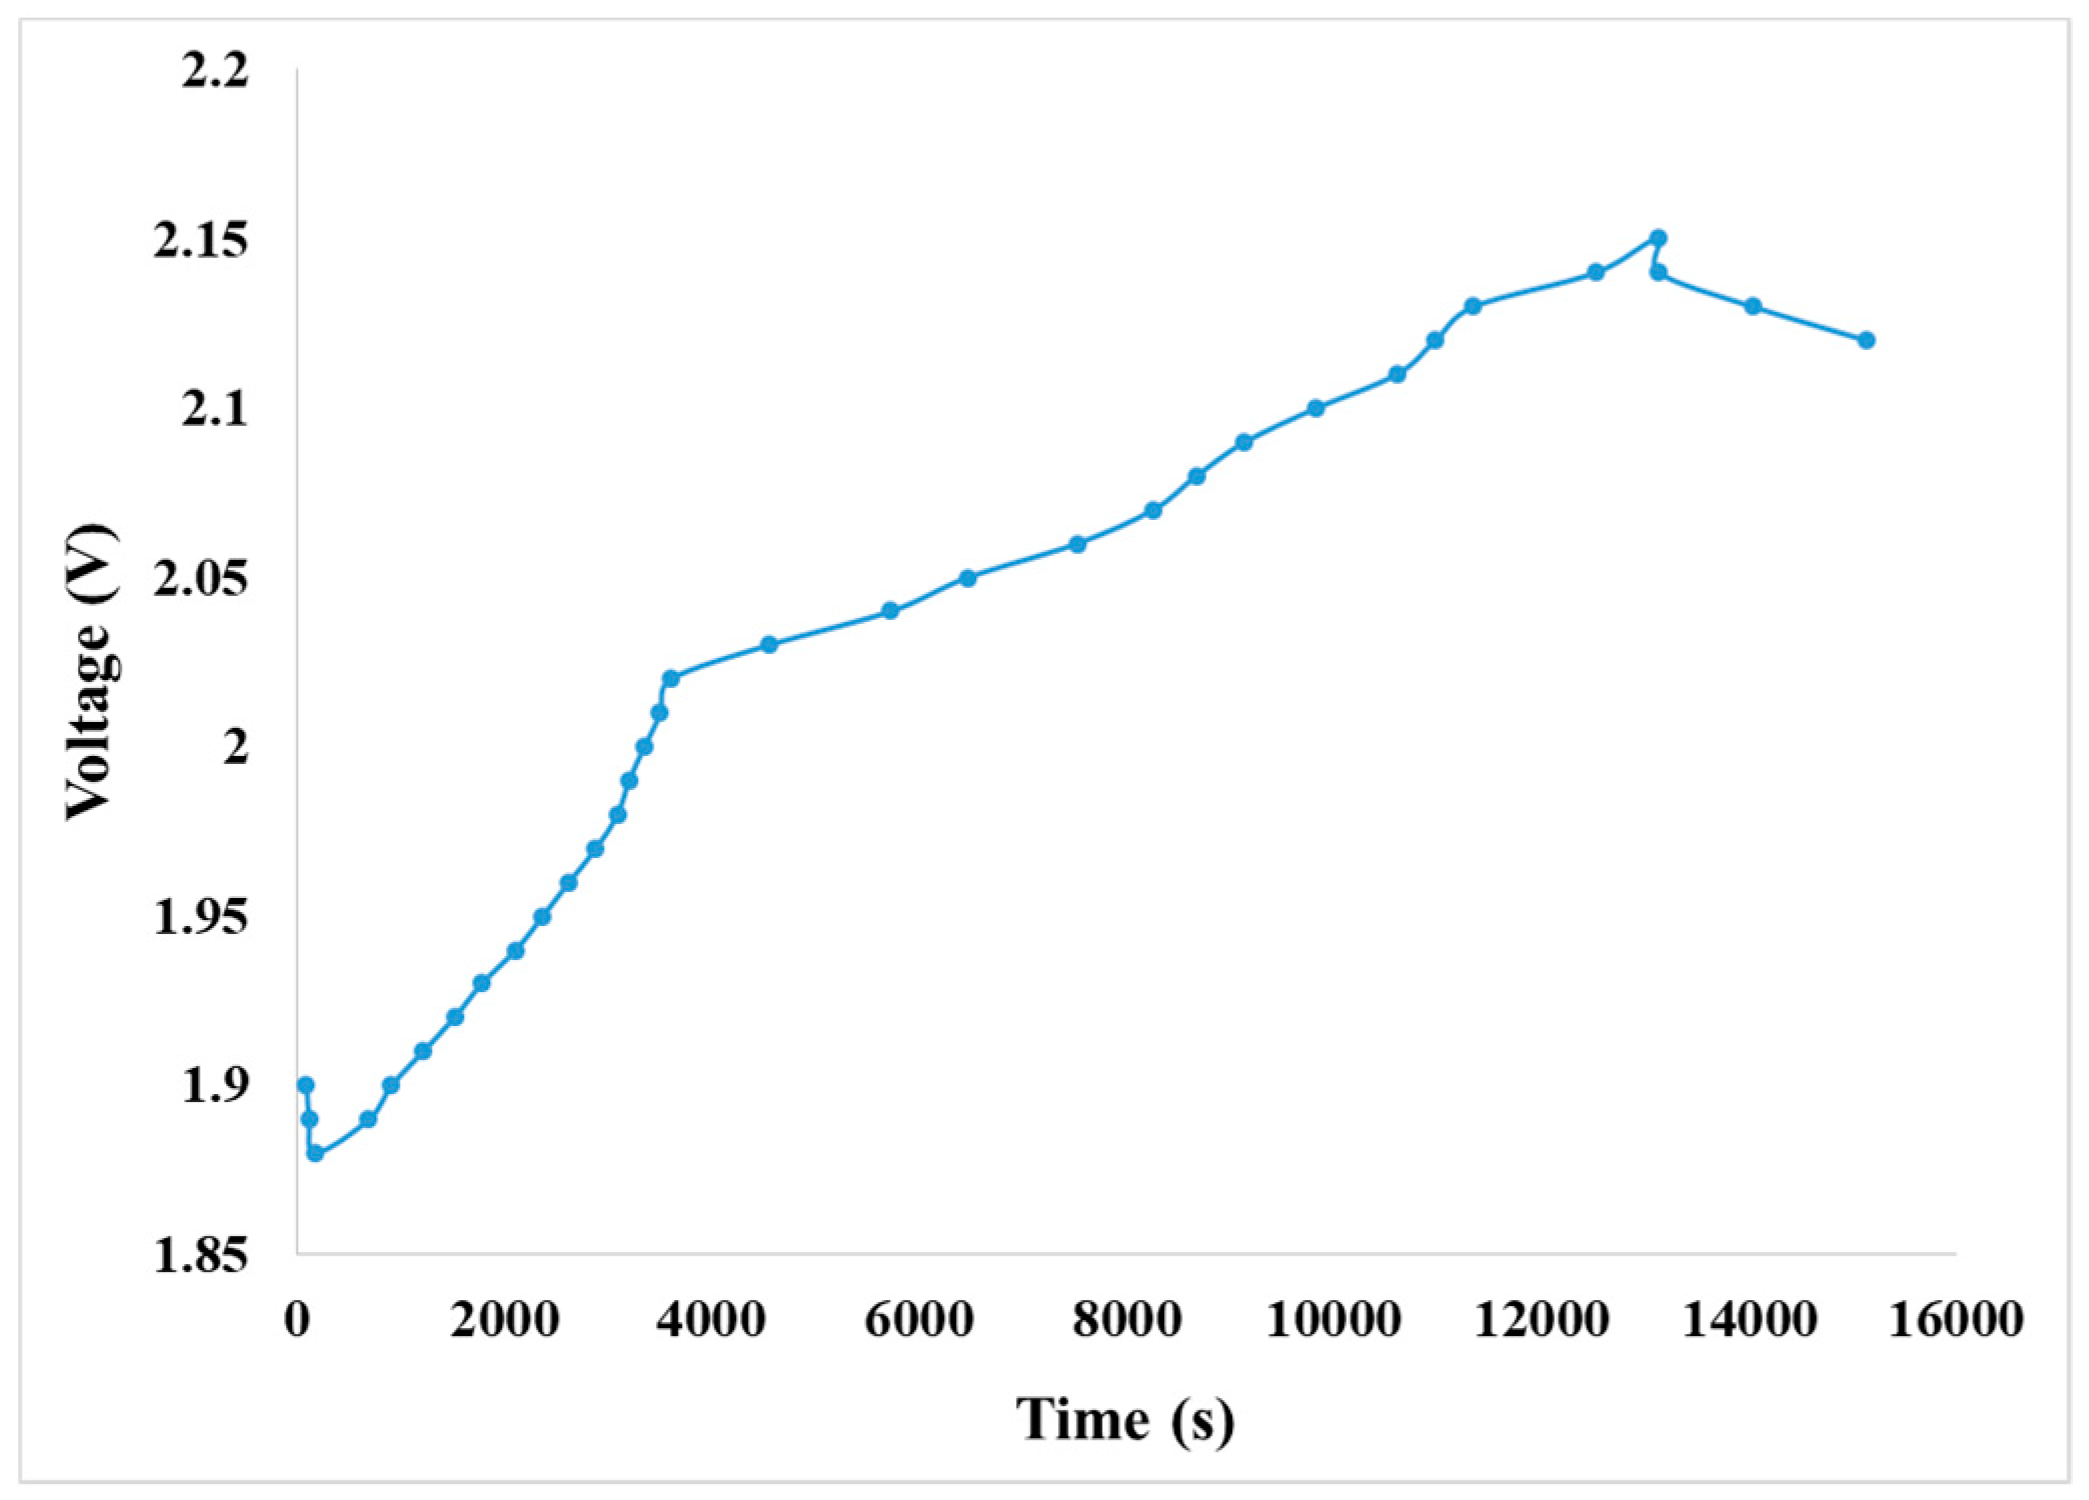
4.4.3. Observation on Internal Voltage of the VRFB
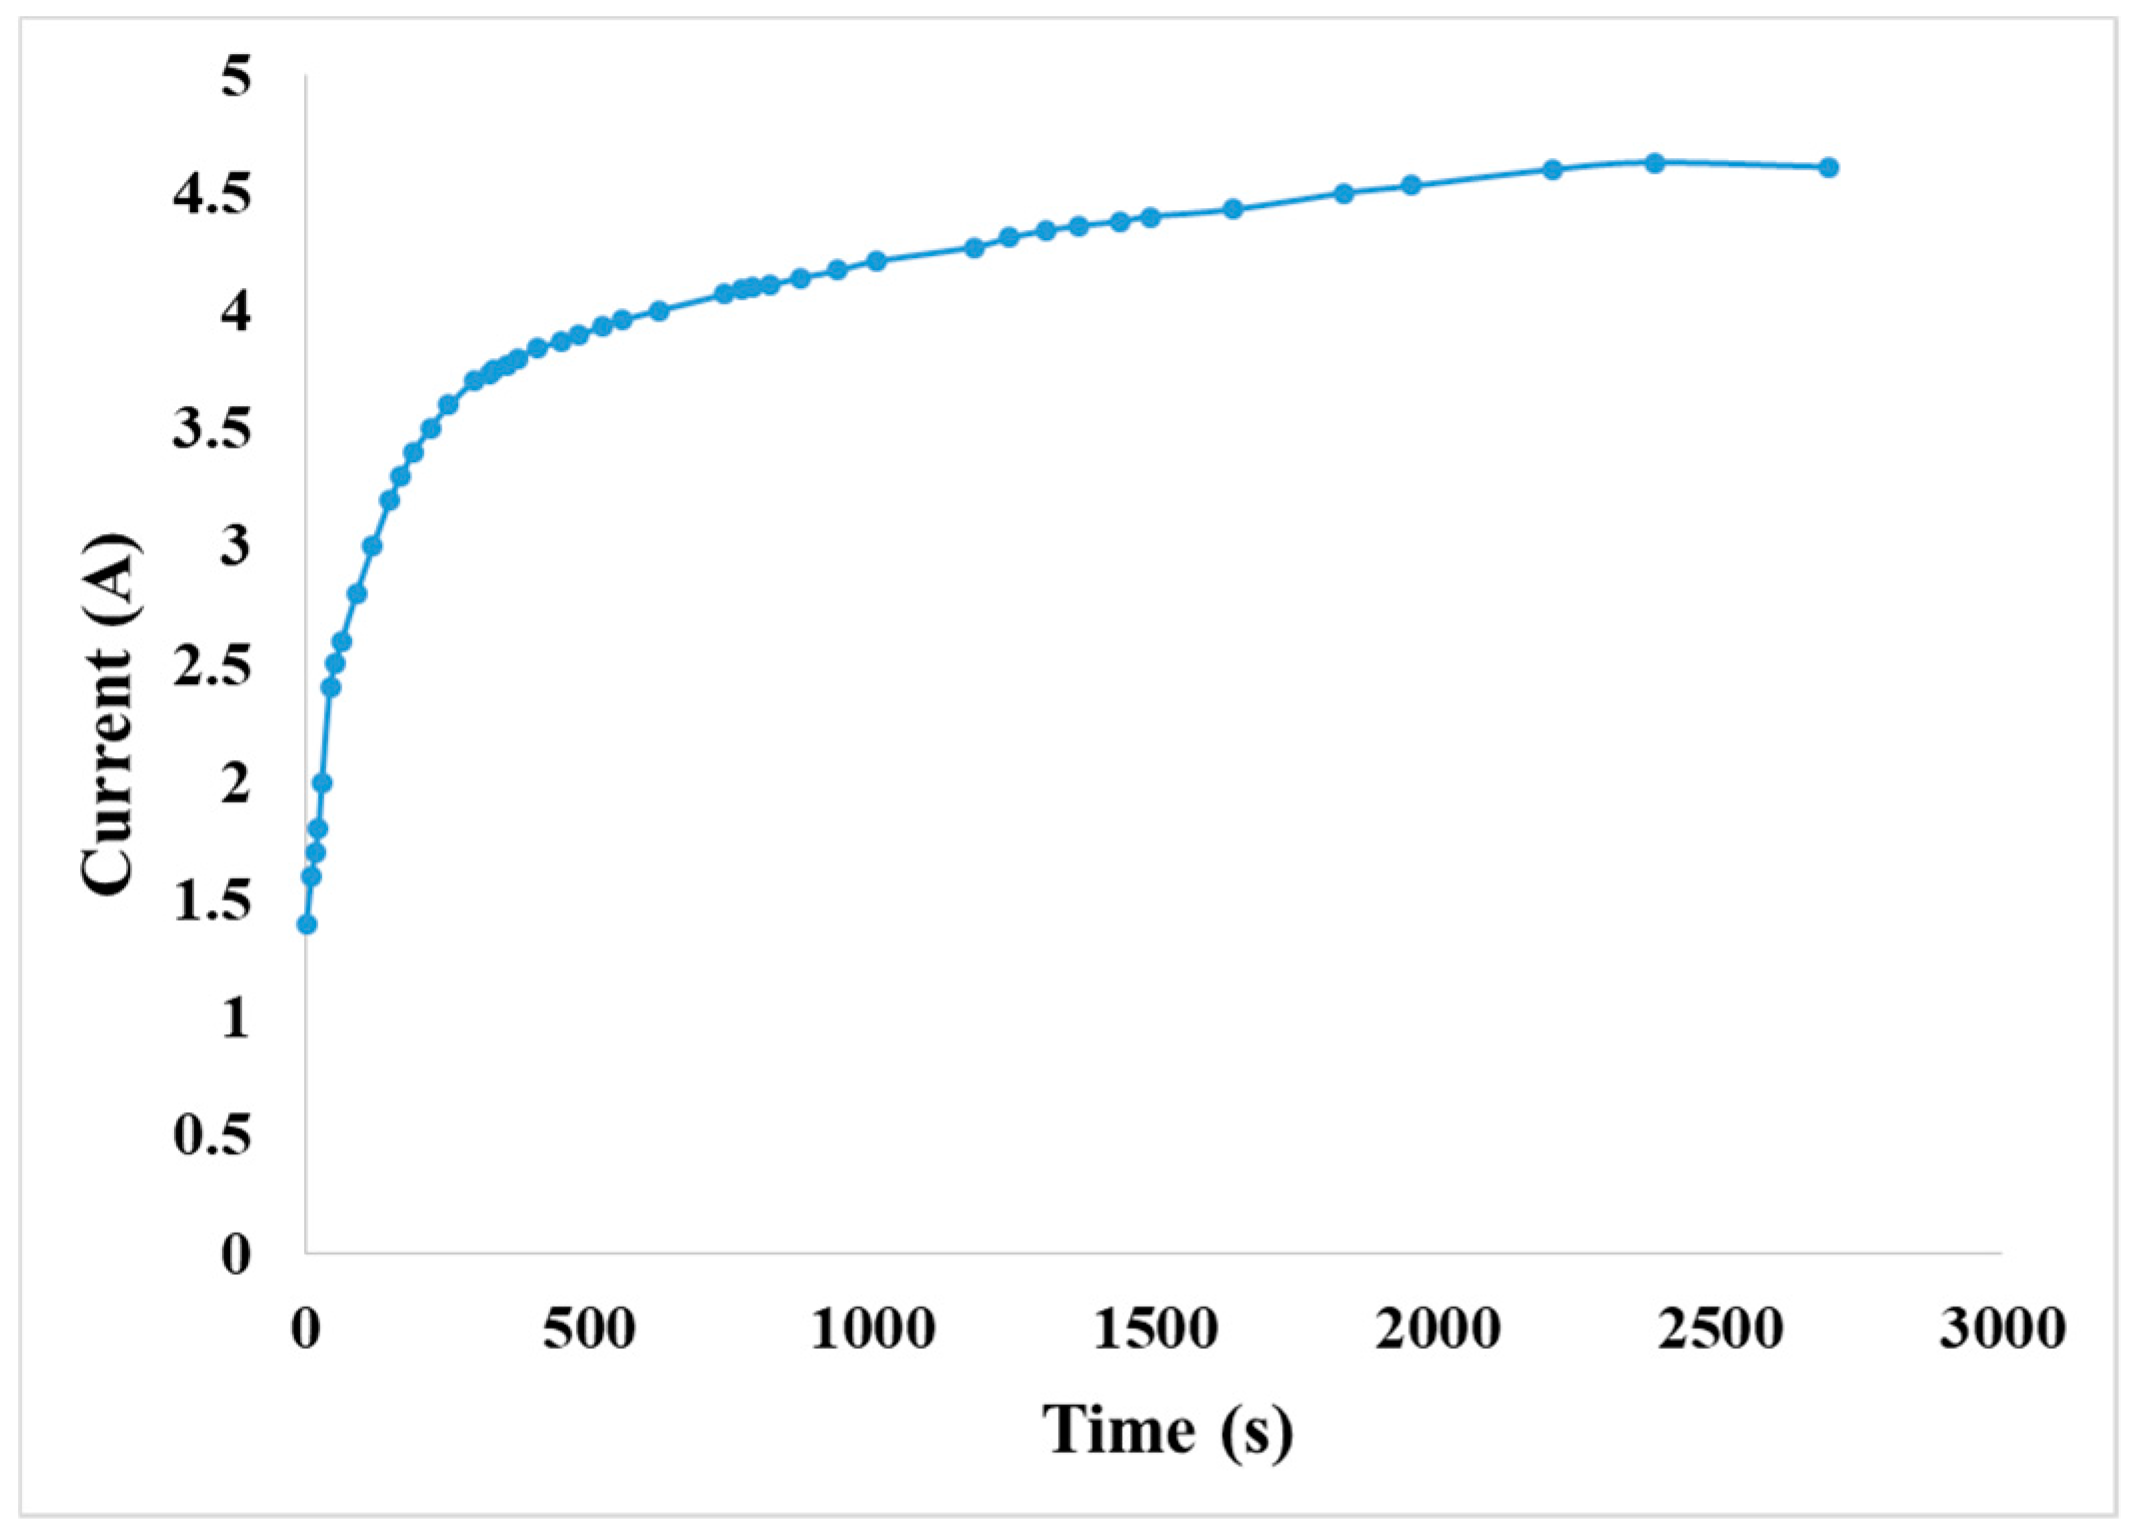
4.4.4. Observation on Internal Current of the VRFB
5. Conclusions
Author Contributions
Funding
Acknowledgments
Conflicts of Interest
References
- National Aeronautics and Space Administration, Redox Flow Cell Development and Demonstration Project. J. Power Sources 1980, 5, 245–253. [CrossRef]
- Skyllas-Kazacos, M.; Robins, R.G. All-Vanadium Redox Battery. Australian Patent No. 575247, 1986. [Google Scholar]
- Whitehead, A.H.; Rabbow, T.J.; Trampert, M.; Pokorny, P. Critical Safety Features of the Vanadium Redox Flow Battery. J. Power Sources 2017, 351, 45–50. [Google Scholar] [CrossRef]
- Doetsch, C.; Burfeind, J. Vanadium Redox Flow Batteries. Storing Energy 2016, 227–246. [Google Scholar] [CrossRef]
- Bhattarai, A.; Wai, N.; Schweiss, R.; Whitehead, A.; Scherer, G.G.; Ghimire, P.C.; Nguyen, T.D.; Hng, H.H. Study of Flow Behavior in All-vanadium Redox Flow Battery using Spatially Resolved Voltage Distribution. J. Power Sources 2017, 360, 443–452. [Google Scholar] [CrossRef]
- Gandomia, Y.A.; Aarona, D.S.; Zawodzinskib, T.A.; Mench, M.M. In Situ Potential Distribution Measurement and Validated Model for All-Vanadium Redox Flow Battery. J. Electrochem. Soc. 2016, 163, 5188–5201. [Google Scholar] [CrossRef]
- Yang, W.W.; He, Y.L.; Li, Y.S. Performance Modeling of a Vanadium Redox Flow Battery During Discharging. Electrochim. Acta 2015, 155, 279–287. [Google Scholar] [CrossRef]
- Khazaeli, A.; Vatani, A.; Tahouni, N.; Panjeshahi, M.H. Numerical Investigation and Thermodynamic Analysis of the Effect of Electrolyte Flow Rate on Performance of All Vanadium Redox Flow Batteries. J. Power Sources 2015, 293, 599–612. [Google Scholar] [CrossRef]
- Blasdel, N.J.; Wujcik, E.K.; Carletta, J.E.; Lee, K.S.; Monty, C.N. Fabric Nanocomposite Resistance Temperature Detector. IEEE Sens. J. 2015, 15, 300–306. [Google Scholar]
- Pacardo, D.B.; Neupane, B.; Wang, G. A Temperature Microsensor for Measuring Laser-induced Heating in Gold Nanorods. Anal. Bioanal.Chem. 2015, 407, 719–725. [Google Scholar] [CrossRef] [PubMed]
- Kielbasa, J. The Hot-wire Anemometer. Arch. Min. Sci. 2014, 59, 467–475. [Google Scholar]
- Duri, D.; Baudet, C.; Moro, J.P.; Roche, P.E.; Diribarne, P. Hot-wire Anemometry for Superfluid Turbulent Coflows. Rev. Sci. Instrum. 2015, 86, 025007. [Google Scholar] [CrossRef] [PubMed]
- Chiang, C.C.; Lin, C.K.; Ju, M.S. An Implantable Capacitive Pressure Sensor for Biomedical Applications. Sens. Actuators A 2007, 134, 382–388. [Google Scholar] [CrossRef]


© 2019 by the authors. Licensee MDPI, Basel, Switzerland. This article is an open access article distributed under the terms and conditions of the Creative Commons Attribution (CC BY) license (http://creativecommons.org/licenses/by/4.0/).
Share and Cite
Lee, C.-Y.; Hsieh, C.-L.; Chen, C.-H.; Huang, Y.-P.; Jiang, C.-A.; Wu, P.-C. A Flexible 5-In-1 Microsensor for Internal Microscopic Diagnosis of Vanadium Redox Flow Battery Charging Process. Sensors 2019, 19, 1030. https://doi.org/10.3390/s19051030
Lee C-Y, Hsieh C-L, Chen C-H, Huang Y-P, Jiang C-A, Wu P-C. A Flexible 5-In-1 Microsensor for Internal Microscopic Diagnosis of Vanadium Redox Flow Battery Charging Process. Sensors. 2019; 19(5):1030. https://doi.org/10.3390/s19051030
Chicago/Turabian StyleLee, Chi-Yuan, Chin-Lung Hsieh, Chia-Hung Chen, Yen-Pu Huang, Chong-An Jiang, and Pei-Chi Wu. 2019. "A Flexible 5-In-1 Microsensor for Internal Microscopic Diagnosis of Vanadium Redox Flow Battery Charging Process" Sensors 19, no. 5: 1030. https://doi.org/10.3390/s19051030
APA StyleLee, C.-Y., Hsieh, C.-L., Chen, C.-H., Huang, Y.-P., Jiang, C.-A., & Wu, P.-C. (2019). A Flexible 5-In-1 Microsensor for Internal Microscopic Diagnosis of Vanadium Redox Flow Battery Charging Process. Sensors, 19(5), 1030. https://doi.org/10.3390/s19051030