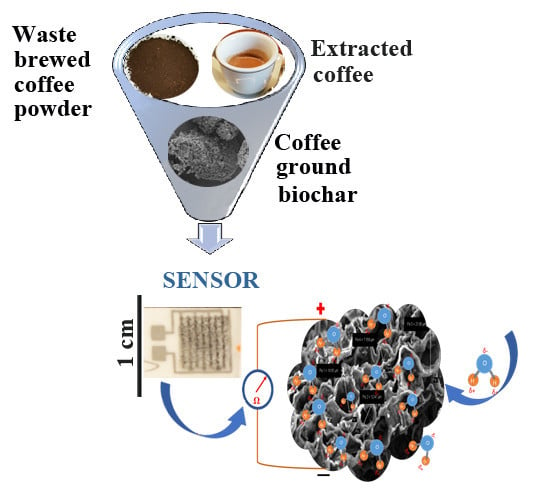
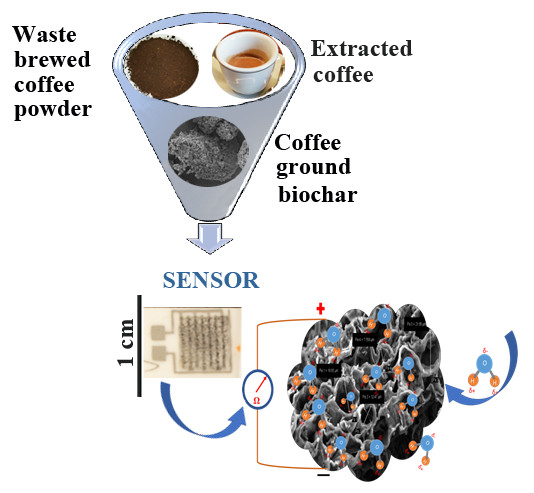
Waste Coffee Ground Biochar: A Material for Humidity Sensors

 , , and
Abstract
:
1. Introduction
2. Materials and Methods
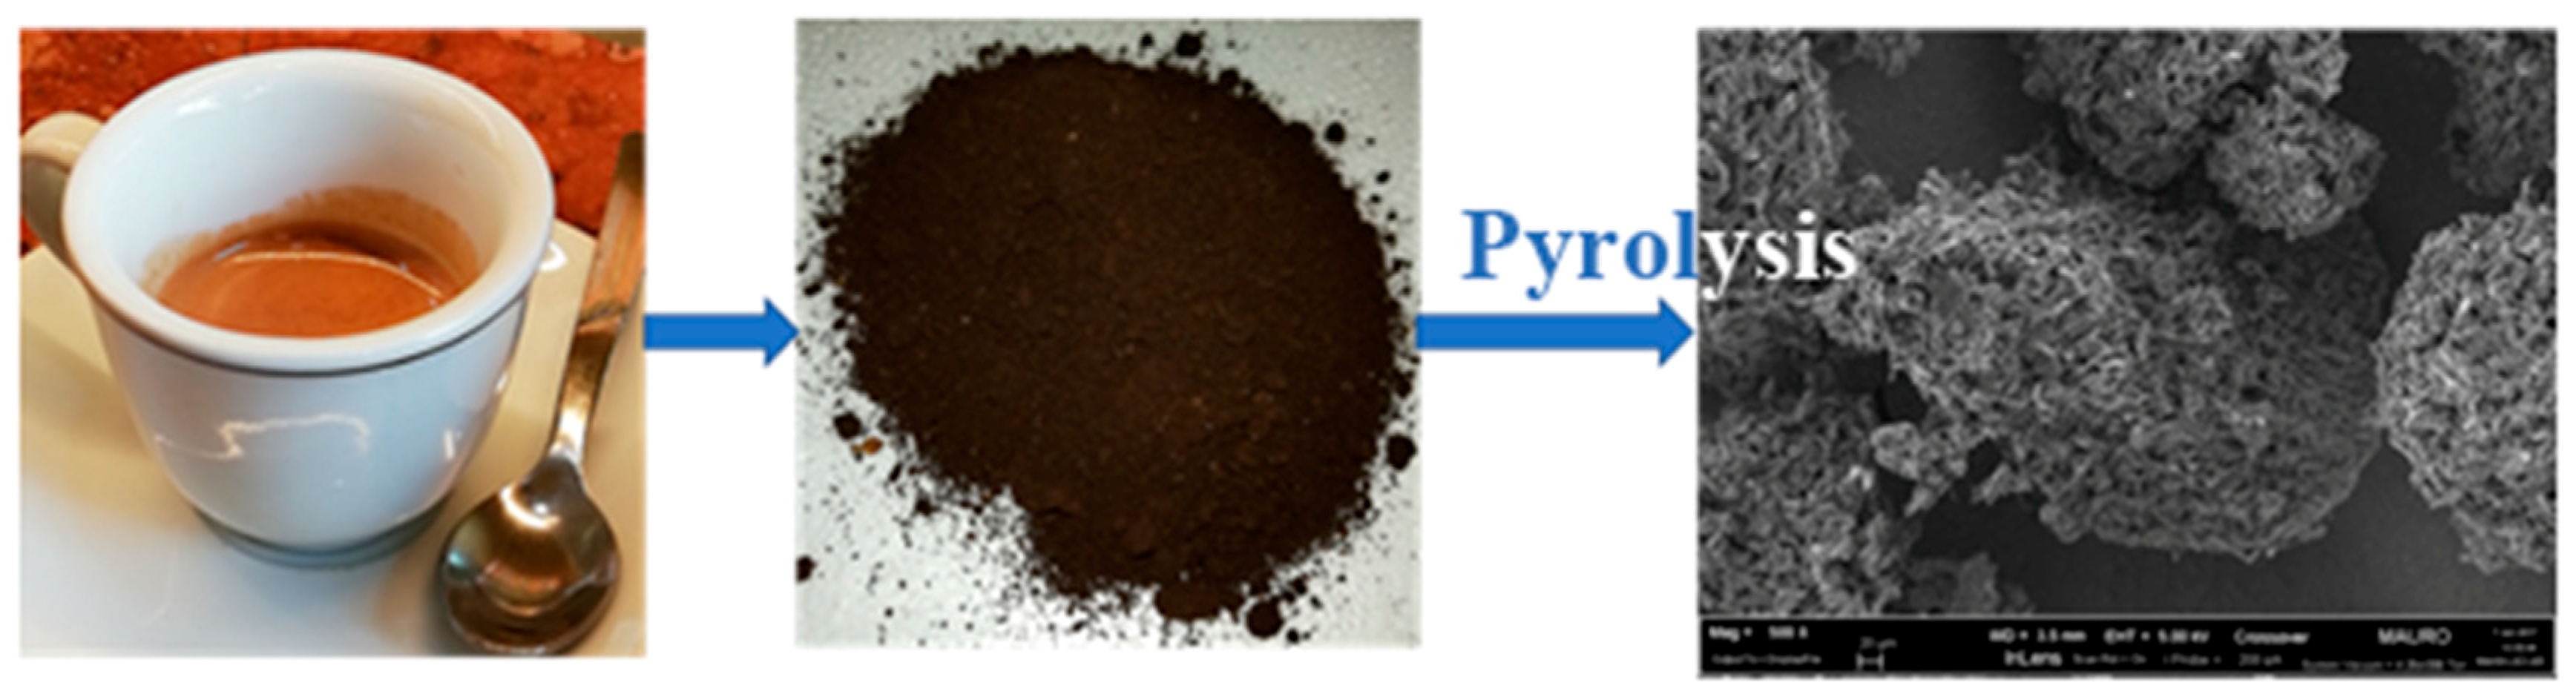
2.1. Preparation and Characterization of Carbon from Waste Brewed Coffee Powder by Pyrolysis
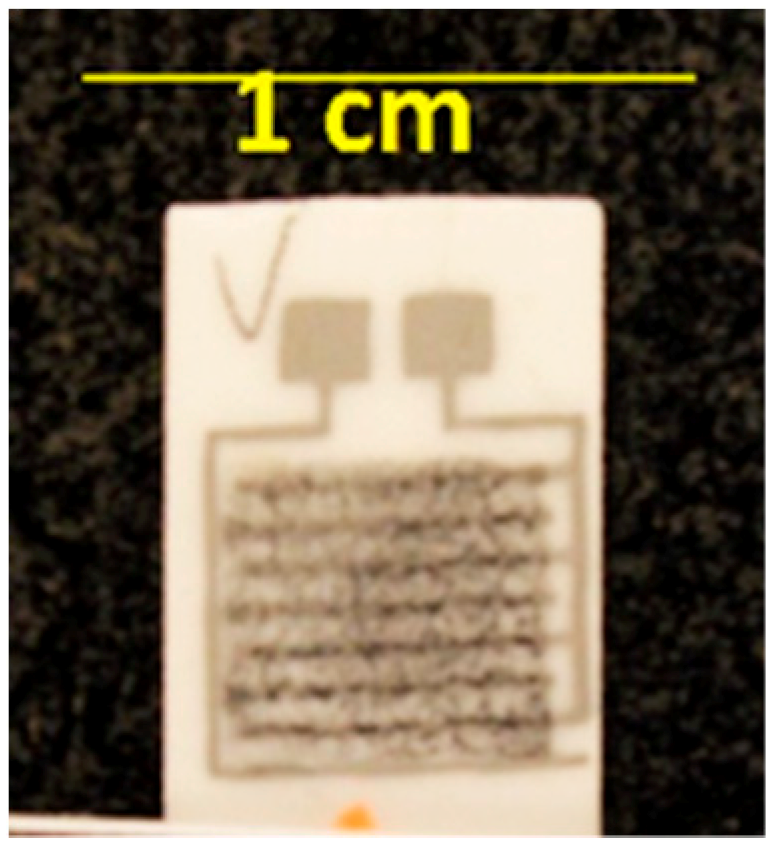
2.2. Coffee Sensor Preparation
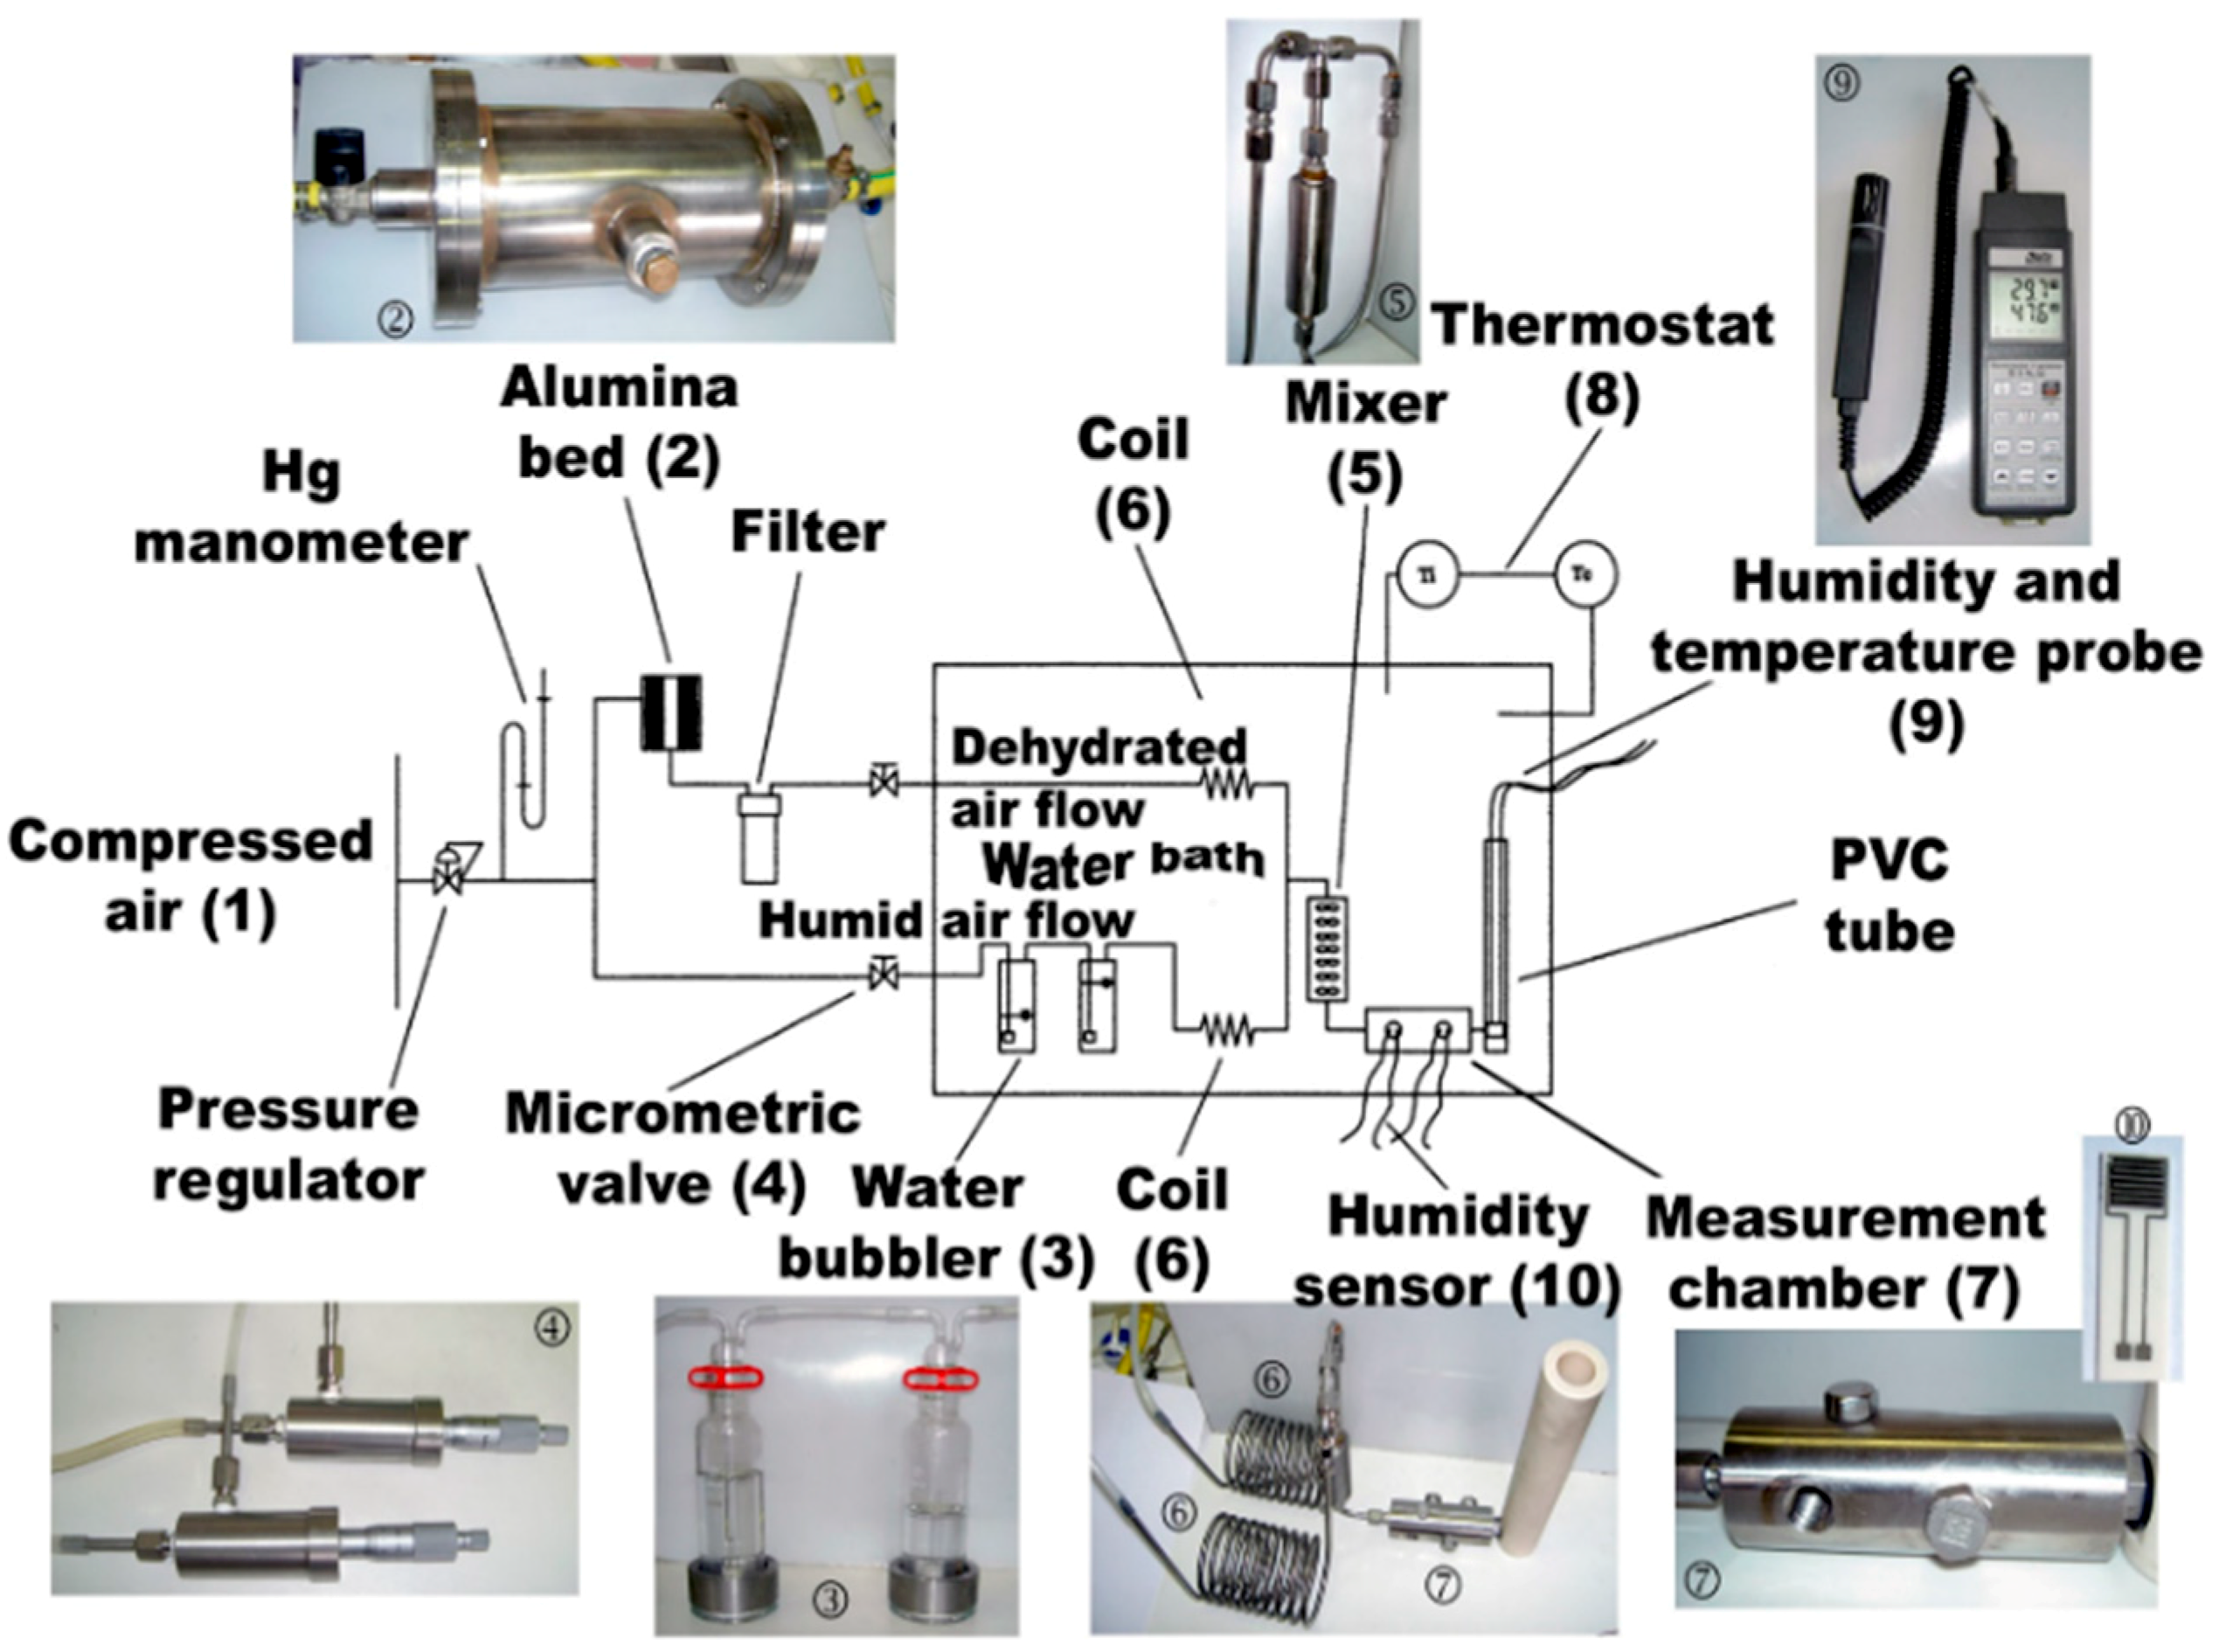
2.3. Humidity Analysis Setup
3. Results
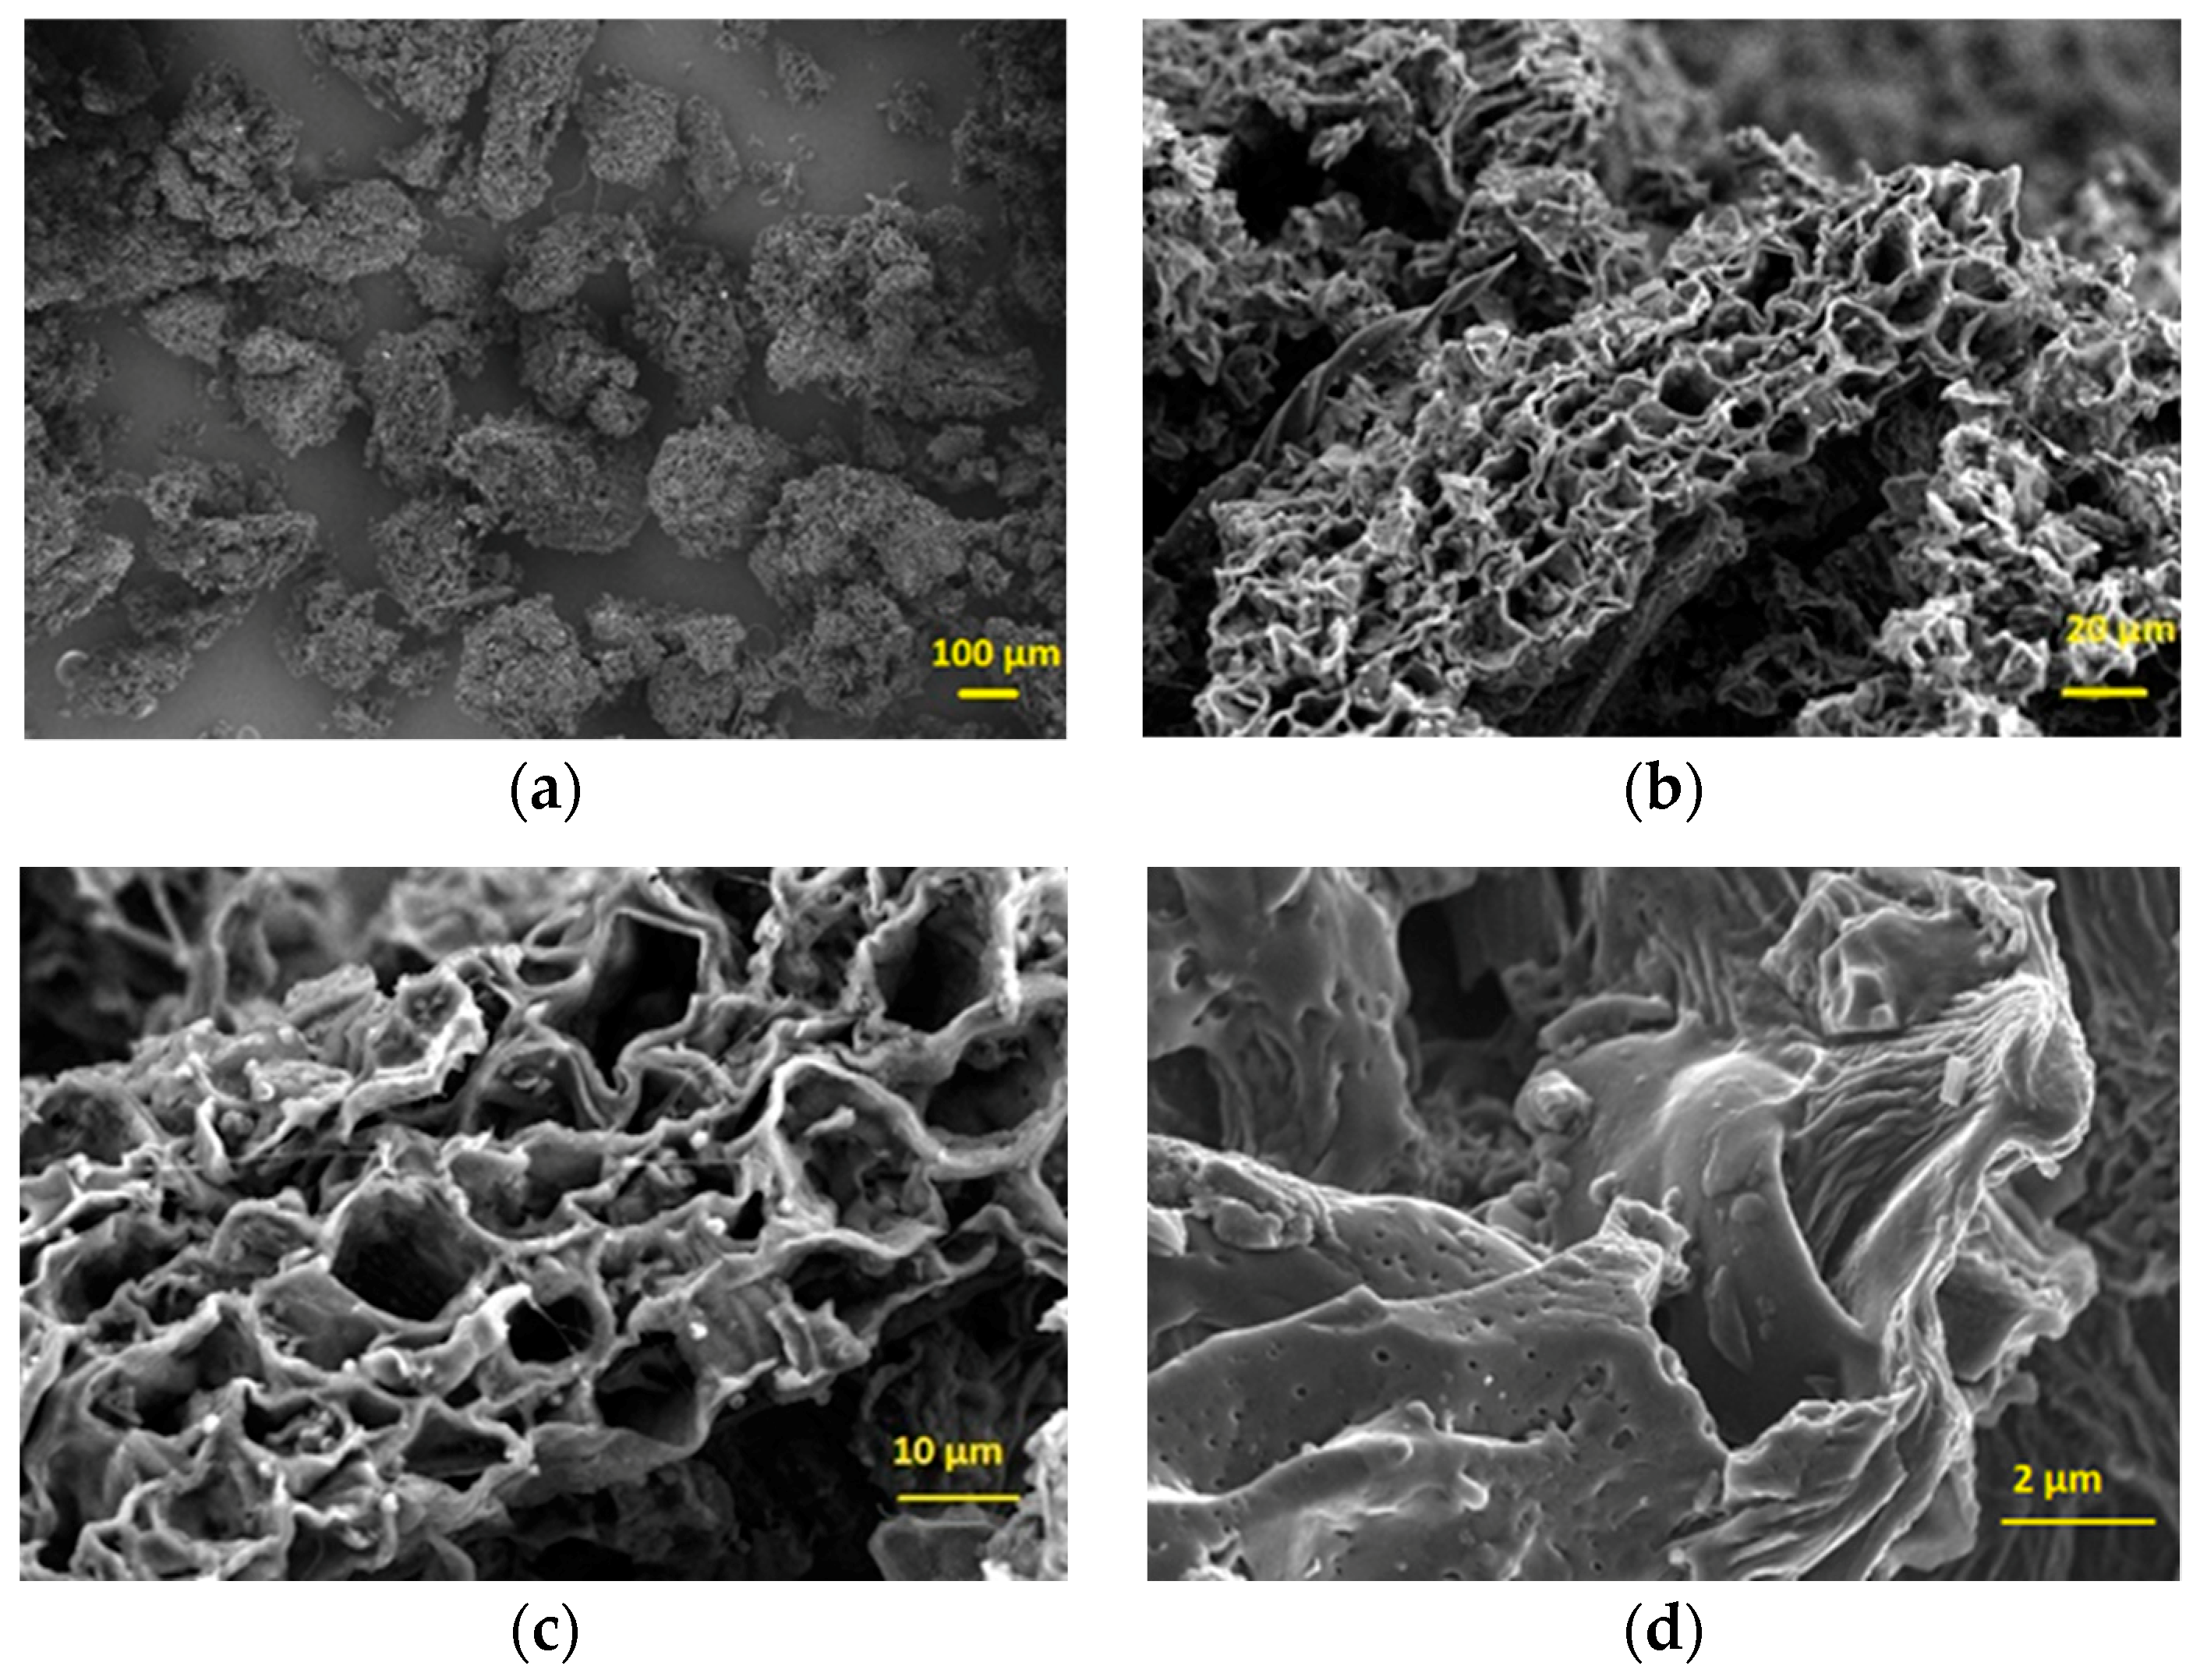
3.1. FESEM-EDS Characterization
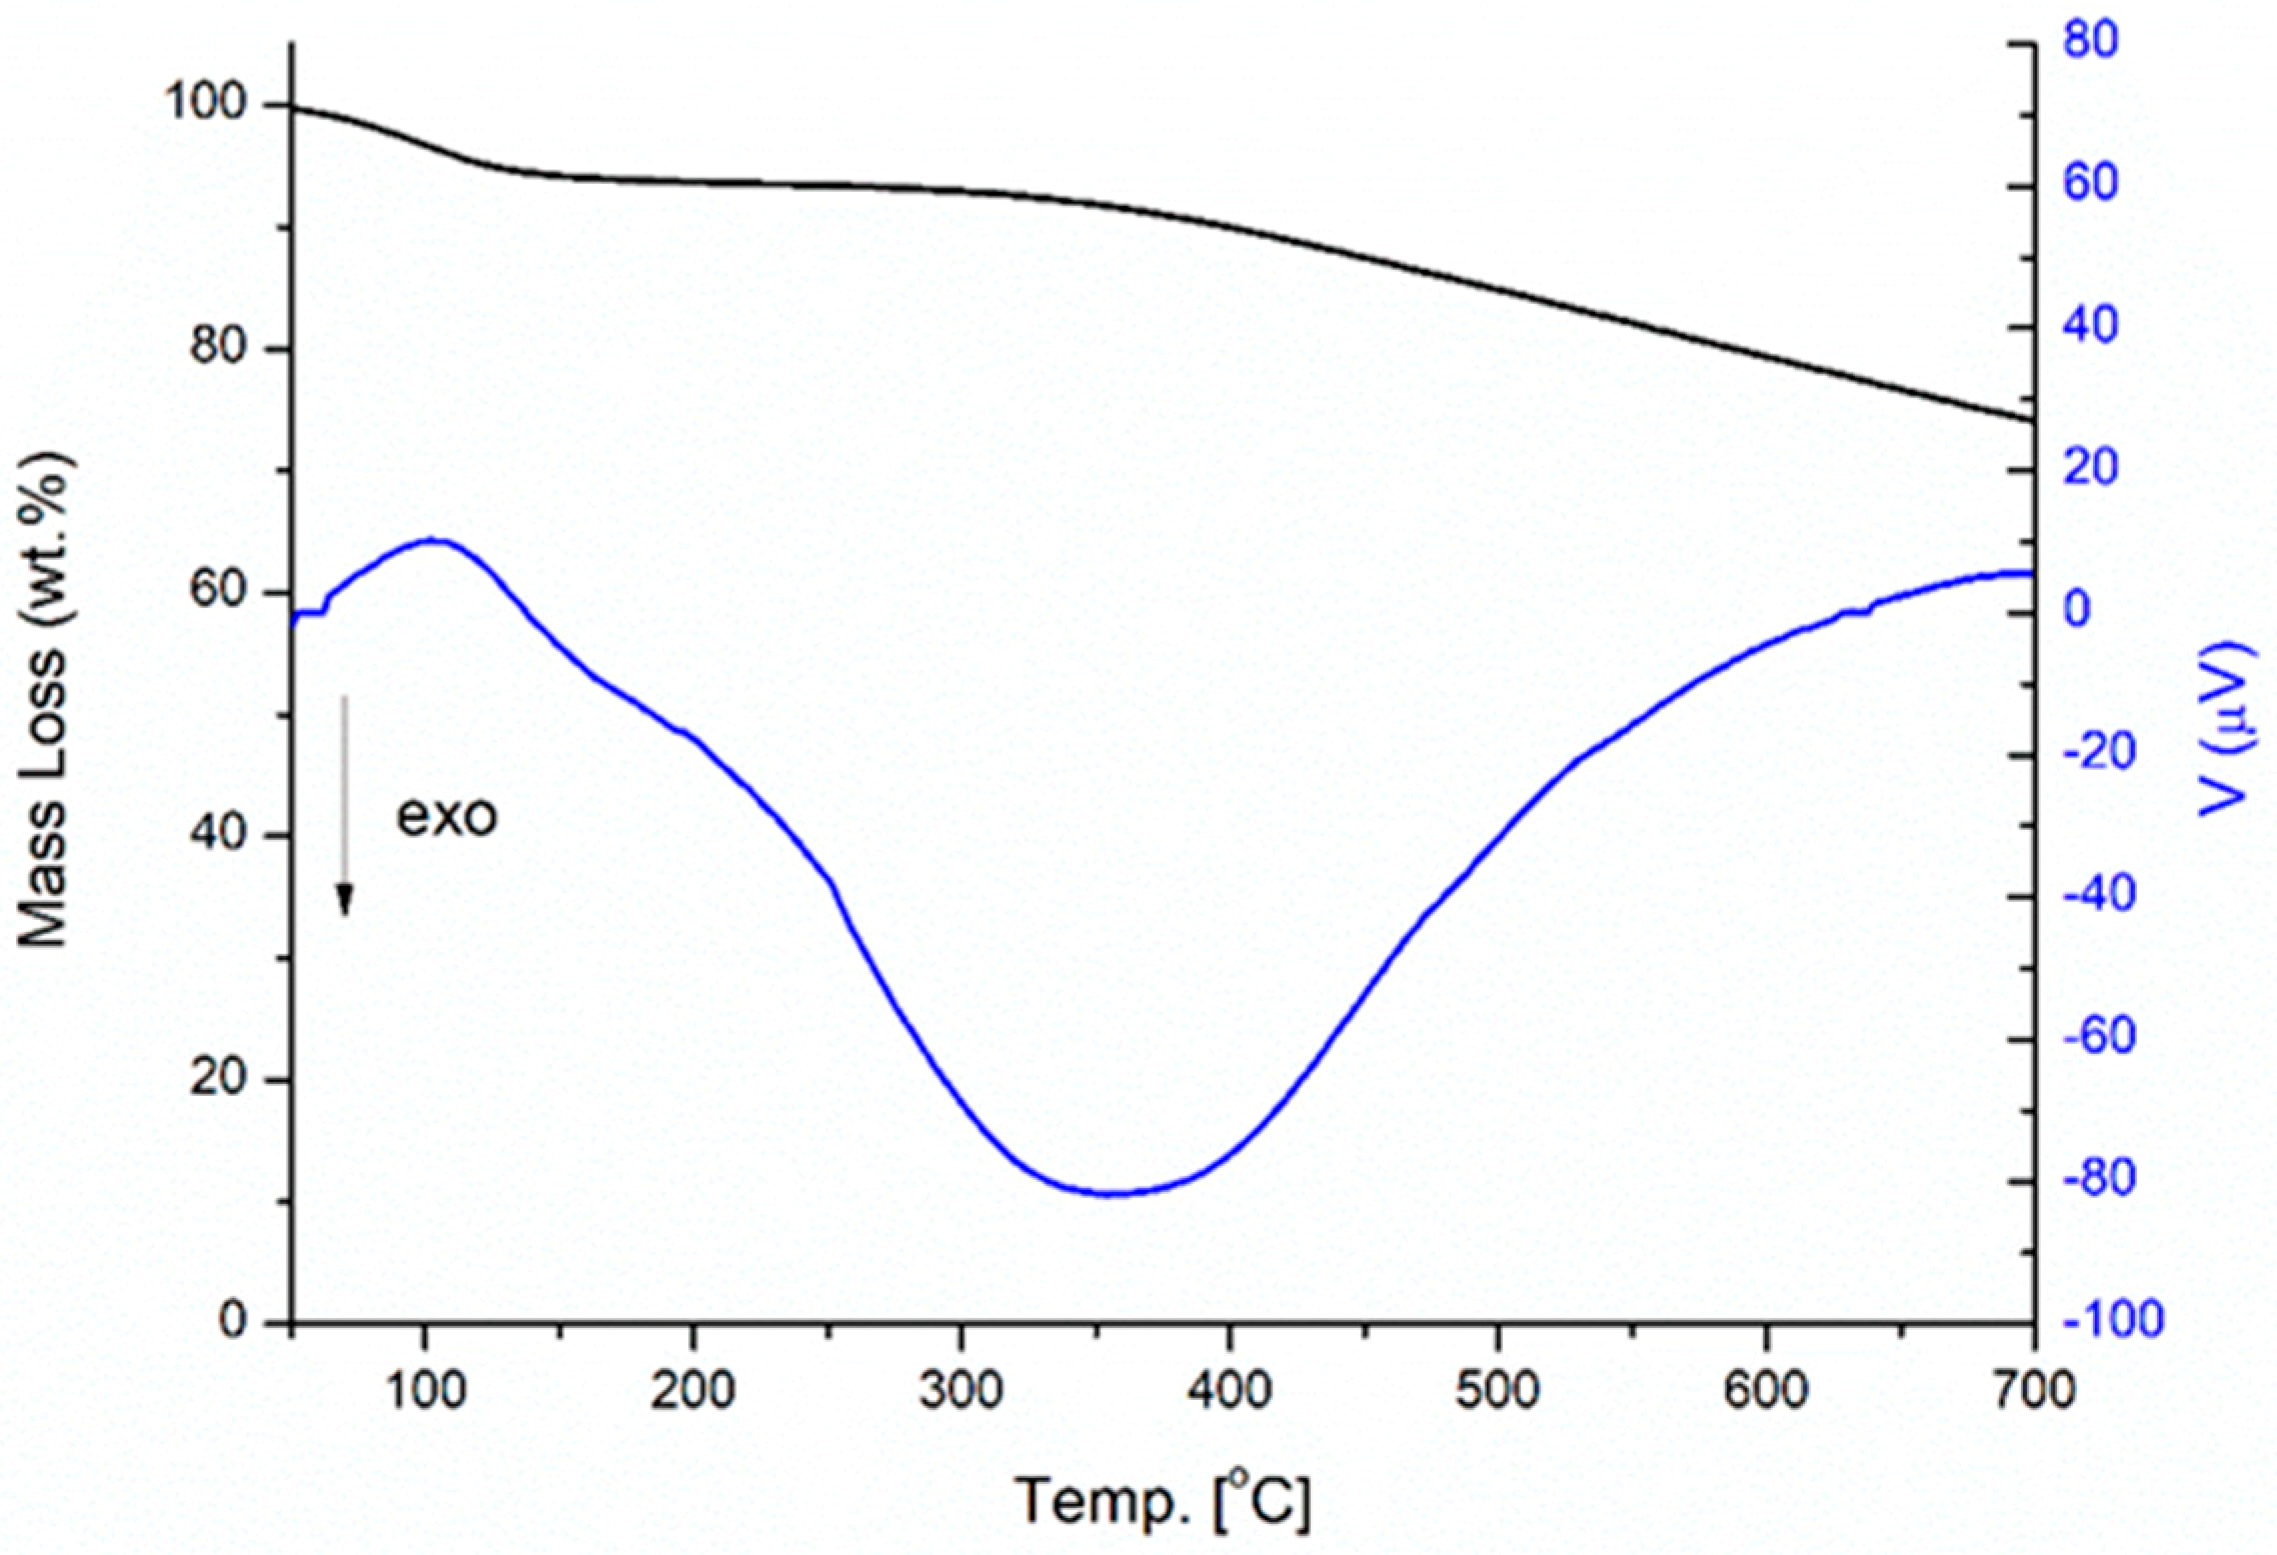
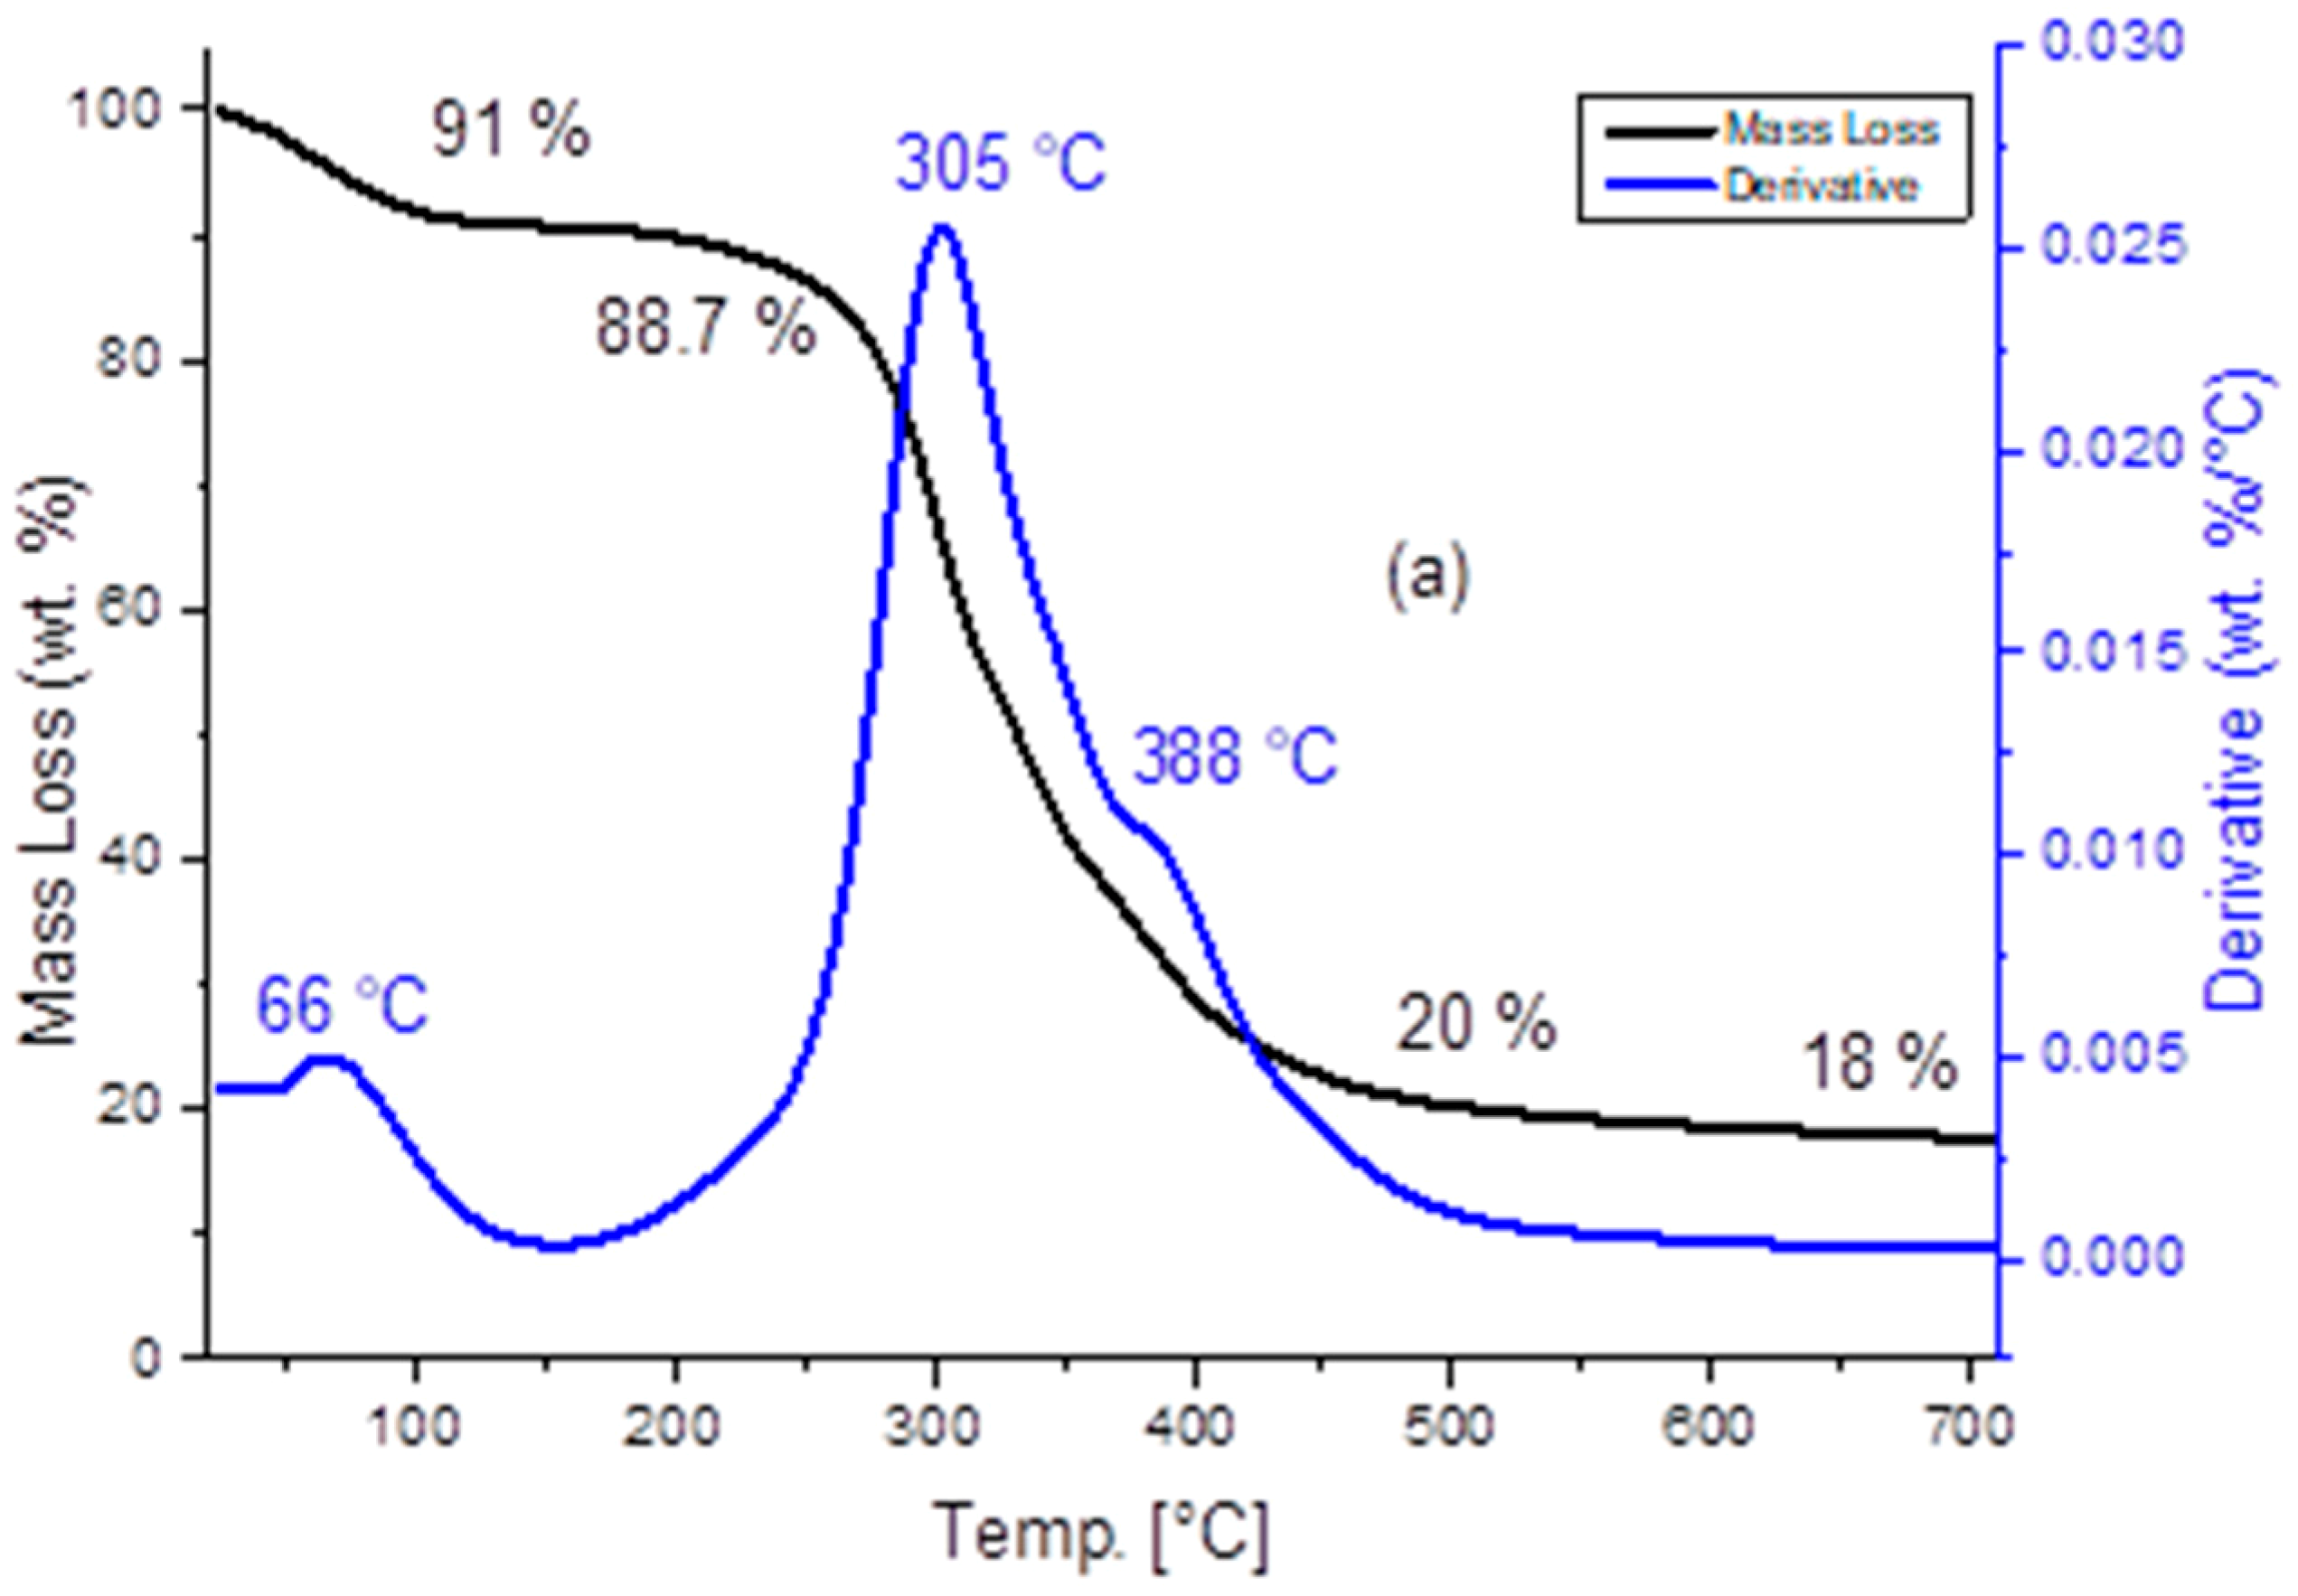
3.2. TGA Analysis
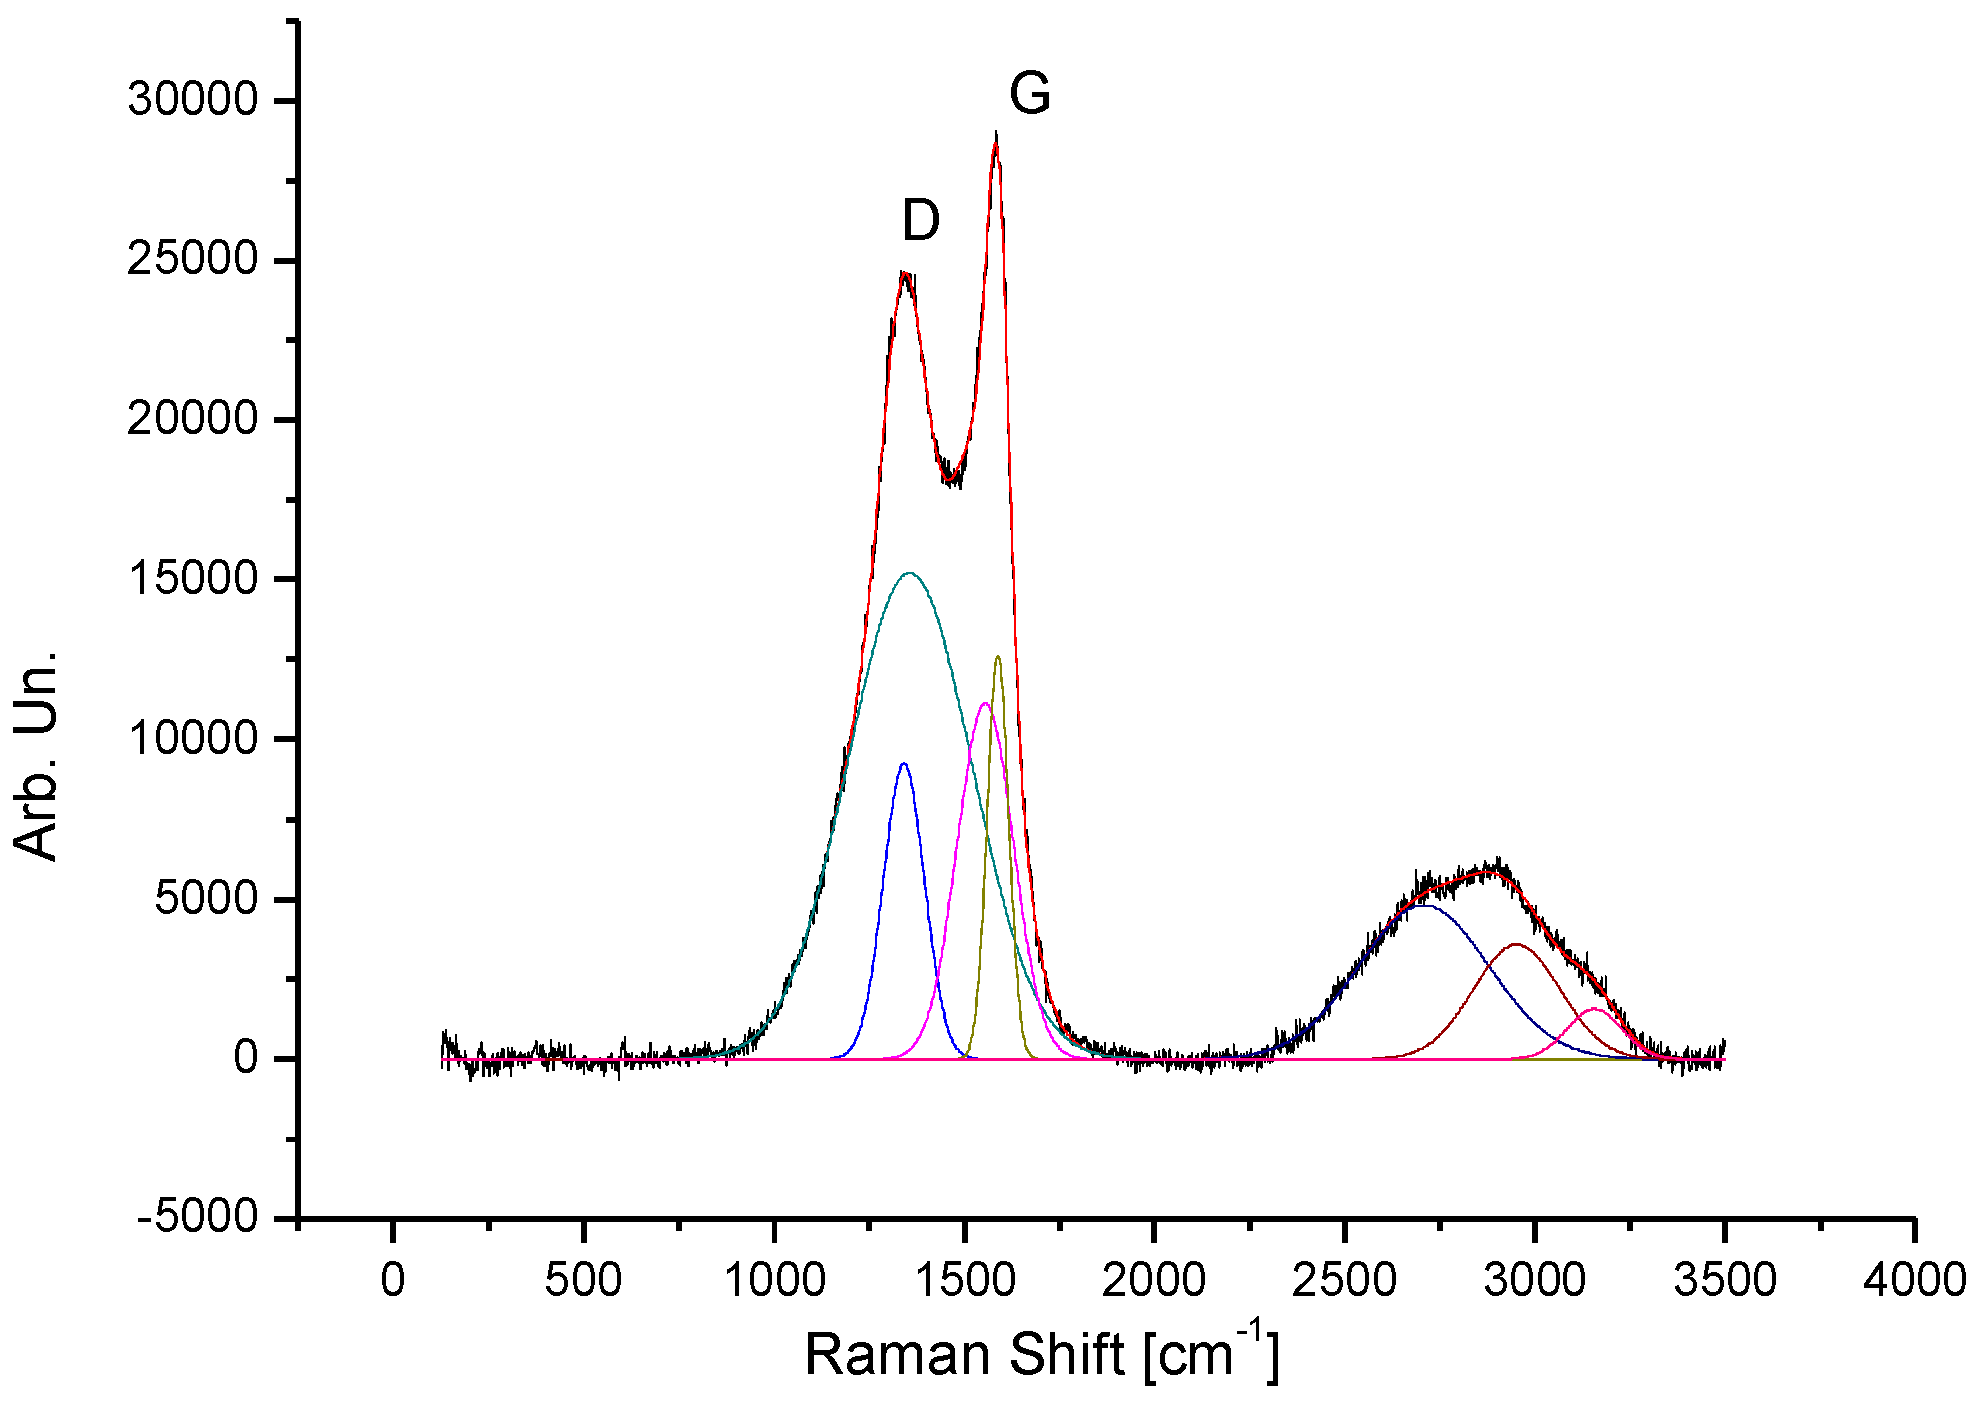
3.3. Raman Analysis
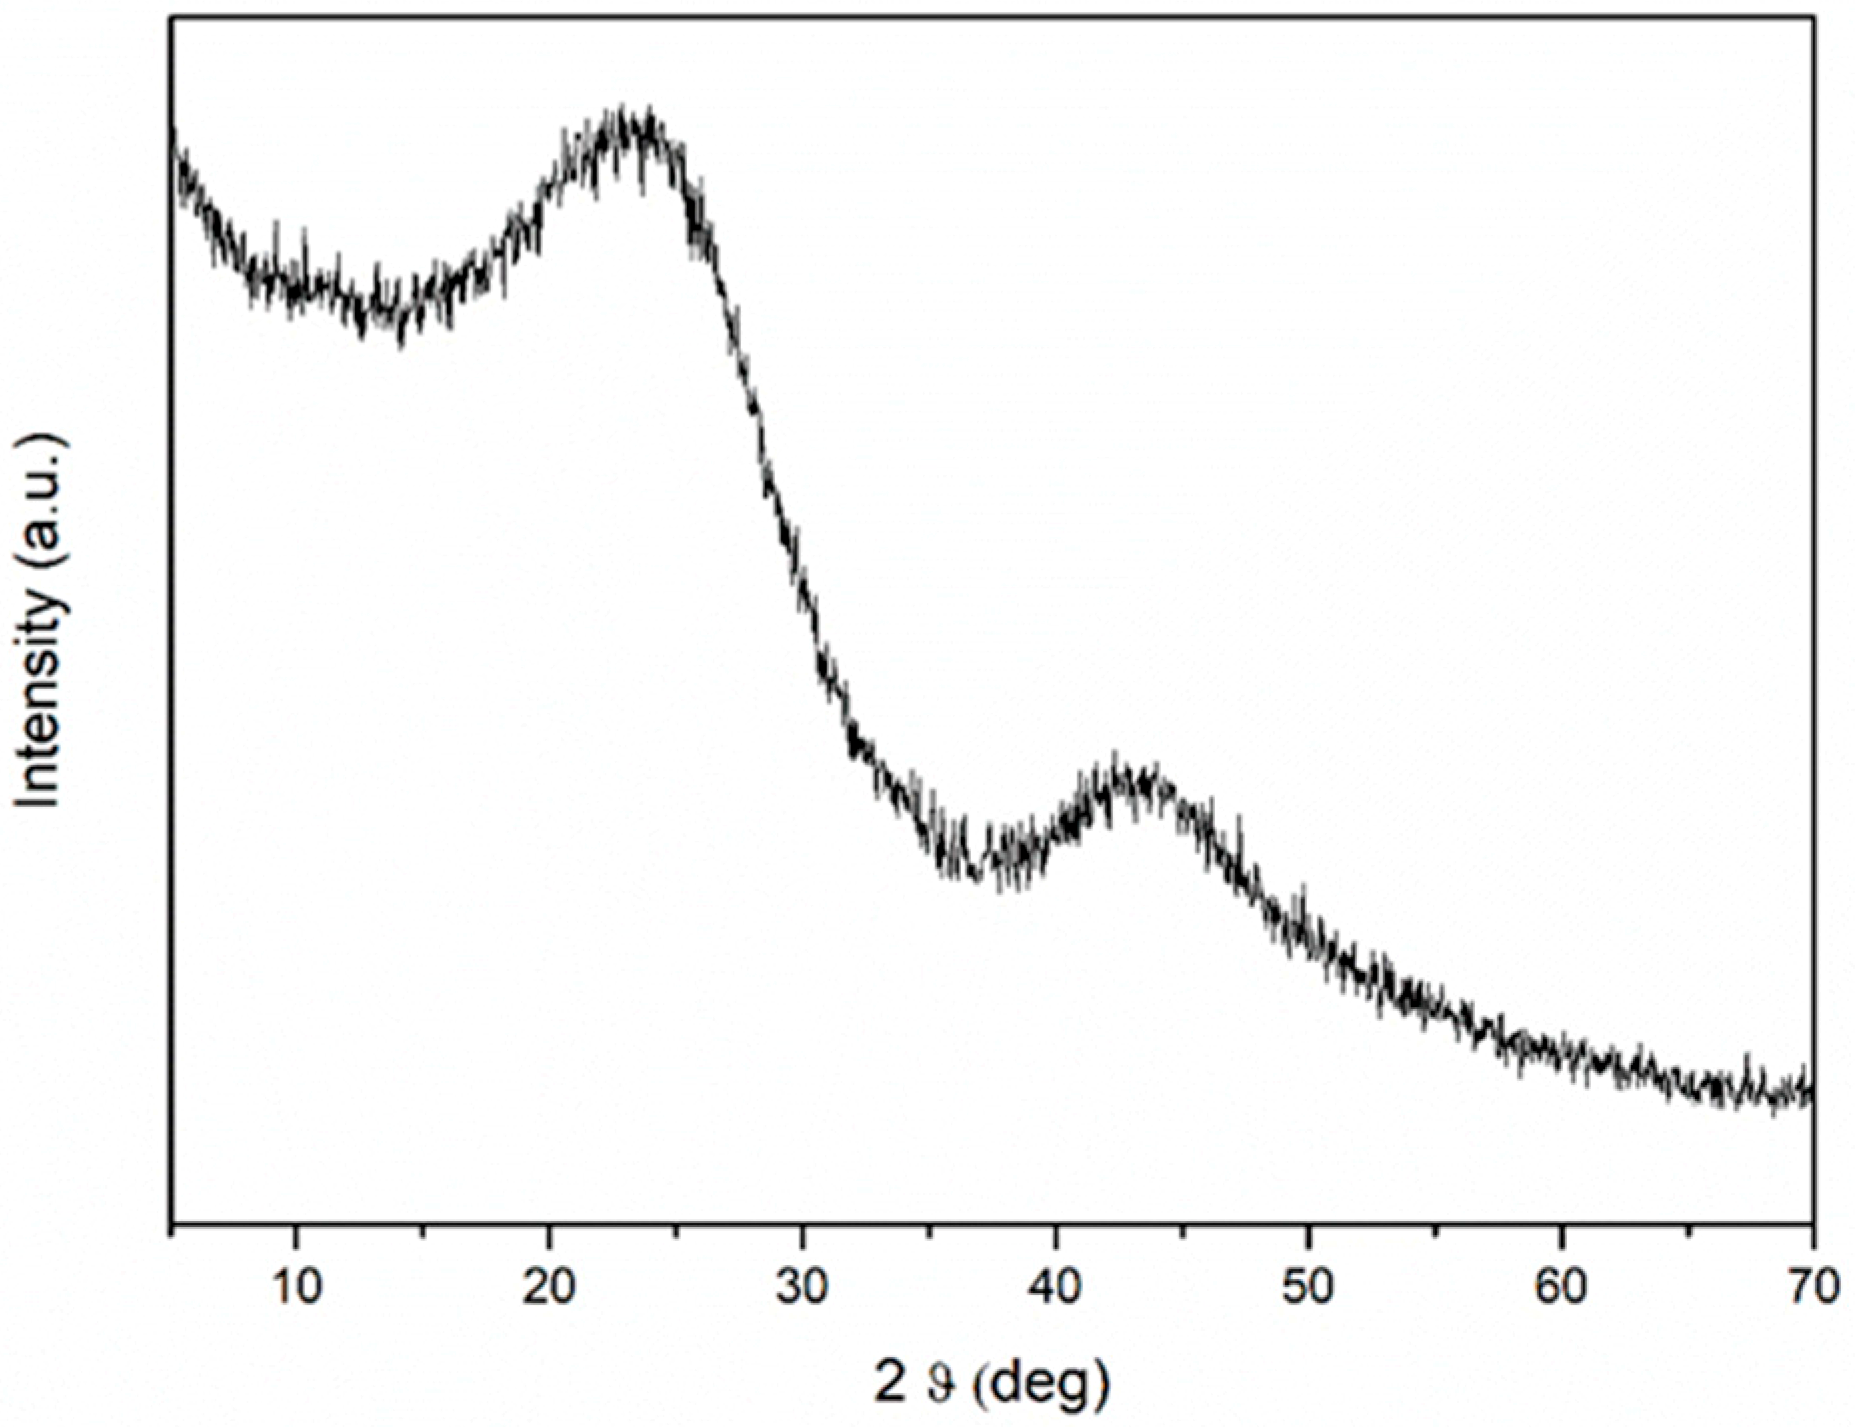
3.4. XRD
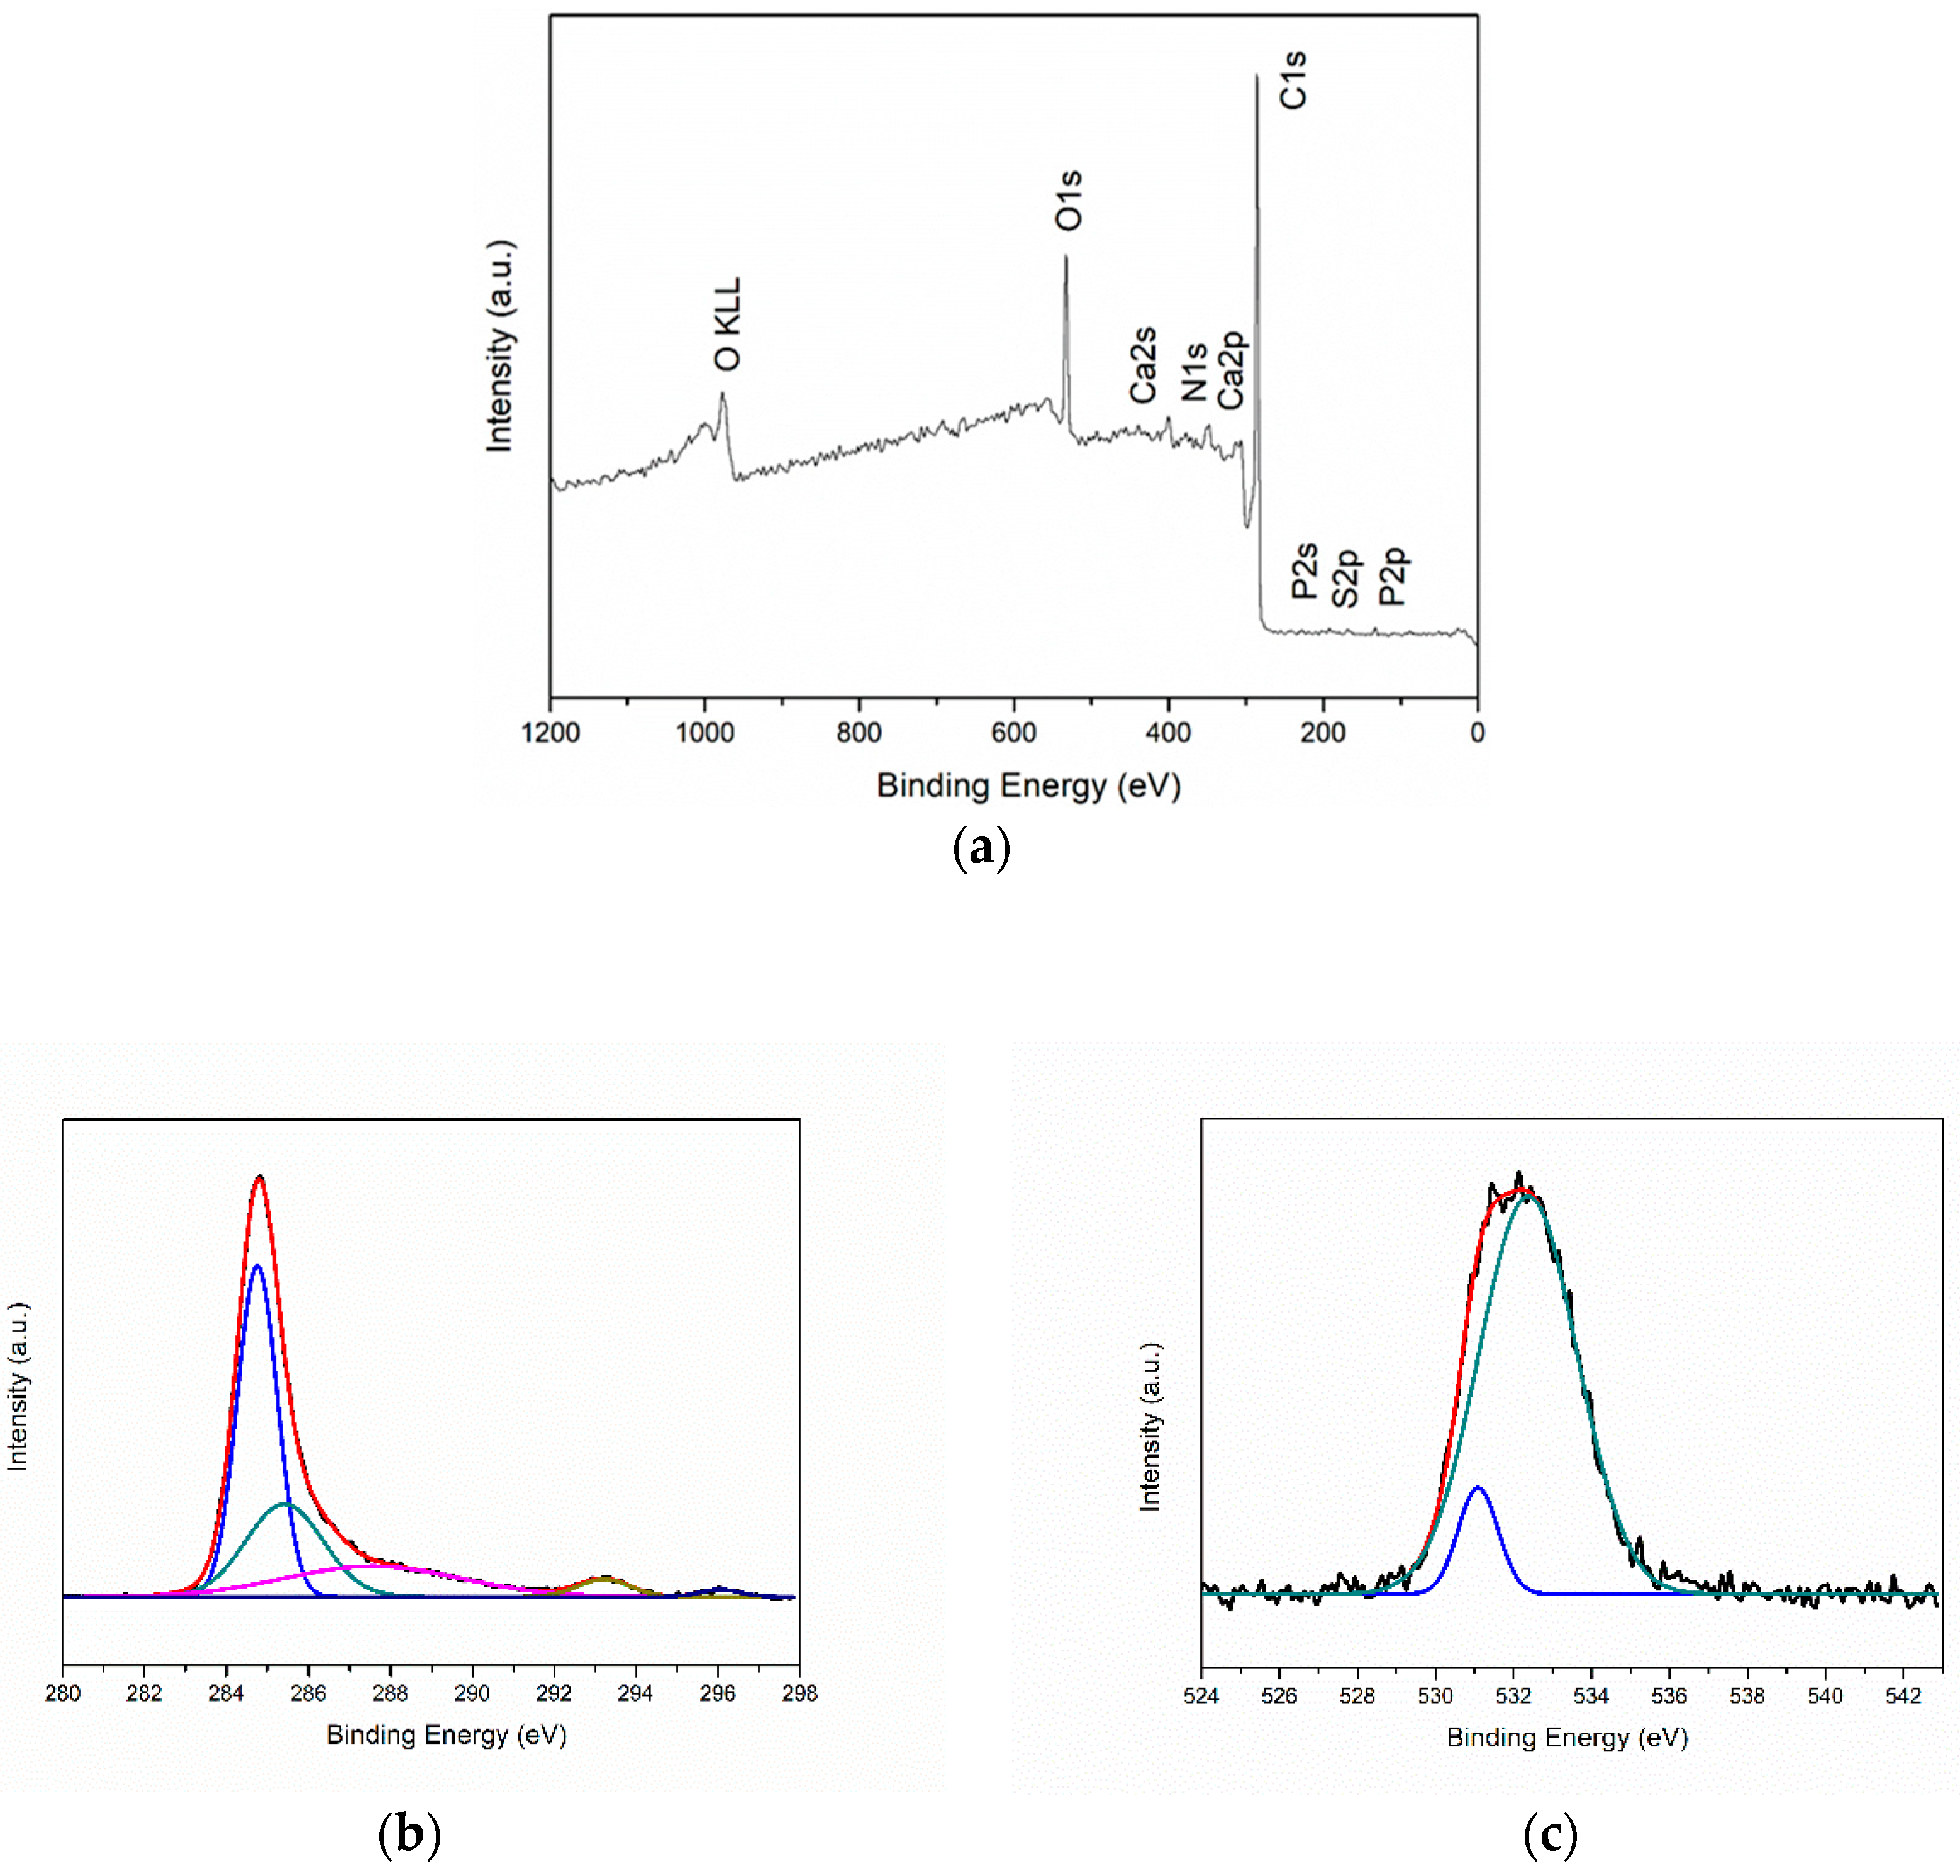
3.5. XPS Analysis
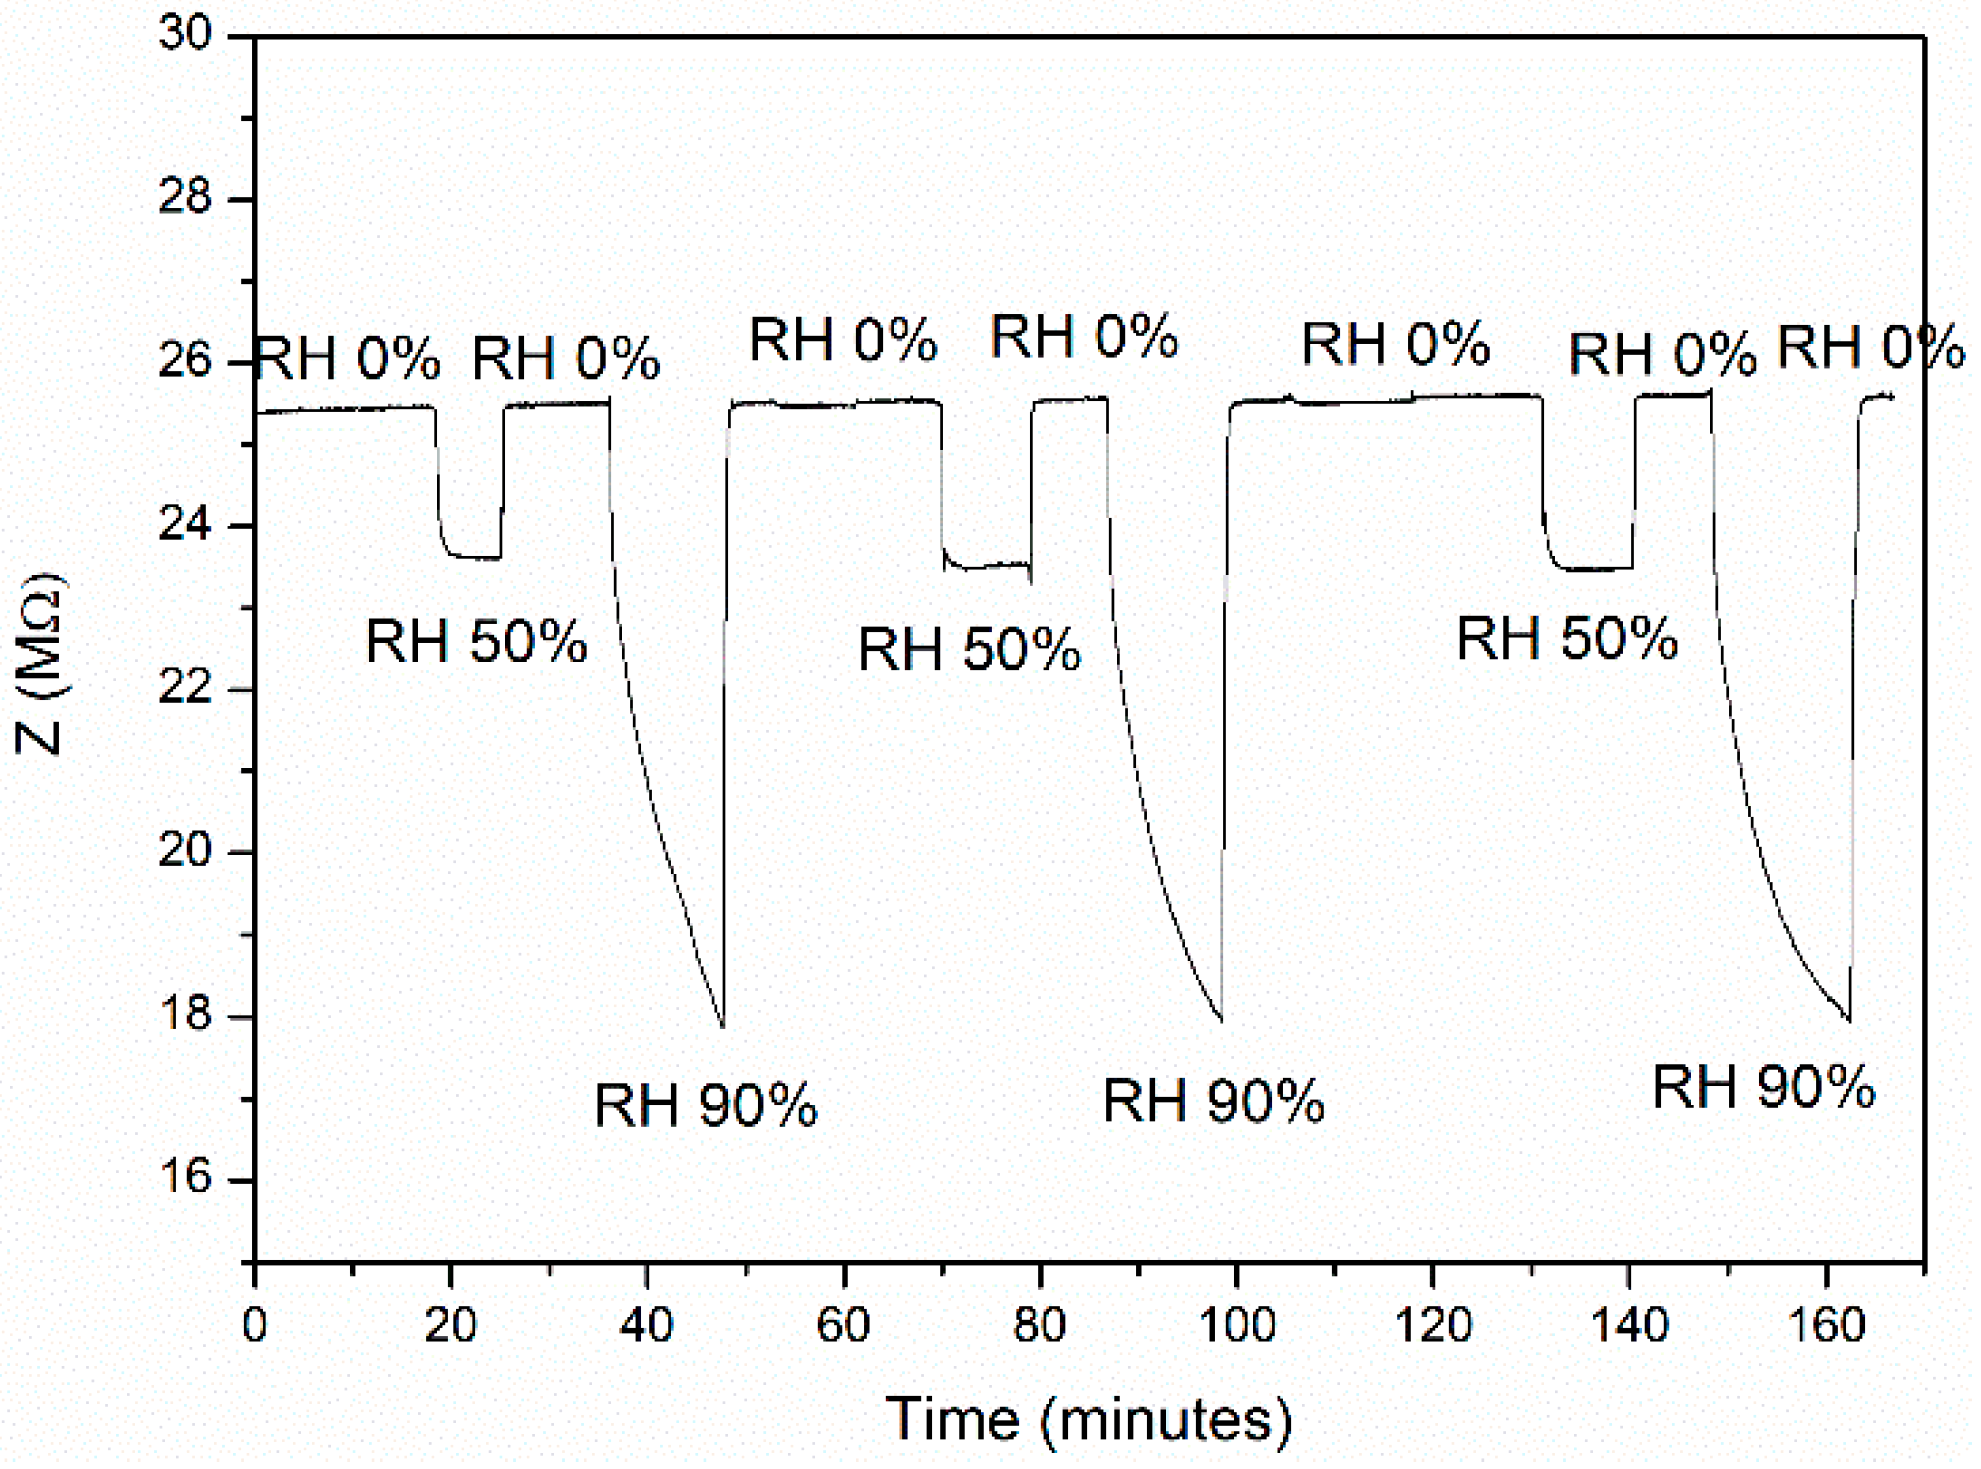
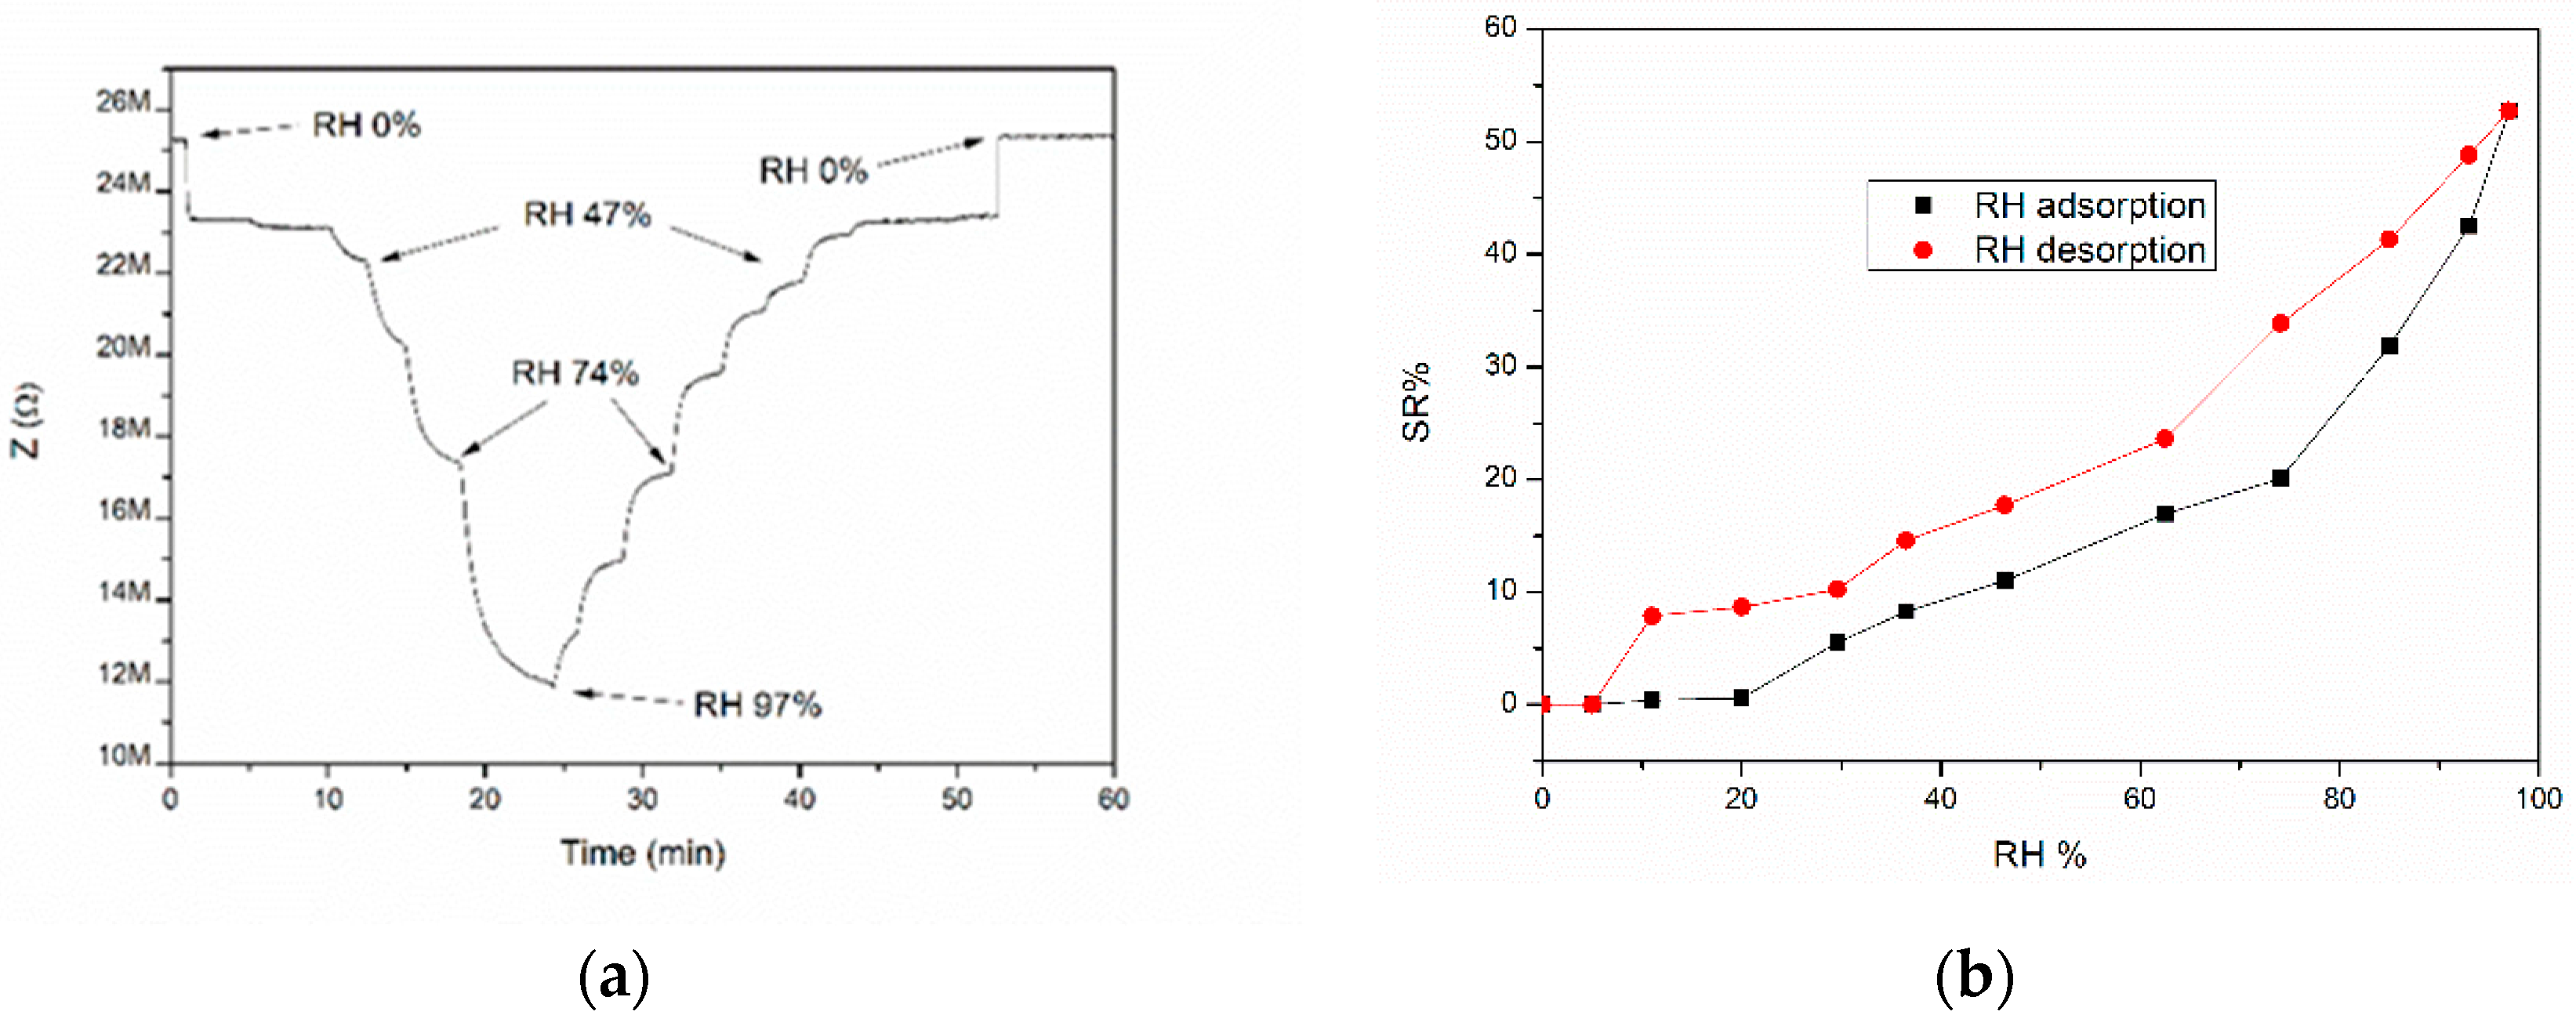
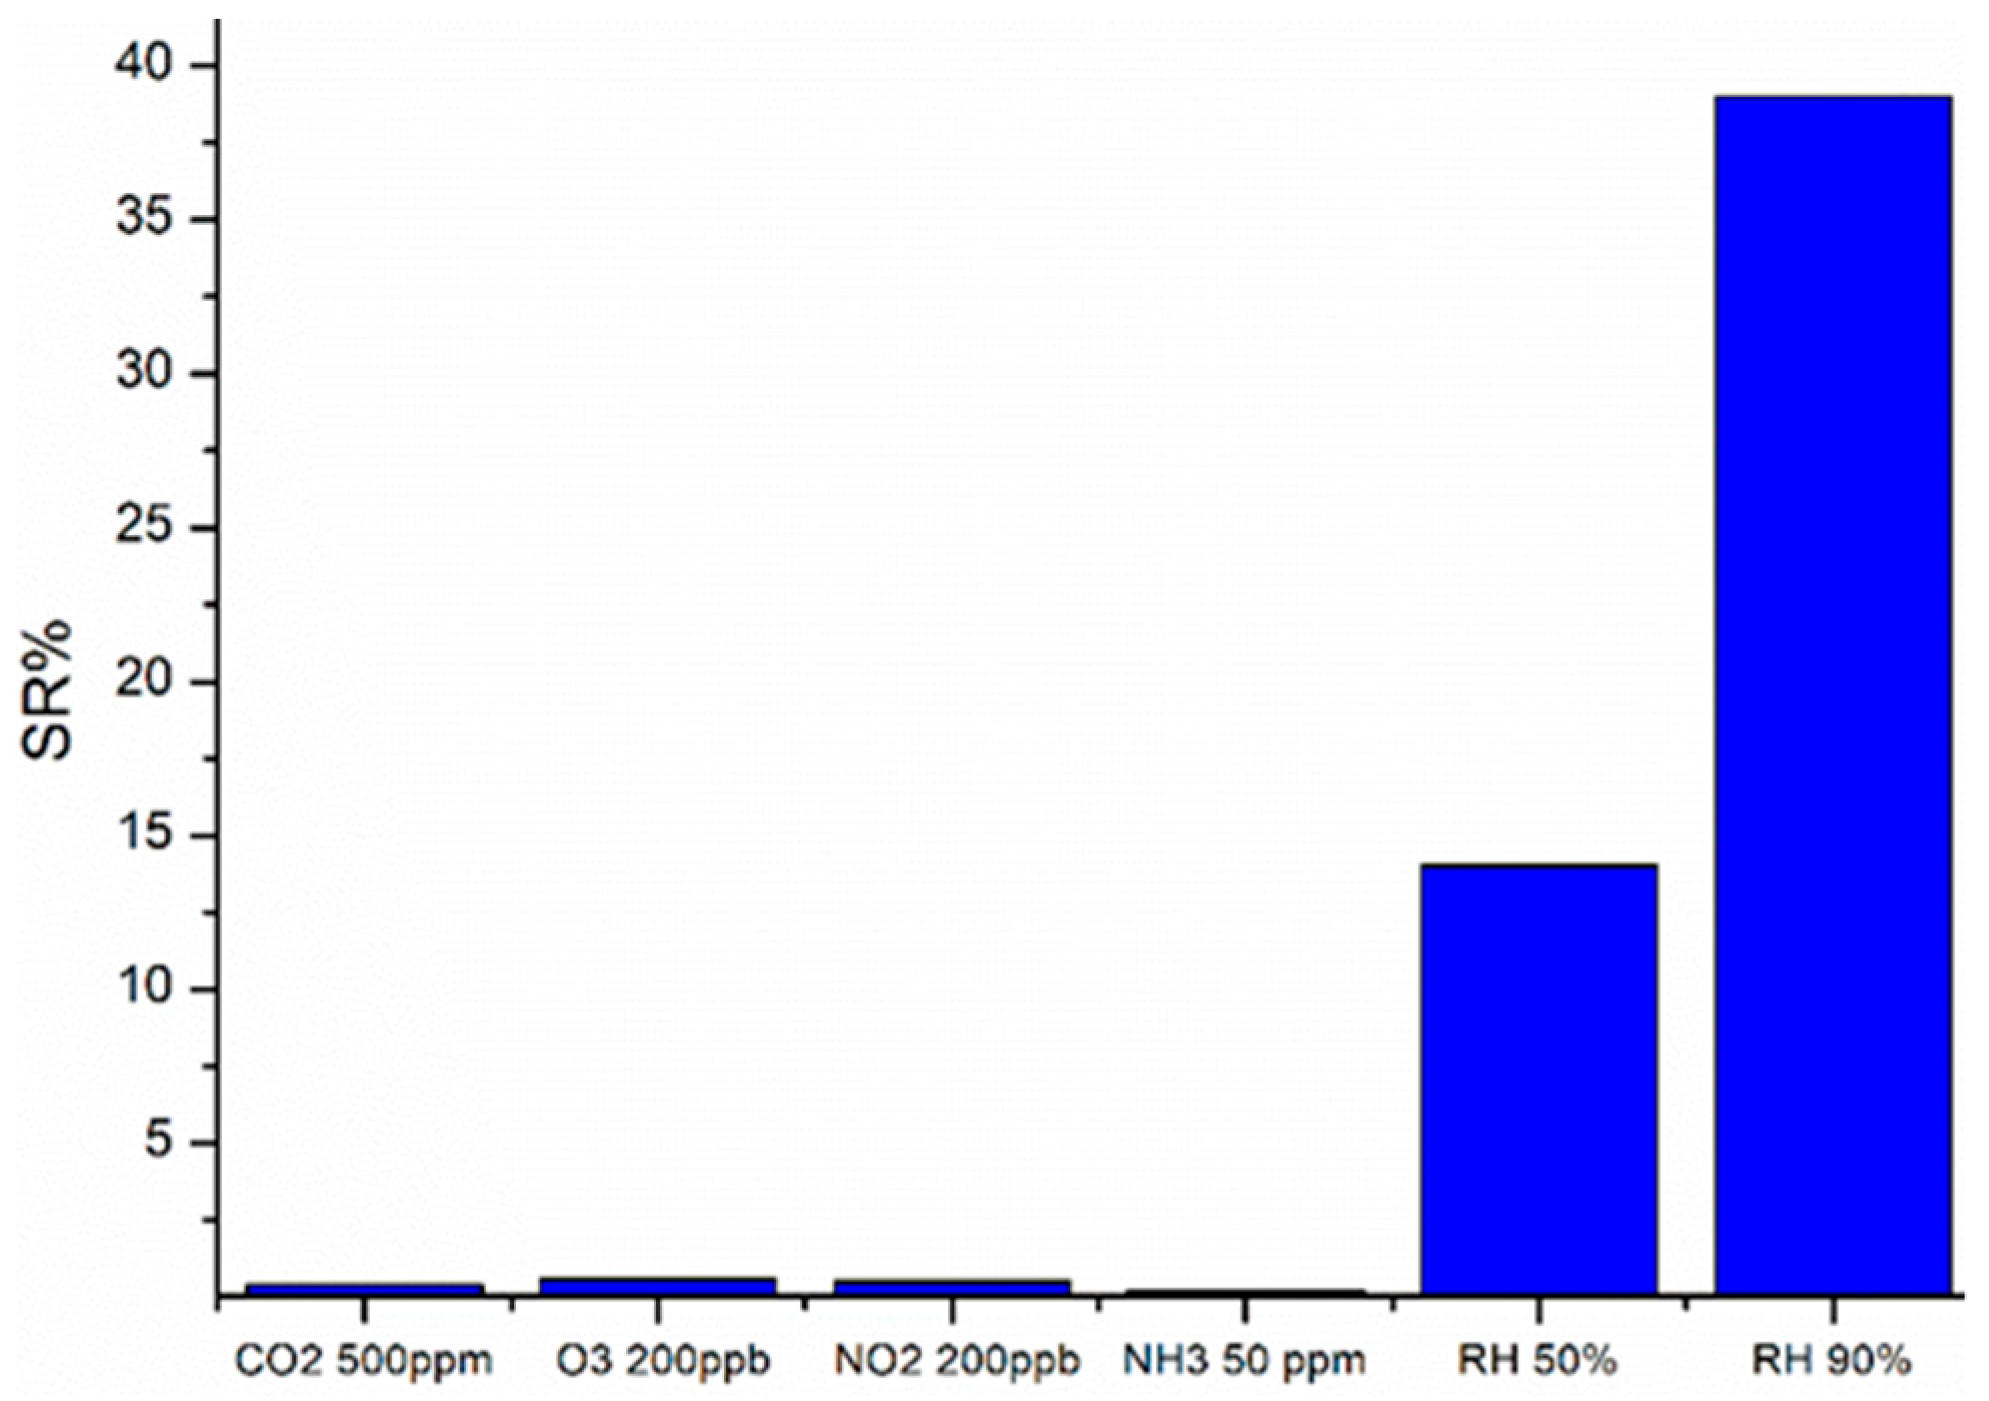
3.6. Sensor Response Characterization
4. Discussion
5. Conclusions
Supplementary Materials
Author Contributions
Funding
Acknowledgments
Conflicts of Interest
References
- Liu, F.; Piao, Y.; Choi, K.S.; Seo, T.S. Fabrication of free-standing graphene composite films as electrochemical biosensors. Carbon N. Y. 2012, 50, 123–133. [Google Scholar] [CrossRef]
- Sheng, Q.; Wang, M.; Zheng, J. A novel hydrogen peroxide biosensor based on enzymatically induced deposition of polyaniline on the functionalized graphene–carbon nanotube hybrid materials. Sens. Actuators B Chem. 2011, 160, 1070–1077. [Google Scholar] [CrossRef]
- Noman, M.; Sanginario, A.; Jagadale, P.; Demarchi, D.; Tagliaferro, A. Comparison of unusual carbon-based working electrodes for electrochemiluminescence sensors. Mater. Sci. Eng. C 2017, 75, 402–407. [Google Scholar] [CrossRef] [PubMed]
- Liu, Y.; Wang, M.; Zhao, F.; Xu, Z.; Dong, S. The direct electron transfer of glucose oxidase and glucose biosensor based on carbon nanotubes/chitosan matrix. Biosens. Bioelectron. 2005, 21, 984–988. [Google Scholar] [CrossRef] [PubMed]
- Afify, A.S.; Ahmad, S.; Khushnood, R.A.; Jagdale, P.; Tulliani, J.-M. Elaboration and characterization of novel humidity sensor based on micro-carbonized bamboo particles. Sens. Actuators B Chem. 2017, 239, 1251–1256. [Google Scholar] [CrossRef]
- Lin, Y.; Taylor, S.; Li, H.; Fernando, K.A.S.; Qu, L.; Wang, W.; Gu, L.; Zhou, B.; Sun, Y.-P. Advances toward bioapplications of carbon nanotubes. J. Mater. Chem. 2004, 14, 527–541. [Google Scholar] [CrossRef]
- Tîlmaciu, C.-M.; Morris, M.C. Carbon nanotube biosensors. Front. Chem. 2015, 3, 1–21. [Google Scholar] [CrossRef]
- Sadik, O.A.; Zhou, A.L.; Kikandi, S.; Du, N.; Wang, Q.; Varner, K. Sensors as tools for quantitation, nanotoxicity and nanomonitoring assessment of engineered nanomaterials. J. Environ. Monit. 2009, 11, 1782–1800. [Google Scholar] [CrossRef]
- Jia, G.; Wang, H.; Yan, L.; Wang, X.; Pei, R.; Rongjuan, Y.; Yan, T.; Zhao, Y.; Guo, X. Cytotoxicity of Carbon Nanomaterials: Single-Wall Nanotube, Multi-Wall Nanotube, and Fullerene. Environ. Sci. Technol. 2005, 39, 1378–1383. [Google Scholar] [CrossRef]
- Hu, B.; Wang, K.; Wu, L.; Yu, S.-H.; Antonietti, M.; Titirici, M.-M. Engineering Carbon Materials from the Hydrothermal Carbonization Process of Biomass. Adv. Mater. 2010, 22, 813–828. [Google Scholar] [CrossRef]
- Murthy, P.S.; Naidu, M. Sustainable management of coffee industry by-products and value addition—A review. Resour. Conserv. Recycl. 2012, 66, 45–58. [Google Scholar] [CrossRef]
- Halstead, T. Coffee: World Markets and Trade. Available online: https://www.fas.usda.gov/data/coffee-world-markets-and-trade (accessed on 14 October 2018).
- Adriana, F. Coffee Constituents. In Coffee: Emerging Health Effects and Disease Prevention; Chu, Y.-F., Ed.; IFT Press series; Wiley: Oxford, UK, 2012; pp. 21–50. ISBN 9780470958780. [Google Scholar]
- Sette, J. Country Coffee Profile. Available online: http://www.ico.org/documents/cy2016-17/icc-120-6e-profile-italy.pdf (accessed on 9 October 2018).
- Yvonne, T.; Flament, I. Coffee Flavor Chemistry, 1st ed.; Yvonne, T., Flament, I., Eds.; Wiley: West Sussex, UK, 2002; ISBN1 0471720380. ISBN2 9780471720386. [Google Scholar]
- Clarke, R.J. Coffee; Clarke, R.J., Ed.; Springer: Dordrecht, The Netherlands, 1987; Volume 1, ISBN 978-9401086936. [Google Scholar]
- Clifford, M.N.; Ramirez-Martinez, J.R. Phenols and caffeine in wet-processed coffee beans and coffee pulp. Food Chem. 1991, 40, 35–42. [Google Scholar] [CrossRef]
- Clifford, M.N.; Kazi, T. The influence of coffee bean maturity on the content of chlorogenic acids, caffeine and trigonelline. Food Chem. 1987, 26, 59–69. [Google Scholar] [CrossRef]
- Duarte, G.; Pereira, A.; Marques, V.; Farah, A. Comparison of chlorogenic acids contents in Coffea arabica, Coffea canephora and hybrids resistant to Meloidogyne exigua. In Proceedings of the 22nd International Conference on Coffee Science ASIC 2008, Campinas, Brazil, 14–19 September 2008; 2009; pp. 508–512. [Google Scholar]
- Lindinger, Y.C.; Jordan, A.A. Analysing the headspace of coffee by proton-transfer-reaction mass-spectrometry. Int. J. Mass Spectrom. 2002, 223–224, 115–139. [Google Scholar] [CrossRef]
- Leifa, F.; Pandey, A.; Soccol, C.R. Production of Flammulina velutipes on coffee husk and coffee spent-ground. Braz. Arch. Biol. Technol. 2001, 44, 205–212. [Google Scholar] [CrossRef]
- Figueroa, G.A.; Homann, T.; Rawel, H.M. Coffee Production Wastes: Potentials and Perspectives. Austin Food Sci. 2016, 1, 1014–1018. [Google Scholar]
- Kondamudi, N.; Mohapatra, S.K.; Misra, M. Spent Coffee Grounds as a Versatile Source of Green Energy. J. Agric. Food Chem. 2008, 56, 11757–11760. [Google Scholar] [CrossRef] [PubMed]
- Mussatto, S.I.; Roberto, I.C. Acid hydrolysis and fermentation of brewer’s spent grain to produce xylitol. J. Sci. Food Agric. 2005, 85, 2453–2460. [Google Scholar] [CrossRef]
- Mussatto, S.I.; Dragone, G.; Fernandes, M.; Milagres, A.M.F.; Roberto, I.C. The effect of agitation speed, enzyme loading and substrate concentration on enzymatic hydrolysis of cellulose from brewer’s spent grain. Cellulose 2008, 15, 711–721. [Google Scholar] [CrossRef]
- Mussatto, S.I.; Carneiro, L.M.; Silva, J.P.A.; Roberto, I.C.; Teixeira, J.A. A study on chemical constituents and sugars extraction from spent coffee grounds. Carbohydr. Polym. 2011, 83, 368–374. [Google Scholar] [CrossRef]
- Mussatto, S.I.; Machado, E.M.S.; Martins, S.; Teixeira, J.A. Production, Composition, and Application of Coffee and Its Industrial Residues. Food Bioprocess Technol. 2011, 4, 661–672. [Google Scholar] [CrossRef]
- Mussatto, S.I.; Dragone, G.; Roberto, I.C. Brewers’ spent grain: generation, characteristics and potential applications. J. Cereal Sci. 2006, 43, 1–14. [Google Scholar] [CrossRef]
- Aznar, J.S. Characterization of Activated Carbon Produced from Coffee Residues by Chemical and Physical Activation. Available online: http://www.diva-portal.org/smash/get/diva2:414291/FULLTEXT01.pdf (accessed on 8 November 2018).
- Pokhrel, S.; Jeyaraj, B.; Nagaraja, K.S. Humidity-sensing properties of ZnCr2O4–ZnO composites. Mater. Lett. 2003, 57, 3543–3548. [Google Scholar] [CrossRef]
- Chen, Y.S.; Li, Y.; Yang, M.J. Humidity sensitive properties of NaPSS/MWNTs nanocomposites. J. Mater. Sci. 2005, 40, 5037–5039. [Google Scholar] [CrossRef]
- Zhang, Y.; Yu, K.; Jiang, D.; Zhu, Z.; Geng, H.; Luo, L. Zinc oxide nanorod and nanowire for humidity sensor. Appl. Surf. Sci. 2005, 242, 212–217. [Google Scholar] [CrossRef]
- Farahani, H.; Wagiran, R.; Hamidon, M.; Farahani, H.; Wagiran, R.; Hamidon, M.N. Humidity Sensors Principle, Mechanism, and Fabrication Technologies: A Comprehensive Review. Sensors 2014, 14, 7881–7939. [Google Scholar] [CrossRef] [PubMed]
- Tripathy, A.; Pramanik, S.; Manna, A.; Bhuyan, S.; Azrin Shah, N.; Radzi, Z.; Abu Osman, N. Design and Development for Capacitive Humidity Sensor Applications of Lead-Free Ca,Mg,Fe,Ti-Oxides-Based Electro-Ceramics with Improved Sensing Properties via Physisorption. Sensors 2016, 16, 1135. [Google Scholar] [CrossRef] [PubMed]
- Shah, J.; Kotnala, R.K.; Singh, B.; Kishan, H. Microstructure-dependent humidity sensitivity of porous MgFe2O4–CeO2 ceramic. Sens. Actuators B Chem. 2007, 128, 306–311. [Google Scholar] [CrossRef]
- Kemp, K.C.; Baek, S.B.; Lee, W.-G.; Meyyappan, M.; Kim, K.S. Activated carbon derived from waste coffee grounds for stable methane storage. Nanotechnology 2015, 26, 385602. [Google Scholar] [CrossRef]
- Jagdale, P.; Sharon, M.; Kalita, G.; Maldar, N.N.; Sharon, M. Carbon Nano Material Synthesis from Polyethylene by Chemical Vapor Deposition. Adv. Mater. Phys. Chem. 2012, 2, 1–10. [Google Scholar] [CrossRef]
- Traversa, E.; Sadaoka, Y.; Carotta, M.C.; Martinelli, G. Environmental monitoring field tests using screen-printed thick-film sensors based on semiconducting oxides. Sens. Actuators B Chem. 2000, 65, 181–185. [Google Scholar] [CrossRef]
- Kunte, G.V.; Shivashankar, S.A.; Umarji, A.M. Humidity sensing characteristics of hydrotungstite thin films. Bull. Mater. Sci. 2008, 31, 835–839. [Google Scholar] [CrossRef]
- Prudenziati, M. Thick-film technology. Sens. Actuators A Phys. 1990, 25, 227–234. [Google Scholar] [CrossRef]
- Fraden, J. Handbook of Modern Sensors, 3rd ed.; Springer: New York, NY, USA, 2003; ISBN1 0387007504. ISBN2 9780387007502. [Google Scholar]
- Parascanu, M.M.; Sandoval-Salas, F.; Soreanu, G.; Valverde, J.L.; Sanchez-Silva, L. Valorization of Mexican biomasses through pyrolysis, combustion and gasification processes. Renew. Sustain. Energy Rev. 2017, 71, 509–522. [Google Scholar] [CrossRef]
- Llobet, E. Gas sensors using carbon nanomaterials: A review. Sens. Actuators B Chem. 2013, 179, 32–45. [Google Scholar] [CrossRef]
- Huang, Q.; Zeng, D.; Tian, S.; Xie, C. Synthesis of defect graphene and its application for room temperature humidity sensing. Mater. Lett. 2012, 83, 76–79. [Google Scholar] [CrossRef]
- Ziegler, D.; Palmero, P.; Giorcelli, M.; Tagliaferro, A.; Tulliani, J.-M.; Ziegler, D.; Palmero, P.; Giorcelli, M.; Tagliaferro, A.; Tulliani, J.-M. Biochars as Innovative Humidity Sensing Materials. Chemosensors 2017, 5, 35. [Google Scholar] [CrossRef]
- Paul, R.; Das, S.N.; Dalui, S.; Gayen, R.N.; Roy, R.K.; Bhar, R.; Pal, A.K. Synthesis of DLC films with different sp2/sp3 ratios and their hydrophobic behaviour. J. Phys. D. Appl. Phys. 2008, 41, 055309. [Google Scholar] [CrossRef]
- Chu, J.; Peng, X.; Feng, P.; Sheng, Y.; Zhang, J. Study of humidity sensors based on nanostructured carbon films produced by physical vapor deposition. Sens. Actuators B Chem. 2013, 178, 508–513. [Google Scholar] [CrossRef]
- Lukaszewicz, J.P. Carbon-film-based humidity sensor containing sodium or potassium. Recovery effect. Sens. Actuators B Chem. 1999, 60, 184–190. [Google Scholar] [CrossRef]
- Llobet, E.; Barberà-Brunet, R.; Etrillard, C.; Létard, J.F.; Debéda, H. Humidity Sensing Properties of Screen-printed Carbon-black an Fe(II) Spin Crossover Compound Hybrid Films. Procedia Eng. 2014, 87, 132–135. [Google Scholar] [CrossRef]
- Zhang, X.; Ming, H.; Liu, R.; Han, X.; Kang, Z.; Liu, Y.; Zhang, Y. Highly sensitive humidity sensing properties of carbon quantum dots films. Mater. Res. Bull. 2013, 48, 790–794. [Google Scholar] [CrossRef]
- Epeloa, J.; Repetto, C.E.; Gómez, B.J.; Nachez, L.; Dobry, A. Resistivity humidity sensors based on hydrogenated amorphous carbon films. Mater. Res. Express 2018, 6, 025604. [Google Scholar] [CrossRef]


| Label | Area [arb. un.] | Center [cm−1] | Width [cm−1] |
|---|---|---|---|
| D1 | 1.2 | 1341 | 54 |
| D2 | 6.6 | 1365 | 166 |
| G1 | 1.8 | 1559 | 68 |
| G2 | 0.8 | 1589 | 28 |
| 2D | 2.1 | 2708 | 168 |
| D+G | 0.8 | 2932 | 97 |
| 2G | 0.5 | 3130 | 85 |
| Sample | Resistance Change | Response Time | Recovery Time (s) | Ref. |
|---|---|---|---|---|
| C nanosheets produced by physical vapor deposition | Increase of 225% under 95 RH% | 30 s when RH% increases from 11% to 40% | 90 s when RH% decreases from 40% to 11% | [47] |
| Na-modified C films obtained by spray pyrolysis | Decrease of 97% under 60 RH% | n.d. | n.d. | [48] |
| Screen-printed commercial composite ink (ESL RS12113) made of epoxy resin and carbon powder | Increase of 4.8% under 80 RH% | n.d. | n.d. | [49] |
| Carbon quantum dots film made by electrochemical ablation of graphite | Resistivity decrease of 48% under 90 RH% | 25 s when RH% increases from 7% to 43% | 60 s when RH% decreases from 43% to 7% | [50] |
| Hydrogenated amorphous carbon (a-C:H) film | Decrease of 97.3% under 80 RH% | n.d. | n.d. | [51] |
| Pyrolyzed bamboo | Decrease of 91% under 95% RH | 2 min | 2 min | [5] |
| Pyrolyzed mixed softwood pellets | Decrease of 97.7% under 97.5% RH | 1 min | 1 min | [45] |
| Oil seed rape | Decrease of 94.5% under 99% RH | 50 s | 70 s | [45] |
| Coffee ground biochar | Decrease of 51% under 98%RH | 4.5 min | 1 min | This work |
© 2019 by the authors. Licensee MDPI, Basel, Switzerland. This article is an open access article distributed under the terms and conditions of the Creative Commons Attribution (CC BY) license (http://creativecommons.org/licenses/by/4.0/).
Share and Cite
Jagdale, P.; Ziegler, D.; Rovere, M.; Tulliani, J.M.; Tagliaferro, A. Waste Coffee Ground Biochar: A Material for Humidity Sensors. Sensors 2019, 19, 801. https://doi.org/10.3390/s19040801
Jagdale P, Ziegler D, Rovere M, Tulliani JM, Tagliaferro A. Waste Coffee Ground Biochar: A Material for Humidity Sensors. Sensors. 2019; 19(4):801. https://doi.org/10.3390/s19040801
Chicago/Turabian StyleJagdale, Pravin, Daniele Ziegler, Massimo Rovere, Jean Marc Tulliani, and Alberto Tagliaferro. 2019. "Waste Coffee Ground Biochar: A Material for Humidity Sensors" Sensors 19, no. 4: 801. https://doi.org/10.3390/s19040801
APA StyleJagdale, P., Ziegler, D., Rovere, M., Tulliani, J. M., & Tagliaferro, A. (2019). Waste Coffee Ground Biochar: A Material for Humidity Sensors. Sensors, 19(4), 801. https://doi.org/10.3390/s19040801