Article

Smartphone-Based Activity Recognition for Indoor Localization Using a Convolutional Neural Network †

1
College of Civil Engineering, Shenzhen University, Shenzhen 518060, China
2
Guangdong Key Laboratory of Urban Informatics, Shenzhen University, Shenzhen 518060, China
3
Shenzhen Key Laboratory of Spatial Smart Sensing and Services, Shenzhen University, Shenzhen 518060, China
4
Institute of Urban Smart Transportation & Safty Maintenance, Shenzhen University, Shenzhen 518060, China
*
Author to whom correspondence should be addressed.
This paper is an extended version of our paper published in “Smartphones based Online Activity Recognition for Indoor Localization using Deep Convolutional Neural Network”. In Proceeding of the Ubiquitous Positioning, Indoor Navigation and Location-Based Services, Wuhan, China, 22–23 March 2018.
Sensors 2019, 19(3), 621; https://doi.org/10.3390/s19030621
Submission received: 11 December 2018 / Revised: 22 January 2019 / Accepted: 29 January 2019 / Published: 1 February 2019
(This article belongs to the Special Issue Selected Papers from UPINLBS 2018)

Abstract

:
In the indoor environment, the activity of the pedestrian can reflect some semantic information. These activities can be used as the landmarks for indoor localization. In this paper, we propose a pedestrian activities recognition method based on a convolutional neural network. A new convolutional neural network has been designed to learn the proper features automatically. Experiments show that the proposed method achieves approximately 98% accuracy in about 2 s in identifying nine types of activities, including still, walk, upstairs, up elevator, up escalator, down elevator, down escalator, downstairs and turning. Moreover, we have built a pedestrian activity database, which contains more than 6 GB of data of accelerometers, magnetometers, gyroscopes and barometers collected with various types of smartphones. We will make it public to contribute to academic research.

1. Introduction

In the indoor environment, human activity contains rich semantic information, for example, if a user’s activity is recognized as taking an elevator, the location of the user can be inferred to the elevator. These activities can be used as the landmarks for indoor localization and mapping [1,2,3,4,5]. For example, when a user’s activity is detected as “elevator”, his/her location may be at the elevator. The recognition of human activities has been approached in two different ways, namely ambient sensing methods and wearable sensing methods [6]. The ambient sensing methods make use of the devices fixed in predetermined point of interest to sense human activities, such as video camera [7] and WiFi signal [8]. Wearable sensing methods are based on the sensors attached to the user. Recently, with the development of sensor technology, wearable sensing methods have become more and more popular. The wearable sensing methods can be implemented directly in smartphones [9].
Human activities can be categorized into different types [6], including ambulation (e.g., walking, running, sitting, standing still, lying, climbing stairs, descending stairs, riding escalator, and riding elevator), transportation (e.g., riding a bus, cycling, and driving), daily activities (e.g., eating, drinking, working at the PC, etc.), exercise/fitness (rowing, lifting weights, spinning, etc.), military (e.g., crawling, kneeling, situation assessment, etc.), and upper body (Chewing, speaking, swallowing, etc.). In this paper, we focus on the indoor activity recognition, which contains context information and can be used for indoor localization.
Activity recognition using smartphones is a classic multivariate time-series classification problem, which makes use of sensor data and extracts discriminative features from them to recognize activities by a classifier [10]. As we know, time-series data have a strong one-dimensional structure, in which the variables temporally nearby are highly correlated [11]. Traditional methods usually consist of two parts: feature extraction and classification. They rely on extracting complex hand-crafted features which require laborious human intervention and leads to the incapability of pedestrian activities identification. One of the challenges of activity recognition is feature extraction. The activity recognition performance depends highly on the feature representations of the sensor data [10].
Recently, the concept of deep learning has attracted considerable attention. There are numerous applications based on deep learning, such as image processing [12], speech enhancement [13], intelligent transportation system [14], indoor localization [15], and so on. Many studies have confirmed that a deep learning model has a better feature representation capability and, accordingly, could more effectively deal with complexity classification tasks [16]. This is because the deep learning methods fusing feature extraction and classification together with a neural network which can automatically learn proper features.
In this paper, we propose a deep learning-based method for indoor activity recognition by using the combination of data from multiple smartphone built-in sensors. A new convolutional neural network (CNN) has been designed for the one-dimensional sensor data to learn the proper features automatically. Experiments show that the proposed method achieves approximately 98.33 % accuracy in identifying nine types of activities, including still, walk, upstairs, up elevator, up escalator, down elevator, down escalator, downstairs and turning. The contribution of this paper is designing a deep learning framework to efficiently recognize activities, which can be used for indoor localization. Moreover, we have built a pedestrian activity database, which contains more than 6 GB of data of accelerometers, magnetometers, gyroscopes and barometers collected with various types of smartphones. We will make it public to contribute to academic research.
The rest of this paper is organized as follows. Section 2 reviews related work. Section 3 presents the proposed method. Section 4 presents the experimental results and analysis. Section 5 concludes the paper.

2. Related Works

There are many sensors that can be used for human activity recognition, such as cameras, depth cameras, wireless, inertial sensors, and so on. Also, a large number of methods have been proposed for human activity recognition. This section lists the related works of human activity recognition from two aspects: sensors used and methods used.

2.1. Sensors Used for Human Activity Recognition

The sensors used for human activity recognition can be categorized into two types, namely, ambient sensors and wearable sensors. The ambient sensors are fixed in a predetermined point of interest, and the wearable sensors are attached to the users.

2.1.1. Ambient Sensors

A video camera is a typical ambient sensor used for human activity recognition, which makes use of computer vision techniques to recognize human activity from videos or images [7]. With the advance in sensing technology, a depth camera can capture the depth information in real-time, which inspired the research on activity recognition from 3D data [17].
Recent advances in the wireless community give solutions for activity recognition using a wireless signal. Studies have proved that the existence and movement of humans will affect the channel state information (CSI) of wireless signals [18,19]. CSI-based activity recognition has attracted numerous recent research efforts [18,19,20,21].
These ambient sensor-based methods are device-free and activity can be detected solely through the video/image or wireless signals. This advantage makes these methods especially suitable for security (e.g., intrusion detection) and interactive applications. The drawback of these methods is the predetermined infrastructures (video and WiFi devices) are difficult to attach to target individuals to obtain their data during daily living activities.

2.1.2. Wearable Sensors

The limitation of ambient sensors motivated the use of wearable sensors for human activity recognition. The first wearable sensor-based activity recognition was proposed last 1990s, which used an accelerometer for posture and motion detection [22]. The accelerometer is the most frequently used sensor for activity recognition [23,24,25]. Attal et al. [26] present a review of different techniques used for physical human activity recognition from wearable inertial sensors data.
Lara and Labrador surveyed the state of the art in human activity recognition making use of wearable sensors [6].
With the advance of sensing technology, a smartphone is equipped with several sensors, including an accelerometer, gyroscope, magnetometer, and barometer. These sensors can be fused to recognize activity. Shoaib et al. proposed an activity recognition method by fusing smartphone motion sensors [27].
Compared with ambient sensor-based methods, wearable sensors are not limited by coverage, which can used for capturing people’s continuous activities.

2.2. Methods Used for Human Activity Recognition

2.2.1. Traditional Machine Learning Methods

Traditional machine learning methods usually consist of two parts: feature extraction and classification. The activity recognition performance of the traditional methods depends highly on the extracted features. The feature extraction process requires laborious human intervention, which is the major challenge. The feature used for activity recognition includes time domain features (e.g., mean, standard deviation, variance, interquartile range, etc.), frequency domain features (e.g., Fourier Transform, Discrete Cosine Transform), and others (Principal Component Analysis, Linear Discriminant Analysis, Autoregressive Model) [6]. For activity classification, there are numerous classic methods, such as decision tree [23], Bayesian [28], neural networks [29], k-nearest neighbors [30], regression methods [31], support vector machines [32], and Markov models [33].

2.2.2. Deep Learning Methods

Recently, deep learning has attracted considerable attention, and has been successfully applied in various fields, including human activity recognition. Zheng et al. [34] applied convnets to human activity recognition using sensor signals, but it just classified with a one-layer convolutional network which can hardly get high accuracy. Ronao and Cho proposed another deep learning method to classify six types of activities [35]. However, they use only accelerometers and magnetometers which can hardly differentiate vertical activities such as upstairs and downstairs. Gu et al. proposed a smartphone-based activity recognition method, which takes advantages of four types of sensor data, including an accelerometer, gyroscope, magnetometer, and barometer [36]. In their work, stacked denoising autoencoders is applied for activity recognition. The network just consists of two layers: encoding layer and decoding layer. The two-layer structure does not make full use of the no-linear advantage of deep learning, thus, leading to performance defects. Ravi et al. [37] propose a deep learning method for human activity recognition using low-power devices. To design a robust approach against transformations and variations in sensor properties, a manual feature selection strategy is adopted to extract features, which requires laborious human intervention.

3. Methodology

In this part, we will firstly introduce the activity categories for classification in detail, then give the experiment environment including software and hardware configuration. After that, the proposed CNN-based method is introduced as follows: the whole architecture of the CNN-based method, the data processing approach, the structure of our network, related theory and the vital training strategies. Finally, we are going to introduce the algorithm transplantation method which differs from the offline testing. Transplantation makes the online activity recognition with a Smartphone possible so that it can contribute to the indoor localization system.

3.1. Activities for Indoor Localization

In the indoor environment, human activity contains rich semantic information, which can be used for indoor localization. For example, if a user’s activity is detected as taking an elevator, the location can be inferred to the elevator. In this paper, we focus on the activities which contain context information. There are nine types of activities, including down elevator, down escalator, downstairs, up elevator, up escalator, upstairs, turning, walking, and still. The description of each activity is shown in Table 1.

3.2. Hardware and Software Setup

The specific software and hardware configuration information is given in Table 2. All our experiments were conducted on a server with powerful computational capabilities. There is 64-GB memory in the server and it is equipped with two GeForce GTX 1080Ti graphics cards to accelerate computing. We have installed Ubuntu 16.04 in junction with Python. Python has very efficient libraries for matrix multiplication, which is vital when working with deep neural networks. Tensorflow is a very efficient framework for us to implement our CNN architecture, moreover, we have to install the other dependencies like CUDA Toolkit and cudnn before using tensorflow. The CUDA Toolkit provides a comprehensive development environment for NVIDIA GPU accelerated computing. CuDNN can optimize CUDA to improve the performance.

3.3. Proposed CNN-Based Method
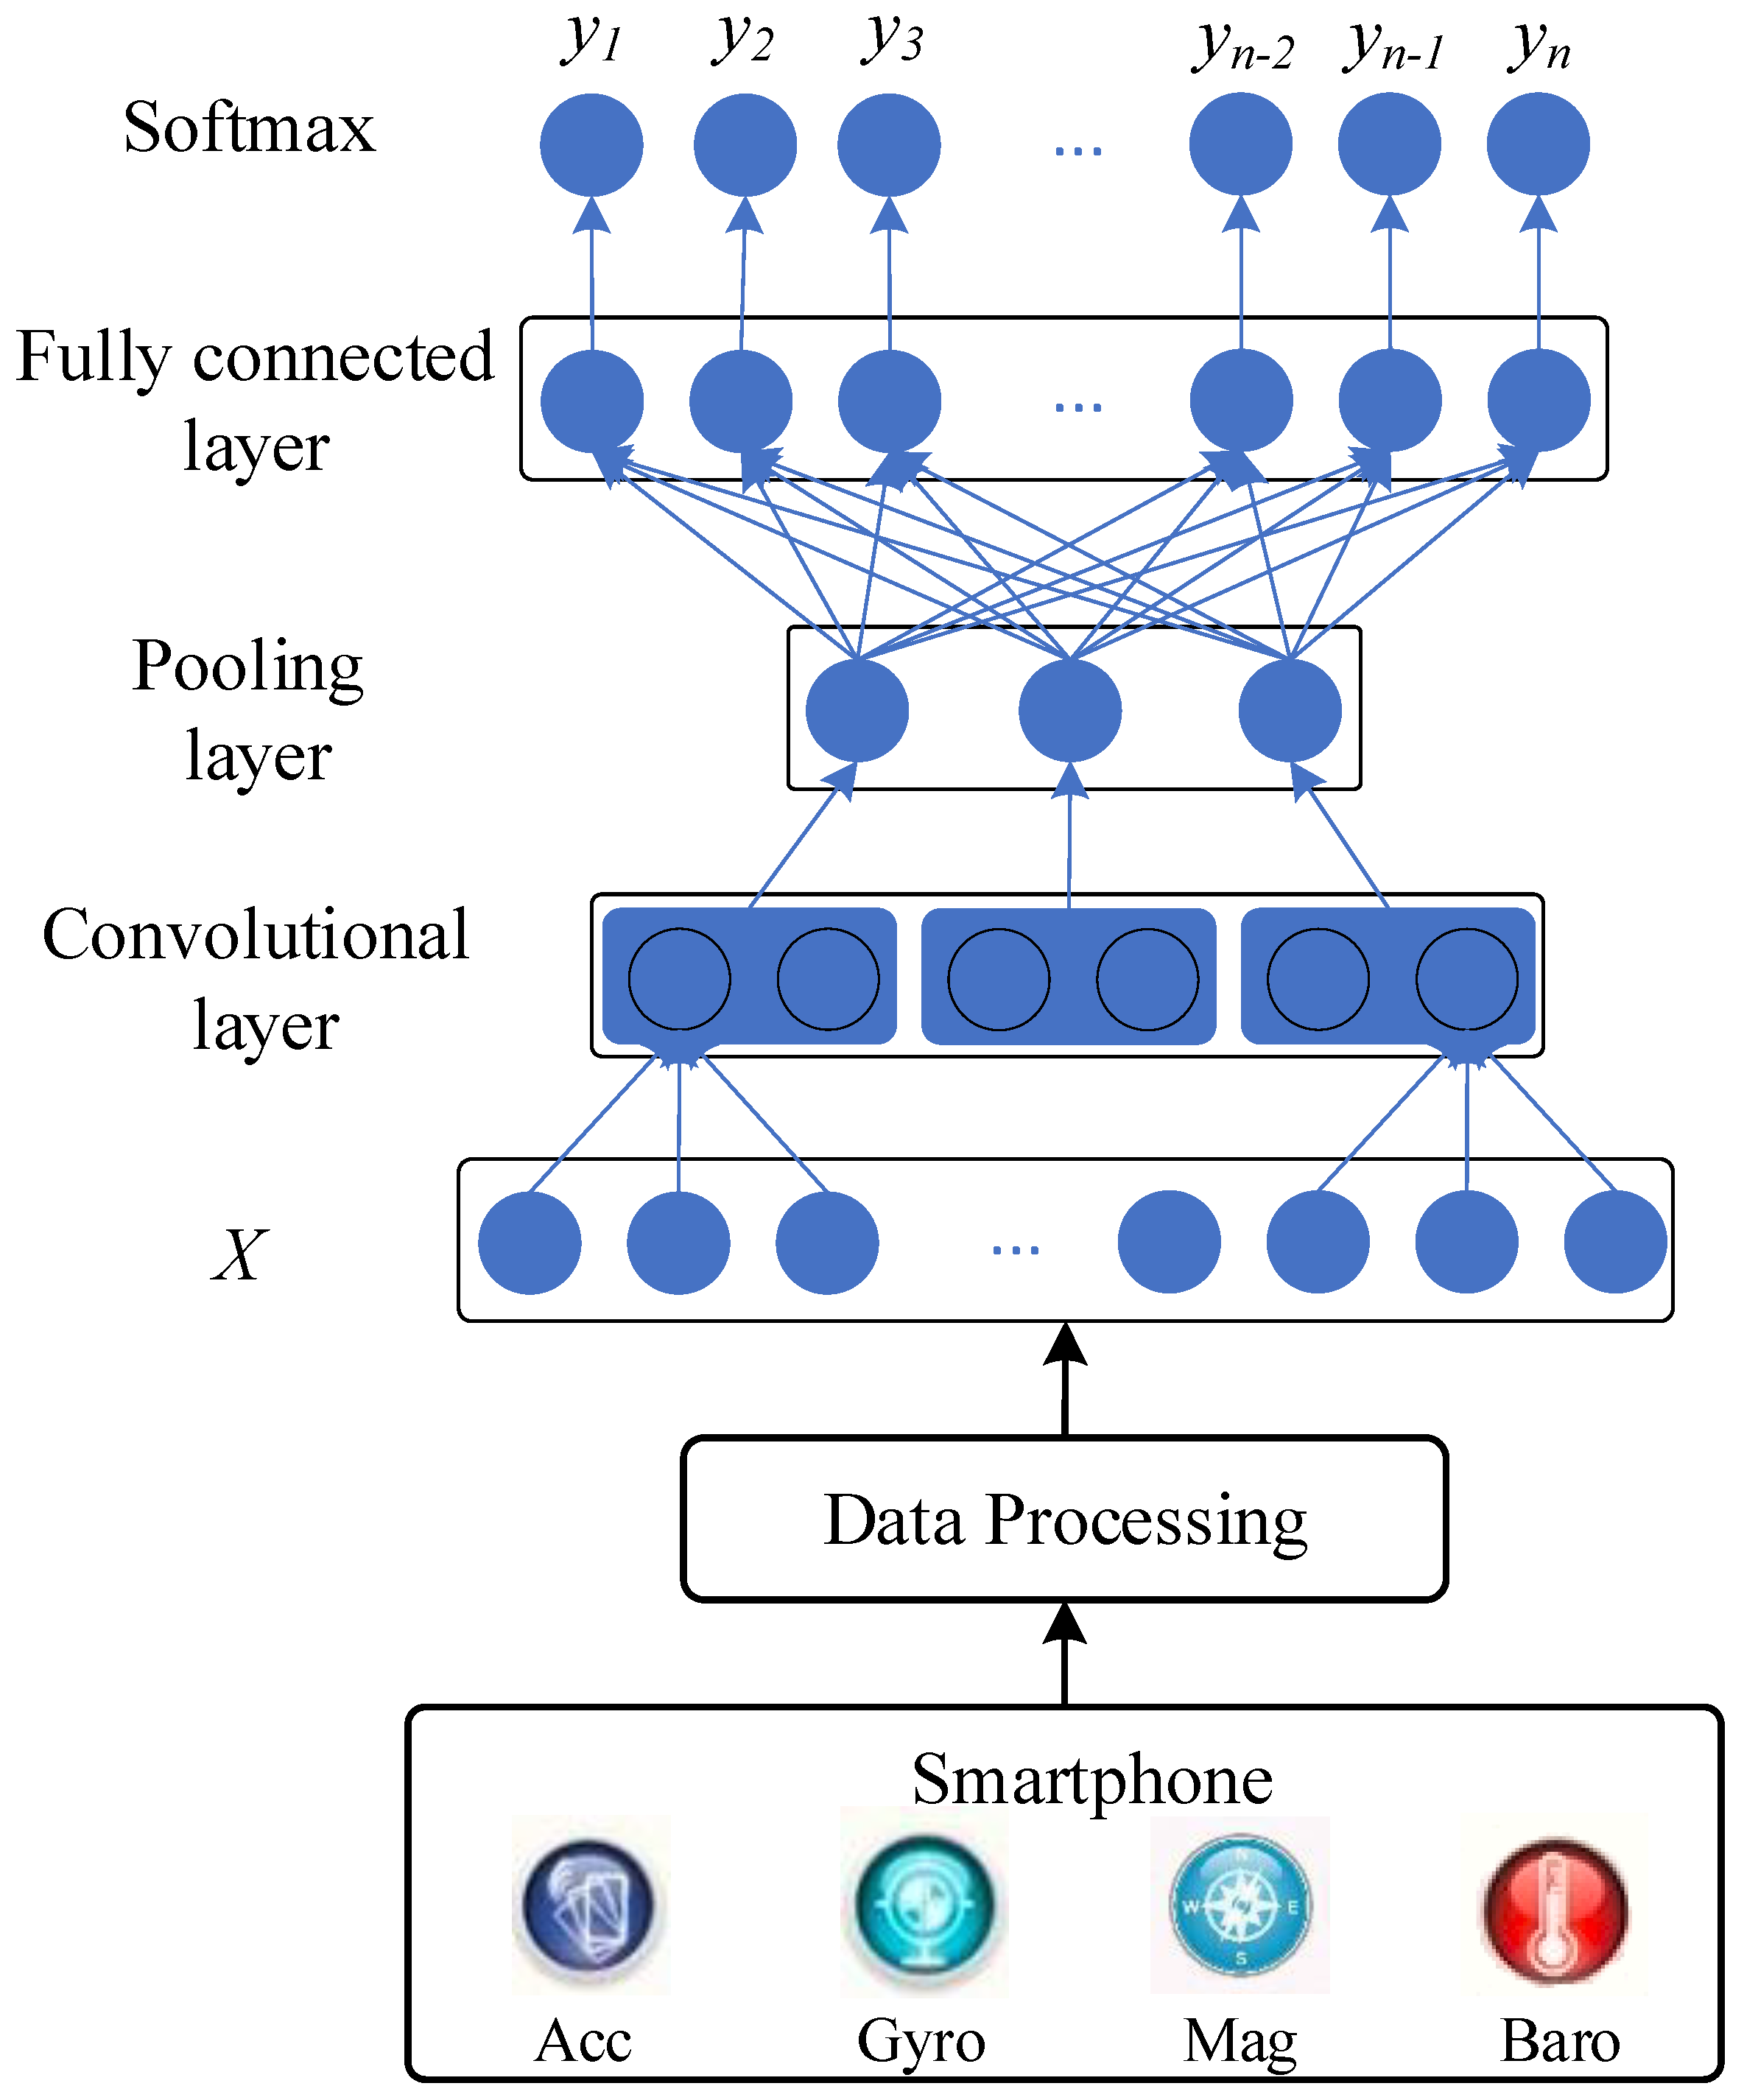
3.3.1. Architecture

Figure 1 describes the architecture of our proposed method for activity recognition. Firstly, the activity data is collected by the built-in sensors of a smartphone, including an accelerometer, gyroscope, magnetometer, and barometer. Secondly, the collected data are divided to different segments. Each segment is an activity sample. Then, the data sample is put into the CNN for activity recognition.

3.3.2. Data Segmentation

Data recorded is a time-varying signal which needs to be separated into training examples; each example stands for an activity. Sliding-window is used for segmentation and the window size stands for how long we take to present an activity. In activity recognition problem, the window size is of high importance. A too small value may not precisely capture the full characteristics of the activity, while a too large sequence may include more than one activity. To explore the proper window size we should use, we have chosen the varying window size of 1 s, 1.5 s, 2 s, 2.5 s, 3 s, 3.5 s with 50 % overlap. For example, when the window size is 2 s, 1000 values recorded from the four sensors at each timestamp, we choose 1000 values to represent an activity.

3.3.3. CNN for Activity Recognition

The structure of the convolutional neural network designed for activity classification mainly consists of three types of layers: convolutional layer, pooling layer and fully connected layer.
The input data is a vector containing data from an accelerometer, magnetometer, gyroscope and barometer, so 1D convolution is utilized to deal with the 1D data. If the input vector is x = [ x 0 , x 1 , , x n 1 ] (n is the number of data in a sliding window), the filter is written as w = [ w 0 , w 1 , , w m 1 ] (m is the filter size), and the output of the convolutional layer is z = [ z 1 , z 2 , , z h ] (h is the length of the output vector), then for the jth element z j in z, it is satisfies the equation:
z j = i = 1 m 1 w i x i + m j + b
where s refers to be the stride length of convolution. The relation between h, m, n, and s can be expressed as:
h = n m s + 1
After the convolutional layer, an extra activation layer is added to improve the express capability of the network, the output of activation layer is a = f ( z ) , where f is the activation function. We use Relu as the activation function.
The pooling layer focuses on extracting more robust features by choosing the statistic value of nearby inputs. The maximum, minimum or mean value of a given region are computed as the output of the pooling layer, thus, reducing data shape, simplifying computing and avoiding overfitting. Max pooling is utilized in our proposed network [12].
After several layers of convolution and pooling operation, the fully connected layer follows as the classifier to recognize different activities. The softmax layer is applied to map the result of a fully connected layer to the range ( 0 , 1 ) , which can be seen as the probability of the sample being each type of activity. Suppose the output of fully connected layer is f = [ f 1 , f 2 , , f n ] , the output of the softmax is y = [ y 1 , y 2 , , y n ] , it satisfies the equation that:
y i = e f i k = 1 n e f k
We adjust the weights and biases in each layer by minimizing the loss between the initial prediction and the label to get the best prediction model, the loss can be described as follows:
h y ( y ) = i y i l o g ( y i )
where y is the label of sample and y is the output of the network. It is a least square problem which can be solved by some existing optimization algorithms like SGD, Momentum, RMSprop and Adam. We choose Adam as our optimization algorithm for the complexity of our network and the necessary of quick convergence.

3.3.4. Training Strategies

The most time-consuming process of implementing activity recognition is training the model. There are two important tricks we have utilized in our classifier to accelerate training: Mini-batch Gradient Descent and normalization for the input data [38,39].
With the difference of the amount of training data, the optimization algorithm can be divided into Stochastic Gradient Descent, Mini-batch Gradient Descent and Batch Gradient Descent. The Stochastic Gradient Descent strategy just deals with one sample at a time while Batch Gradient Descent deals with all samples at a time. As one sample can hardly derive the right direction of gradient descent, the Stochastic Gradient Descent strategy always spends too much time to converge despite the high iteration speed. Batch Gradient Descent with low iteration efficiency is also not a good choice. Mini-batch Gradient Descent optimizing part of data is a proper strategy to filling the gap and we usually choose the power of 2 as the batch size.
Normalization of the input data can make the optimization easier and accelerate convergence. For the non-uniform distribution of input data in each dimension, there is much difficulty in finding the fastest gradient descent direction. Input data normalization can solve the problem by changing the distribution of the input data by this way: suppose an sample x = [ x 1 , x 2 , , x m ] with mean μ and variance σ 2 , where μ = 1 m i = 1 m x i , σ 2 = 1 m i = 1 m ( x i μ ) 2 , we normalize the sample to
x ^ = x μ σ 2 + ε
where ε is a number close to zero for avoiding wrong division.

4. Experiments and Results

4.1. Dataset and Experimental Setup

For collecting the activity dataset, ten participants were invited to collect the data of nine activities defined in Table 1 using smartphones. The specific information of the participants is listed in Table 3. Data are collected from four types of sensors: an accelerometer, magnetometer, gyroscope and barometer. The data sampling rate is 50 Hz. 60 % of the dataset are used to train and the rest 40 % are used for the test data. The train and test data are from all the subjects. To avoid the effect of data dependence on the result, we shuffled the data in advance.
To evaluate the performance in identifying different types of activities, we choose the F-value as the evaluation metrics [40]. The F-measure is defined as F = ( 2 P R ) / ( P + R ) where P refers to the p r e c i s i o n and R refers to the r e c a l l . In our experiments, the p r e c i s i o n for an activity is the number of correctly expected samples (true positives) divided by the total number of samples predicted as belonging to this activity (the sum of true positives and false positives). The r e c a l l is defined as the number of corrected predicted samples divided by the total number of sample that actually belong to this activity (the sum of true positives and false negatives). Both of the precision and the recall rate can hardly measure the performance accurately. The F-measure is computed according to the p r e c i s i o n and the r e c a l l , which can evaluate the performance more accurately.

4.2. Hyperparameter Settings

We have trained the data on network with different convolutional layers to find the best architecture. In each architecture, we adjust the filter size, number of feature maps, the pooling size, the learning rate and the batch size in the hyperparameters tuning process to retain the best configuration. As a result, we choose the best architecture with the best parameter setting as the final configuration. Table 4 illustrates the list of hyperparameters and their candidate values. The value in bold is the best setting of each hyperparameter.

4.3. Impact of Different Parameters

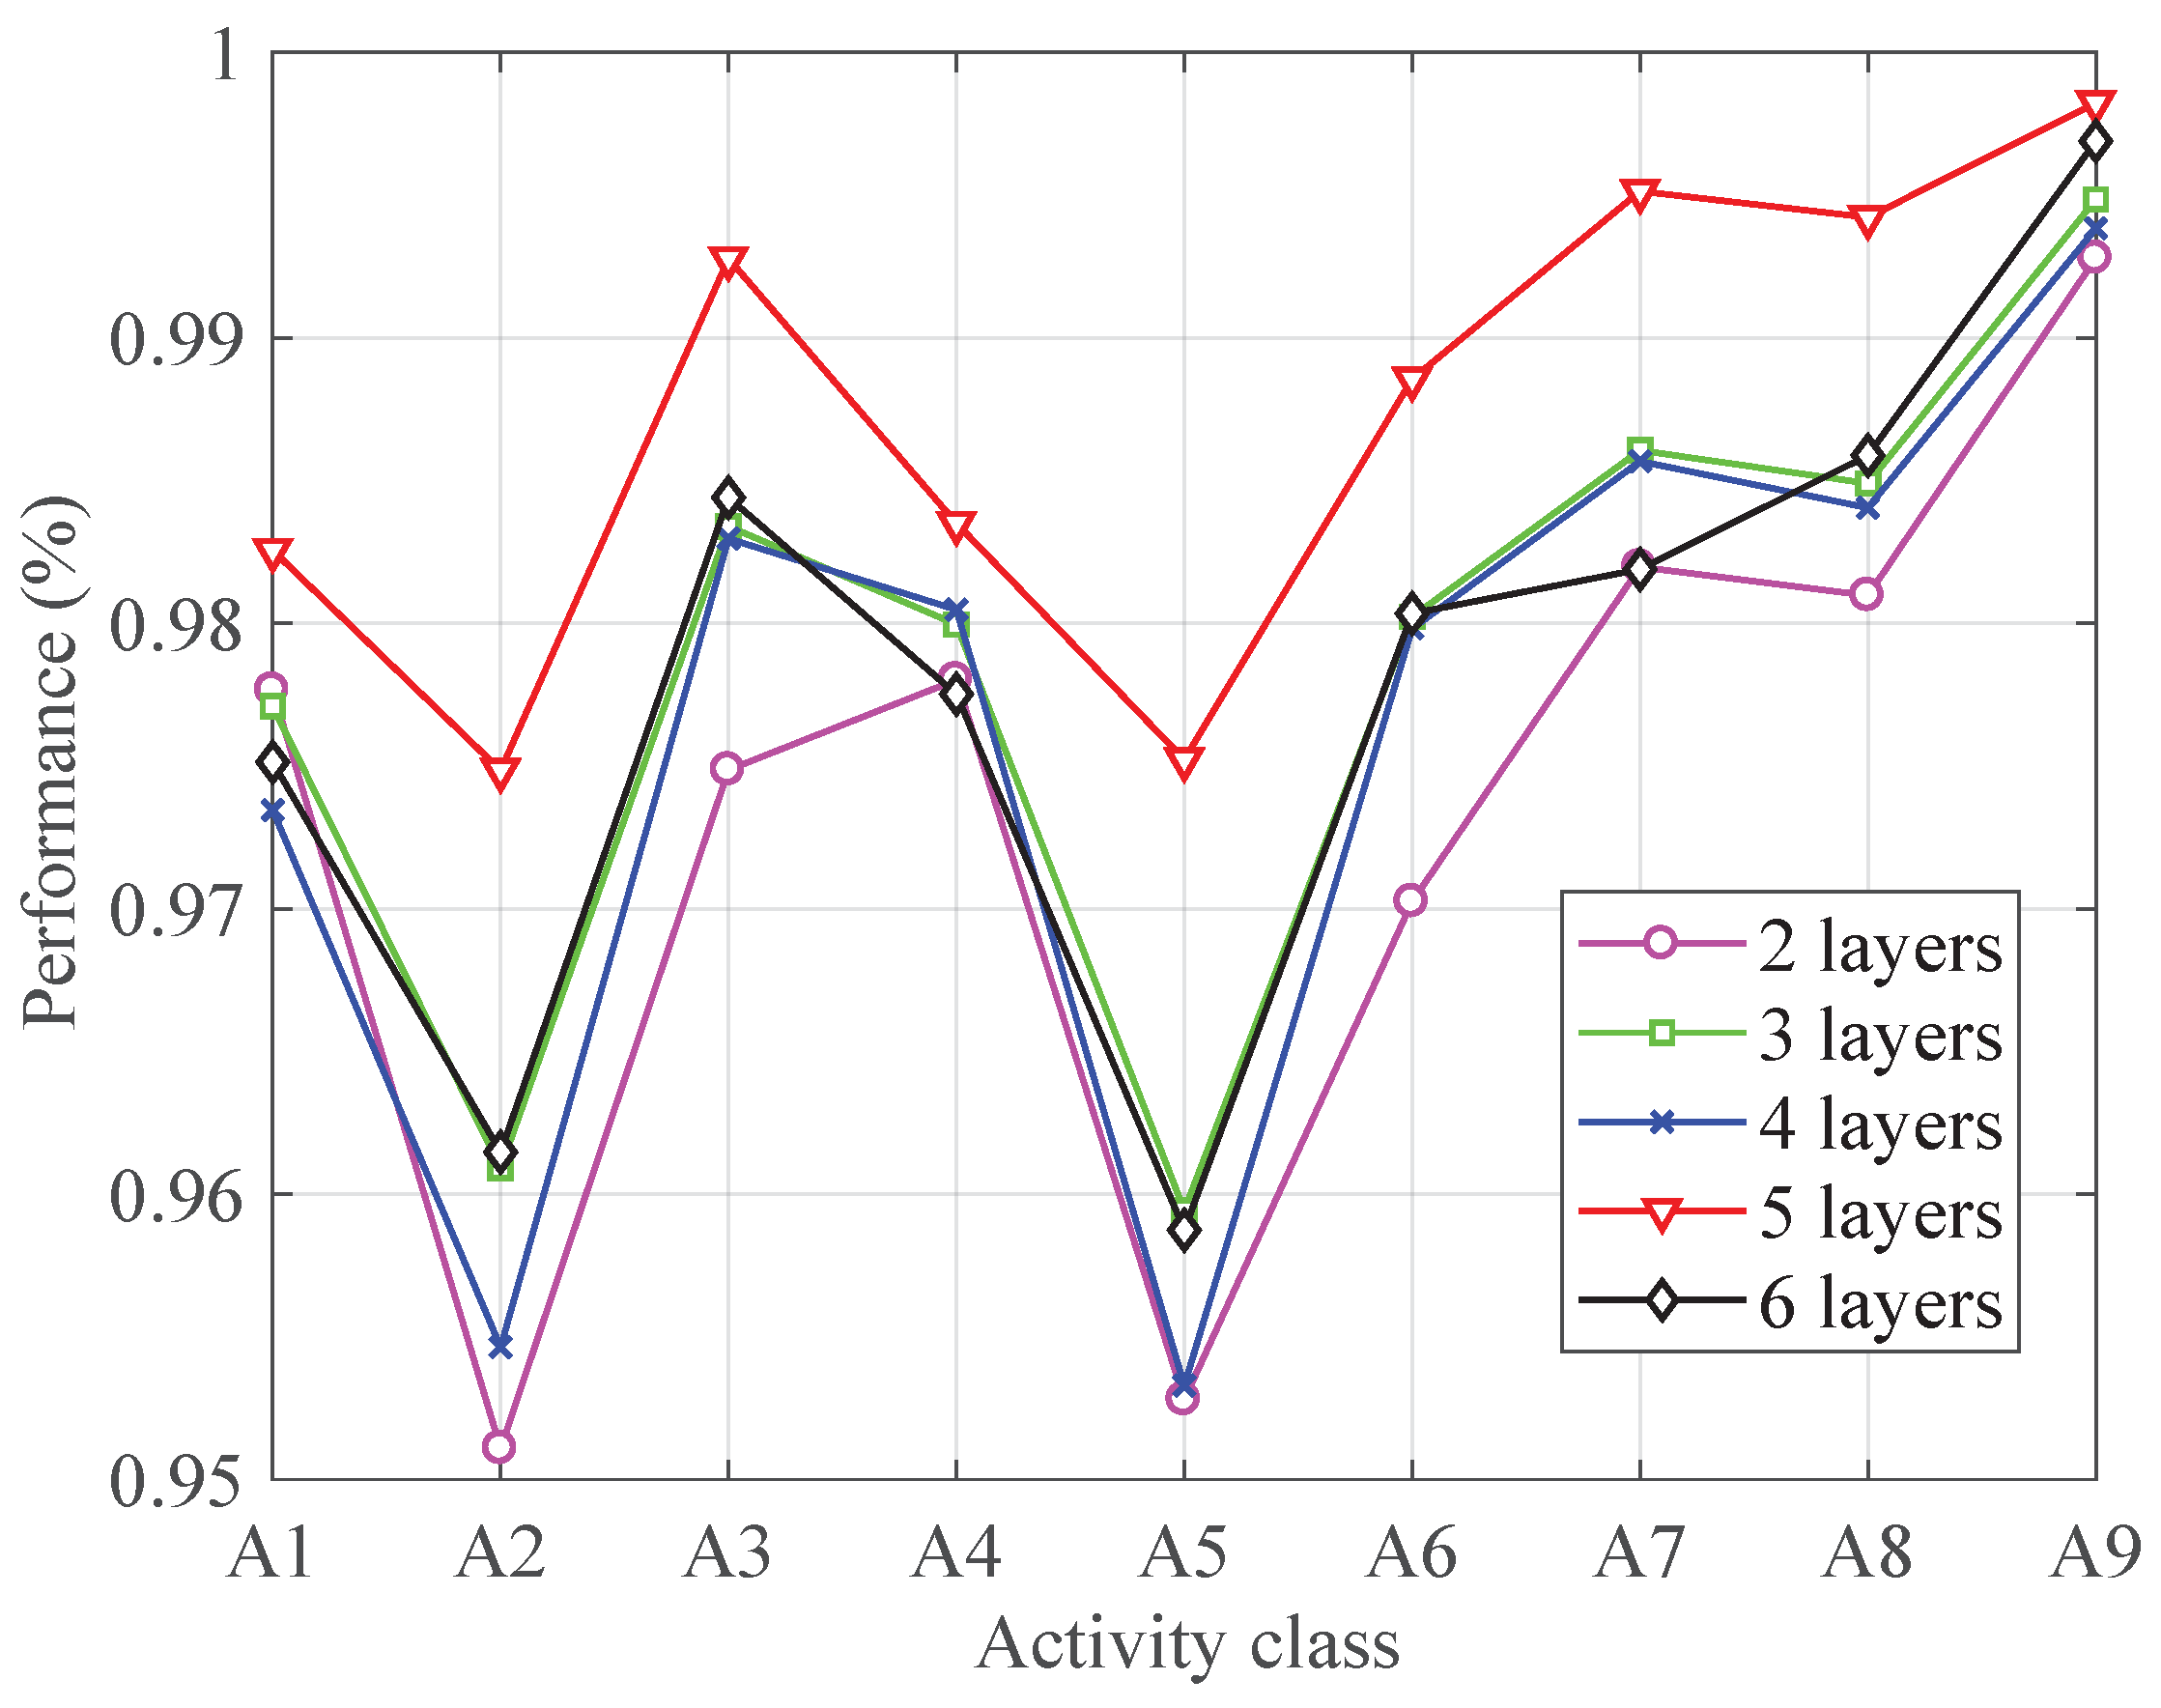
4.3.1. Number of Layers

To analyze the effect of number of layers, the CNN-based classifier was performed with different numbers of layers. Figure 2 shows the F-measure in each activity by using different number of layers. It is clear that the network with 5 convolutional layers outperforms others in each type of activities. The reason lies in the fact that network with convolutional layers less than 5 is not complex enough to extract appropriate features for activity recognition while network with six convolutional layers tends to cause over-fitting for the structure complexity. Network with five convolutional layers is just enough to obtain a good performance.

4.3.2. Filter Size

To obtain the most proper filter size, the classifier was performed with different filter size (the number of layer is set to 5). As shown in Figure 3, increasing the filter size from 2 to 10 improved the classification performance of each activity. When the filter size is larger than 10, the performance decreases with the increasing of filter size. Therefore, the filter size is set to 10.

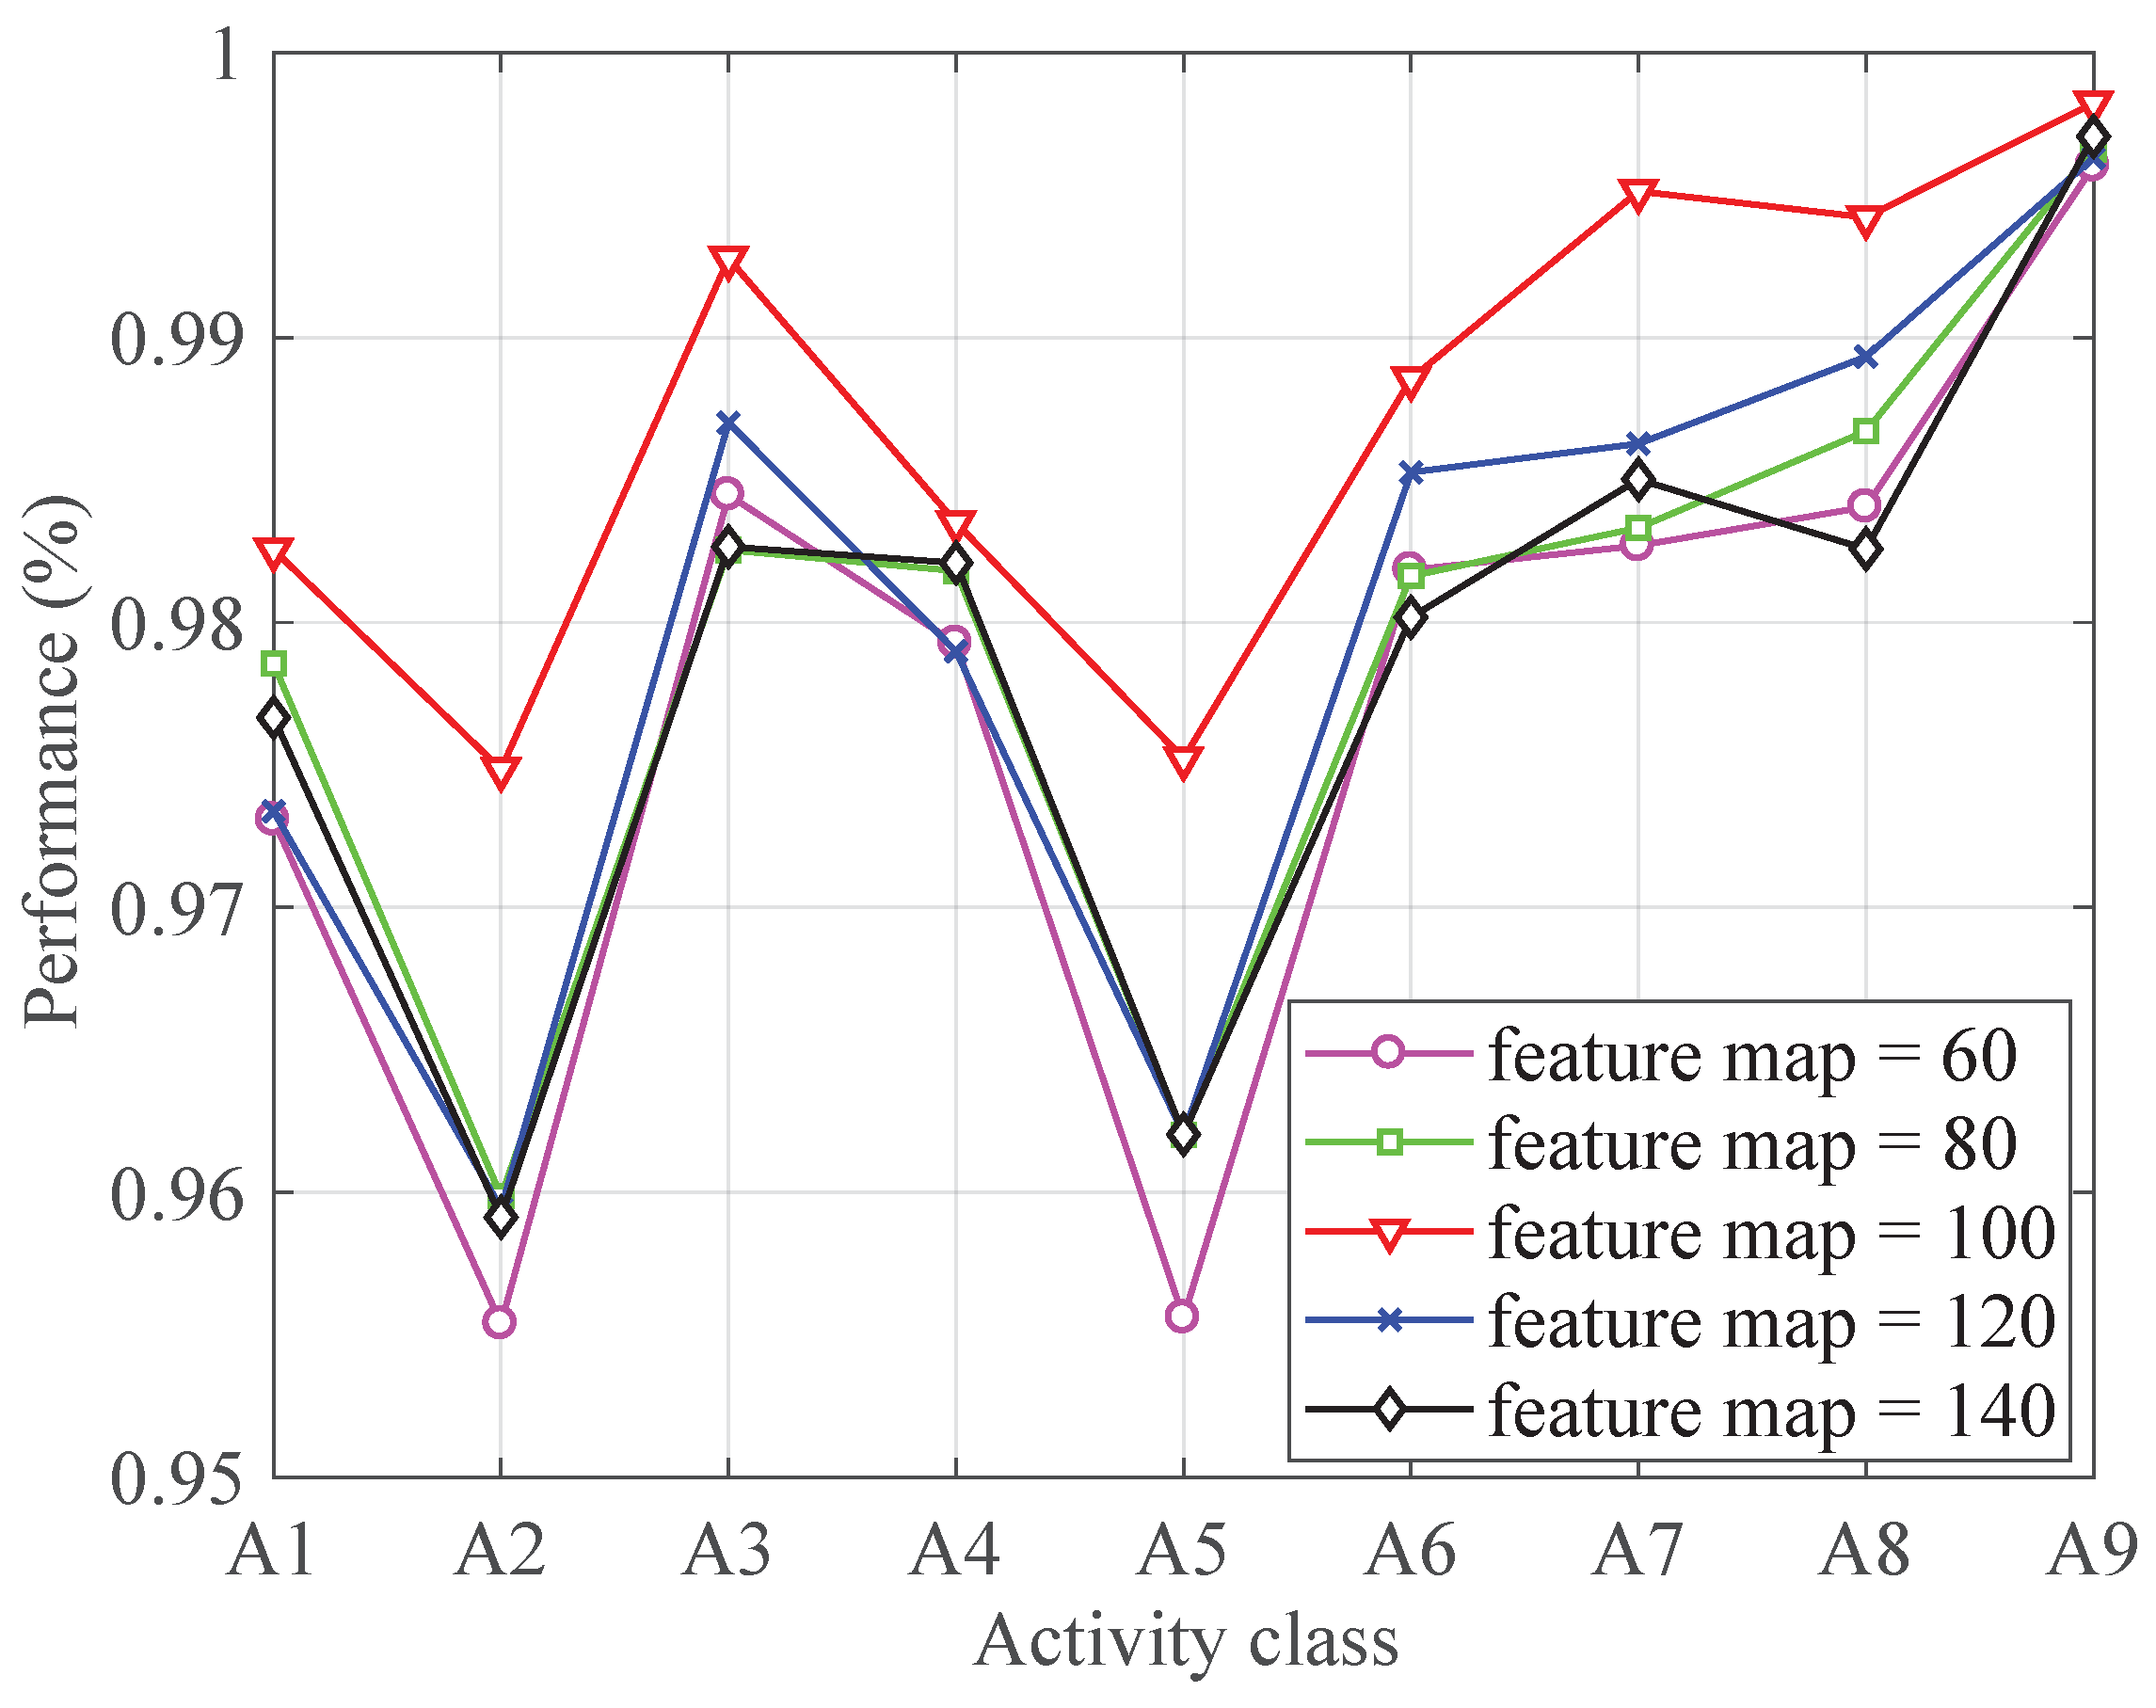
4.3.3. Number of Feature Maps
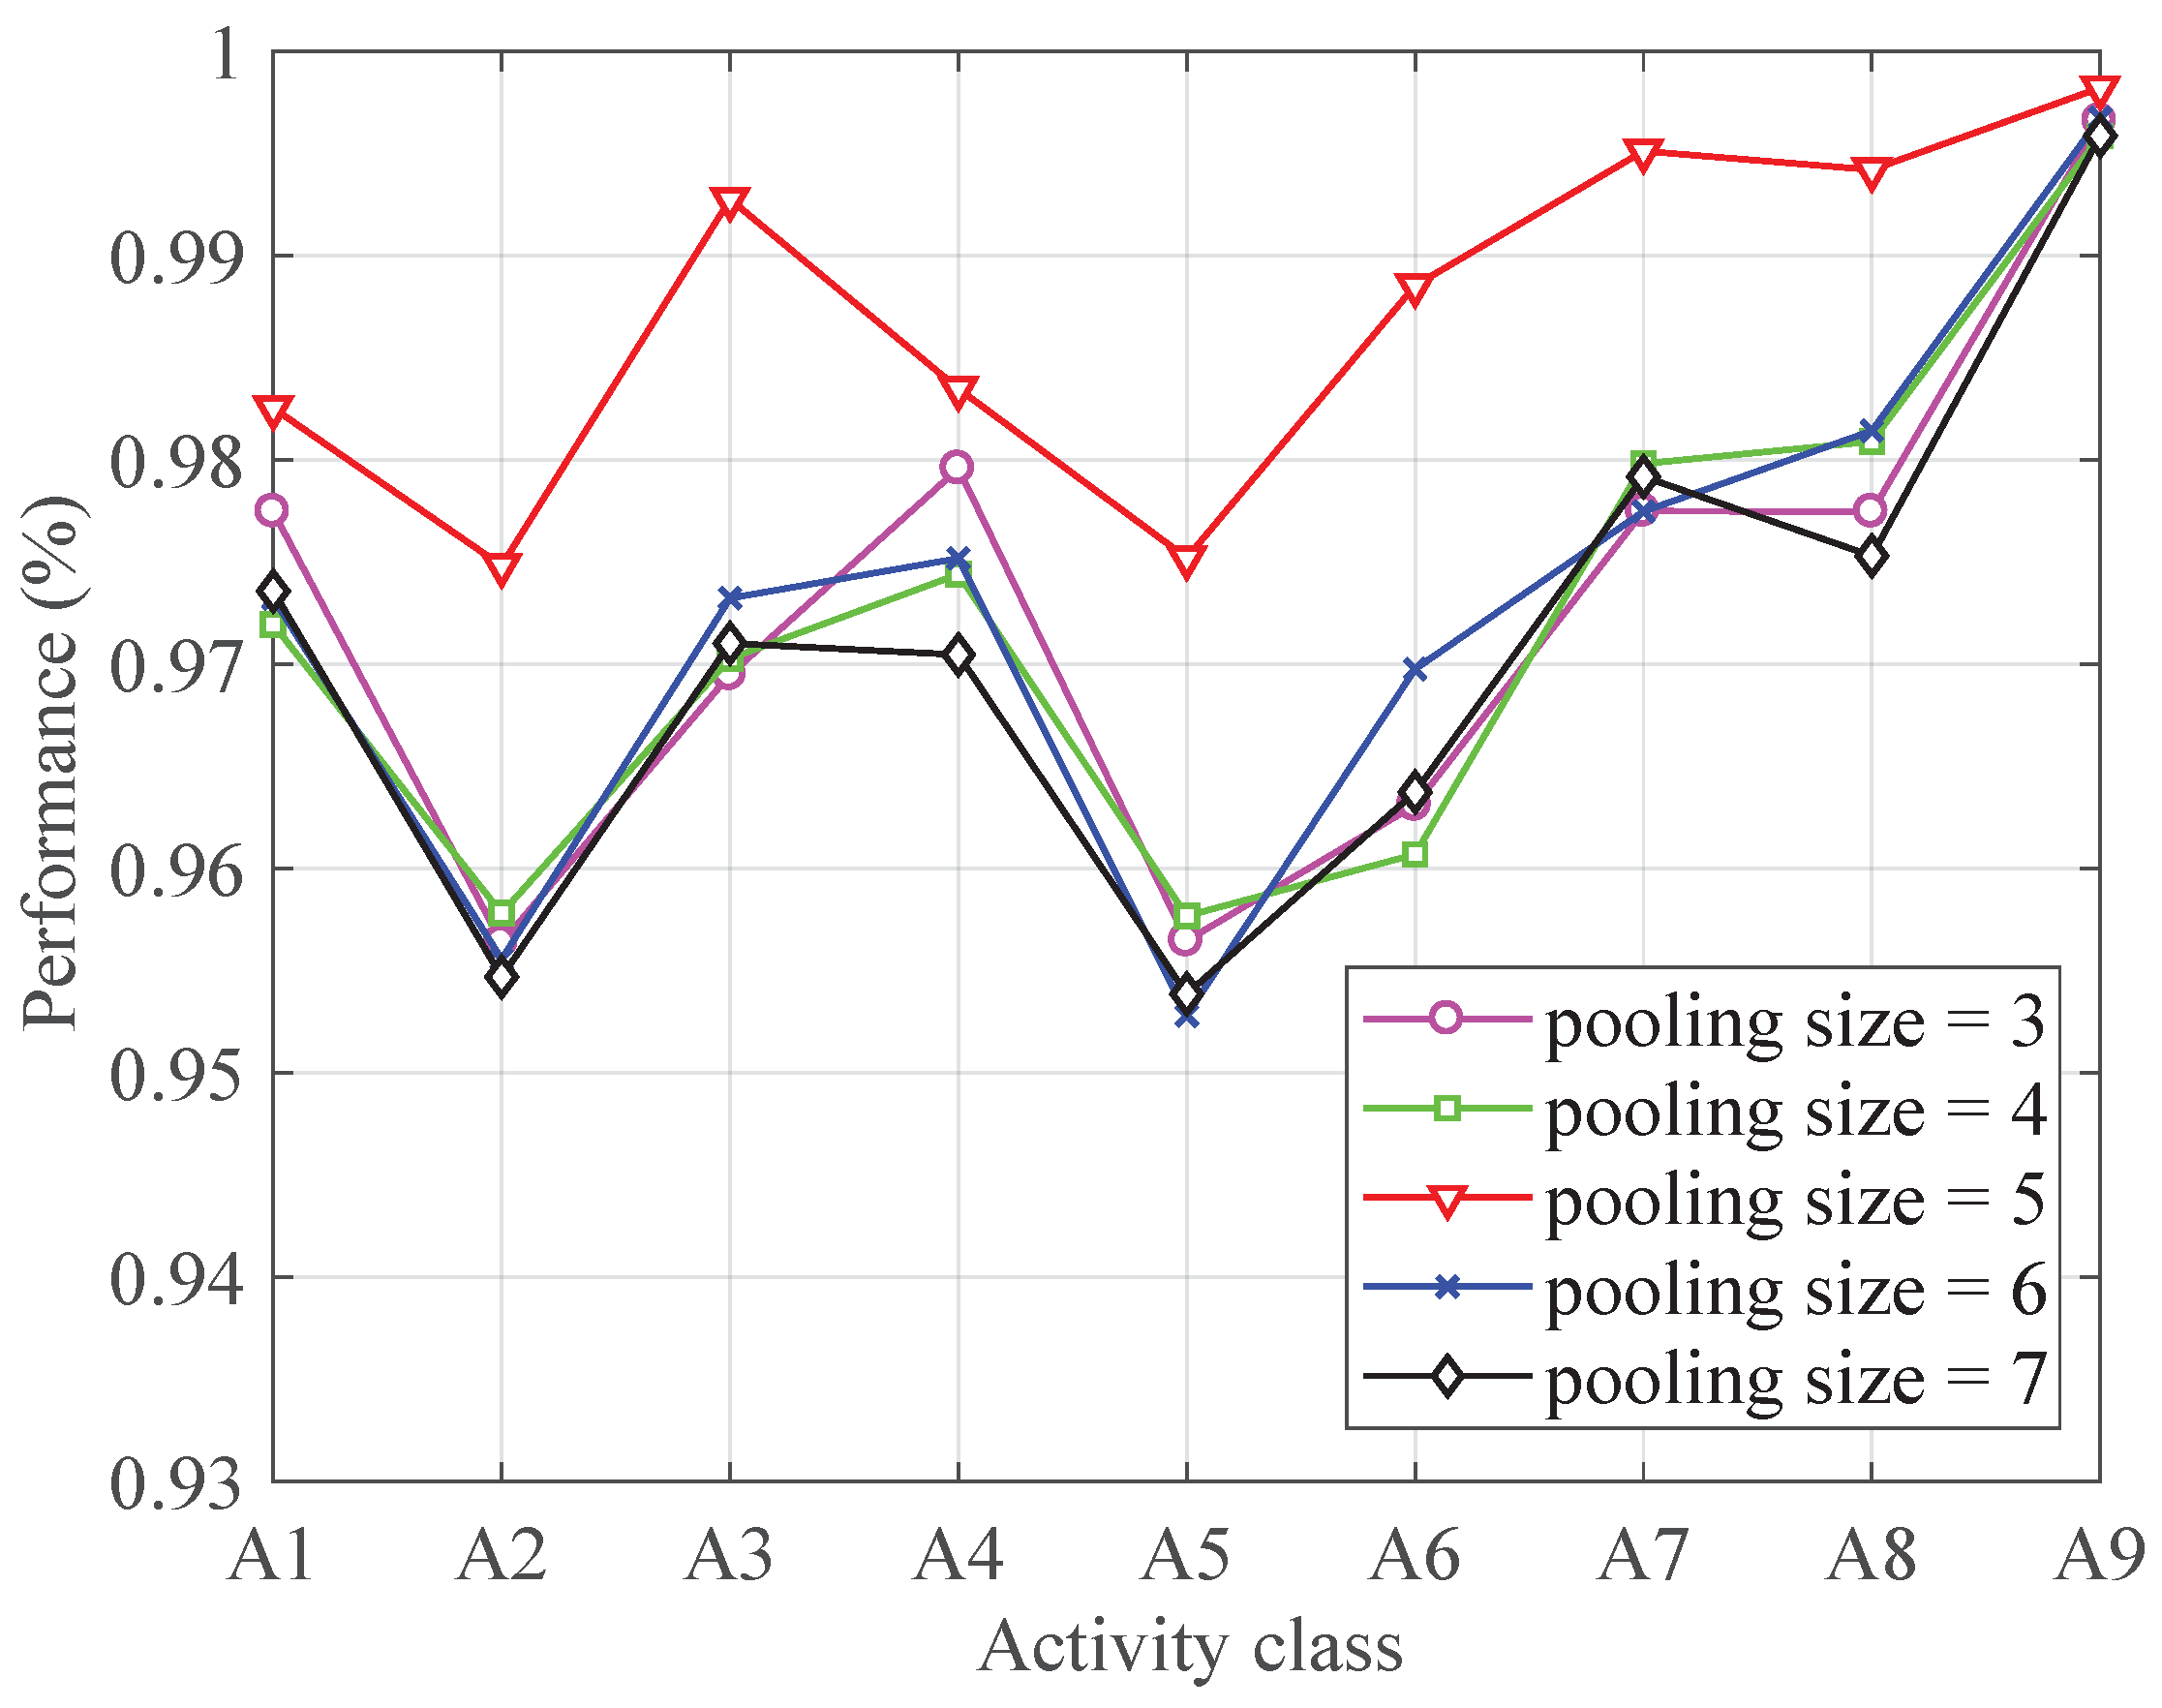
Figure 4 shows the influence of the feature map on the classification performance. As shown in Figure 4, the best performance for each activity is achieved when the feature map is set to 100.

4.3.4. Pooling Size

Figure 5 demonstrates the classification performance for each activity with different pooling size. It can be seen from Figure 5 that the performance improves with the increasing of the pooling size at first. The classification achieves the best performance when the pooling size increases to 5. After that, the performance decreases with the increasing of the pooling size. Therefore, the pooling size is set to 5.

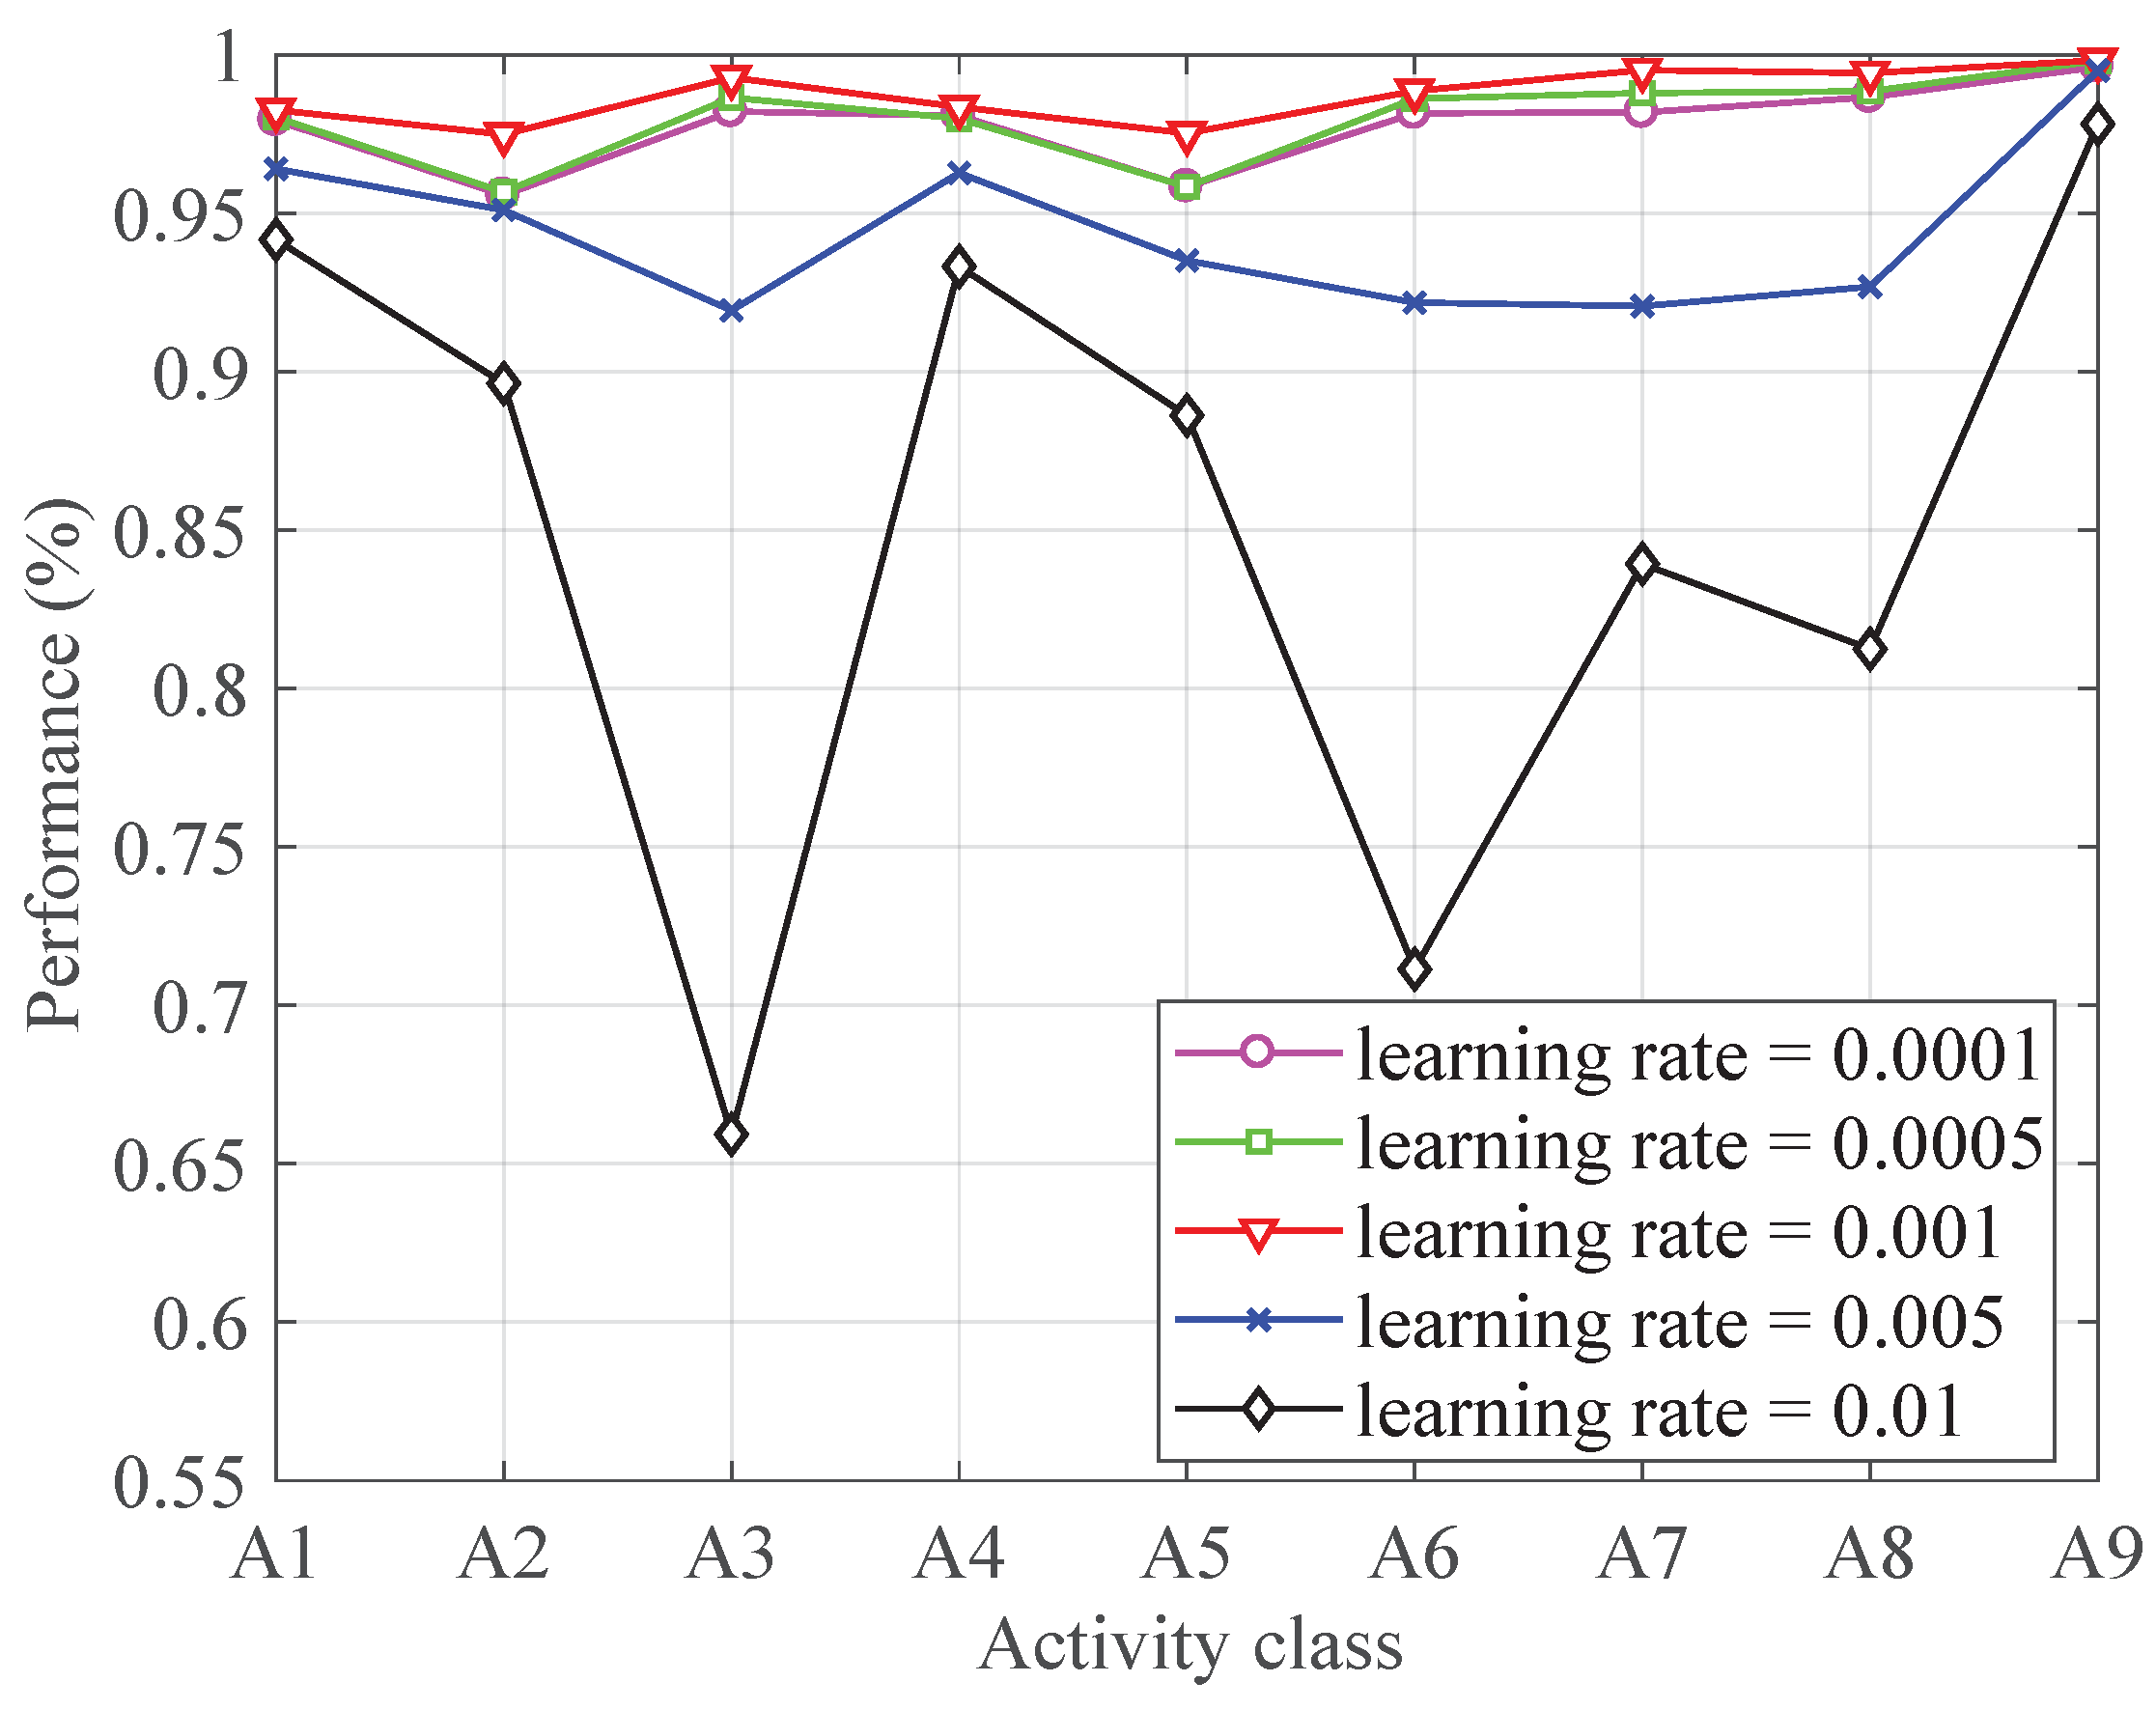
4.3.5. Learning Rate
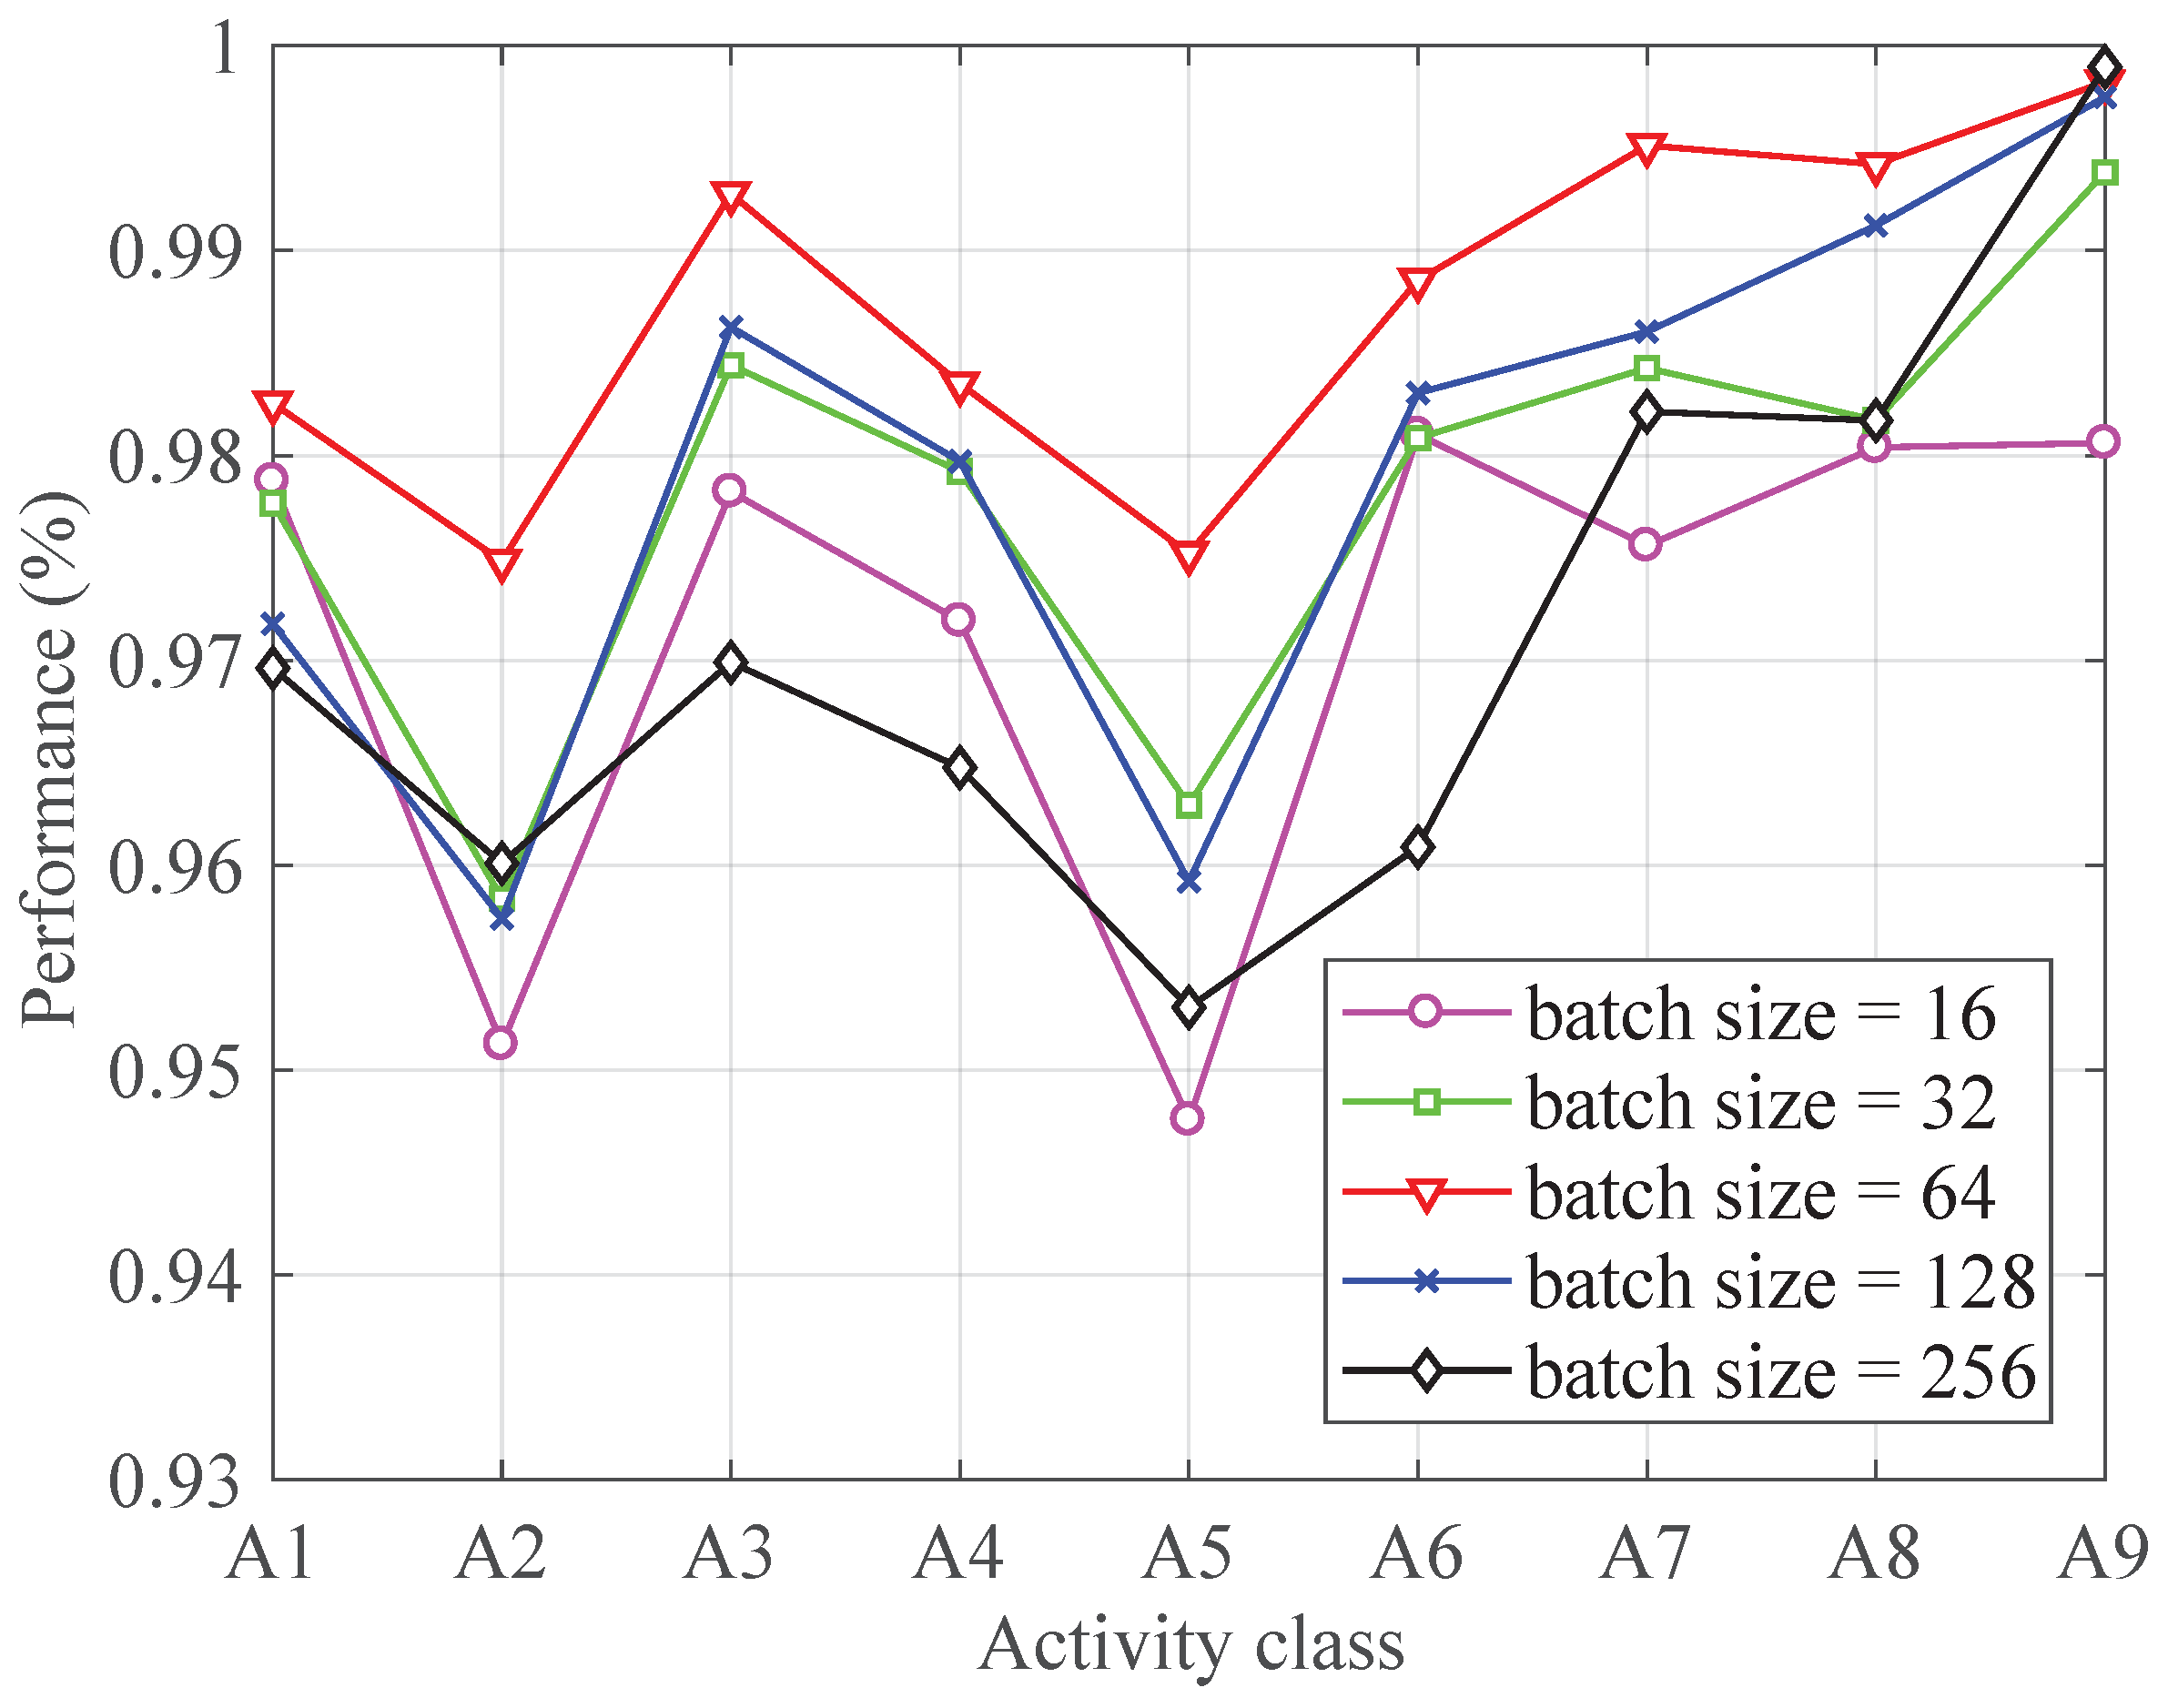
Figure 6 shows the performance of each activity with different learning rate. It can be seen from Figure 6, when the learning rate is less than 0.001, the algorithm reaches steady and good performance while the learning rate bigger than 0.001 shows unstable results. The reason for the bad performance of big learning rate is that the variables update too fast to change to proper gradient descent direction timely. Though with good performance, the tiny learning rate is also not the best choice because it means the slow update of the variables and it leads to time consuming of the training. Therefore, the learning rate is set to 0.001.

4.3.6. Batch Size

Figure 7 shows the performance of each activity with different batch size. The batch size is usually set to 2 n . Here, we choose candidates of batch sizes from 2 4 = 16 to 2 9 = 512 . In fact, the F-measure of each activity increases with the batch size increasing from 16 to 64 and it decreases with a batch size changing from 64 to 512.

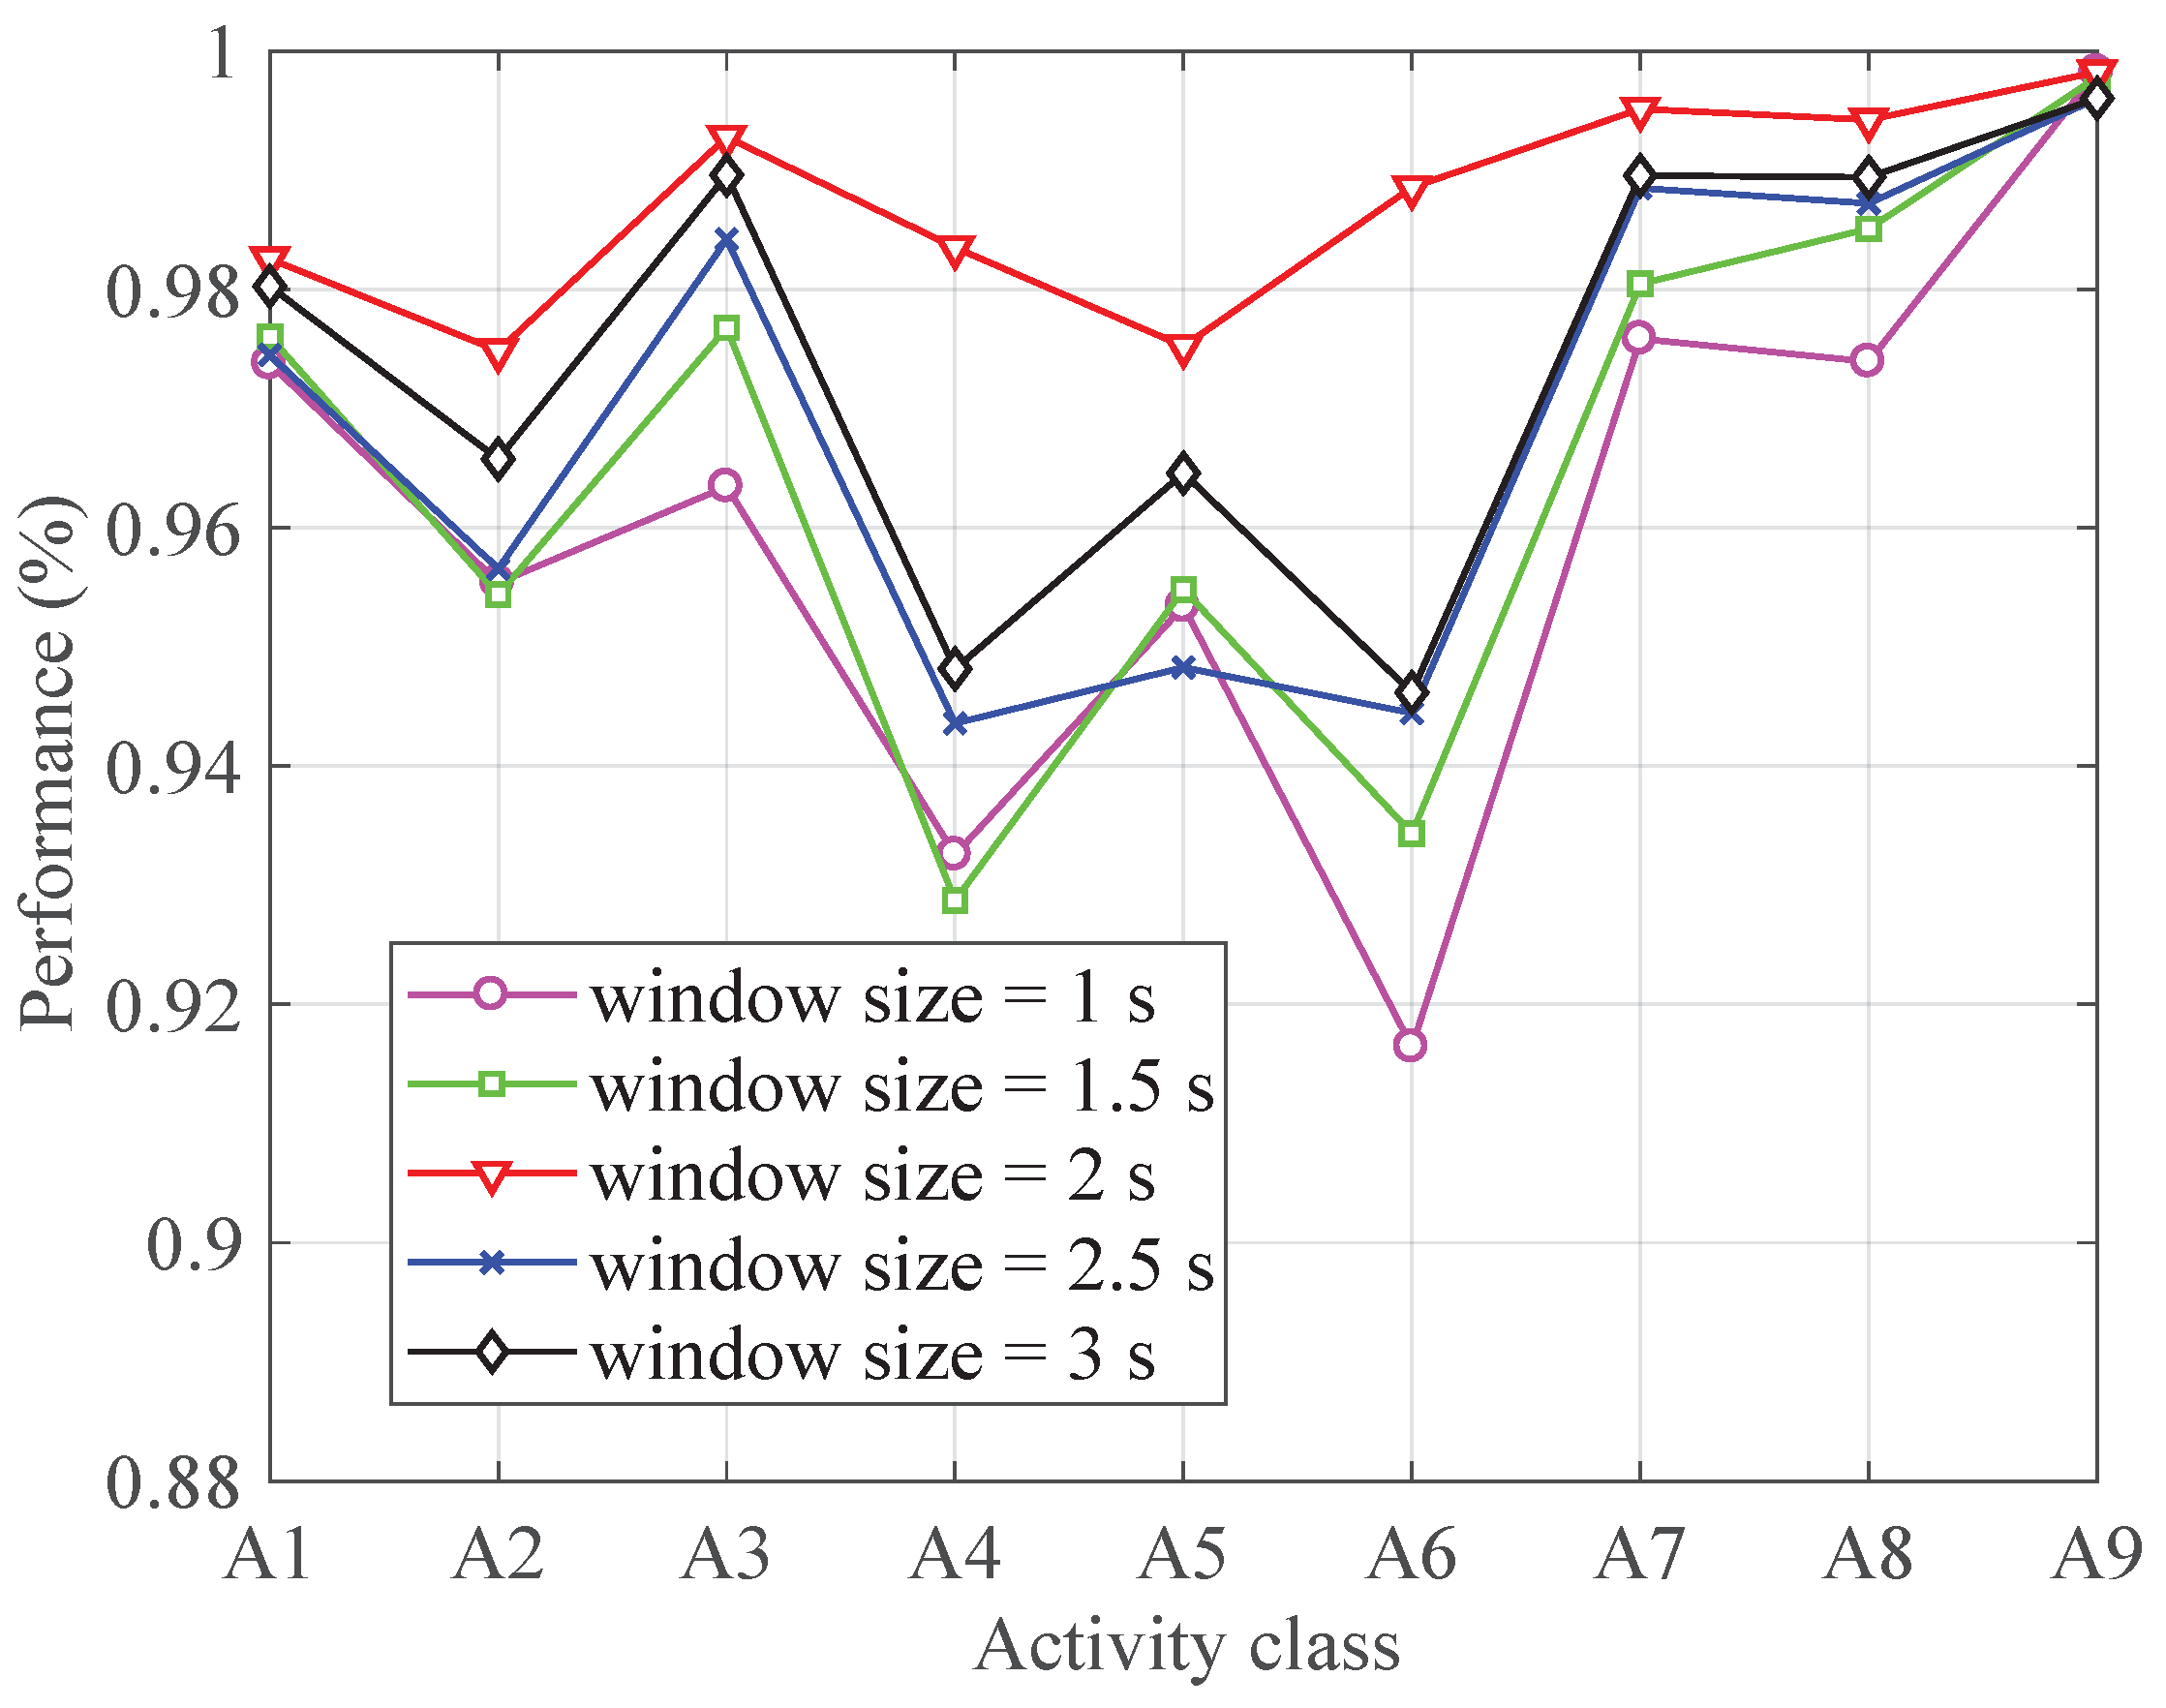
4.4. Impact of Different Window Size

During the data segmentation process, window size is a key factor. To evaluate the impact of window size on the classification performance, we divide the data in different window sizes, namely 1 s, 1.5 s, 2 s, 2.5 s, 3 s and 3.5 s. Figure 8 shows the performance of each activity with different window sizes. As can be seen from Figure 8, a window size of 2 s shows the best performance. Therefore, we choose 2 s as the window size for data segmentation.

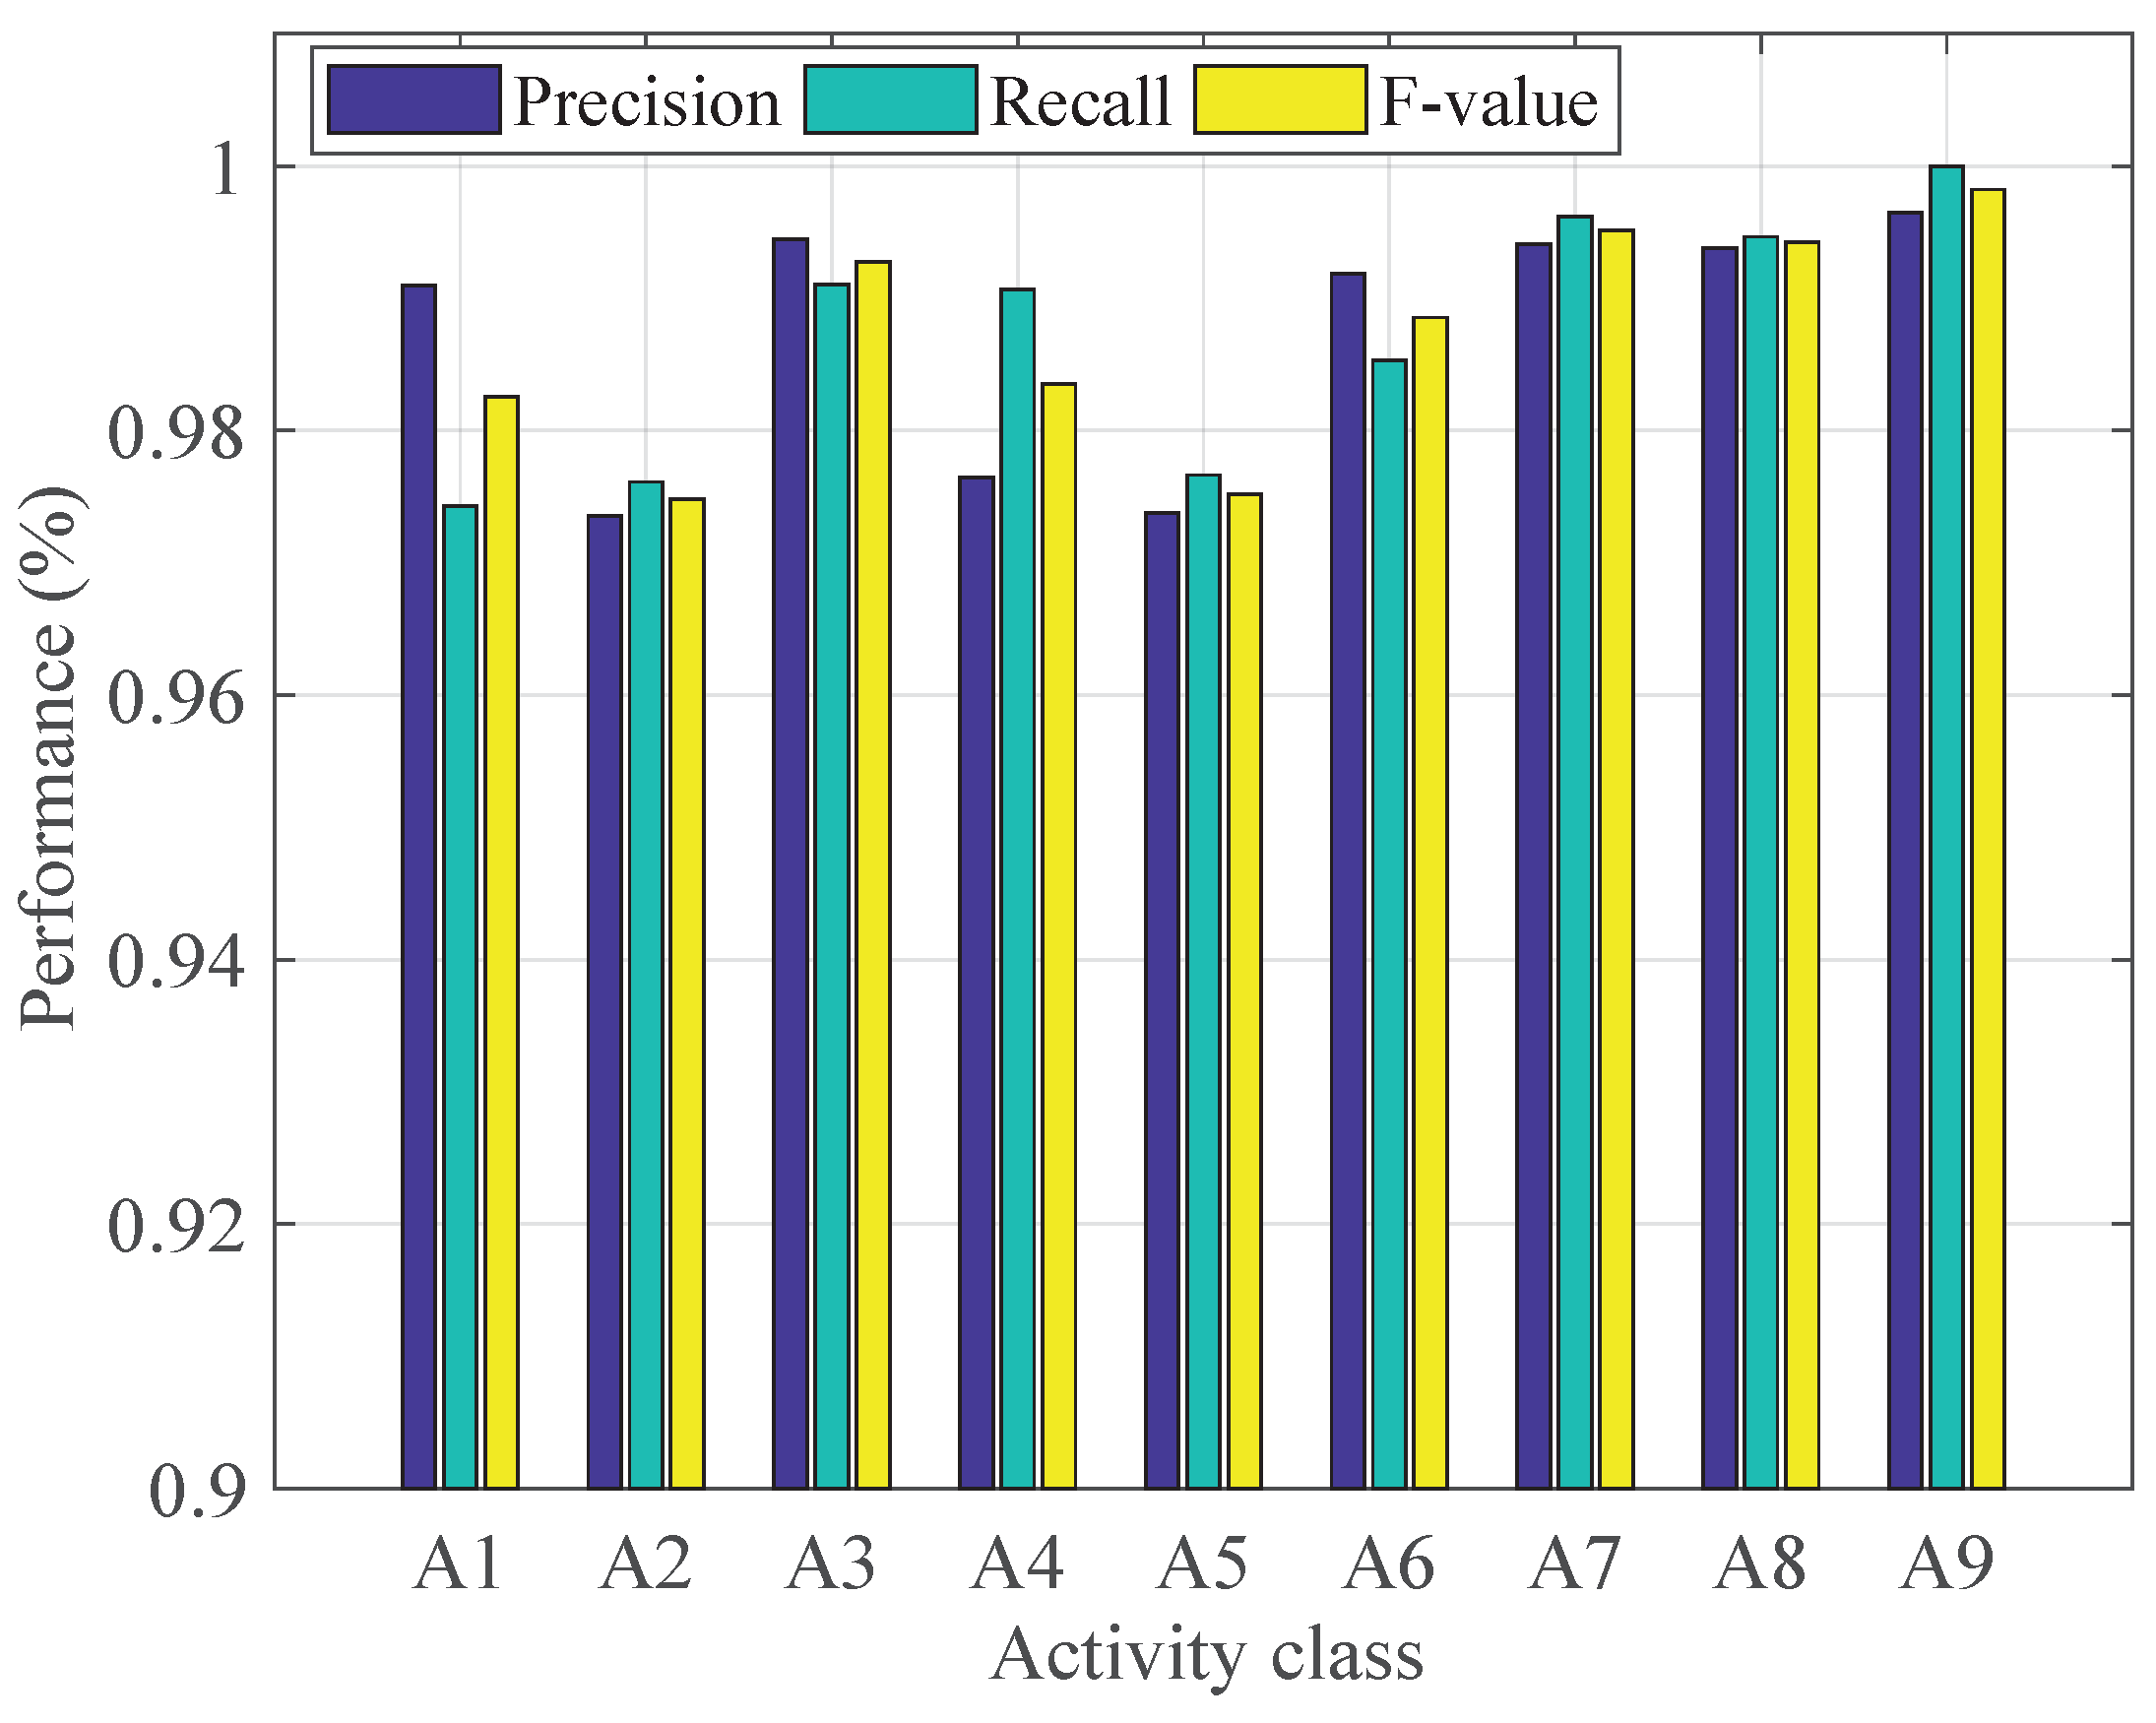
4.5. Classification Performance

Figure 9 shows the performance of our method in recognizing each activity. Table 5 shows the performance of the proposed method with the optimal hyperparmeters. From Figure 9, we can see that the proposed method shows excellent performance in recognizing all the nine activities. The F-measures for all the activities are higher than 0.98 except A2 (down escalator) and A5 (up escalator), whose F-measures are 0.97. Table 5 shows that there is a little difficulty for the proposed method to distinguish A2 and A5.

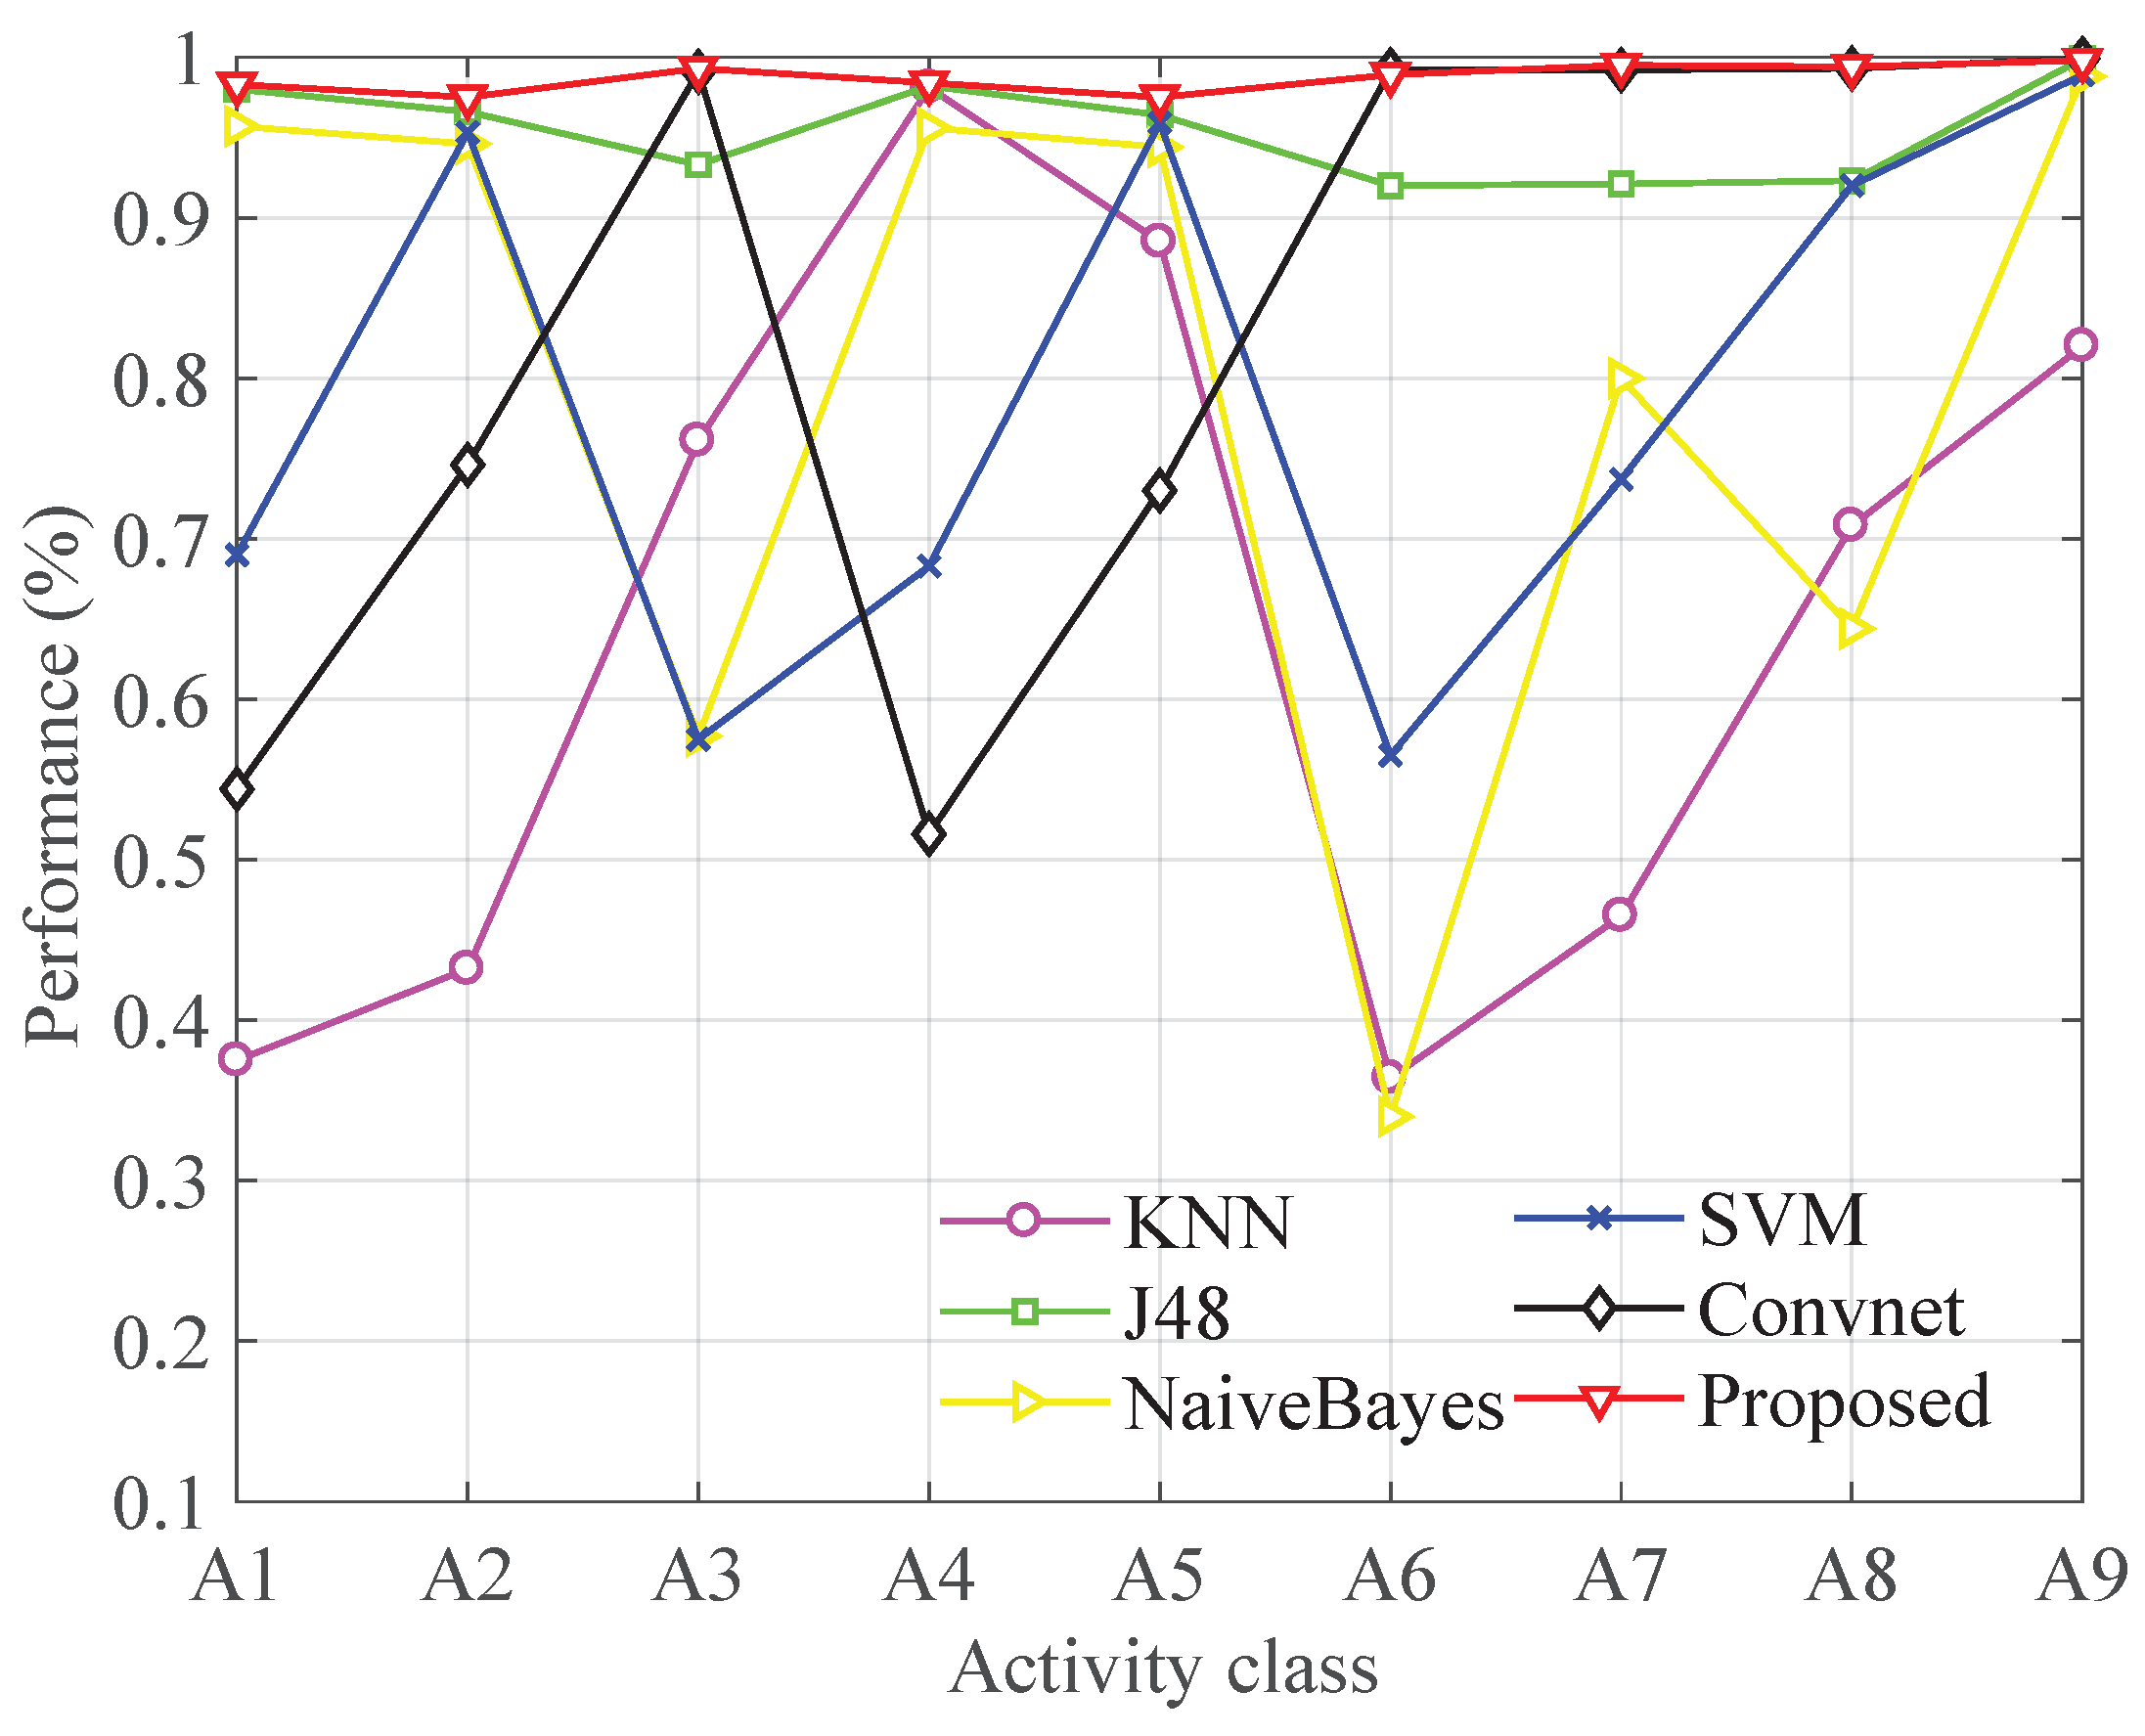
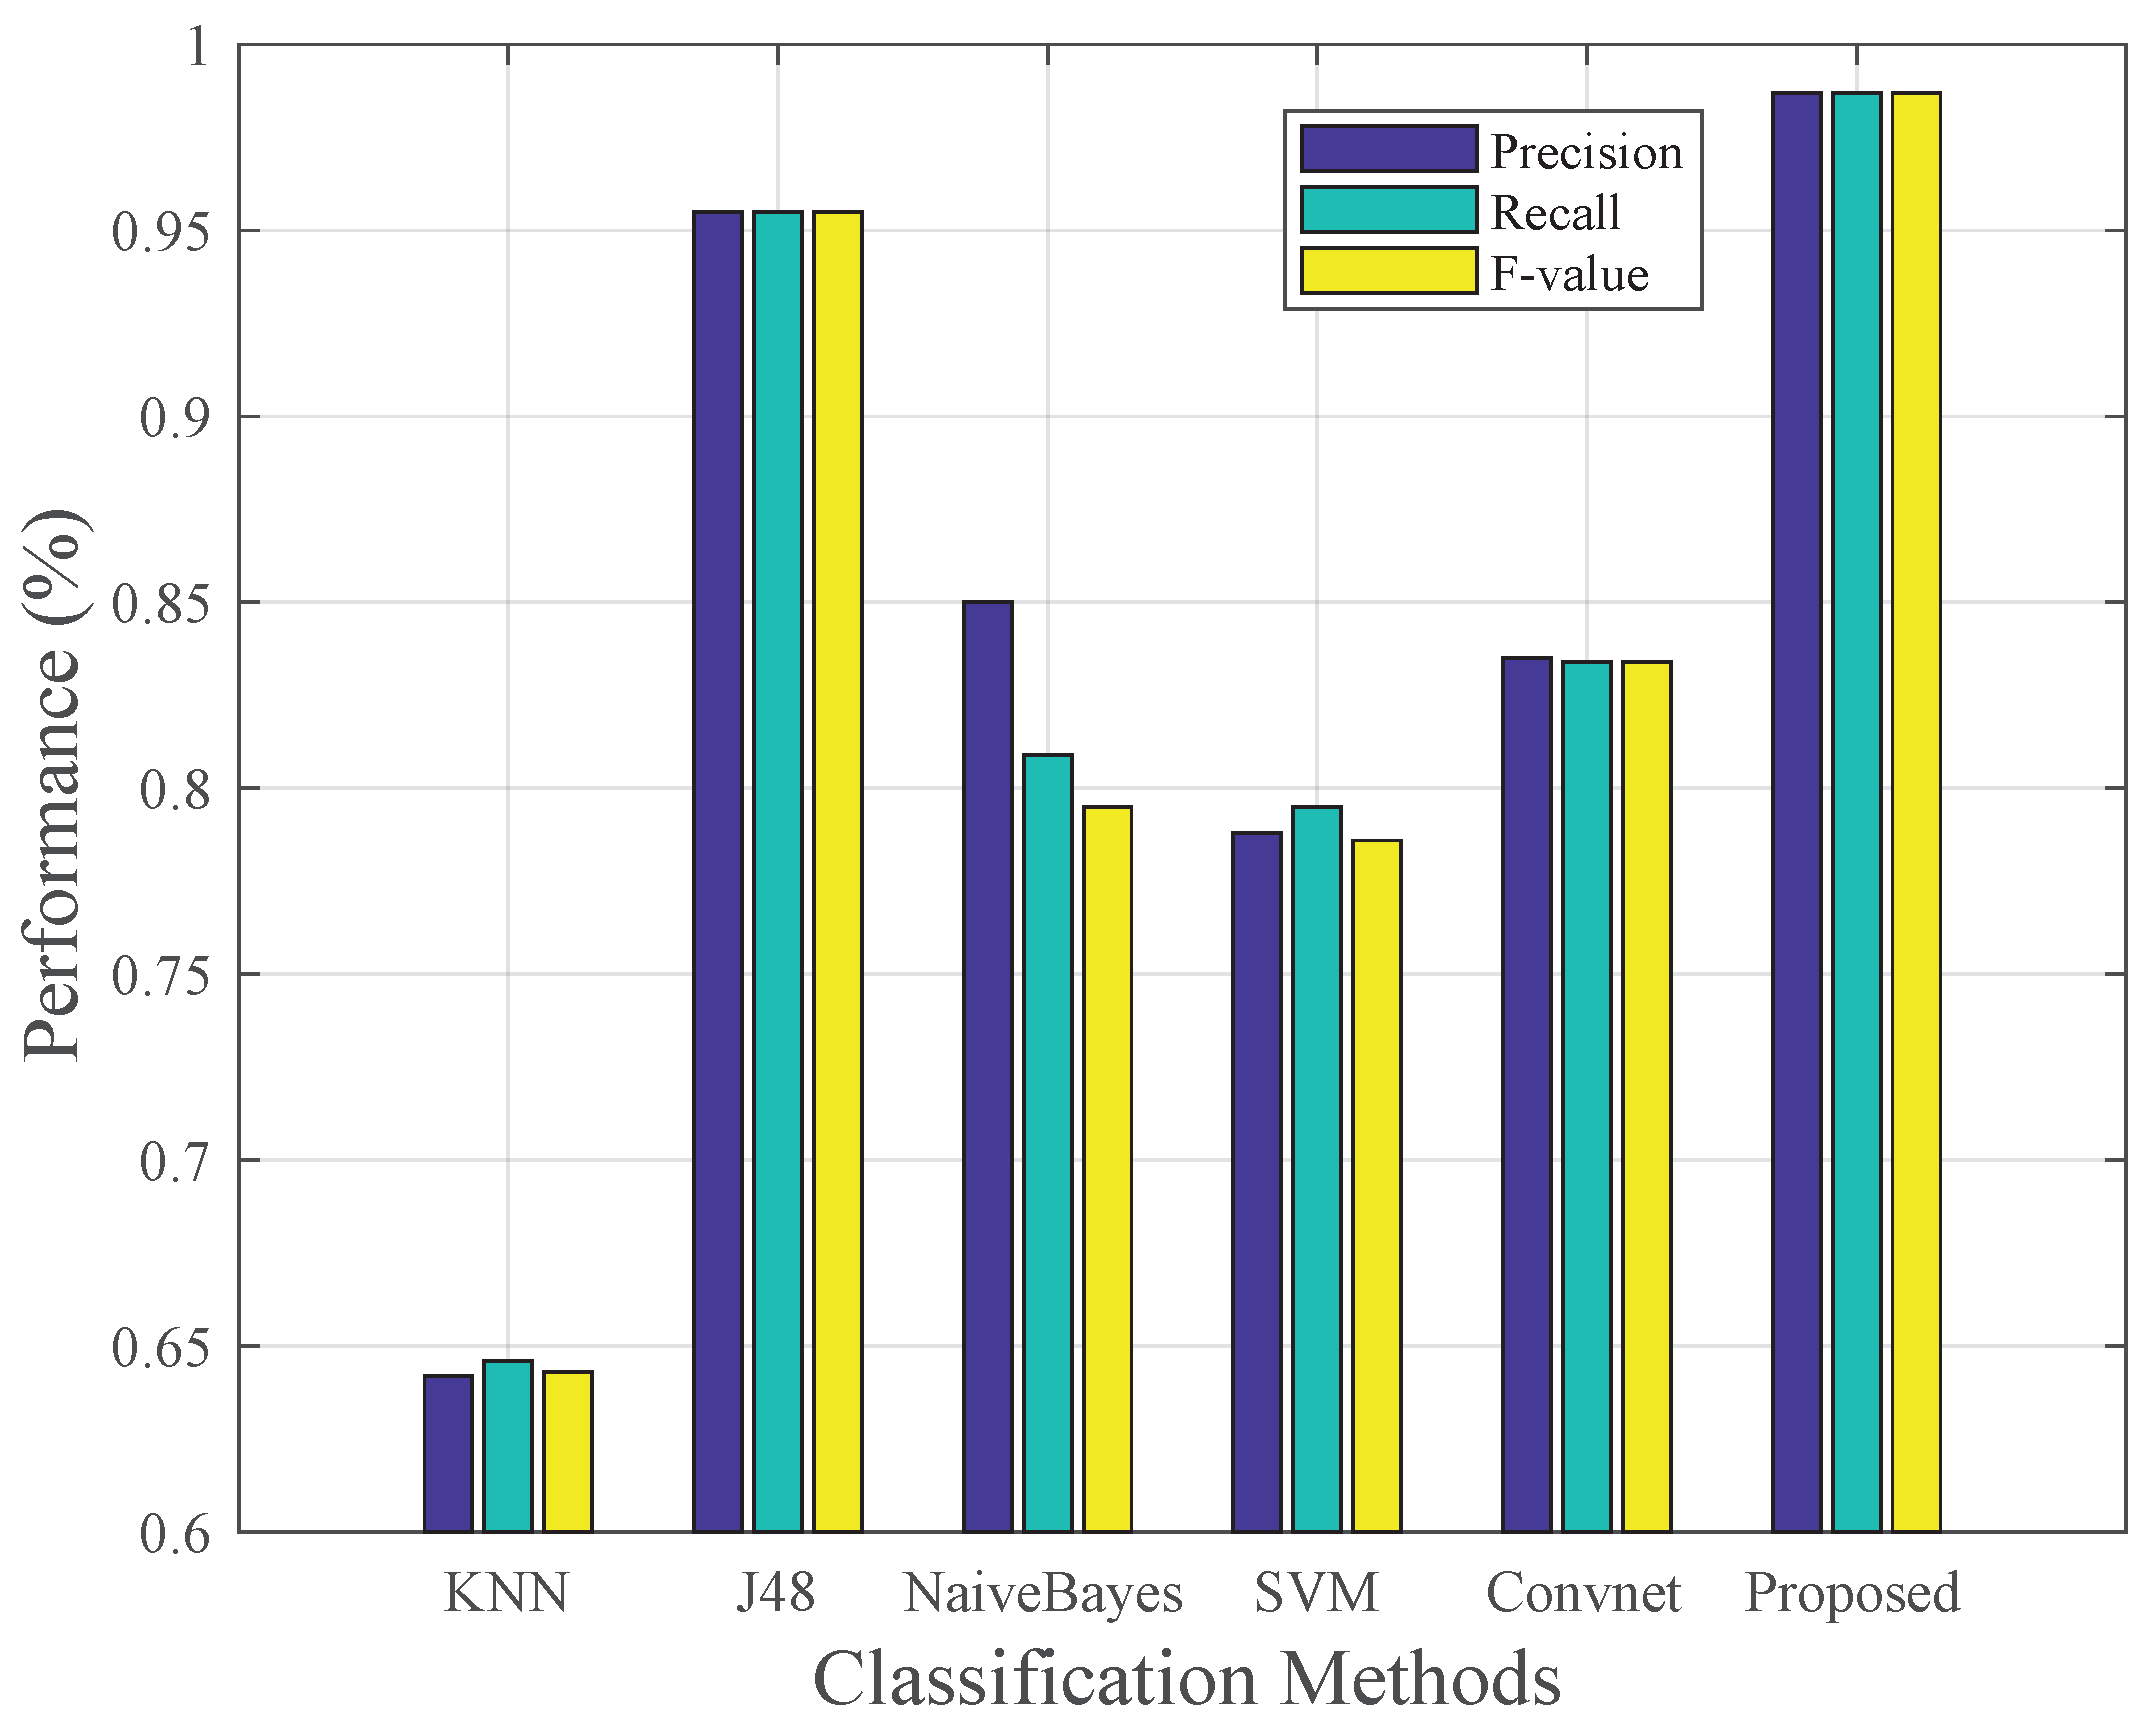
4.6. Comparison with Other Classification Methods

We have compared the proposed method with four traditional machine learning methods, including IBK, J48, NaiveBayes and SVM. The traditional machine learning methods need to select appropriate features. We use 64 features including statistical features, time domain features and frequency domain features (refer to [6]). Moreover, we have also compared the proposed method with another deep learning recognition approach named Convnet [35], which has a proven better performance than traditional ones like DT (decision tree) and SVM (Support vector machine). Convnet classified six types of human activities such as walking, upstairs, downstairs, standing, laying and sitting just utilizing an accelerometer and gyroscope.
Figure 10 and Figure 11 shows the comparison result. Figure 11 shows that the proposed method achieves 0.987 average F-measures of nine types while J48 which performs best in other methods acquires the average F-measures of 0.955. The other four methods show poorer performance with the F-measures less than 0.85. Therefore, the proposed method performs better than state-of-the-art methods in dealing with indoor human activities. Figure 10 shows that only the proposed method and J48 can achieve relatively stable performance on every activity. However, J48 shows just 0.92 F-measures on A6, A7 and A8 which is obviously worse than the proposed method. Furthermore, traditional machine learning methods require laborious human intervention in extracting complex hand-crafted features, so the J48 is time-consuming in the feature extraction process. Convet can hardly recognize similar activities such as up elevator and down elevator. We think the main reason is that Convnet is trained without barometer readings. We think that barometer is of high importance to sense the changing of altitude, so it can easily distinguish activities such as upstairs and downstairs which causes the change of height in different ways.

5. Conclusions

This paper presents a smartphone-based activity recognition method using a convolutional neural network, which can be used for indoor localization. The proposed method can learn the features automatically to avoid time-consuming feature extraction and selection. An activity database is built, which contains more than 6 GB of data collected by smartphones. Experimental results show that the proposed method achieves approximately 98% accuracy in identifying nine types of activities, which outperforms other classification methods.
There are some limitations in this work. Firstly, we did not consider the energy consumption problem in designing the recognition algorithm. Secondly, the dataset is collected from ten persons, which may not be enough to build a good model for the general population. In the future, we aim to keep collecting training data from more people. Meanwhile, we will investigate a deeper and more complex deep learning framework to improve the current method. Moreover, we will take into account the energy consumption in designing the recognition algorithm, for example, reducing the data sampling rate and the number of sensors used.

Author Contributions

The framework was proposed by Q.L. and B.Z., and further development and implementation were realized by B.Z. and J.Y.

Funding

This paper was supported by National Key R&D Program of China (2016YFB0502204), National Natural Science Foundation of China (41701519), Natural Science Foundation of Guangdong Province (2017A030310544), Open Research Fund Program of State Key Laboratory of Information Engineering in Surveying, Mapping, and Remote Sensing (16I02), Research Program of Shenzhen S&T Innovation Committee (JCYJ20170412105839839).

Conflicts of Interest

The authors declare no conflict of interest.

References

  1. Wang, H.; Sen, S.; Elgohary, A.; Farid, M.; Youssef, M.; Choudhury, R.R. No need to war-drive: Unsupervised indoor localization. In Proceedings of the 10th International Conference on Mobile Systems, Applications, and Services, Lake District, UK, 26–29 June 2012; pp. 197–210. [Google Scholar]
  2. Zhou, B.; Li, Q.; Mao, Q.; Tu, W.; Zhang, X. Activity sequence-based indoor pedestrian localization using smartphones. IEEE Trans. Hum. Mach. Syst. 2015, 45, 562–574. [Google Scholar] [CrossRef]
  3. Zhou, B.; Li, Q.; Mao, Q.; Tu, W.; Zhang, X.; Chen, L. ALIMC: Activity landmark-based indoor mapping via crowdsourcing. IEEE Trans. Intell. Transp. Syst. 2015, 16, 2774–2785. [Google Scholar] [CrossRef]
  4. Abdelnasser, H.; Mohamed, R.; Elgohary, A.; Alzantot, M.F.; Wang, H.; Sen, S.; Choudhury, R.R.; Youssef, M. SemanticSLAM: Using environment landmarks for unsupervised indoor localization. IEEE Trans. Mob. Comput. 2016, 15, 1770–1782. [Google Scholar] [CrossRef]
  5. Zhou, B.; Li, Q.; Mao, Q.; Tu, W. A robust Crowdsourcing-based indoor localization system. Sensors 2017, 17, 864. [Google Scholar] [CrossRef]
  6. Lara, O.D.; Labrador, M.A. A survey on human activity recognition using wearable sensors. IEEE Commun. Surv. Tutor. 2013, 15, 1192–1209. [Google Scholar] [CrossRef]
  7. Poppe, R. A survey on vision-based human action recognition. Image Vis. Comput. 2010, 28, 976–990. [Google Scholar] [CrossRef]
  8. Gao, Q.; Wang, J.; Ma, X.; Feng, X.; Wang, H. CSI-Based Device-Free Wireless Localization and Activity Recognition Using Radio Image Features. IEEE Trans. Veh. Technol. 2017, 66, 10346–10356. [Google Scholar] [CrossRef]
  9. Wang, A.; Chen, G.; Yang, J.; Zhao, S.; Chang, C.Y. A comparative study on human activity recognition using inertial sensors in a smartphone. IEEE Sens. J. 2016, 16, 4566–4578. [Google Scholar] [CrossRef]
  10. Plötz, T.; Hammerla, N.Y.; Olivier, P. Feature learning for activity recognition in ubiquitous computing. In Proceedings of the International Joint Conference on Artificial Intelligence, Barcelona, Spain, 16–22 July 2011; Volume 22, p. 1729. [Google Scholar]
  11. LeCun, Y.; Bengio, Y. Convolutional networks for images, speech, and time series. In The Handbook of Brain Theory and Neural Networks; The MIT Press: Cambridge, MA, USA, 1995. [Google Scholar]
  12. Krizhevsky, A.; Sutskever, I.; Hinton, G.E. Imagenet classification with deep convolutional neural networks. Adv. Neural Inf. Process. Syst. 2012, 25, 1097–1105. [Google Scholar] [CrossRef]
  13. Xu, Y.; Du, J.; Dai, L.R.; Lee, C.H. An experimental study on speech enhancement based on deep neural networks. IEEE Signal Proc. Lett. 2014, 21, 65–68. [Google Scholar] [CrossRef]
  14. Fang, S.H.; Fei, Y.X.; Xu, Z.; Tsao, Y. Learning Transportation Modes From Smartphone Sensors Based on Deep Neural Network. IEEE Sens. J. 2017, 17, 6111–6118. [Google Scholar] [CrossRef]
  15. Wang, X.; Gao, L.; Mao, S.; Pandey, S. CSI-based fingerprinting for indoor localization: A deep learning approach. IEEE Trans. Veh. Technol. 2017, 66, 763–776. [Google Scholar] [CrossRef]
  16. LeCun, Y.; Bengio, Y.; Hinton, G. Deep learning. Nature 2015, 521, 436. [Google Scholar] [CrossRef] [PubMed]
  17. Aggarwal, J.K.; Xia, L. Human activity recognition from 3d data: A review. Pattern Recognit. Lett. 2014, 48, 70–80. [Google Scholar] [CrossRef]
  18. Wang, Y.; Wu, K.; Ni, L.M. Wifall: Device-free fall detection by wireless networks. IEEE Trans. Mob. Comput. 2017, 16, 581–594. [Google Scholar] [CrossRef]
  19. Wang, Y.; Liu, J.; Chen, Y.; Gruteser, M.; Yang, J.; Liu, H. E-eyes: device-free location-oriented activity identification using fine-grained wifi signatures. In Proceedings of the 20th Annual International Conference on Mobile Computing and Networking, Maui, HI, USA, 7–11 September 2014; pp. 617–628. [Google Scholar]
  20. Wang, W.; Liu, A.X.; Shahzad, M.; Ling, K.; Lu, S. Understanding and modeling of wifi signal based human activity recognition. In Proceedings of the 21st Annual International Conference on Mobile Computing and Networking, Paris, France, 7–11 September 2015; pp. 65–76. [Google Scholar]
  21. Wang, W.; Liu, A.X.; Shahzad, M.; Ling, K.; Lu, S. Device-Free Human Activity Recognition Using Commercial WiFi Devices. IEEE J. Sel. Areas Commun. 2017, 35, 1118–1131. [Google Scholar] [CrossRef]
  22. Foerster, F.; Smeja, M.; Fahrenberg, J. Detection of posture and motion by accelerometry: A validation study in ambulatory monitoring. Comput. Hum. Behav. 1999, 15, 571–583. [Google Scholar] [CrossRef]
  23. Bao, L.; Intille, S.S. Activity recognition from user-annotated acceleration data. In Proceedings of the International Conference on Pervasive Computing, Augsburg, Germany, 23–26 March 2004; pp. 1–17. [Google Scholar]
  24. Ravi, N.; Dandekar, N.; Mysore, P.; Littman, M.L. Activity recognition from accelerometer data. In Proceedings of the 17th Conference on Innovative Applications of Artificial Intelligence, Pittsburgh, PA, USA, 9–13 July 2005; Volume 5, pp. 1541–1546. [Google Scholar]
  25. Khan, A.M.; Lee, Y.K.; Lee, S.Y.; Kim, T.S. A triaxial accelerometer-based physical-activity recognition via augmented-signal features and a hierarchical recognizer. IEEE Trans. Inf. Technol. Biomed. 2010, 14, 1166–1172. [Google Scholar] [CrossRef]
  26. Attal, F.; Mohammed, S.; Dedabrishvili, M.; Chamroukhi, F.; Oukhellou, L.; Amirat, Y. Physical human activity recognition using wearable sensors. Sensors 2015, 15, 31314–31338. [Google Scholar] [CrossRef]
  27. Shoaib, M.; Bosch, S.; Incel, O.D.; Scholten, H.; Havinga, P.J. Fusion of smartphone motion sensors for physical activity recognition. Sensors 2014, 14, 10146–10176. [Google Scholar] [CrossRef]
  28. Lara, O.D.; Labrador, M.A. A mobile platform for real-time human activity recognition. In Proceedings of the Consumer Communications and Networking Conference (CCNC), Las Vegas, NV, USA, 14–17 January 2012; pp. 667–671. [Google Scholar]
  29. Sharma, A.; Lee, Y.D.; Chung, W.Y. High accuracy human activity monitoring using neural network. In Proceedings of the Third International Conference on Convergence and Hybrid Information Technology, Busan, Korea, 11–13 November 2008; Volume 1, pp. 430–435. [Google Scholar]
  30. Wu, W.; Dasgupta, S.; Ramirez, E.E.; Peterson, C.; Norman, G.J. Classification accuracies of physical activities using smartphone motion sensors. J. Med. Internet Res. 2012, 14, e130. [Google Scholar] [CrossRef] [PubMed]
  31. Riboni, D.; Bettini, C. COSAR: hybrid reasoning for context-aware activity recognition. Pers. Ubiquitous Comput. 2011, 15, 271–289. [Google Scholar] [CrossRef]
  32. He, Z.Y.; Jin, L.W. Activity recognition from acceleration data using AR model representation and SVM. In Proceedings of the 2008 International Conference on Machine Learning and Cybernetics, Kunming, China, 12–15 July 2008; Volume 4, pp. 2245–2250. [Google Scholar]
  33. Lee, S.; Le, H.X.; Ngo, H.Q.; Kim, H.I.; Han, M.; Lee, Y.K. Semi-Markov conditional random fields for accelerometer-based activity recognition. Appl. Intell. 2011, 35, 226–241. [Google Scholar]
  34. Zheng, Y.; Liu, Q.; Chen, E.; Ge, Y.; Zhao, J.L. Time series classification using multi-channels deep convolutional neural networks. In Proceedings of the International Conference on Web-Age Information Management, Macau, China, 16–18 June 2014; pp. 298–310. [Google Scholar]
  35. Ronao, C.A.; Cho, S.B. Human activity recognition with smartphone sensors using deep learning neural networks. Expert Syst. Appl. 2016, 59, 235–244. [Google Scholar] [CrossRef]
  36. Gu, F.; Khoshelham, K.; Valaee, S.; Shang, J.; Zhang, R. Locomotion Activity Recognition Using Stacked Denoising Autoencoders. IEEE Intenet Things 2018, 99, 2085–2093. [Google Scholar] [CrossRef]
  37. Ravi, D.; Wong, C.; Lo, B.; Yang, G.Z. Deep learning for human activity recognition: A resource efficient implementation on low-power devices. In Proceedings of the 2016 IEEE 13th International Conference on Wearable and Implantable Body Sensor Networks (BSN), San Francisco, CA, USA, 14–17 June 2016; pp. 71–76. [Google Scholar]
  38. Ioffe, S.; Szegedy, C. Batch Normalization: Accelerating Deep Network Training by Reducing Internal Covariate Shift. arXiv, 2015; arXiv:1502.03167. [Google Scholar]
  39. Robbins, H.; Monro, S. A Stochastic Approximation Method. Ann. Math. Stat. 1951, 22, 400–407. [Google Scholar] [CrossRef]
  40. Fawcett, T. An introduction to ROC analysis. Pattern Recognit. Lett. 2005, 27, 861–874. [Google Scholar] [CrossRef]
Figure 1. The architecture of the proposed method.
Sensors 19 00621 g001
Figure 2. The performance with different convolutional layers.
Sensors 19 00621 g002
Figure 3. The performance with different filter size.
Sensors 19 00621 g003
Figure 4. The performance with different feature map numbers.
Sensors 19 00621 g004
Figure 5. The performance with different pooling size.
Sensors 19 00621 g005
Figure 6. The performance with different learning rate.
Sensors 19 00621 g006
Figure 7. The performance with different batch size.
Sensors 19 00621 g007
Figure 8. The performance with different window size.
Sensors 19 00621 g008
Figure 9. The performance for each type of activities with the best configuration.
Sensors 19 00621 g009
Figure 10. Performance comparison in each type of activity with other methods.
Sensors 19 00621 g010
Figure 11. Comparison of average F-measure of nine activities with other methods.
Sensors 19 00621 g011
Table 1. Types of activities to classify.
No.ActivityDefinition
A1down elevatorTaking an elevator downward
A2down escalatorTaking an escalator downward
A3downstairsGoing down stairs
A4up elevatorTaking an elevator upward
A5up escalatorTaking an escalator upward
A6upstairsGoing up stairs
A7turningTurn a corner
A8walkingThe user walks naturally
A9stillThe user remains static
Table 2. Types of activities to classify.
Software & HardwareConfiguration
CPUIntel Xeon(R) CPU E5-2690 V4 @2.60 GHz × 28
Memory64 GB
Graphics cardGeForce GTX 1080Ti× 2
CUDACuda 8.0
cuDNNCudnn 6.0
GCCGcc 5.4.0
PythonPython 2.7
TensorflowTensorflow 1.4.0
Table 3. The specific information of the participants.
No.Height (cm)GenderAge
1163female25
2168male24
3173male26
4180male22
5180male25
6168male24
7165female23
8186male22
9162female24
10172male31
Table 4. List of hyperparmeters for the proposed CNN. The value in bold is the best setting of each hyperparameter.
HyperparmetersDescriptionValues
N c Number of convolutional layers2, 3, 4, 5, 6
F s Filter size2, 5, 10, 15, 20
N m Number of feature maps60, 80, 100, 120, 140
P s Pooling size3, 4, 5, 6, 7
L r Learning rate0.0001, 0.0005, 0.001, 0.005, 0.01
B s Batch size16, 32, 64, 128, 256, 512
Table 5. The confusion matrix of the proposed method
PredictedA1A2A3A4A5A6A7A8A9
Actual
A132941825834002
A215335201660000
A3413435509561
A47323398161012
A526501133451001
A61396432811295
A7005003337250
A8111119333531
A9000000003384

