Article

An Effective Optical Dual Gas Sensor for Simultaneous Detection of Oxygen and Ammonia

Department of Electronic Engineering and Organic Electronics Research Center, Ming Chi University of Technology, New Taipei City 24301, Taiwan
*
Author to whom correspondence should be addressed.
Sensors 2019, 19(23), 5124; https://doi.org/10.3390/s19235124
Submission received: 14 October 2019 / Revised: 13 November 2019 / Accepted: 20 November 2019 / Published: 22 November 2019
(This article belongs to the Special Issue Calibration of Chemical Sensors Based on Photoluminescence)

Abstract

:
The development of a simple, low-cost sensor for the effective sensing of multiple gases in industrial or residential zones has been in high demand in recent days. In this article, we have proposed an optical sensor for the dual sensing of oxygen (O2) and ammonia (NH3) gases, which consists of oxygen and ammonia-sensitive fluorescent dyes coated individually on both sides of a glass substrate. An ethyl cellulose (EC) matrix doped with platinum (II) meso-tetrakis (pentafluorophenyl) porphyrin (PtTFPP) serves as the oxygen-sensing material, whereas the NH3-sensing material includes an eosin Y fluorescent indicator immobilized within a cellulose acetate (CA) matrix. Both the oxygen and ammonia-sensitive materials were excited by the same LED light source with a 405 nm peak wavelength, while the corresponding emissions were detected separately for the selective sensing of the gases under study. The dual gas sensor exhibits maximum sensitivities of around 60 and 20 for oxygen and ammonia gases, respectively. The high sensitivity and selectivity of the proposed optical dual sensor suggests the feasibility of the simultaneous sensing of oxygen and ammonia for practical applications.

1. Introduction

A large number of optical chemical sensors have been reported based on several spectroscopic methods including absorptiometry, reflectometry, fluorescence, infrared and Raman spectroscopies, interferometry, and surface plasmon resonance. Among them, the sensors using analyte-sensing fluorescence dyes usually show better sensitivity. Multiple parameters such as decay time, energy transfer, fluorescence quenching, polarization, etc. can be measured simultaneously using optical sensors to achieve specific advantages [1]. Numerous individual O2 and NH3 sensors are already reported based on the fluorescence quenching of various molecules in the presence of analyte gases [2]. However, an efficient dual sensor for O2 and NH3 gases based on fluorescence quenching is still lacking.
Oxygen is a colorless and odorless gas, and it is vital for living life. Oxygen toxicity usually begins to occur at partial pressures >50 kPa causing convulsions and other health problems. In addition, detection of the oxygen level is of paramount importance in different fields, such as food packing, biomedical technology, environmental monitoring, etc. An optical gas sensor can determine oxygen concentration by monitoring the reduction in the fluorescence intensity of a dye molecule via its quenching by oxygen. Basically, the reported optical sensors employ a fluorescence indicator embedded in solid matrix, such as a polymer [2,3,4,5] or a sol–gel matrix [6,7,8,9] for hosting oxygen-sensitive fluorophores and assisting oxygen to penetrate into supporting matrices. Therefore, the properties of the oxygen-sensitive fluorescent dyes and the supporting matrices are important for the fluorescence-based optical sensors. Many studies have suggested ethyl cellulose (EC) as a matrix for detecting the O2 gas [2,3], since it shows high oxygen permeability, good mechanical and chemical stability, and excellent optical transparency in the visible light. The dye platinum (II) meso-tetrakis(pentafluorophenyl) porphyrin (PtTFPP) embedded in the EC matrix shows a high potential as a novel optical oxygen sensor material because of its good absorption in visible light, a strong fluorescence at room temperature, and a large Stokes shifts.
On the other hand, ammonia gas is also a noxious and toxic gas. It irritates the respiratory system, skin, and eyes at low concentration of approximately 50 ppm (mg/L), while immediate and severe irritation occurs in the nose and throat at about 500 ppm, and induces pulmonary edema at about 1000 ppm [10]. The detection of accurate NH3 levels is critical in clinical samples, because the level is sensitive to the functions of many organs, such as kidney and liver [11,12]. There are multiple reasons behind the necessity of detecting ammonia in the fields of environmental monitoring, chemical industry, automotive applications, and medical diagnostics [13]. Previous investigations on NH3 sensing films made of matrices such as microparticles [14], silicon rubber [15], sol–gel [16], TiO2 thin film [17], and cellulose acetate (CA) [18] revealed analyte-dependent optical properties such as absorbance and luminescence. Most of these sensors have displayed improved sensitivity, stability, and reversibility. In this study, eosin Y and CA were chosen as the indicator and the supporting matrix, respectively. SiO2 nanoparticles (4 micron) were employed as network modifiers to increase the sensitivity of the ammonia sensor by taking advantage of the increased surface-to-volume ratio. CA has a high transmittance in visible light and permeability to water and ions. Interestingly, the hydrophobic eosin Y shows reasonable compatibility with CA.
A simple, low-cost optical dual sensor was utilized to detect O2 and NH3 gas based on the independent fluorescence quenching of the sensing materials. The proposed dual sensor was fabricated by coating the ammonia-sensing material on one side of a glass substrate and the oxygen-sensing material on the other side of that glass substrate. The two emission wavelengths sensitive to the selective gases were detected simultaneously. The newly developed sensing film is intended for medical, biological, and environmental applications.

2. Materials and Methods

2.1. Materials

The glass substrate (0.7 mm) was purchased from Corning (New York, NY, USA); platinum(II) meso-tetrakis (pentafluorophenyl) porphyrin (PtTFPP) was purchased from Frontier Scientific, (Logan, UT, USA); cellulose acetate (CA) powder was purchased from Showa Chemicals (Tokyo, Japan) and ethyl cellulose (EC) was purchased from Tokyo Chemical Industry Co., LTD (TCI) (Chuo City, Japan). Other reagents such as EtOH (99.5%) and SiO2 (4 micron, 99.9%) were purchased from ECHO Chemical co Ltd. (Miaoli, Taiwan). Eosin Y (99%) and acetic acid (99%) were purchased from Sigma Aldrich (St. Louis, MO, USA). Tetrahydrofuran (THF, 99.9%) and toluene (99.8%) were purchased from TEDIA (Fairfield, CT, USA). The received chemicals were used without any further purification.

2.2. Methods

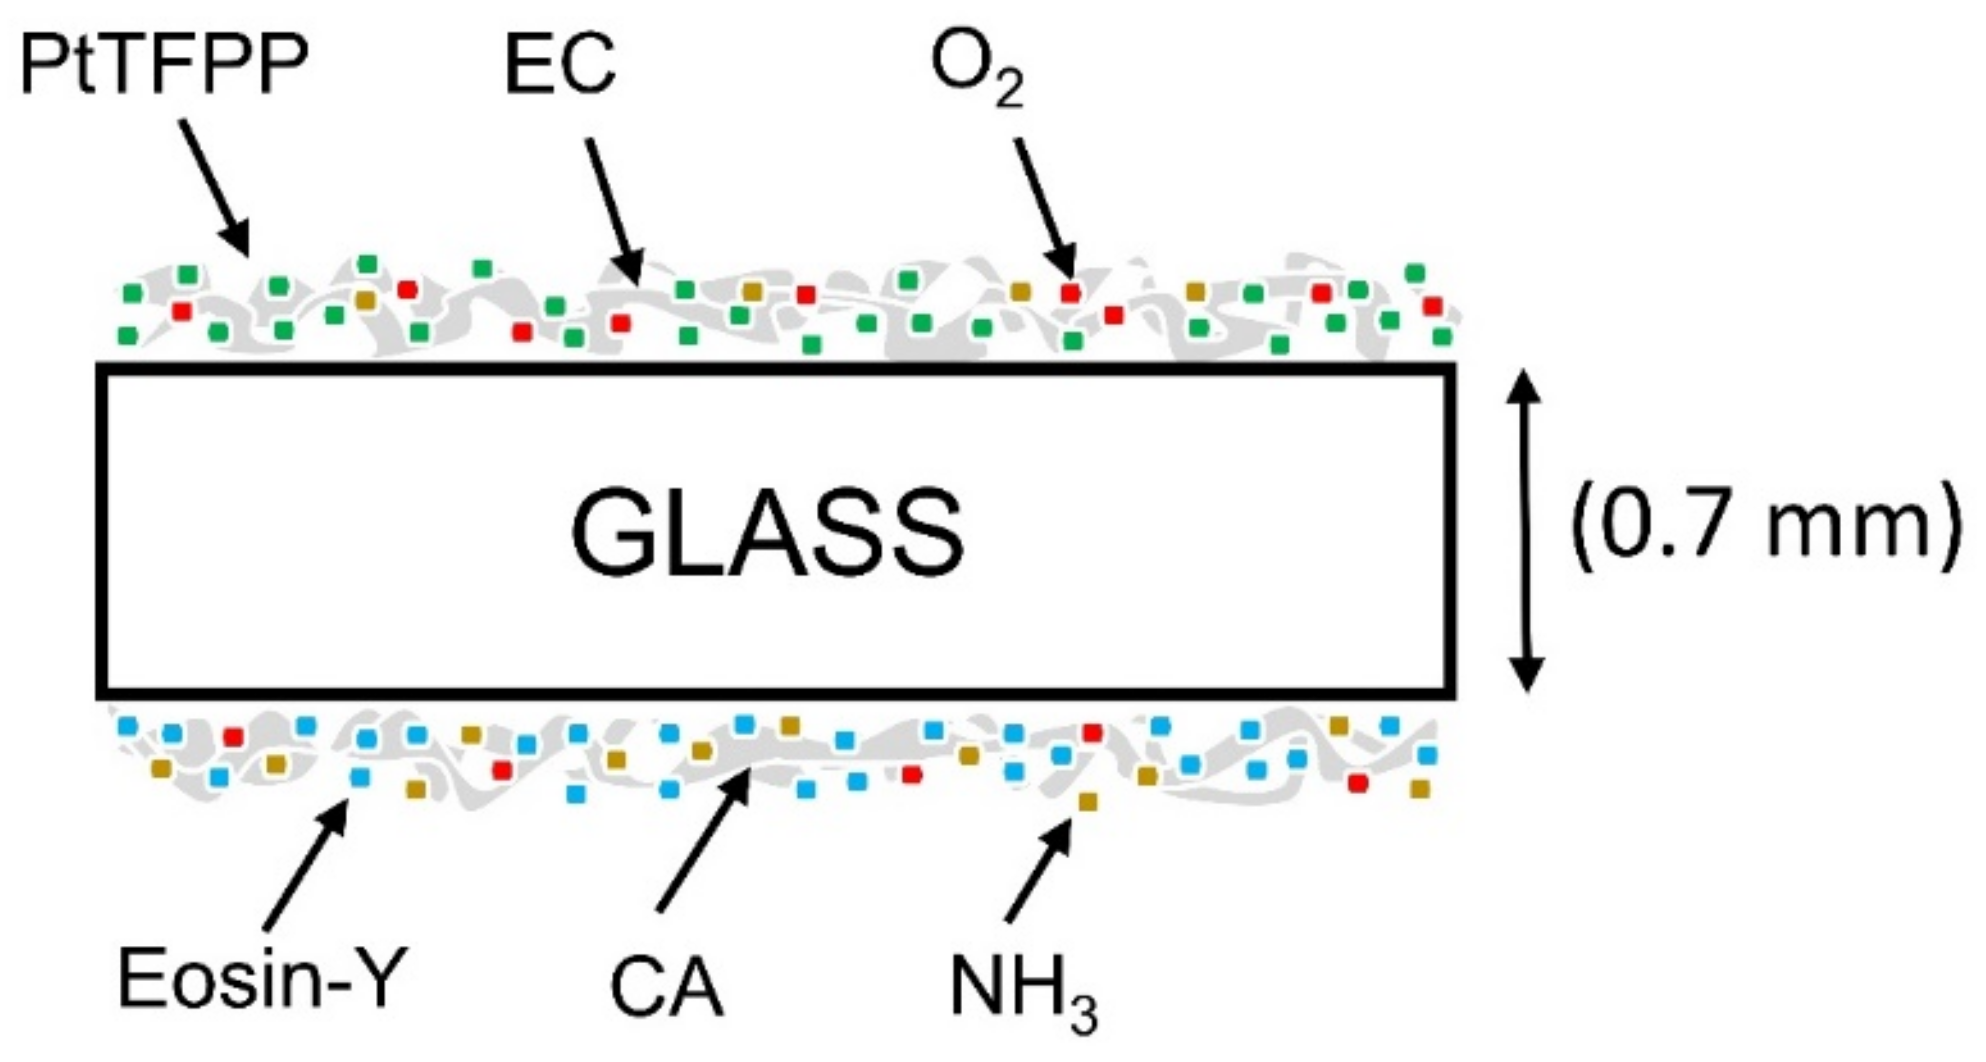
2.2.1. Preparation of Oxygen and Ammonia Sensing Material

Initially, a supporting matrix of the oxygen sensor was prepared by dissolving 1.25 gm of EC in 10 mL of toluene and 2.25 mL of EtOH (99.5%) as described elsewhere [3]. The solution was capped and stirred magnetically until it was turned into a transparent glue-like state. On the other hand, 0.05 gm of PtTFPP dye was dissolved into 10 mL of tetrahydrofuran (THF 99.9%) to produce a highly homogeneous solution for improving the oxygen sensitivity [4]. Finally, the oxygen-sensitive material was prepared by mixing the 100-µL EC matrix and 20-µL PtTFPP/THF solutions.
The supporting matrix of the ammonia sensor was formulated by dissolving 0.22 gm of CA powder in 10 mL of acetic acid under stirring at 40 °C to form a transparent solution [18]. The ammonia-sensing indicator solution was prepared by dissolving 0.05 gm of eosin Y dye in 10 mL of THF. Finally, the ammonia-sensitive material was prepared by mixing the 50-µL CA matrix and 100-µL eosin Y/THF solutions with 1 mg of silica nanoparticles, which was then stirred mechanically at room temperature.
The oxygen-sensing material was spin coated (150 rpm for 20 sec) on one surface of a 0.7 mm glass substrate, and the ammonia-sensing material was spin coated (150 rpm for 20 sec) on the other surface of the glass substrate. The residual solvent in the sample was evaporated off at room temperature for 24 h to obtain the proposed dual gas sensor for O2 and NH3, as shown schematically in Figure 1.

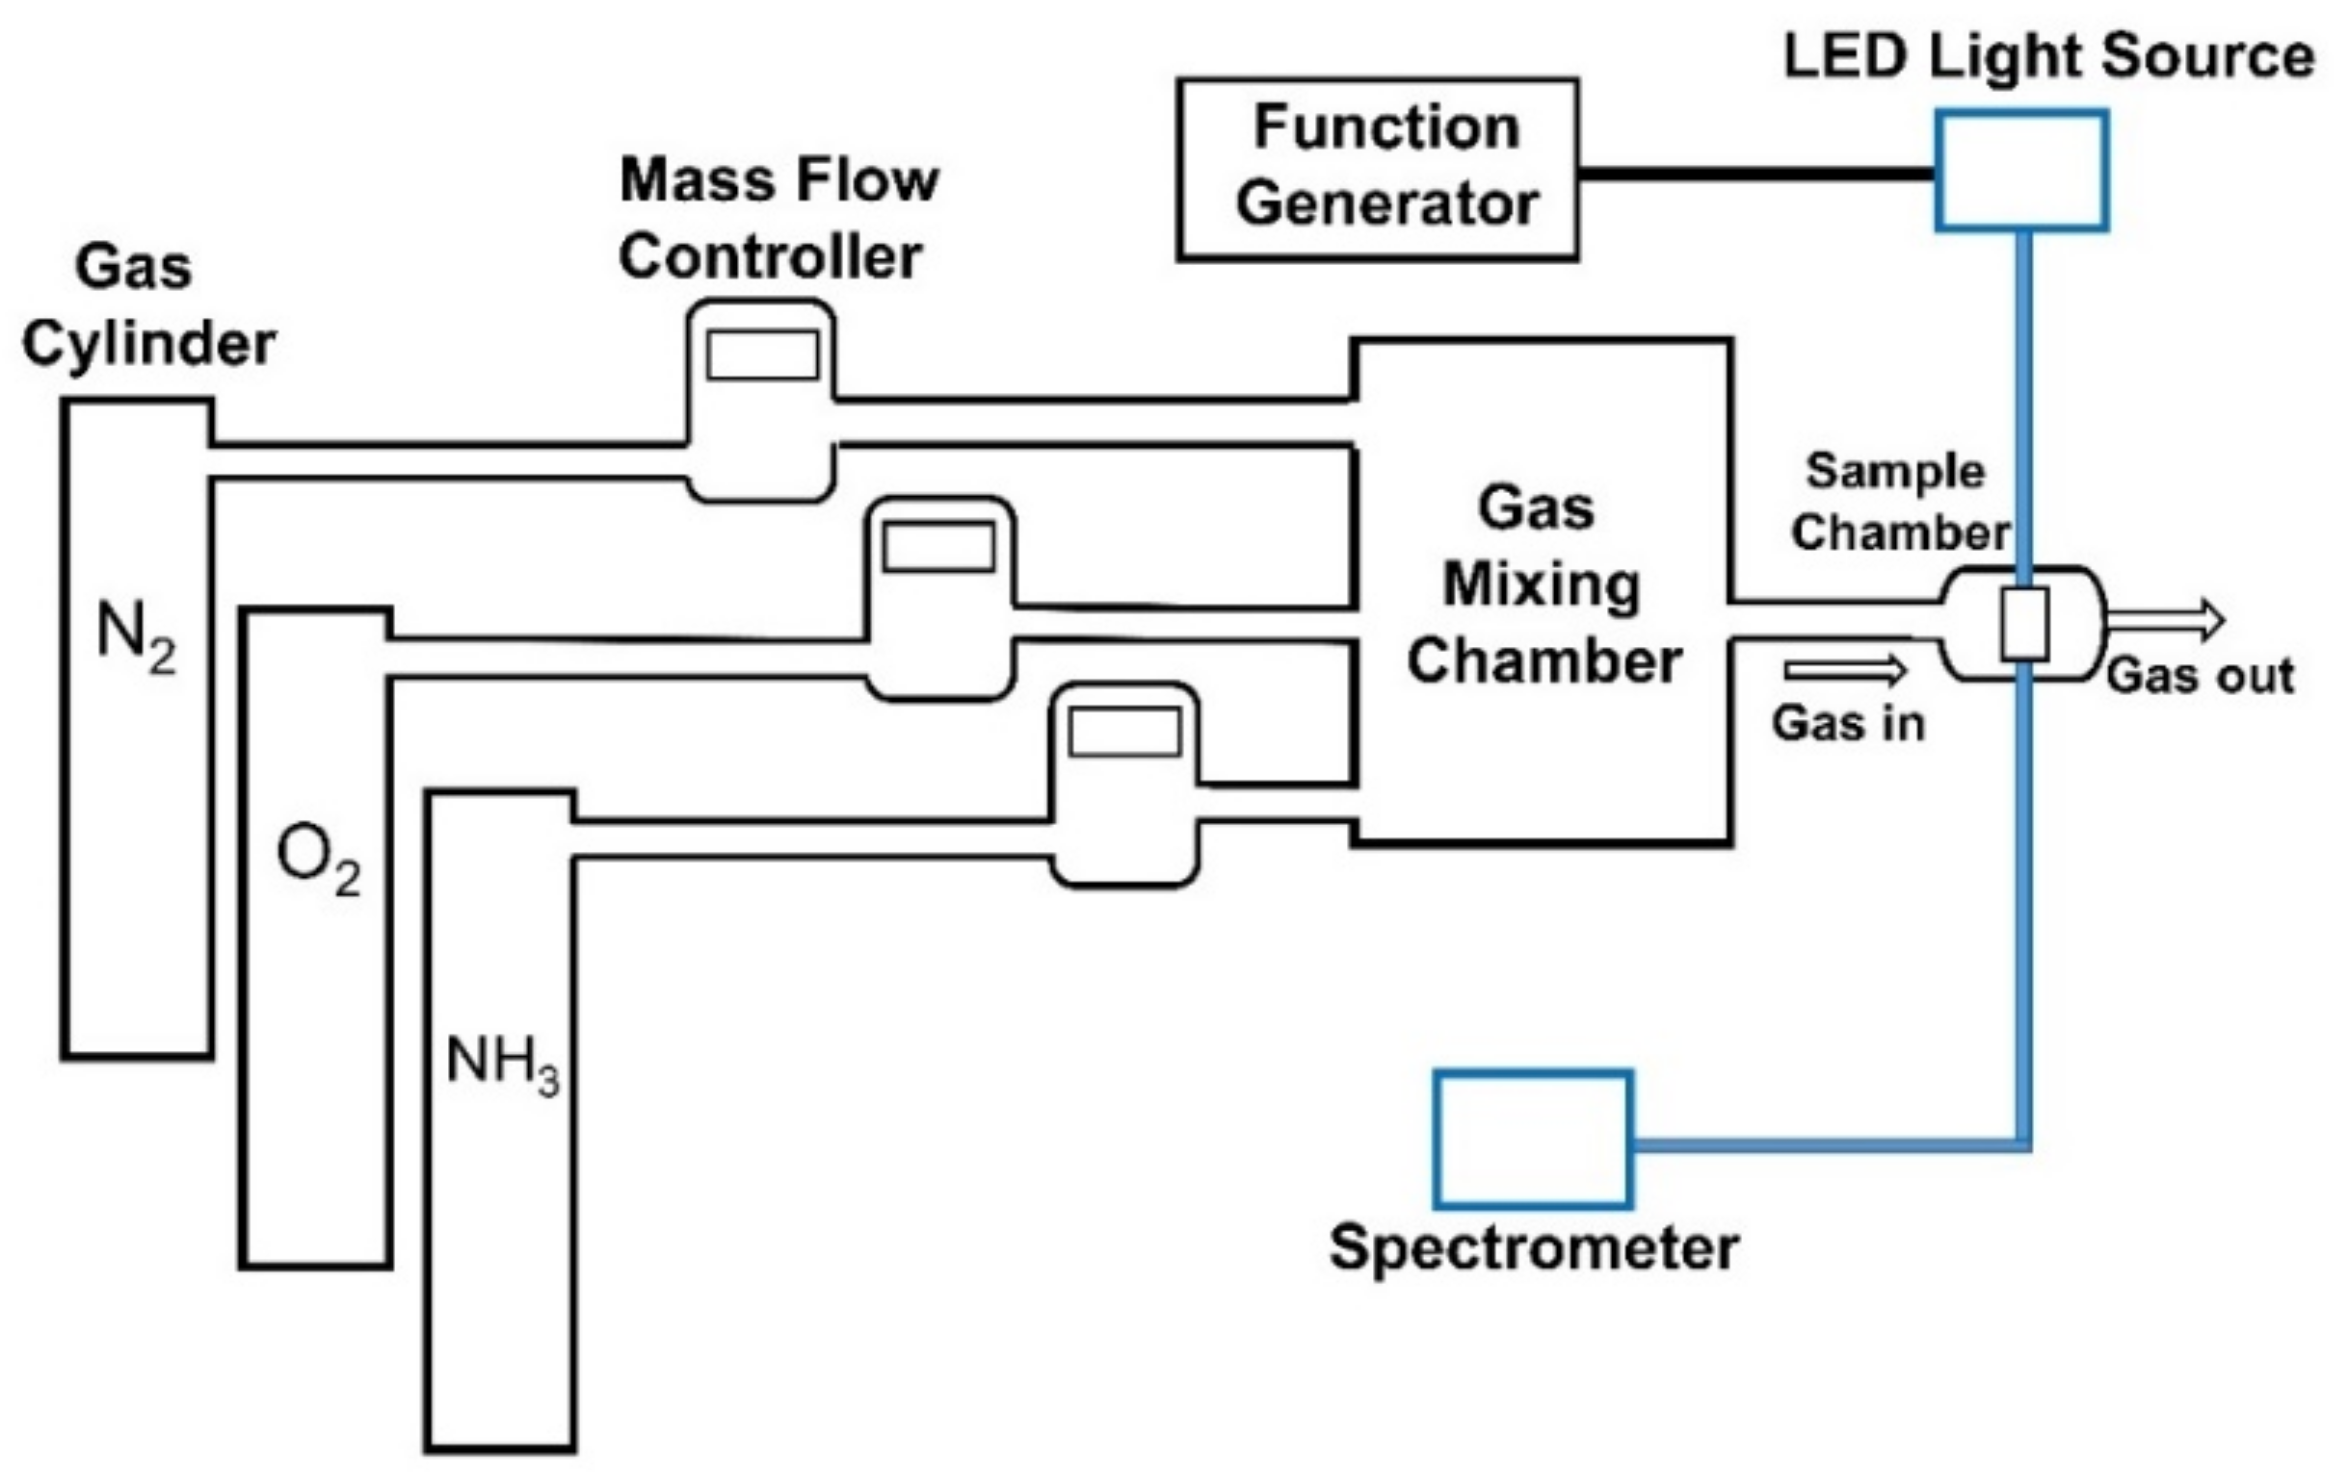
2.2.2. Instrumentation

Figure 2 illustrates the schematic diagram of the experimental setup used to characterize the performance of the optical dual sensor. In this experiment, the fluorescence excitation was provided by an LED with a central wavelength of 405 nm driven by an arbitrary waveform generator (TGA1240, Thurlby Thandar Instruments (TTi) Ltd., Huntington, UK) at 10-kHz frequency. A USB4000 fiber optic spectrometer (U.S. Ocean Optics, Inc., Largo, FL, USA) was used for measurement of the emission spectra, i.e., the relative fluorescence intensity. The concentration of O2 and NH3 were adjusted by mixing O2, NH3, and N2 in a mixing chamber through mass flow controllers (Aalborg instruments and Controls Inc., New York, NY, USA, Model GFC 17) at room temperature. A UV-Visible Spectrophotometer was used to measure the absorption spectra of dual-sensing materials. A spin coater (SWIENCO, Taiwan) was used to prepare the thin films of the sensing materials on a glass substrate.

3. Basic Theory

The quenching of a fluorophore depends on several factors. In the simplest scenario of a fluorophore in a homogeneous microenvironment, quenching follows the Stern–Volmer (S-V) equation [19], i.e.,
I0/I = 1 + Ksv[Q]
where I0 and I represent the steady-state fluorescence intensities in the absence and presence of a quencher; Ksv is the Stern–Volmer quenching constant; and [Q] is the concentration of quencher molecules or analyte molecules in this case. In the ideal case, the plot of I0/I versus [Q] is linear to the slope of Ksv. The linearity of this equation describes the behavior of dynamic quenching. The above equation is required to be modified for the real case where not all the molecules are sensitive to the quencher, and the modified S–V equation can be written as [19,20]:
      I 0 I = f 1 + K S V Q + 1 f 1
where I0 and I represent the steady-state fluorescence intensities in the absence and presence of the quencher molecules, respectively; Ksv and [Q] are the Stern–Volmer quenching constant and the concentration of quencher molecules respectively; and f is the fraction of the fluorescence caused by the sensitive molecules in a quencher-free environment.

4. Results and Discussion

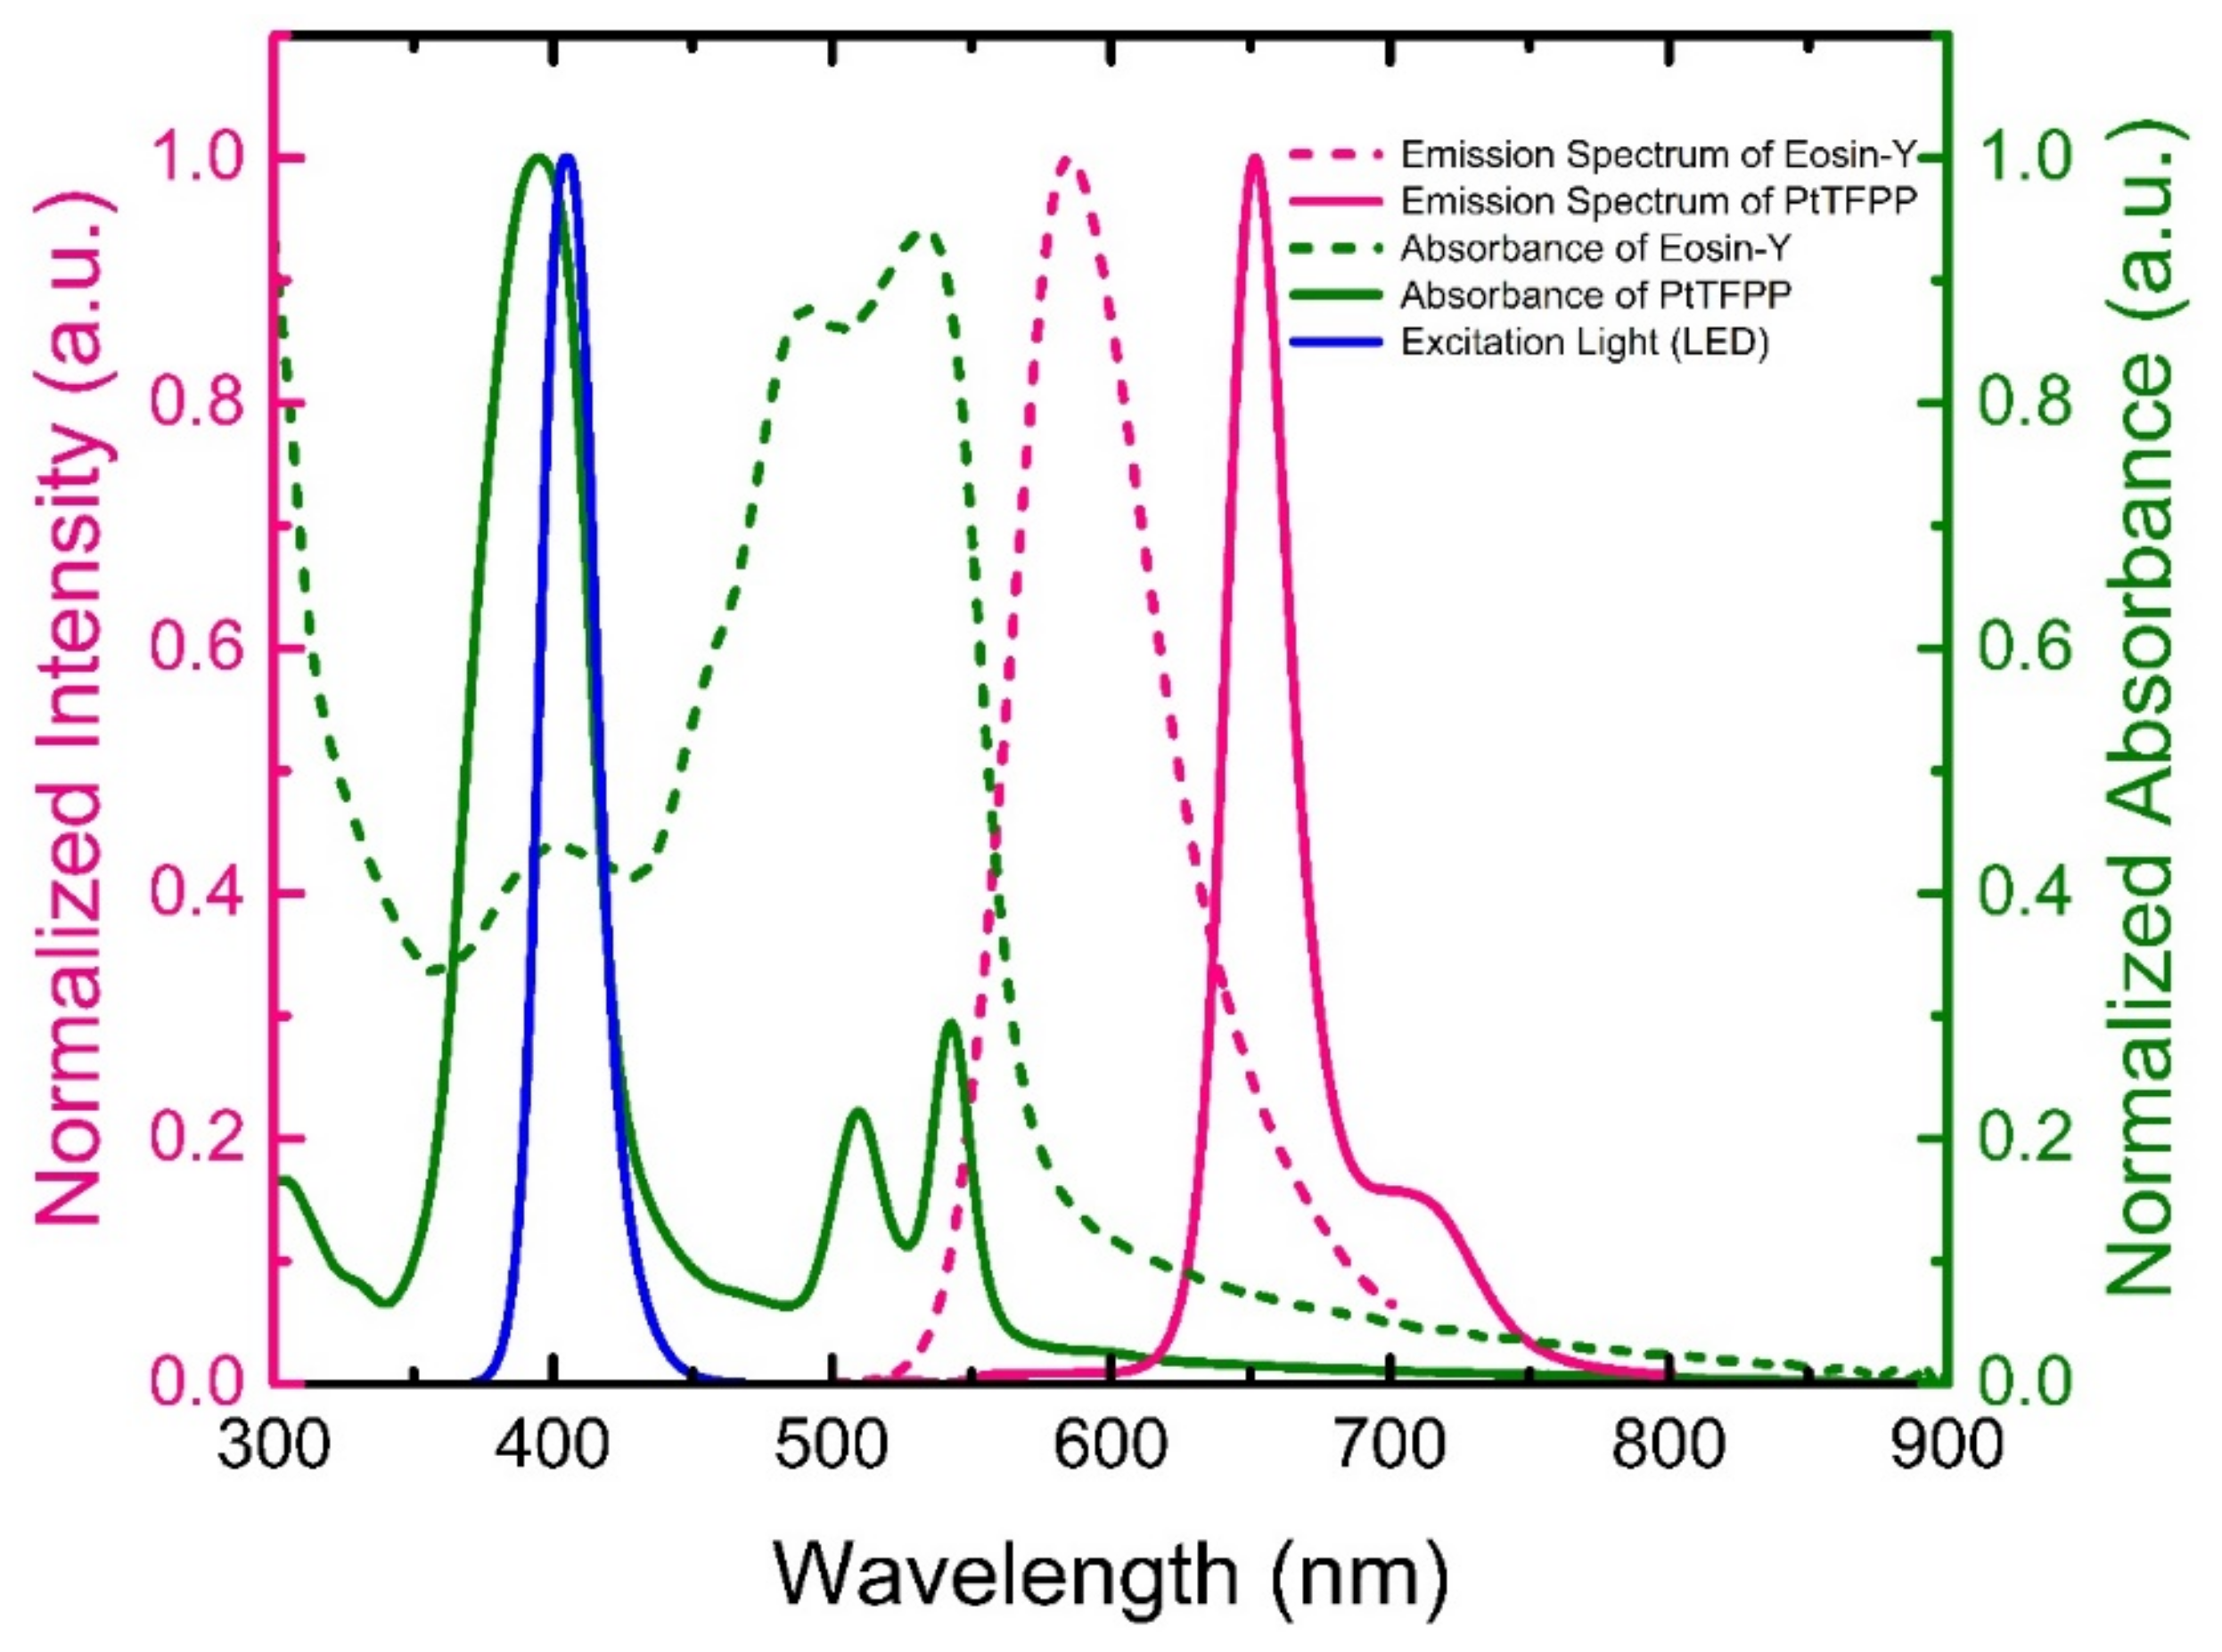
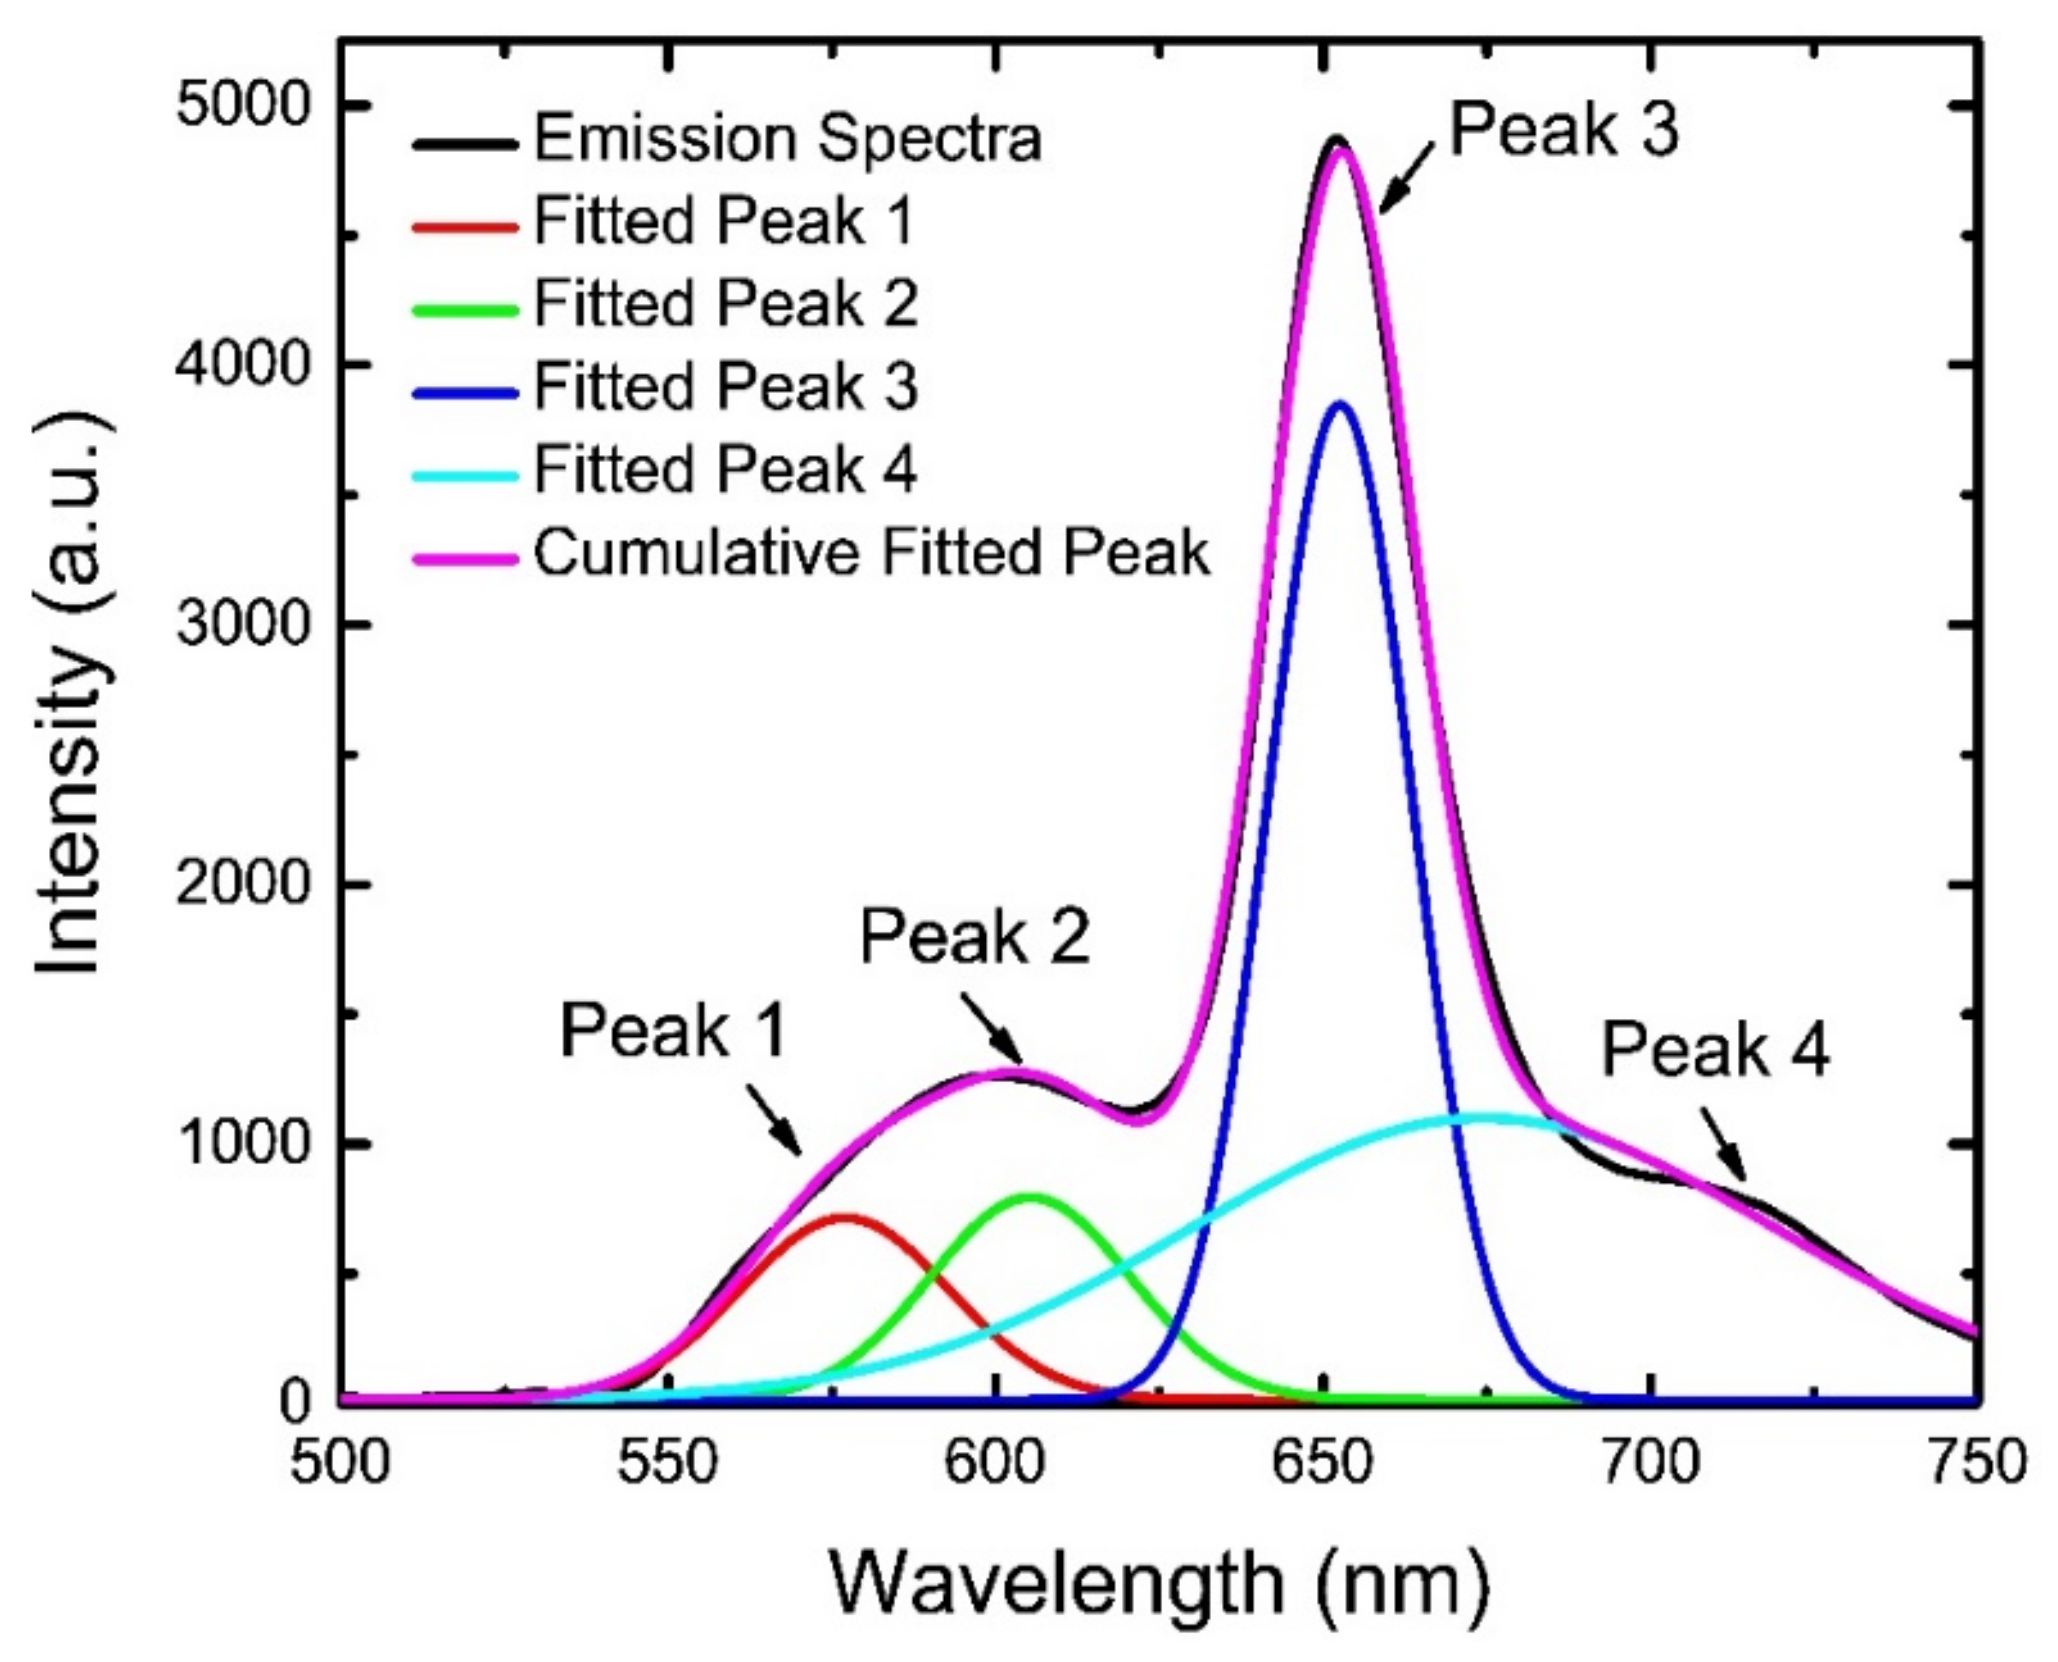
4.1. Optical Characterizations of the Sensing Materials

Figure 3 depicts the absorption and fluorescence spectra of the materials (PtTFPP and eosin Y), respectively. The absorption spectra were captured from individual materials, while the fluorescence spectrum was captured from the dual sensor i.e., the combined fluorescence spectrum of PtTFPP and eosin Y materials. The central peaks of the absorption spectra for PtTFPP and eosin Y are 400 nm and 534 nm respectively. Besides, eosin Y shows a shoulder peak at around 400 nm. As a consequence, both the NH3 indicator, eosin Y, as well as the O2 indicator, PtTFPP, could be excited efficiently by a single 405-nm LED light source exhibiting strong fluorescence emissions at 582 nm and 650 nm, respectively. Thus, the individual detection of O2 and NH3 gases are performed without any ambiguity by monitoring the well-resolved bright emissions of sensing materials. The shoulder at ~720 nm in the fluorescence spectrum of the dual sensor belongs to the fluorescence spectrum of the PtTFPP material.

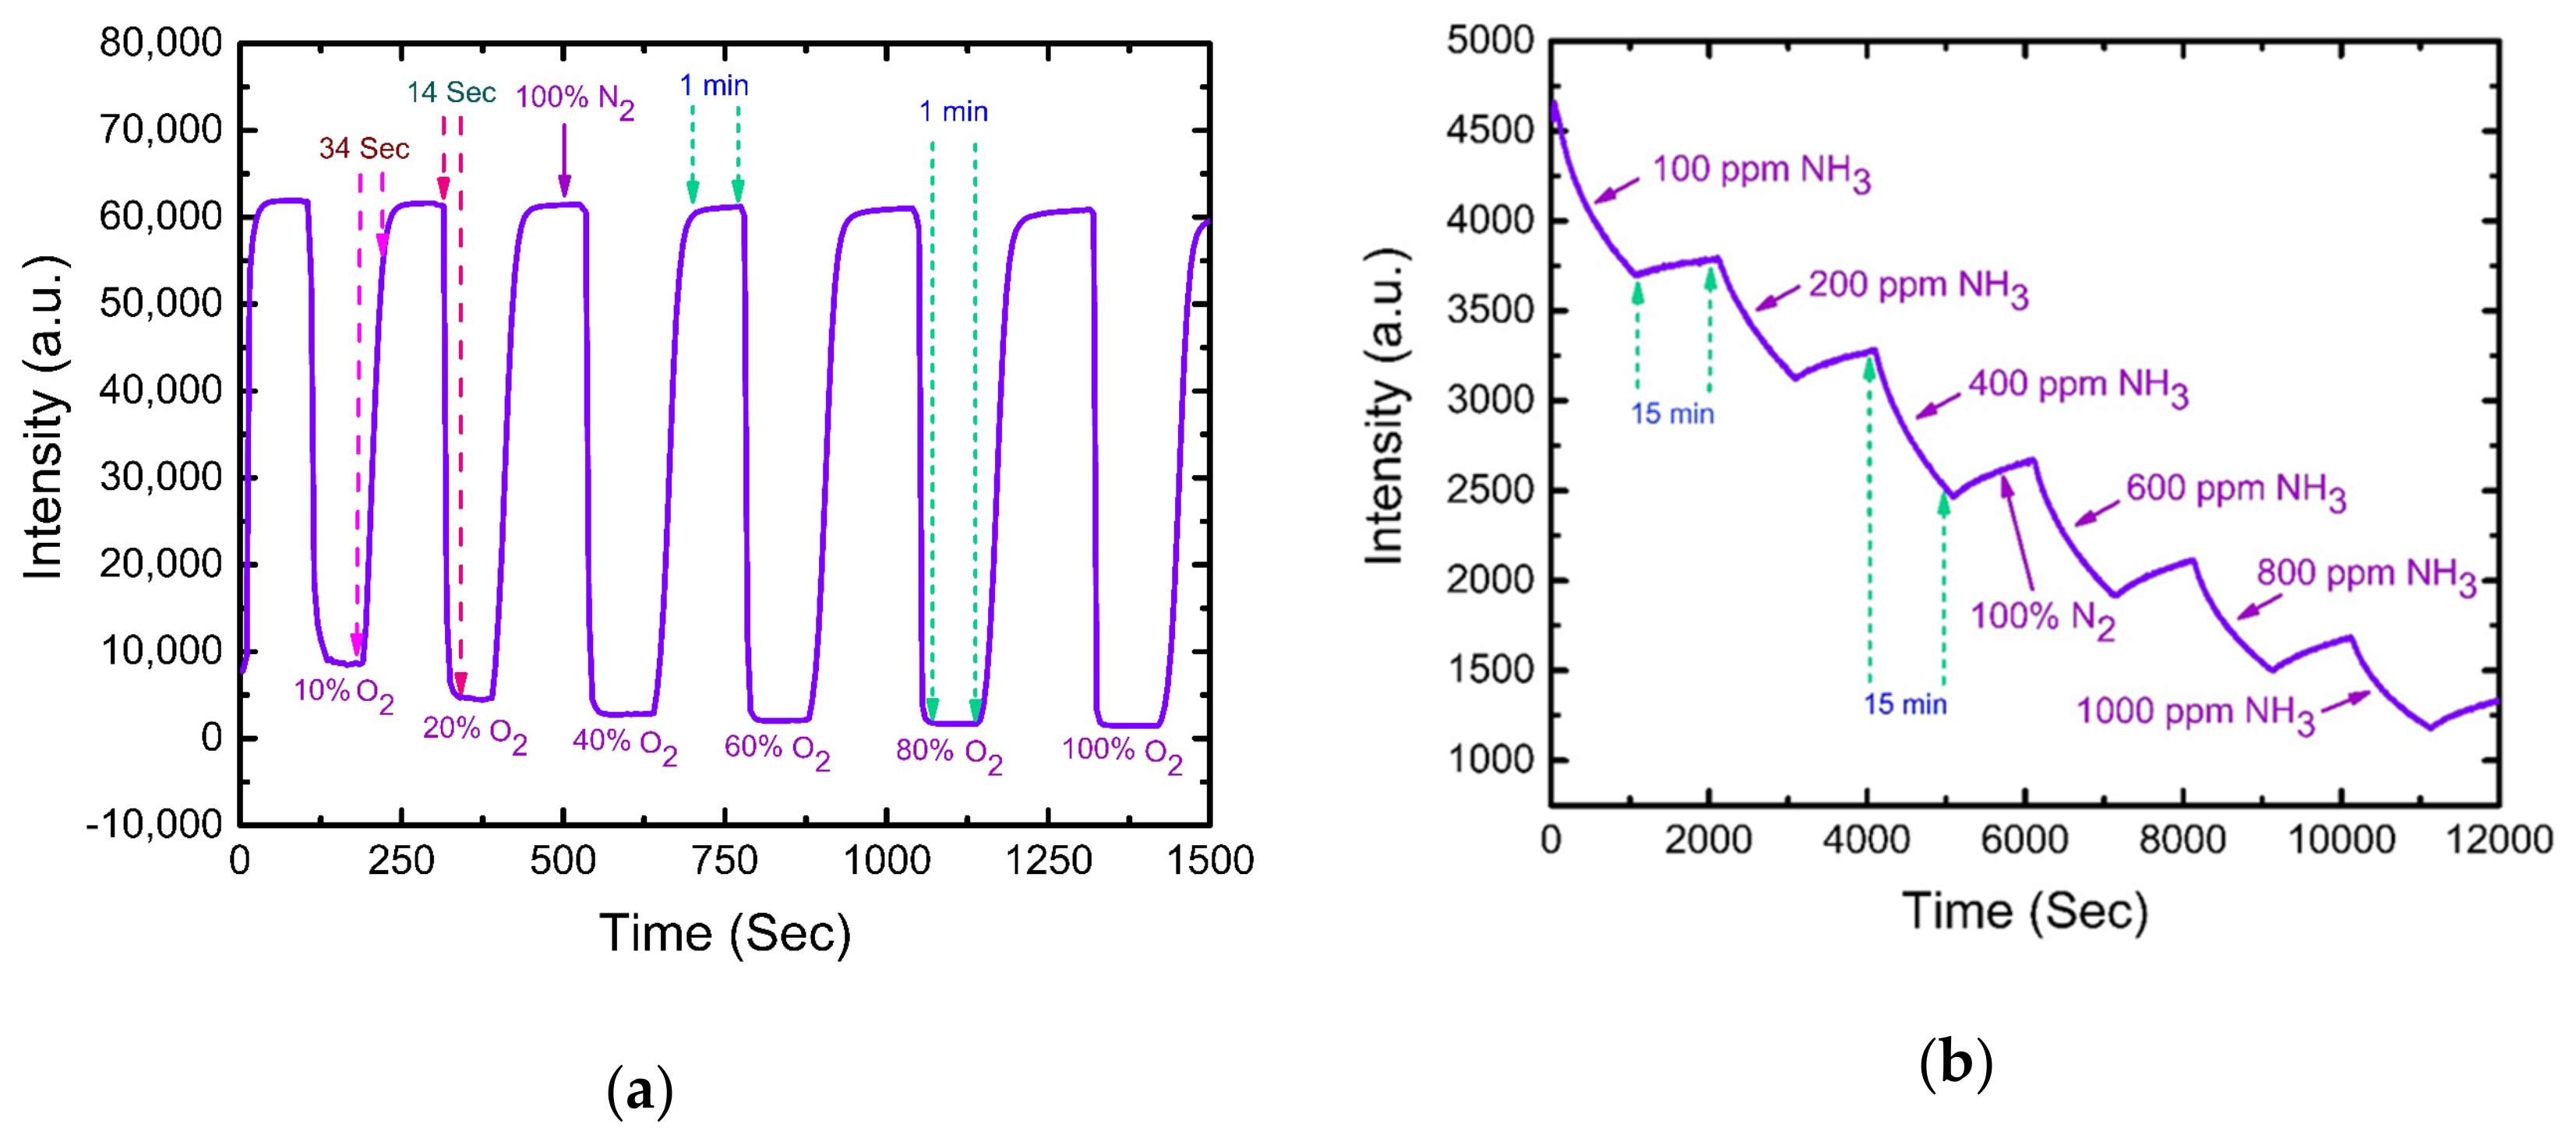
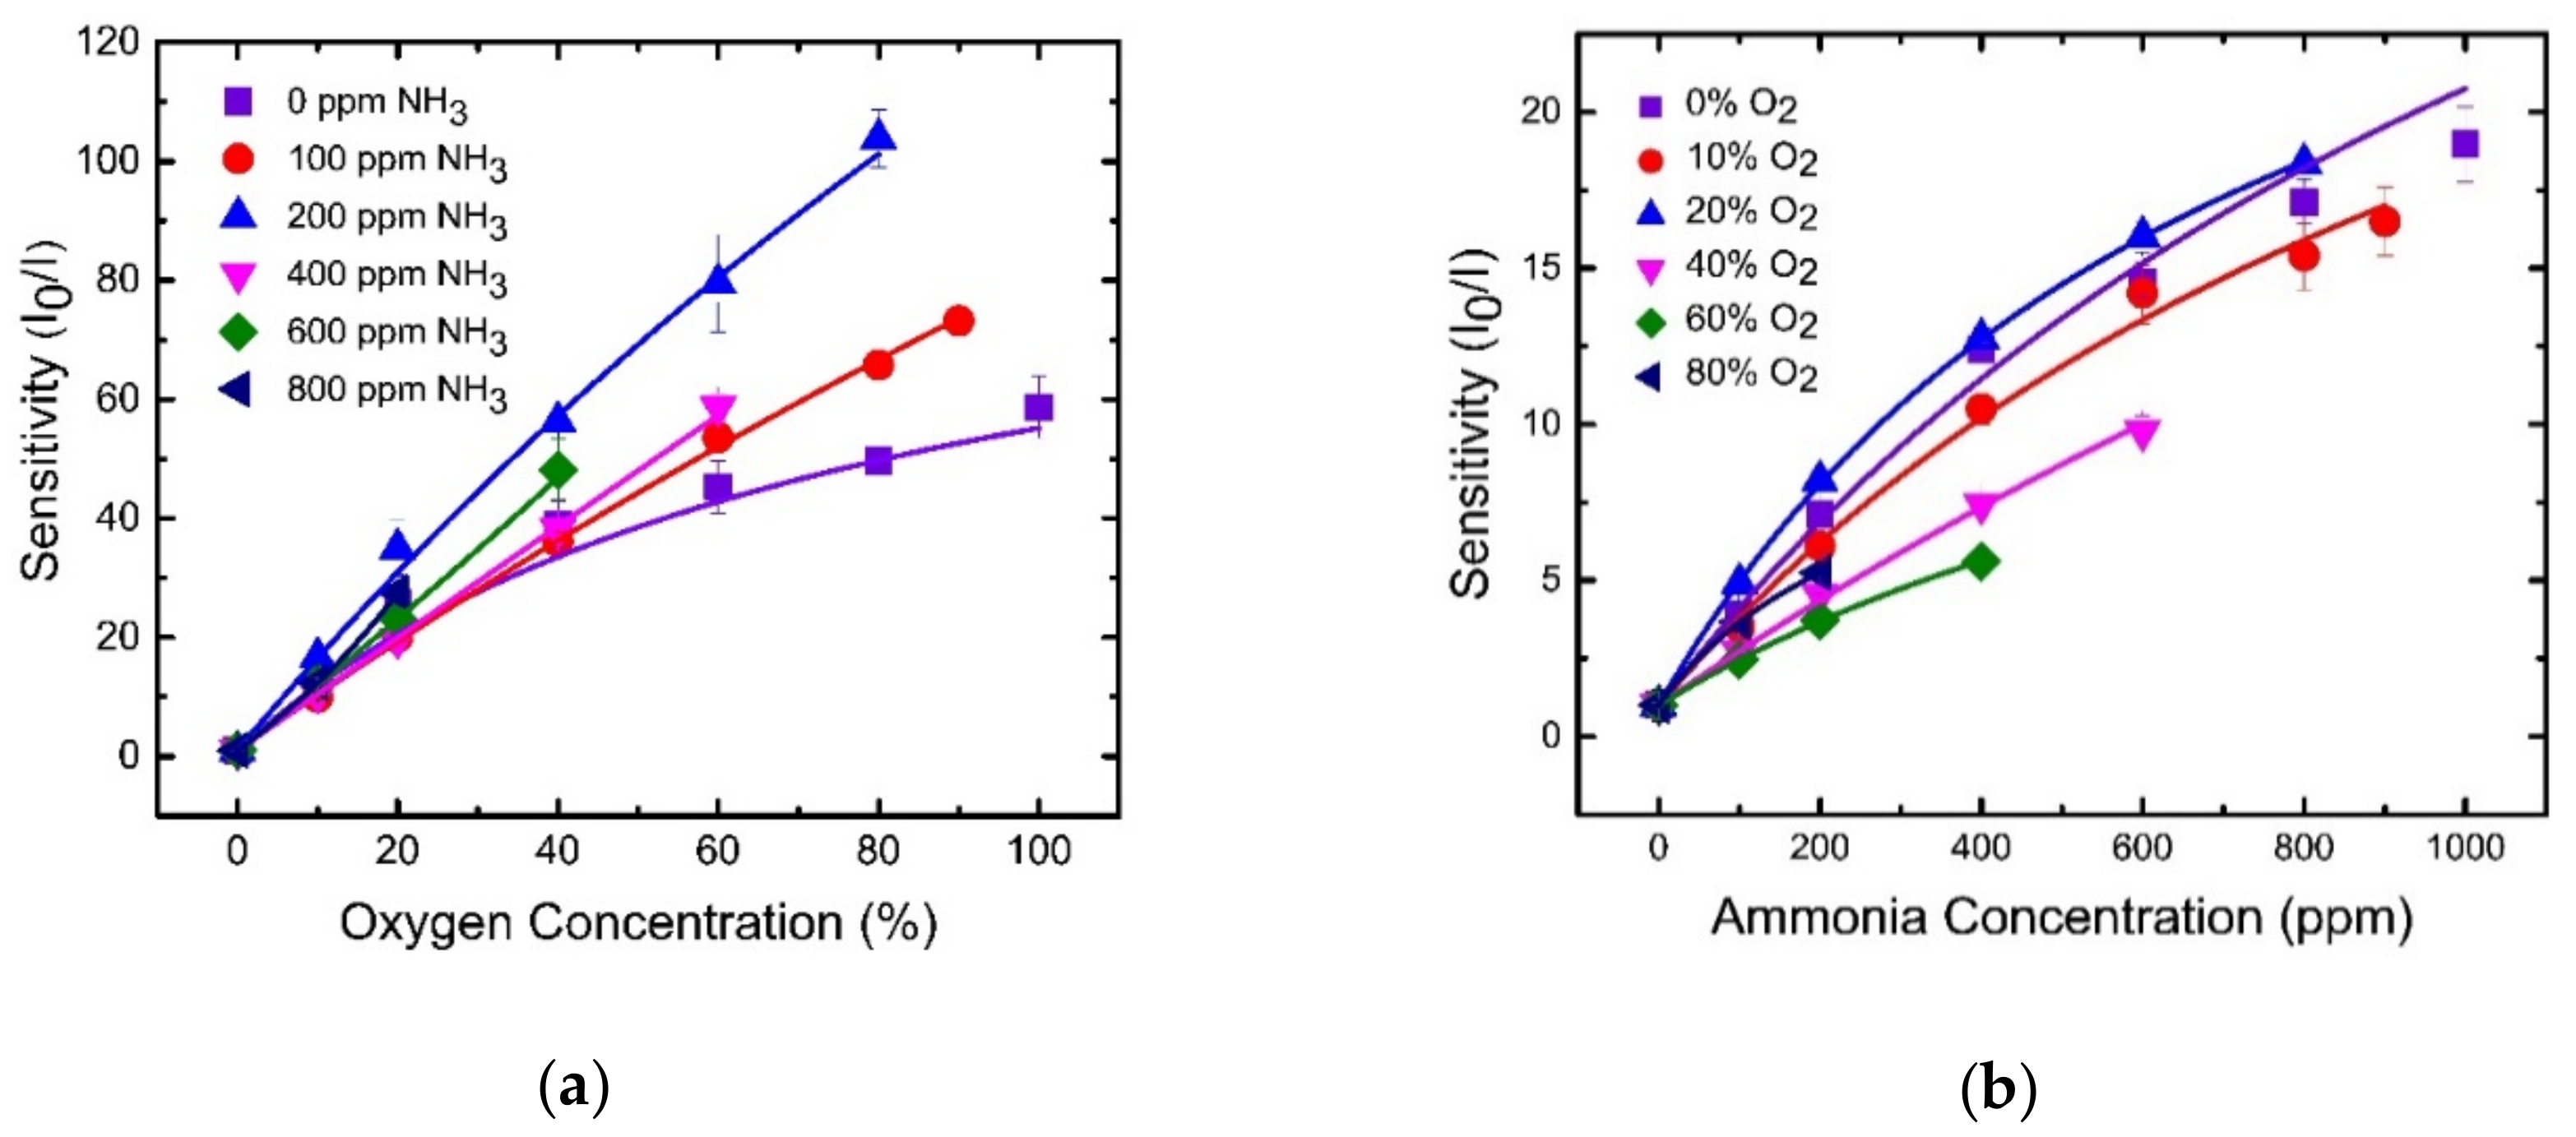
4.2. O2 Sensing Properties of Optical Dual Sensor

Figure 4a depicts the relative fluorescence spectra of the optical dual sensor at different oxygen concentrations. The dual sensor was excited by a 405 nm LED, and the fluorescence spectra was acquired by a spectrometer equipped with a CCD. The emission spectra of PtTFPP and eosin Y showed no (or minor) spectral overlap or crosstalk. It is obvious from Figure 4a that the emission spectrum of PtTFPP with a peak wavelength of 650 nm is highly sensitive to the concentration of O2. Interestingly, the emission spectrum of eosin Y was unaffected by the change of O2 concentration facilitating the unambiguous detection of NH3 in the presence of O2.
The Stern–Volmer plot for oxygen quenching in Figure 4b shows the relationship between oxygen concentration and the ratio of fluorescence intensities in the absence (I0) and presence (I) of oxygen. The plot shows downward curvature with increasing concentration ruling off the application of Equation (1). On the other hand, the plot could be described well by Equation (2) considering the emission of sensitive fluorophores leading to the best fitting. The corresponding fractional contributions and Stern–Volmer quenching constants extracted from the fitting are f = 0.98 and Ksv = 1.23 ppm−1, respectively. The maximum sensitivity to oxygen gas molecules achieved by our dual gas sensor is 60 at 100% oxygen environment.

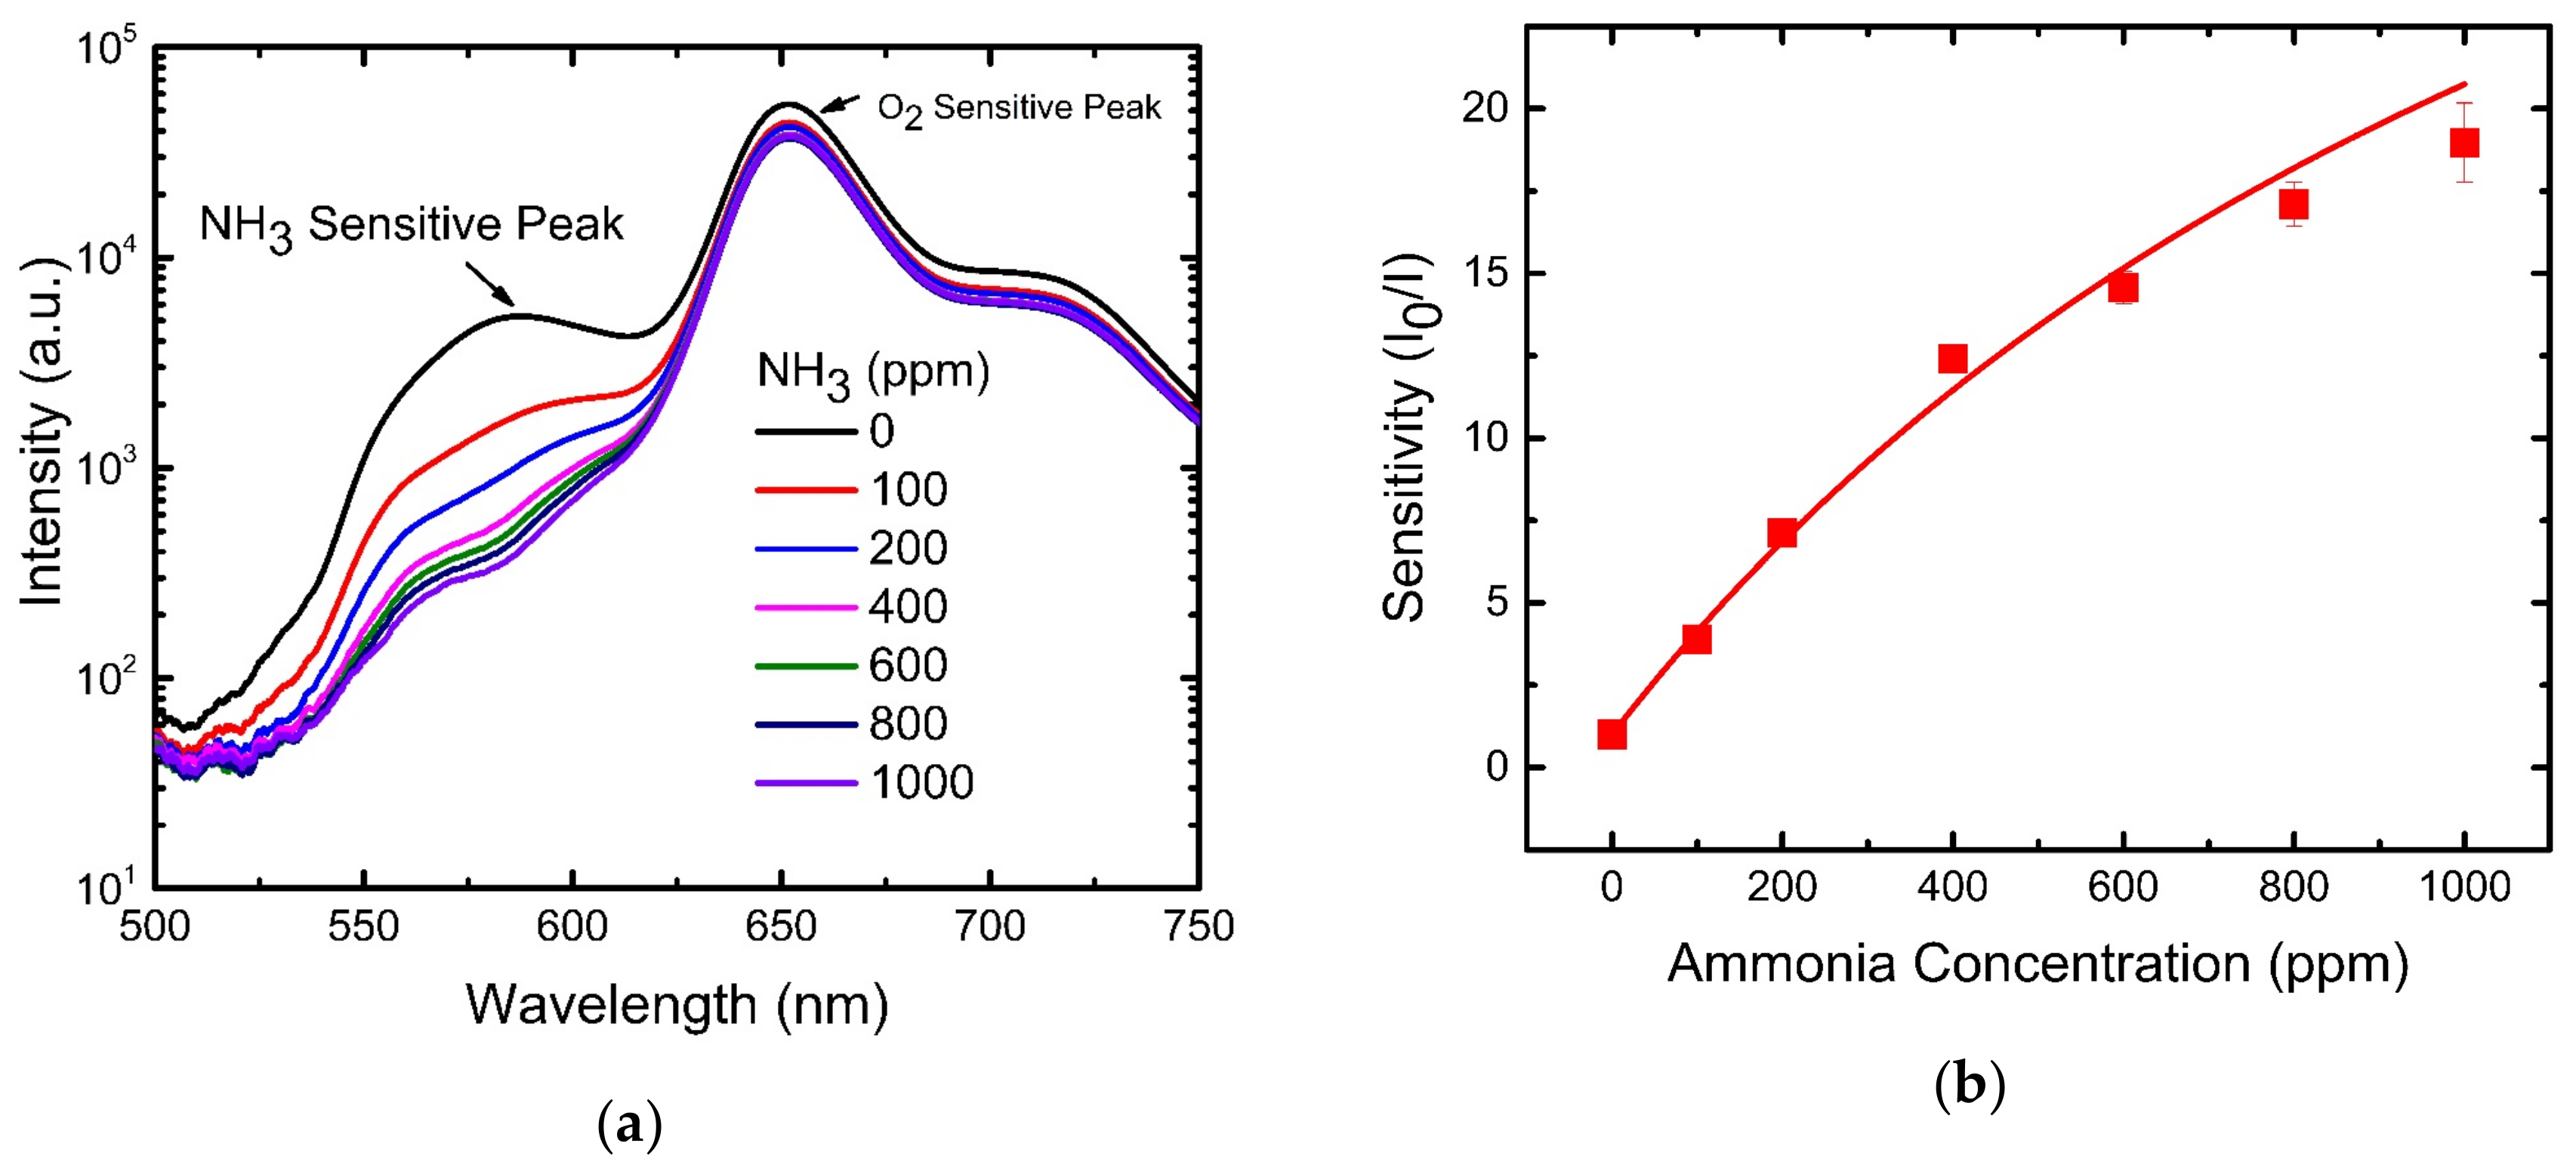
4.3. NH3 Sensing Properties of Optical Dual Sensor

Figure 5a presents the emission spectrum of eosin Y and PtTFPP with peak wavelengths at 582 nm and 650 nm, respectively. The observed fluorescence intensities at 582 nm and 650 nm decrease with the increase in the NH3 concentration. The change in the emission spectrum from PtTFPP is almost negligible compared to the change in the fluorescence of eosin Y at 582 nm with an increasing concentration of NH3 from 0 ppm to 1000 ppm.
The Stern–Volmer plot in Figure 5b also shows downward curvature, which is similar to the O2 sensing curve, and can also be described by Equation (2). The corresponding fractional contributions and Stern–Volmer quenching constants extracted from the best fitting are f = 0.98 and Ksv = 0.034 ppm−1, respectively. The maximum sensitivity to ammonia gas molecules achieved by our dual gas sensor is 20 in a 1000 ppm ammonia environment.

4.4. Photostability of Optical Dual Sensor

Photostability was tested by placing the optical dual sensor under a 405-nm wavelength pulse irradiated at room temperature in ambient light, and the change in fluorescence intensity was monitored. Figure 6 depicts that the relative fluorescence intensity of PtTFPP decreased by 0.05% and the relative fluorescence intensity of eosin Y decreased by 0.08% after continuous illumination for around 1 h in ambience. Neglecting the small changes under the experimental error, we may consider the optical dual sensor to be reasonably photostable over its operational time scale in the dual-sensor experiment.

4.5. Response Time of Optical Dual Sensor

The rapid response of a sensor is necessary for practical applications. Figure 7a demonstrates the typical dynamic response of the optical dual sensor for O2 sensing while switching between 100% N2 to 100% O2 gases with gradual steps of increasing O2 concentrations. O2 gas was turned on for 1 min until the fluorescence intensity quenched to a saturated value, and then N2 gas was released to recover the fluorescence. The optical O2 sensor shows the response time of 14 s by switching from N2 to O2 and the recovery time of 34 s by switching from O2 to N2. Similarly, Figure 7b illustrates the dynamic response of the optical NH3 sensor. The concentration of NH3 gas was increased stepwise at every 15-min interval of the recovery of fluorescence intensity under 100% N2 atmosphere. The sensor exhibited a longer response (measured 22 min) and recovery time (hours) compared to the oxygen sensor. Fast recovery could be achieved by heating the NH3-sensitive material at 70 °C for 80 min. Thus, the proposed optical dual sensor provides a fast enough response for practical applications.

4.6. Selectivity of Optical Dual Sensor

In most environmental and clinical situations, NH3 and O2 gases are present in a mixed form. Therefore, to estimate the concentration of individual gas components accurately, the dual sensor should not suffer from cross-sensitivity. To address the cross-sensitivity effect, we measured the spectral response of our proposed dual sensor at various mixtures of NH3 and O2 with different ratios. The spectral response (Figure 8a) of the dual sensor at different O2 concentrations in an ammonia environment fixed at 200 ppm is selectively sensitive to the O2 gas in the gas mixtures, i.e., the fluorescence of the ammonia-sensitive molecules is not affected with the change in O2 concentrations. On the other hand, the spectral response (Figure 8b) of the dual sensor at different NH3 concentrations in an environment of 40% O2 shows severe cross-sensitivity. It is obvious from the spectra that both the peaks that are individually responsible for NH3 and O2 sensing influence each other to some extent; in other words, we observe a spectral overlap or crosstalk in between the NH3 and O2-sensing signals.
To resolve this issue and to extract the data with better accuracy, we fitted the spectra with a Gaussian profile and extracted the intensity of the individual peak, as depicted in Figure 9 for an example. Figure 9 shows an emission spectrum (black line) of the dual sensor in an environment of 10% O2 and 100 ppm NH3. A Gaussian fitting (pink line) of this spectrum generates four individual peaks (red, light green, blue, and light blue lines) after decomposition, wherefrom we could estimate the peak intensities at 582 nm (peak 1) and at 650 nm (peak 3) for NH3 and O2 sensing respectively without any ambiguity. This method was employed to all the spectra for estimation of the corresponding peak intensity.
Finally, for practical applications, the calibration curves for a dual sensor influenced by the cross-sensitivity effect were plotted as presented in Figure 10. The figures reveal a negligible cross-sensitivity effect at lower O2 concentrations (below 20%) and NH3 concentrations (below 200 ppm), whereas they reveal non-negligible cross-sensitivity at higher concentrations of O2 and NH3 gases.

5. Conclusions

This work presents a novel optical sensor for the dual sensing of oxygen and ammonia concentrations based on sensing materials coated on a glass substrate. The optical dual sensor was fabricated using PtTFPP and eosin Y as the fluorescent indicators for oxygen and ammonia, respectively. It has been shown that the sensitivities of the oxygen and ammonia sensors are 60 and 20 respectively in an oxygen–ammonia mixed chamber. The response and recovery time for oxygen sensing are in seconds (14 s and 34 s, respectively), while these are in minutes (22 min) and hours respectively for ammonia sensing. The proposed dual gas sensor is highly reproducible and regenerative to sense the gases for multiple times. The optical dual sensor developed in this study enables the simultaneous sensing of oxygen and ammonia concentrations effectively and could find practical applications in various fields, including medical and industrial sections.

Author Contributions

Conceptualization, S.B.; Data curation, A.S.S. and M.D.; Formal analysis, S.B.; Funding acquisition, S.B.; Investigation, S.B.; Methodology, A.S.S. and M.D.; Project administration, S.B.; Supervision, S.B.; Visualization, A.S.S.; Writing—original draft, M.D.; Writing—review and editing, S.B.

Funding

This research was funded by Ministry of Science and Technology of Taiwan grant number under Grant No. MOST 107-2221-E-131 -029 -MY2, 106-2221-E-131-027.

Acknowledgments

S. Biring gratefully acknowledges the financial support from the Ministry of Science and Technology of Taiwan under Grant No. MOST 107-2221-E-131 -029 -MY2, 106-2221-E-131-027. S. Biring is highly thankful to Cheng-Shane Chu, Ming Chi University of Technology, Taiwan for critical discussions and laboratory facilities.

Conflicts of Interest

The authors declare no conflict of interest. The funders had no role in the design of the study; in the collection, analyses, or interpretation of data; in the writing of the manuscript, or in the decision to publish the results.

References

  1. Wolfbeis, O.S. Materials for fluorescence-based optical chemical sensors. J. Mater. Chem. 2005, 15, 2657–2669. [Google Scholar] [CrossRef]
  2. Amao, Y.; Miyashita, T.; Okura, I. Platinum tetrakis (pentafluorophenyl) porphyrin immobilized in polytrifluoroethylmethacrylate film as a photostable optical oxygen detection material. J. Fluor. Chem. 2001, 107, 101–106. [Google Scholar] [CrossRef]
  3. Chu, C.S.; Syu, J.J. Optical sensor for dual sensing of oxygen and carbon dioxide based on sensing films coated on filter paper. Appl. Opt. 2017, 56, 1225–1231. [Google Scholar] [CrossRef] [PubMed]
  4. Yeh, T.S.; Chu, C.S.; Lo, Y.L. Highly sensitive optical fiber oxygen sensor using Pt(II) complex embedded in sol-gel matrices. Sens. Actuators B Chem. 2006, 119, 701–707. [Google Scholar] [CrossRef]
  5. Chu, C.S.; Lo, Y.L. High-performance fiber-optic oxygen sensors based on fluorinated xerogels doped with Pt(II) complexes. Sens. Actuators B Chem. 2007, 124, 376–382. [Google Scholar] [CrossRef]
  6. Basu, B.J. Optical oxygen sensing based on luminescence quenching of platinum porphyrin dyes doped in ormosil coatings. Sens. Actuators B Chem. 2007, 123, 568–577. [Google Scholar] [CrossRef]
  7. Chu, C.S.; Lo, Y.L.; Sung, T.W. Enhanced oxygen sensing properties of Pt(II) complex and dye entrapped core-shell silica nanoparticles embedded in sol-gel matrix. Talanta 2010, 82, 1044–1051. [Google Scholar] [CrossRef] [PubMed]
  8. Chu, C.S.; Lo, Y.L. Highly sensitive and linear calibration optical fiber oxygen sensor based on Pt(II) complex embedded in sol-gel matrix. Sens. Actuators B Chem. 2011, 155, 53–57. [Google Scholar] [CrossRef]
  9. Elosua, C.; de Acha, N.; Hernaez, M.; Matias, I.R.; Arregui, F.J. Layer-by-Layer assembly of a water-insoluble platinum complex for optical fiber oxygen sensors. Sens. Actuators B Chem. 2015, 207, 683–689. [Google Scholar] [CrossRef]
  10. Timmer, B.; Olthuis, W.; Berg, A.V.D. Ammonia sensors and their applications—A review. Sens. Actuators B Chem. 2005, 107, 666–667. [Google Scholar] [CrossRef]
  11. Damink, S.W.M.O.; Deutz, N.E.P.; Dejong, C.H.C.; Soeter, P.B.; Jalan, R. Interorgan ammonia metabolism in liver failure. Neurochem. Int. 2002, 41, 177–188. [Google Scholar] [CrossRef]
  12. Cohen, B.I. The significance of ammonia/gamma-aminobutyric acid (GABA) ratio for normality and liver disorders. Med. Hyphothess 2002, 59, 757–758. [Google Scholar] [CrossRef]
  13. Ryer-Powder, J.E. Health effects of ammonia. Plant/Oper. Prog. 1991, 10, 228–232. [Google Scholar] [CrossRef]
  14. Takagai, Y.; Nojiri, Y.; Takase, T.; Hinze, W.L.; Butsugan, M.; Igarashi, S. “Turn-on” fluorescent polymeric microparticle sensors for the determination of ammonia and amines in the vapor state. Analyst 2010, 135, 1417–1425. [Google Scholar] [CrossRef] [PubMed]
  15. Vaughan, A.A.; Baron, M.G.; Narayanaswamy, R. Optical ammonia sensing films based on an immobilized metalloporphyrin. Anal. Commun. 1996, 33, 393–396. [Google Scholar] [CrossRef]
  16. Sung, T.W.; Lo, Y.L. Ammonia vapor sensor based on CdSe/SiO2 core-shell nanoparticles embedded in sol-gel matrix. Sens. Actuators B Chem. 2013, 188, 702–708. [Google Scholar] [CrossRef]
  17. Castillero, P.; Roales, J.; Lopes-Costa, T.; Sanchez-Valencia, J.R.; Barranco, A.; Gonzalez-Elip, A.R.; Pedrosa, J.M. Optical gas sensing of ammonia and amines based on protonated porphyrin/TiO2 composite thin film. Sensors 2017, 17, 24. [Google Scholar] [CrossRef] [PubMed]
  18. Peng, L.R.; Yang, X.H.; Yuan, L.B.; Wang, L.L.; Zhao, E.M.; Tian, F.J.; Liu, Y.X. Gaseous ammonia fluorescence probe based on cellulose acetate modified microstructured optical fiber. Opt. Commun. 2011, 284, 4810–4814. [Google Scholar] [CrossRef]
  19. Lakowicz, J.R. Principles of Fluorescence Spectroscopy, 3rd ed.; Springer: New York, NY, USA, 2006. [Google Scholar]
  20. Carraway, E.R.; Demas, J.N.; DeGraff, B.A. Luminescence quenching mechanism for microheterogeneous systems. Anal. Chem. 1991, 63, 332–336. [Google Scholar] [CrossRef]
Figure 1. Schematic structure of the NH3–O2 dual gas sensor.
Sensors 19 05124 g001
Figure 2. Experimental setup for optical dual sensor system.
Sensors 19 05124 g002
Figure 3. Absorption (green-colored) and fluorescence (pink-colored) spectra of the sensing materials used in the optical dual sensor. Absorption and fluorescence spectra were captured from individual materials. The blue curve represents the spectrum of excitation light source (LED).
Sensors 19 05124 g003
Figure 4. (a) Emission spectra (semi-log plot) of optical dual sensors at different oxygen concentrations (NH3-free environment) (b) Stern–Volmer plot for oxygen sensing.
Sensors 19 05124 g004
Figure 5. (a) Emission spectra (semi-log scale) from optical dual sensor at different ammonia concentrations (oxygen-free environment). (b) Stern–Volmer plot for ammonia sensing.
Sensors 19 05124 g005
Figure 6. Photostability of optical dual sensor.
Sensors 19 05124 g006
Figure 7. Dynamic response of dual sensor while switching alternatively from (a) 100% N2 to 100% O2 and (b) 100% N2 to 1000 ppm NH3 in gradual increasing steps of concentrations.
Sensors 19 05124 g007
Figure 8. (a) O2-dependent emission spectra of optical dual sensor at 200 ppm NH3 concentration. Sensitivity plot at different oxygen concentrations for several fixed ammonia concentrations. (b) NH3-dependent emission spectra of optical dual sensor at 40% O2 concentration.
Sensors 19 05124 g008
Figure 9. Gaussian fitting and decomposition of peaks for a spectrum acquired at 10% O2 and 100 ppm NH3 atmosphere.
Sensors 19 05124 g009
Figure 10. Cross-sensitivity data for O2 and NH3. (a) Sensitivity plot at different oxygen concentrations for several fixed ammonia concentrations. (b) Sensitivity plot at different ammonia concentrations for several fixed oxygen concentrations.
Sensors 19 05124 g010

