Sensing Properties of Fused Silica Single-Mode Optical Fibers Based on PPP-BOTDA in High-Temperature Fields


Abstract
:1. Introduction
2. Monitoring Principle of PPP-BOTDA
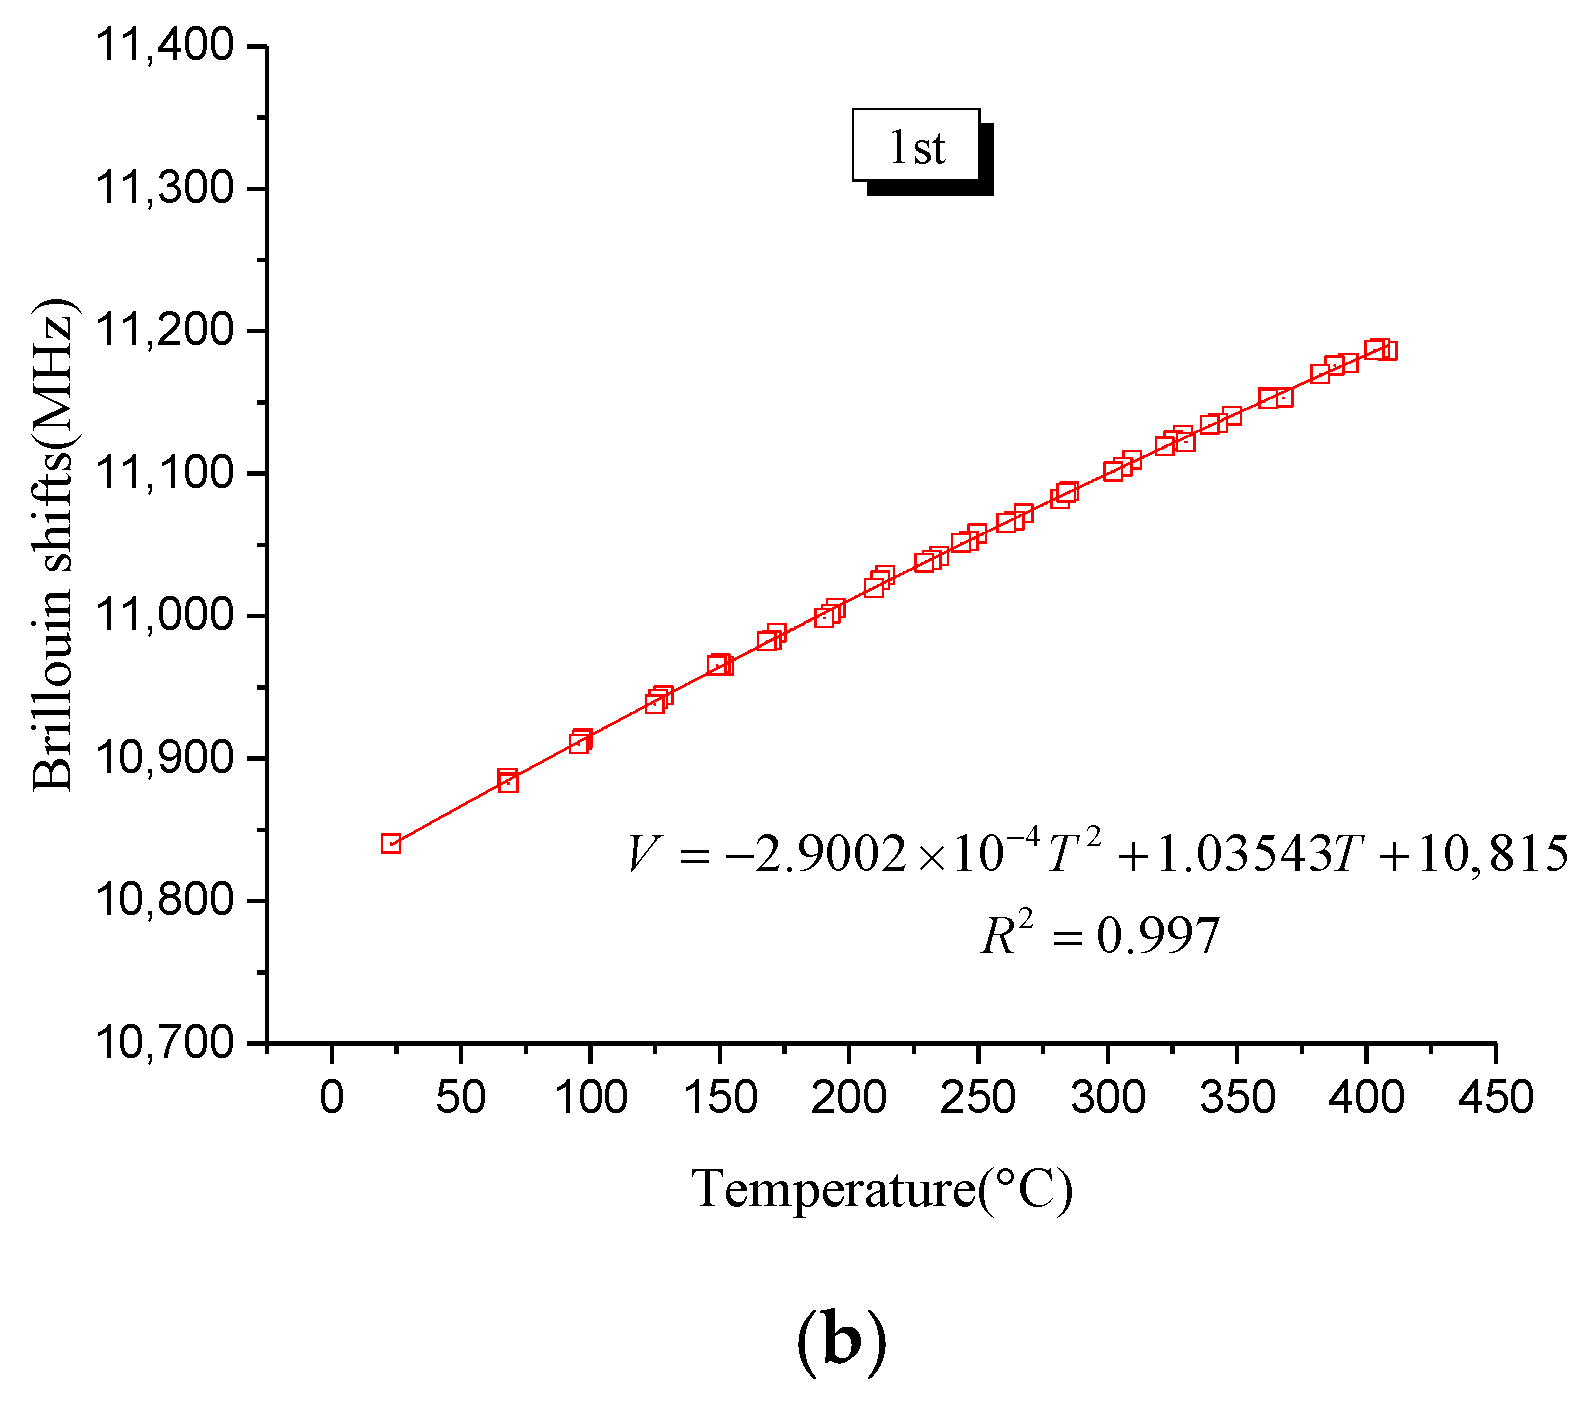
3. Temperature-Sensing Properties in the High-Temperature Field
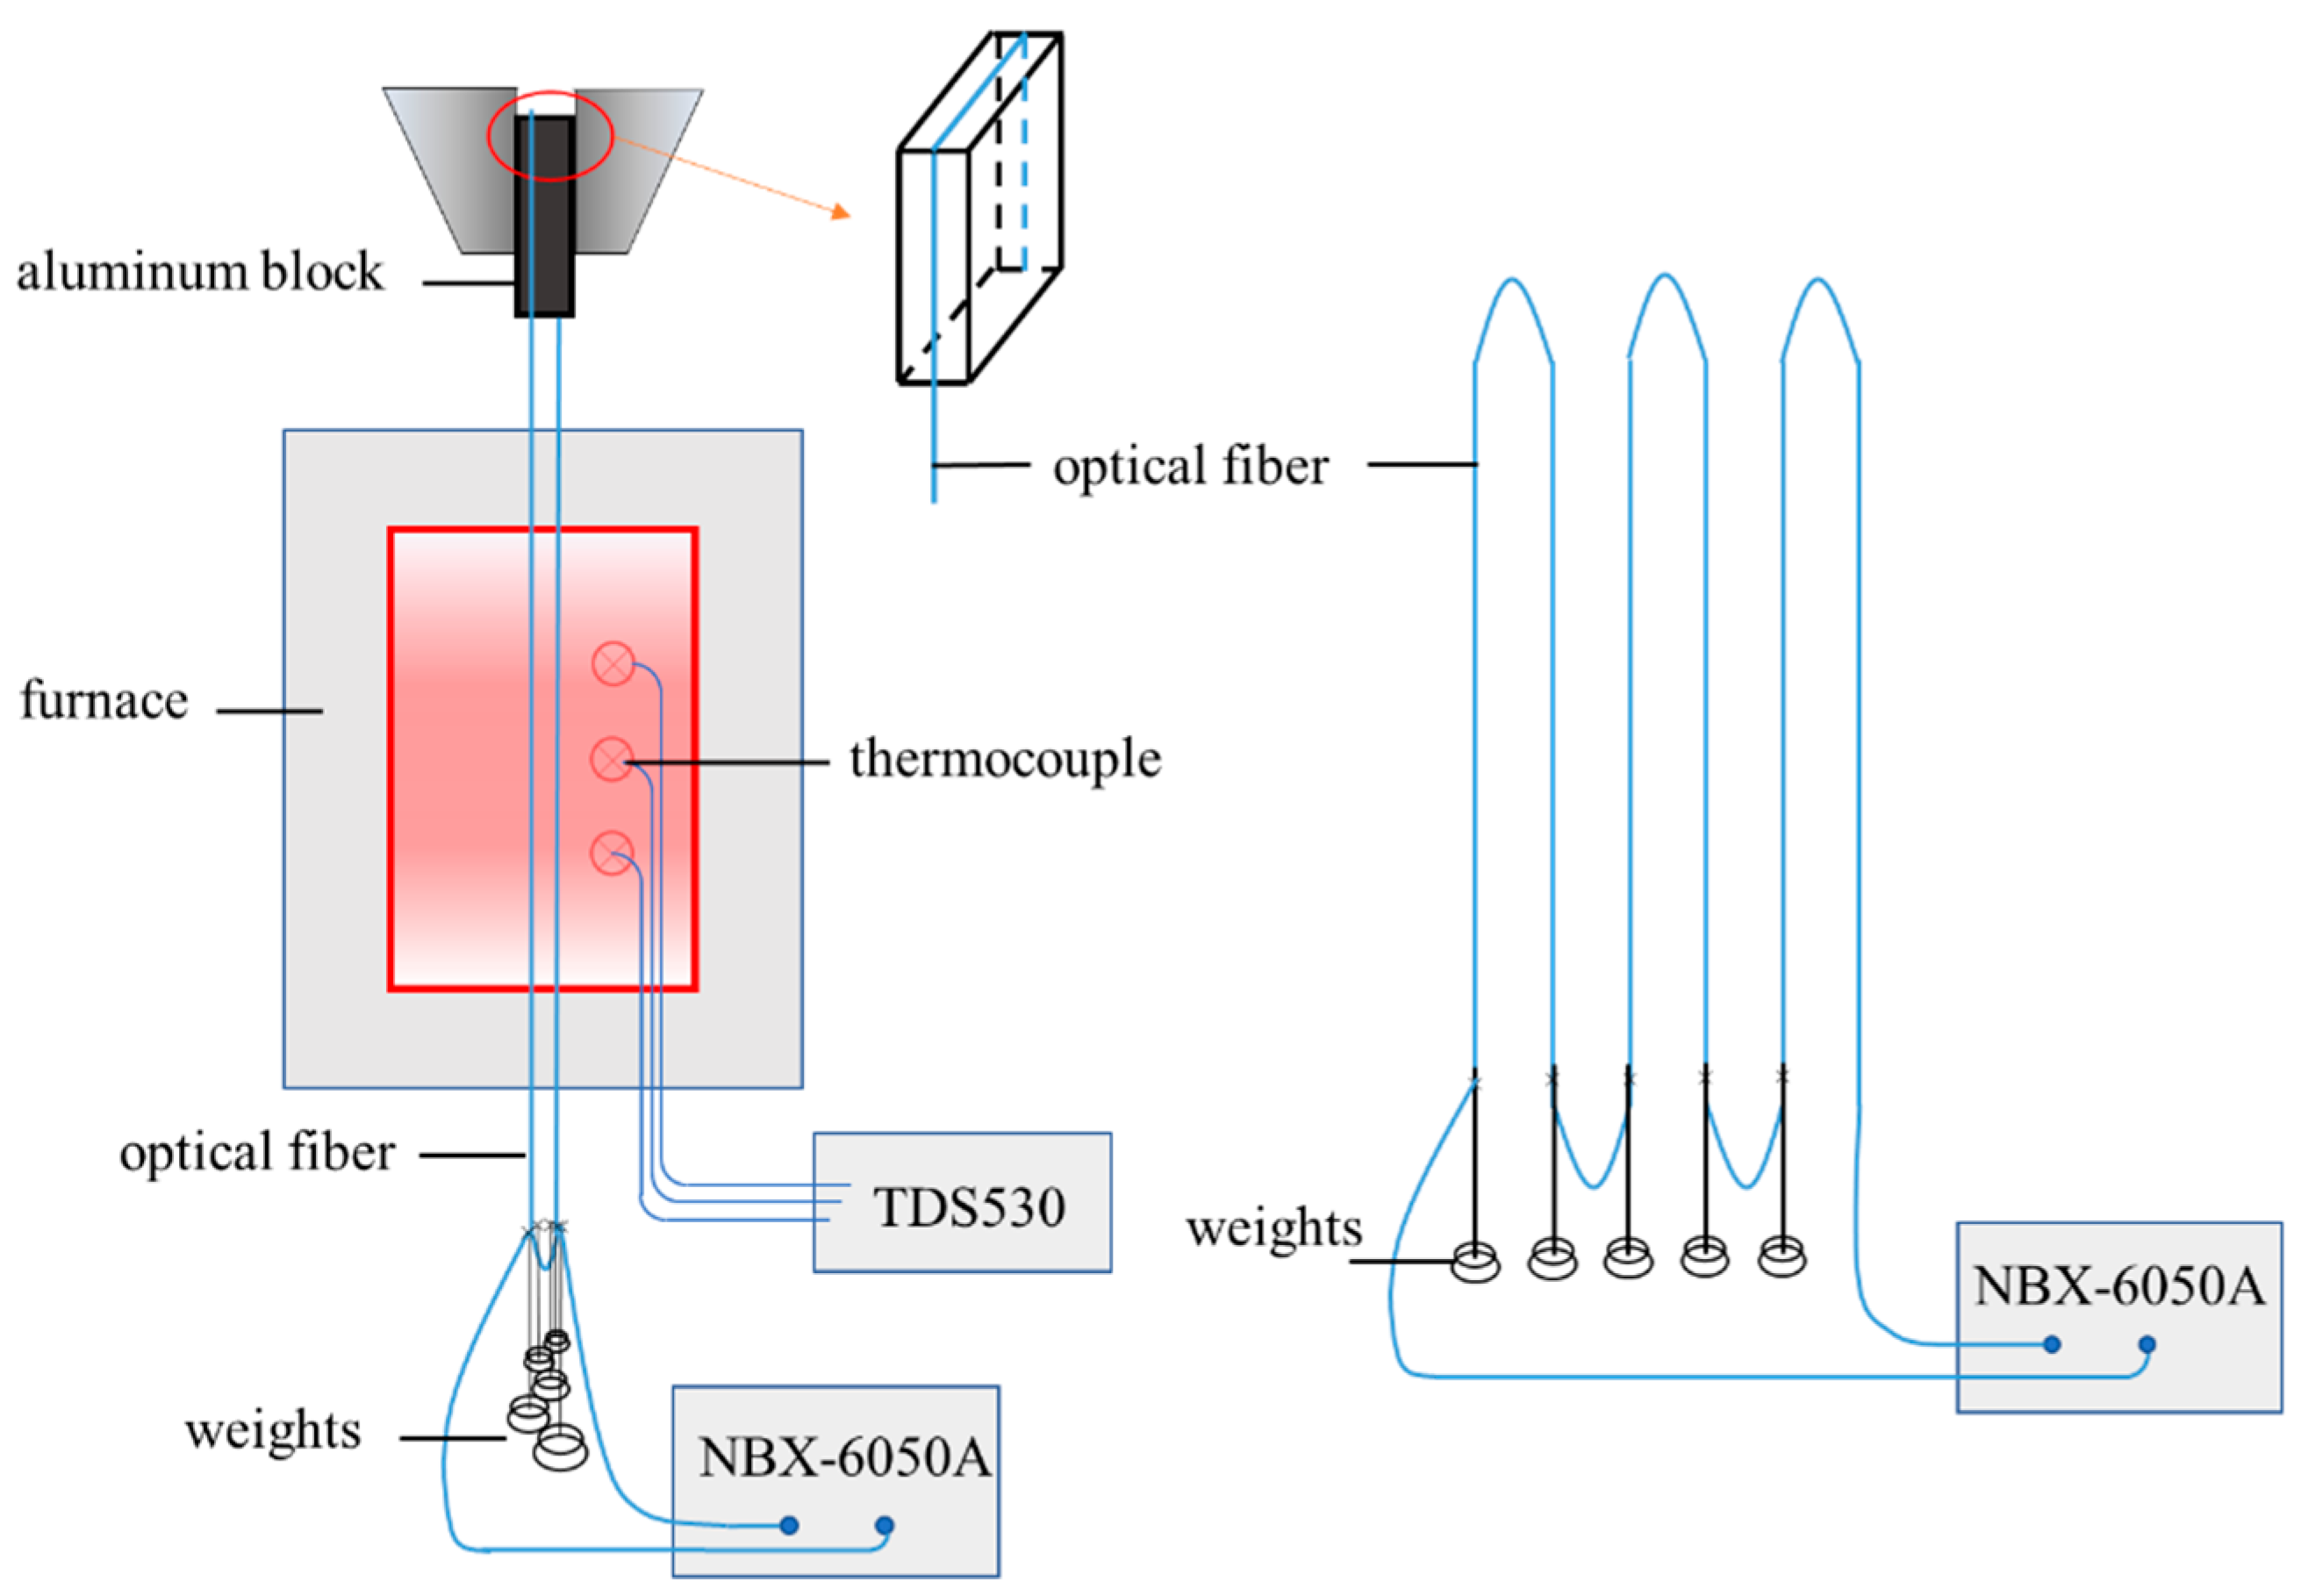
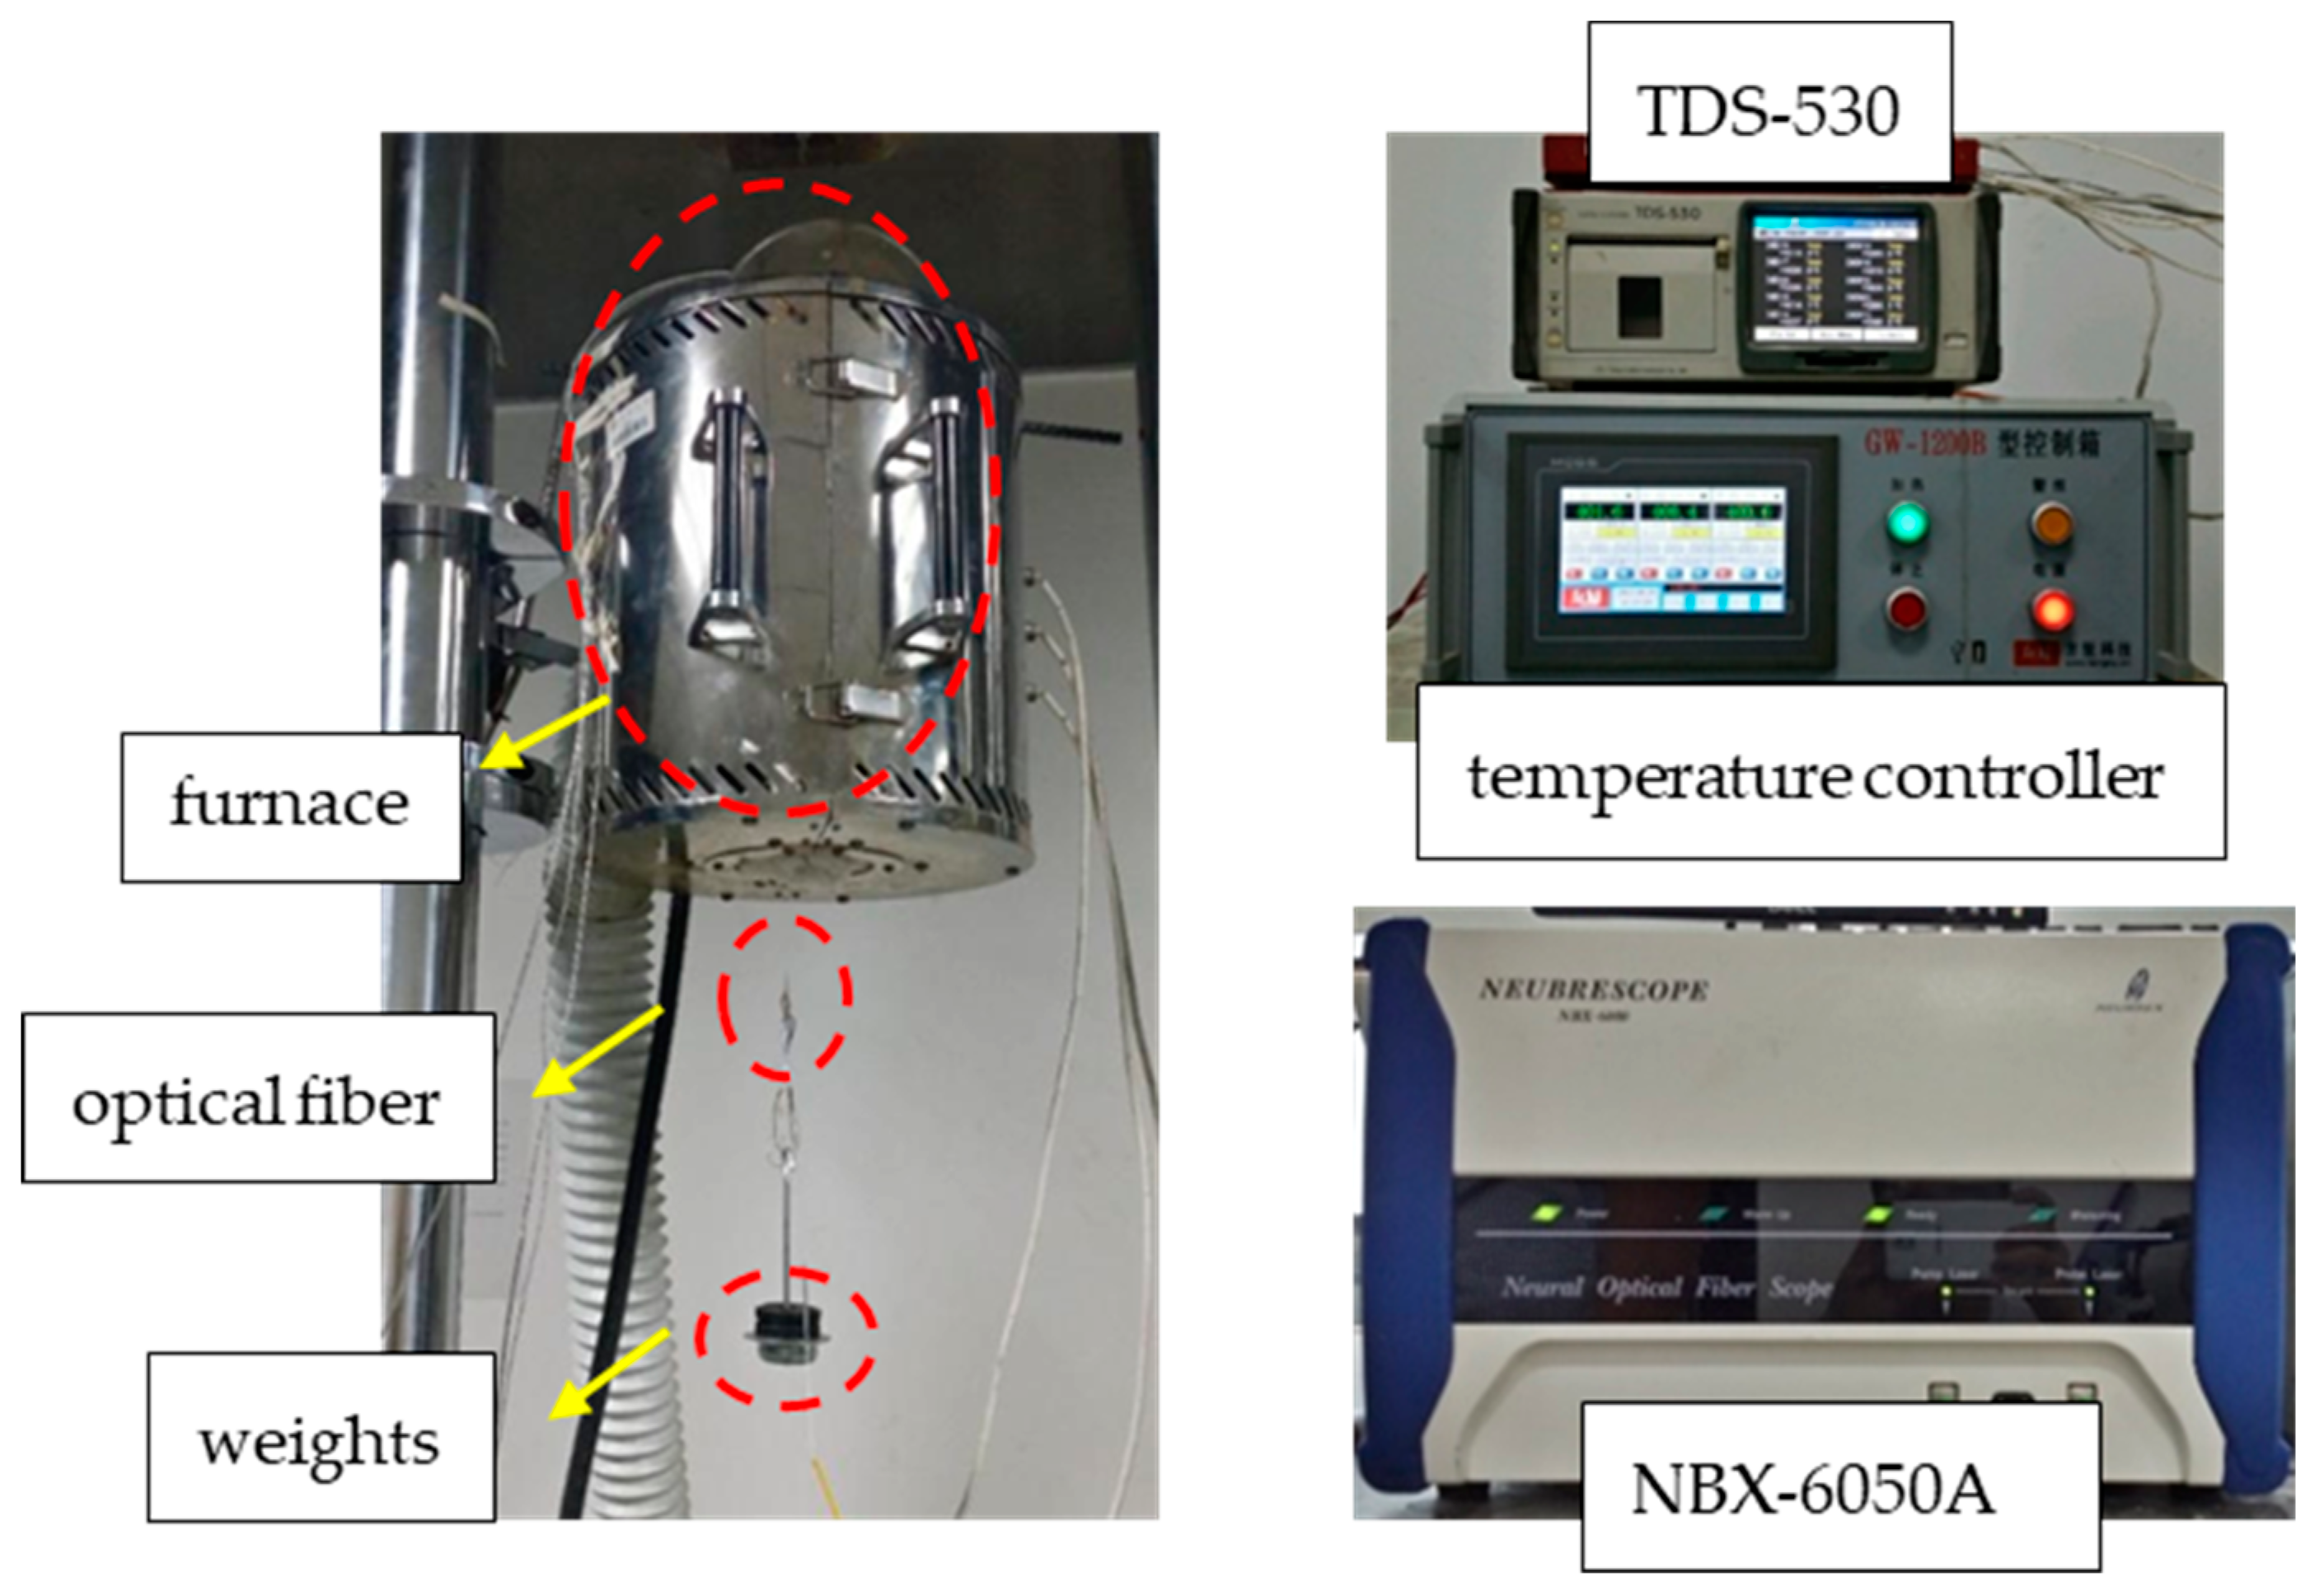
3.1. Experimental Program
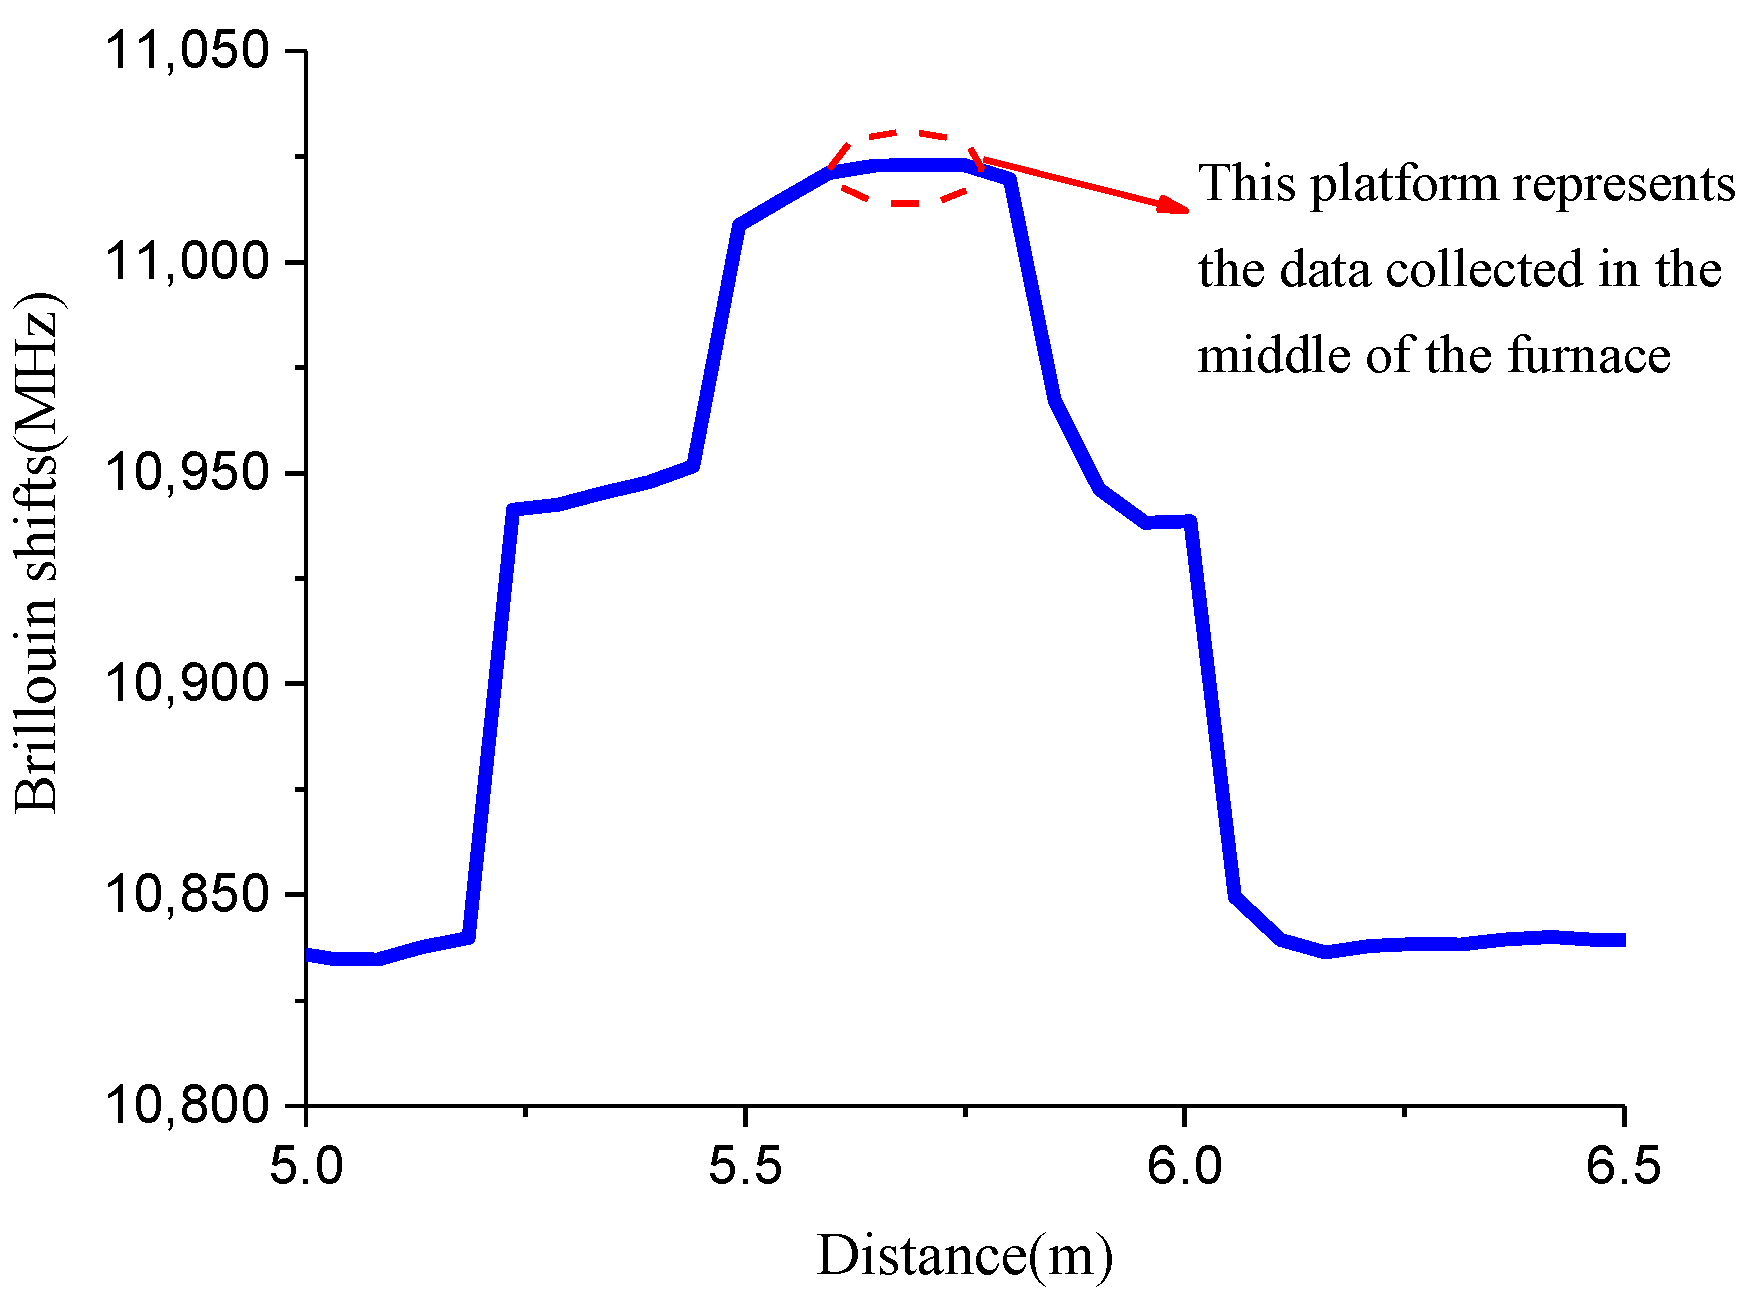
3.2. Experimental Results
3.2.1. Initial Strain Levels in the Range of 0–2500 με
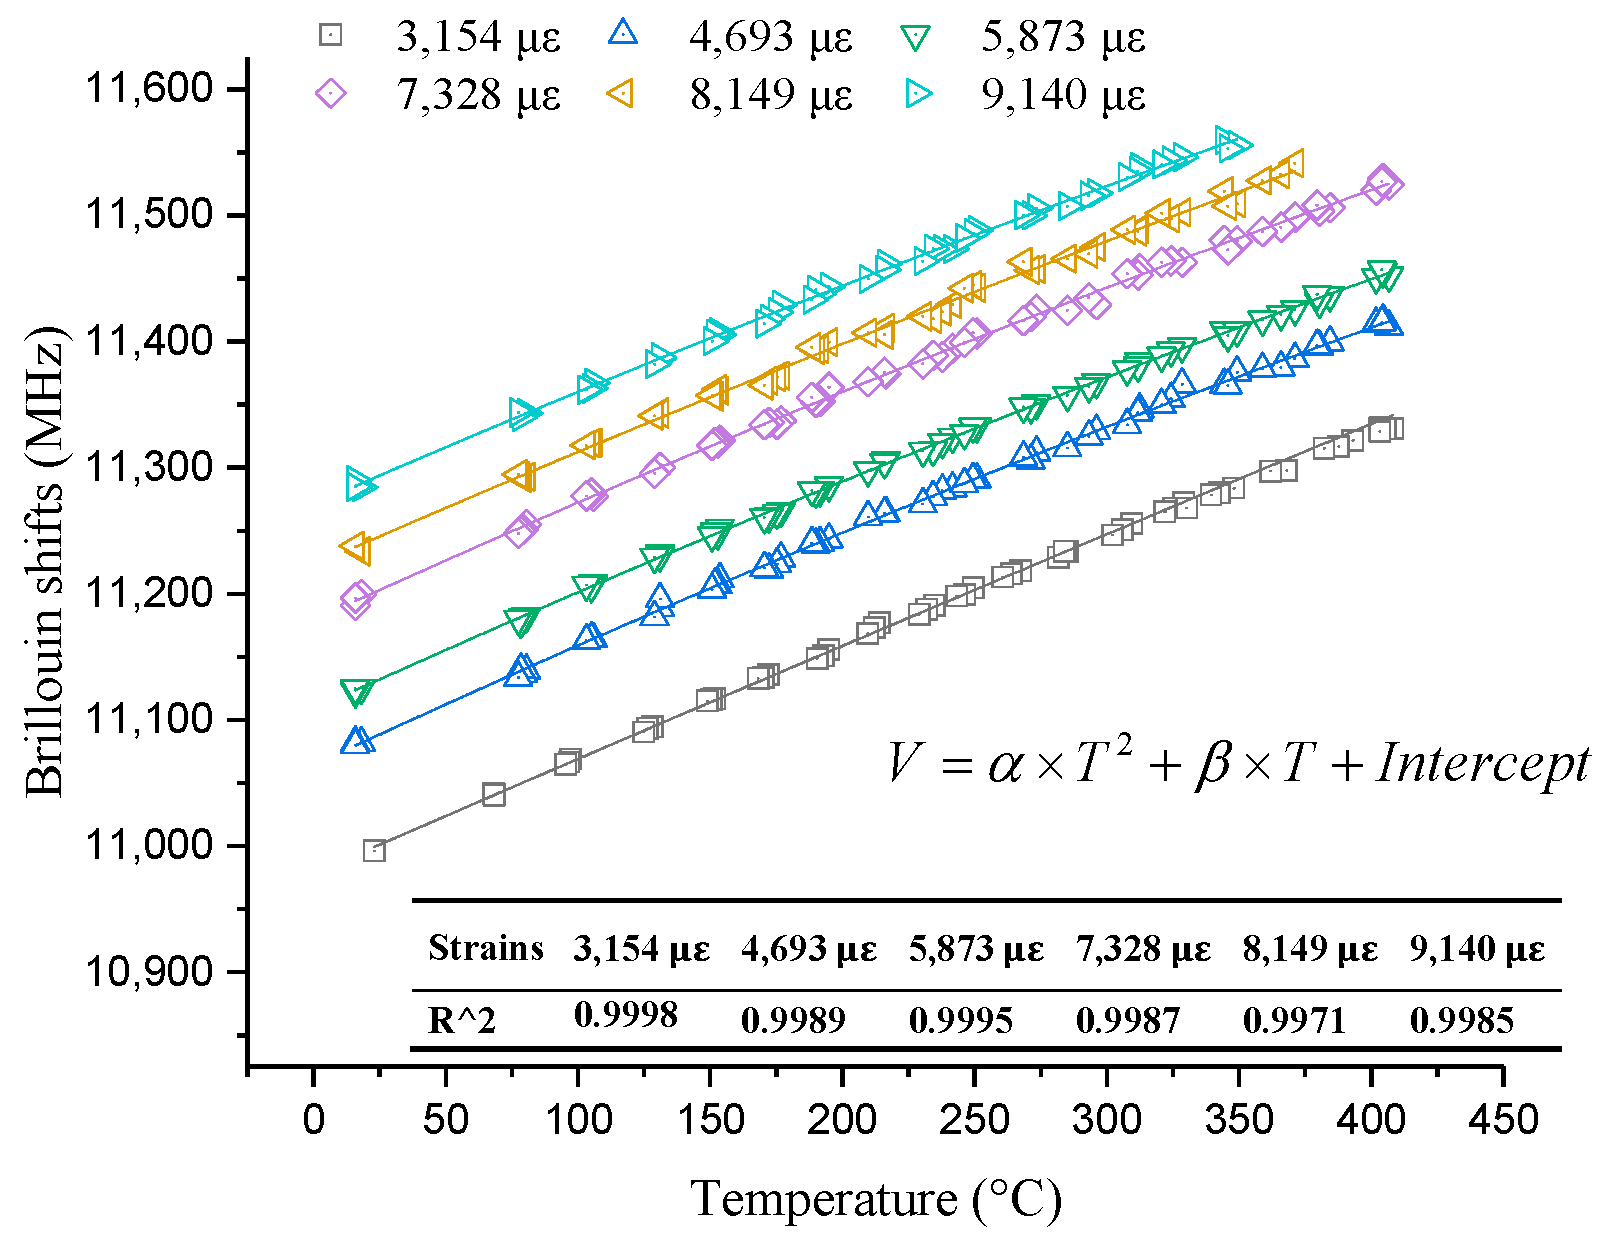
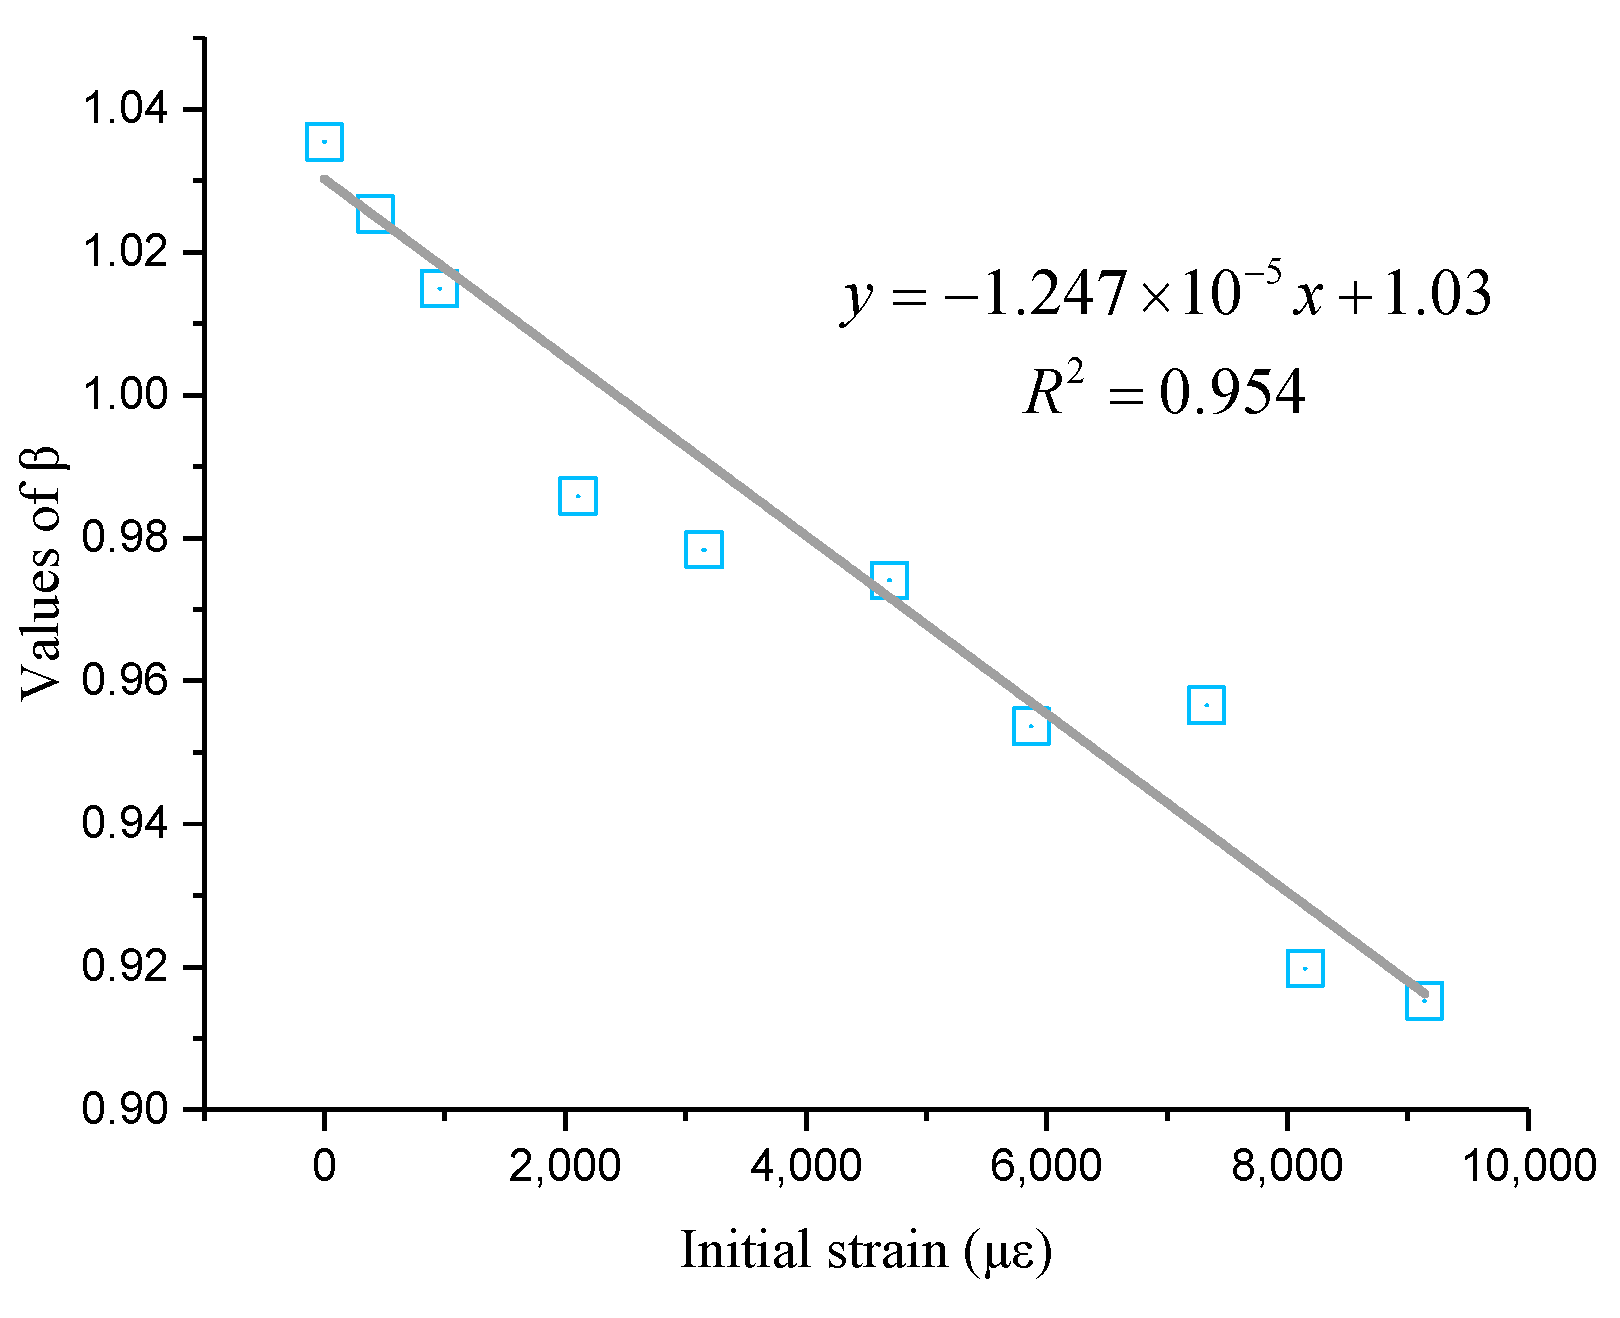
3.2.2. Initial Strain in the Range of 2500–9000 με
3.2.3. Analysis of Accuracy
3.3. Discussion
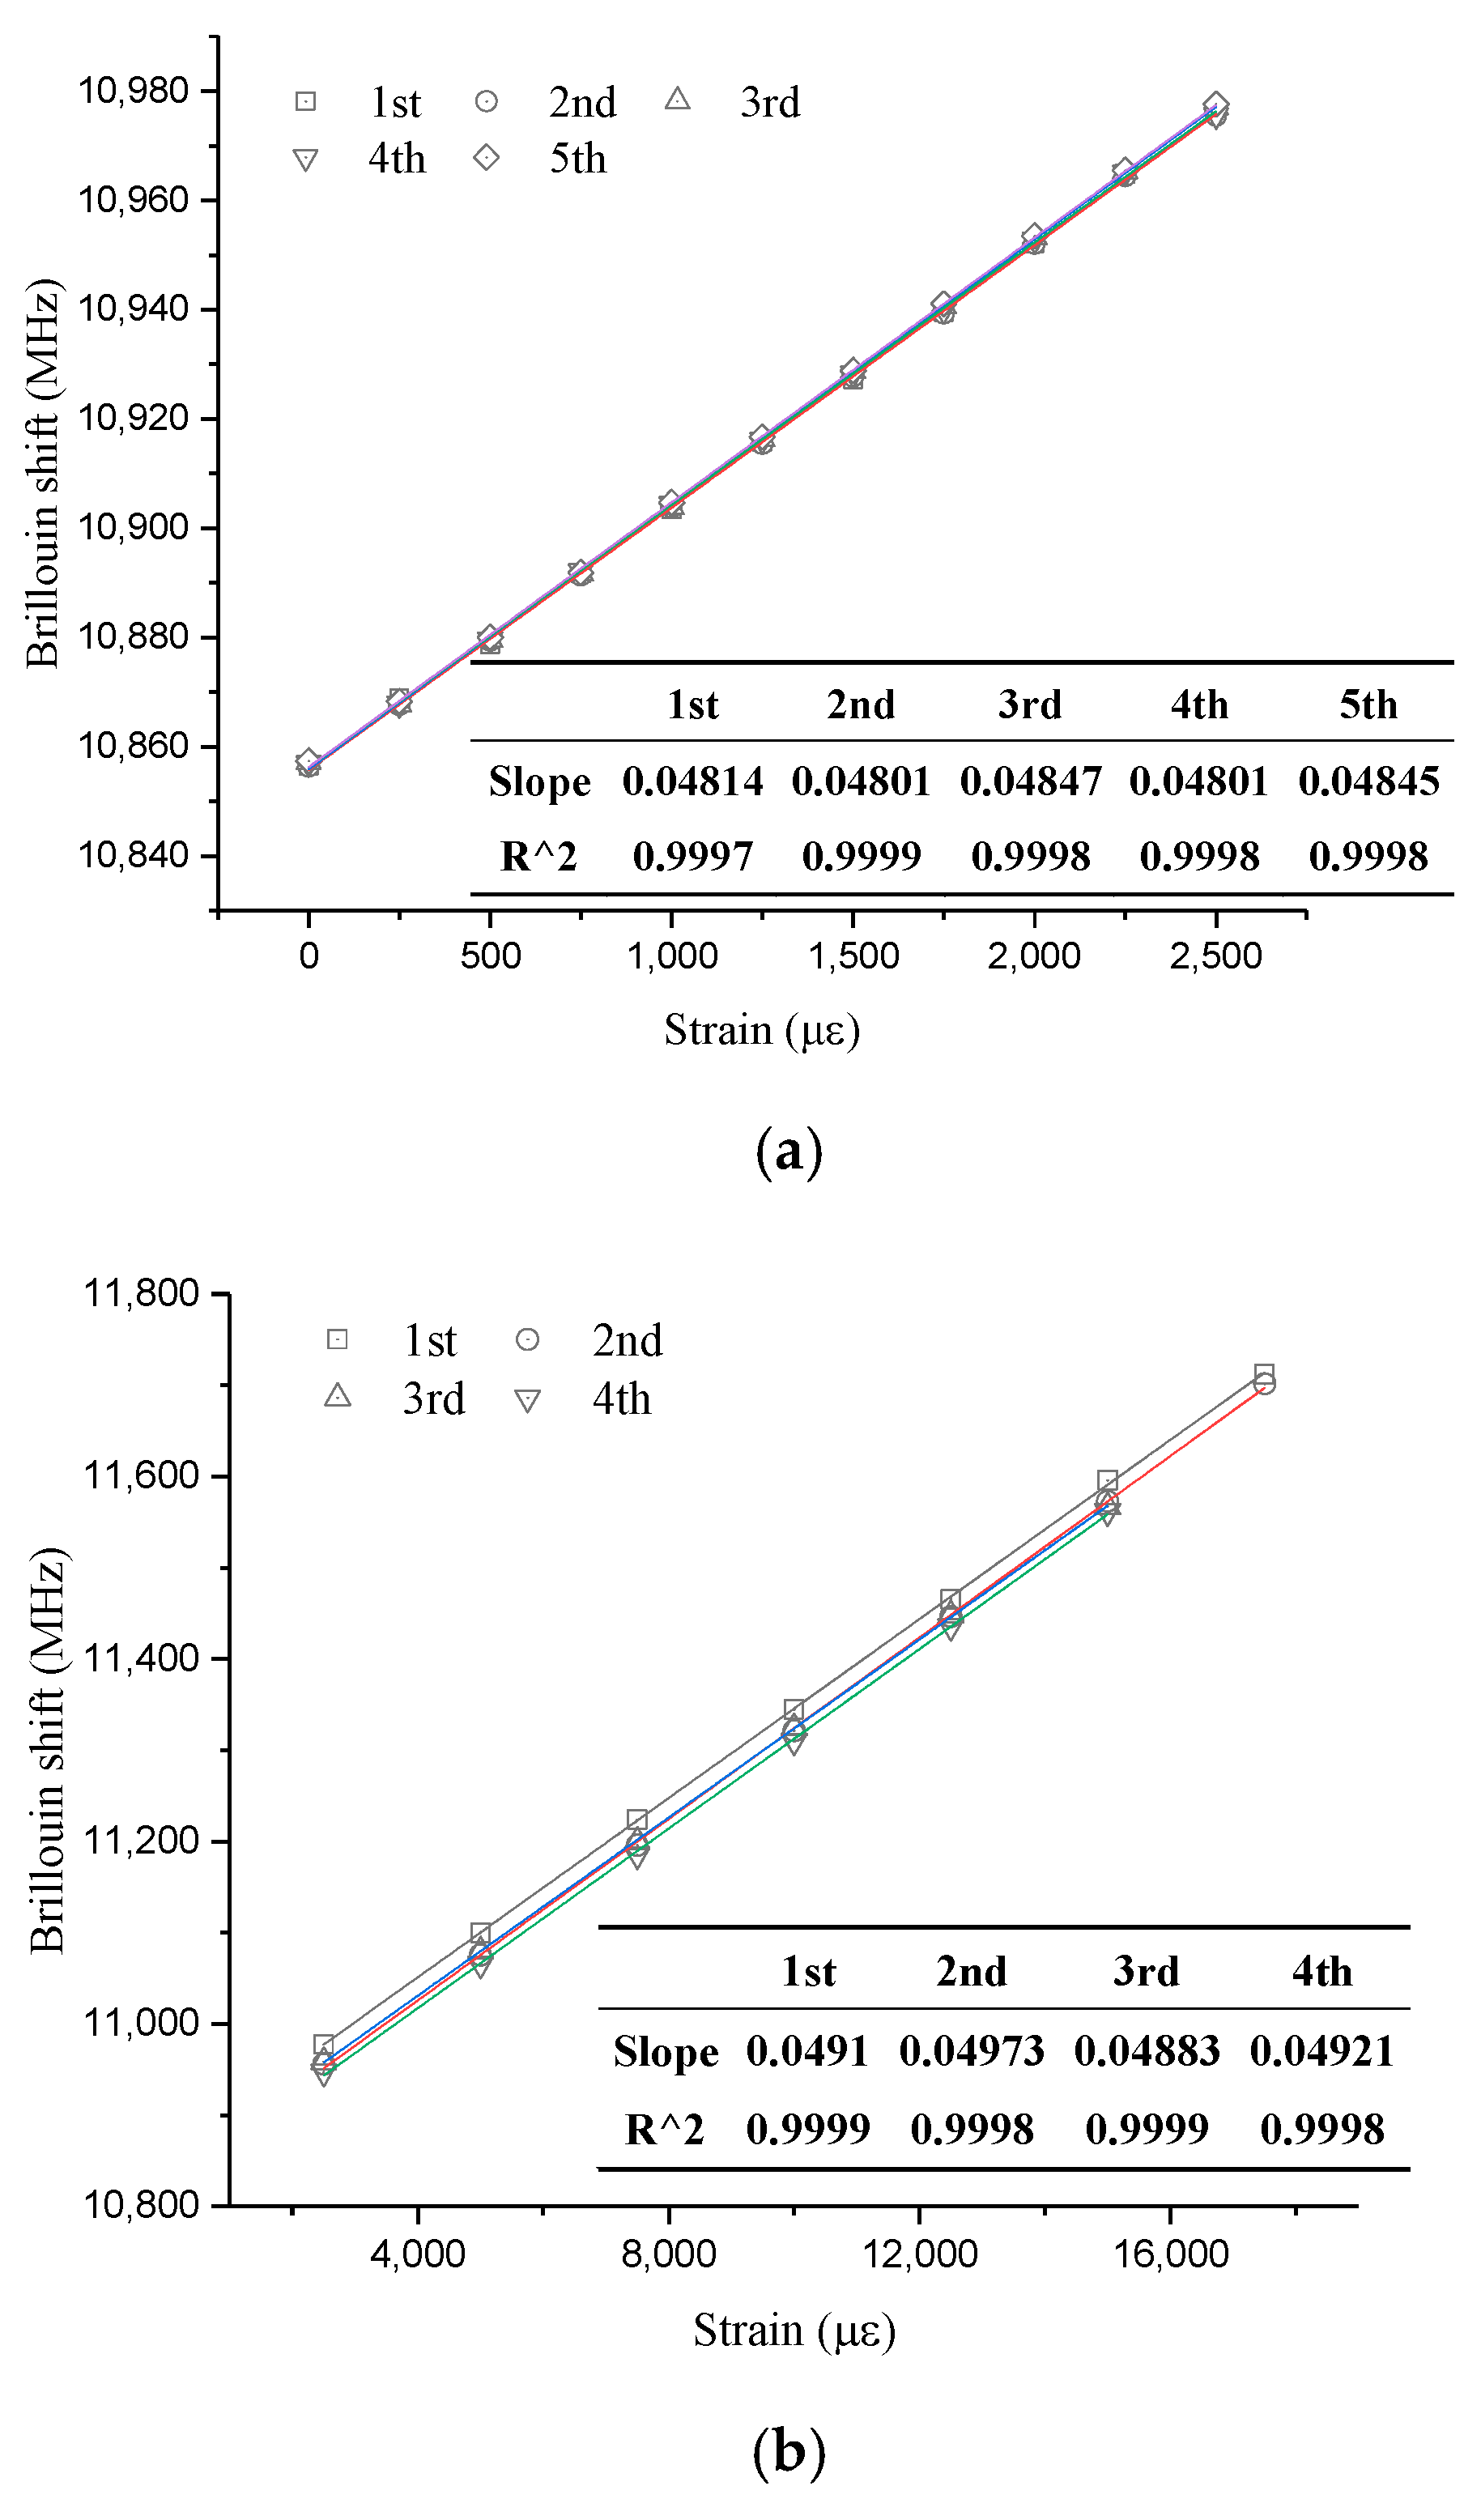
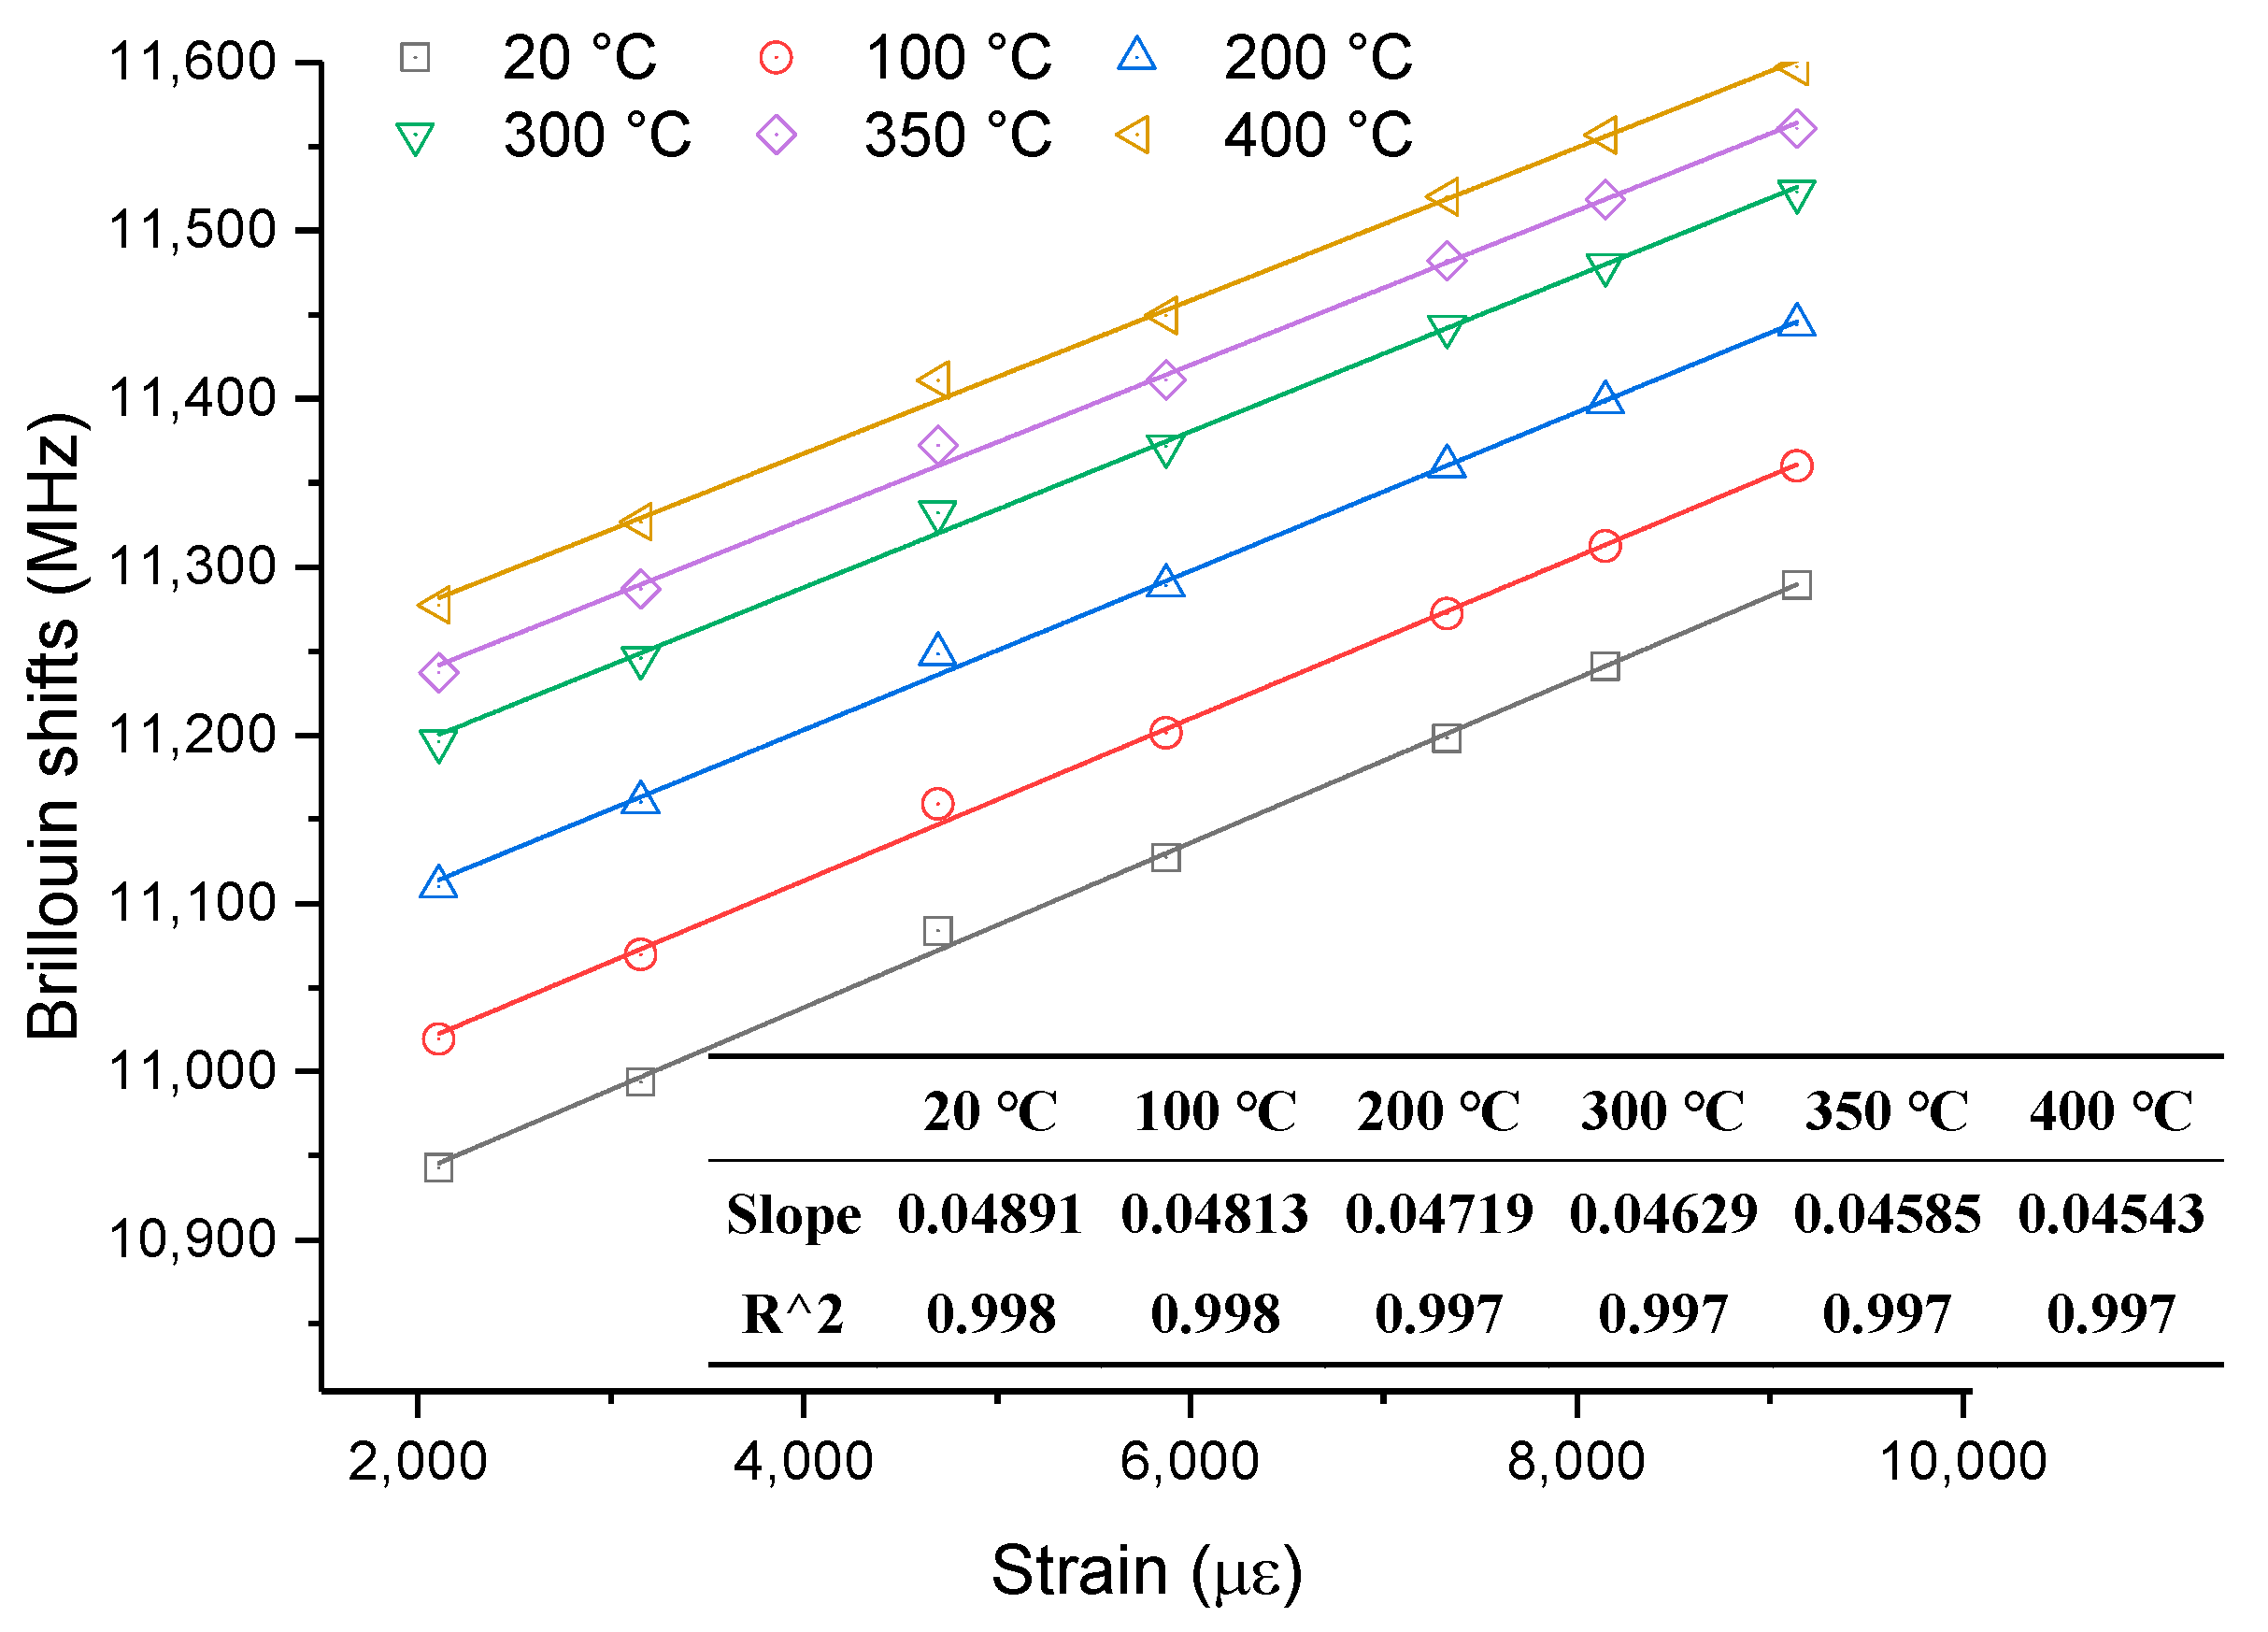
4. Strain-Sensing Properties in the High-Temperature Field
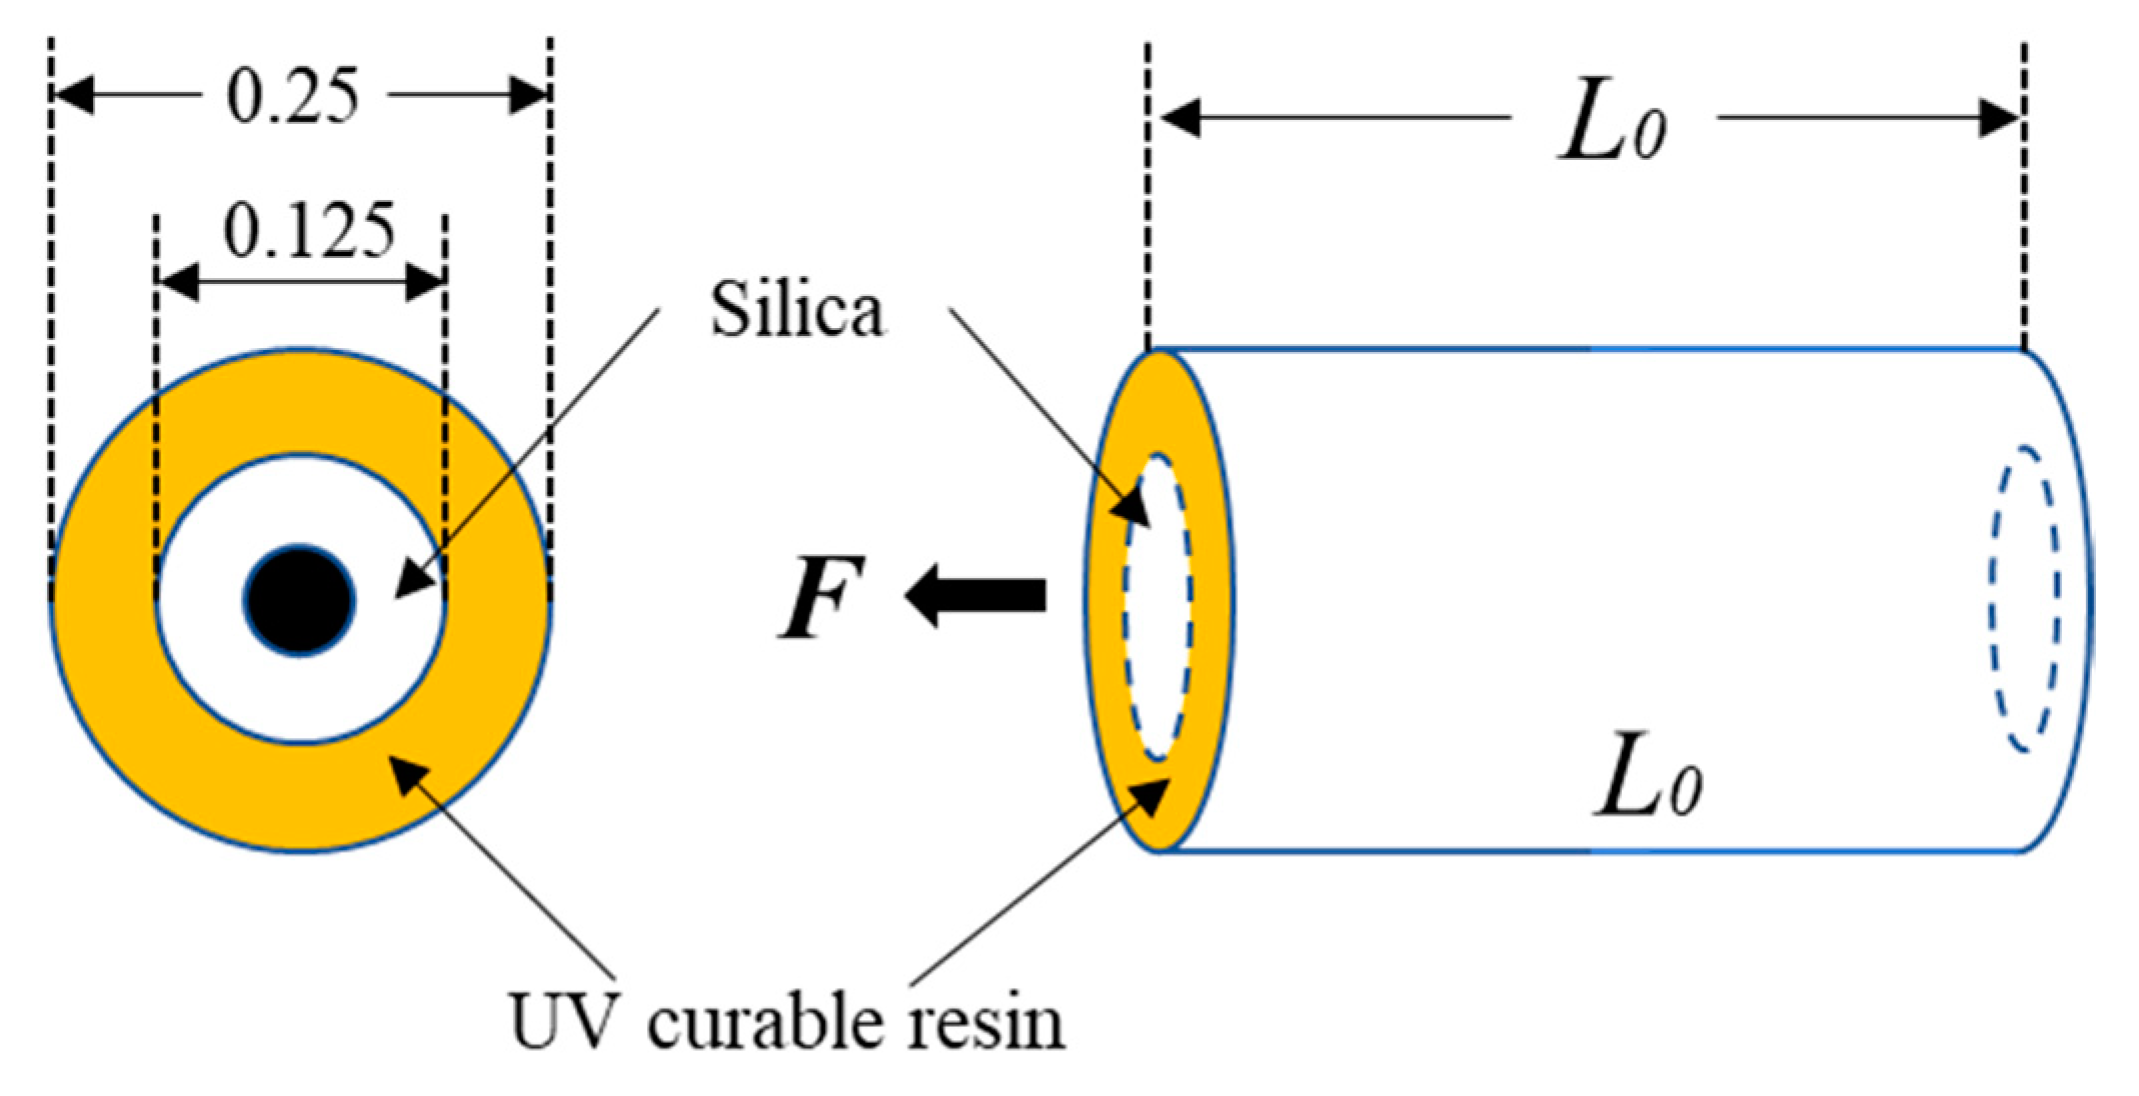
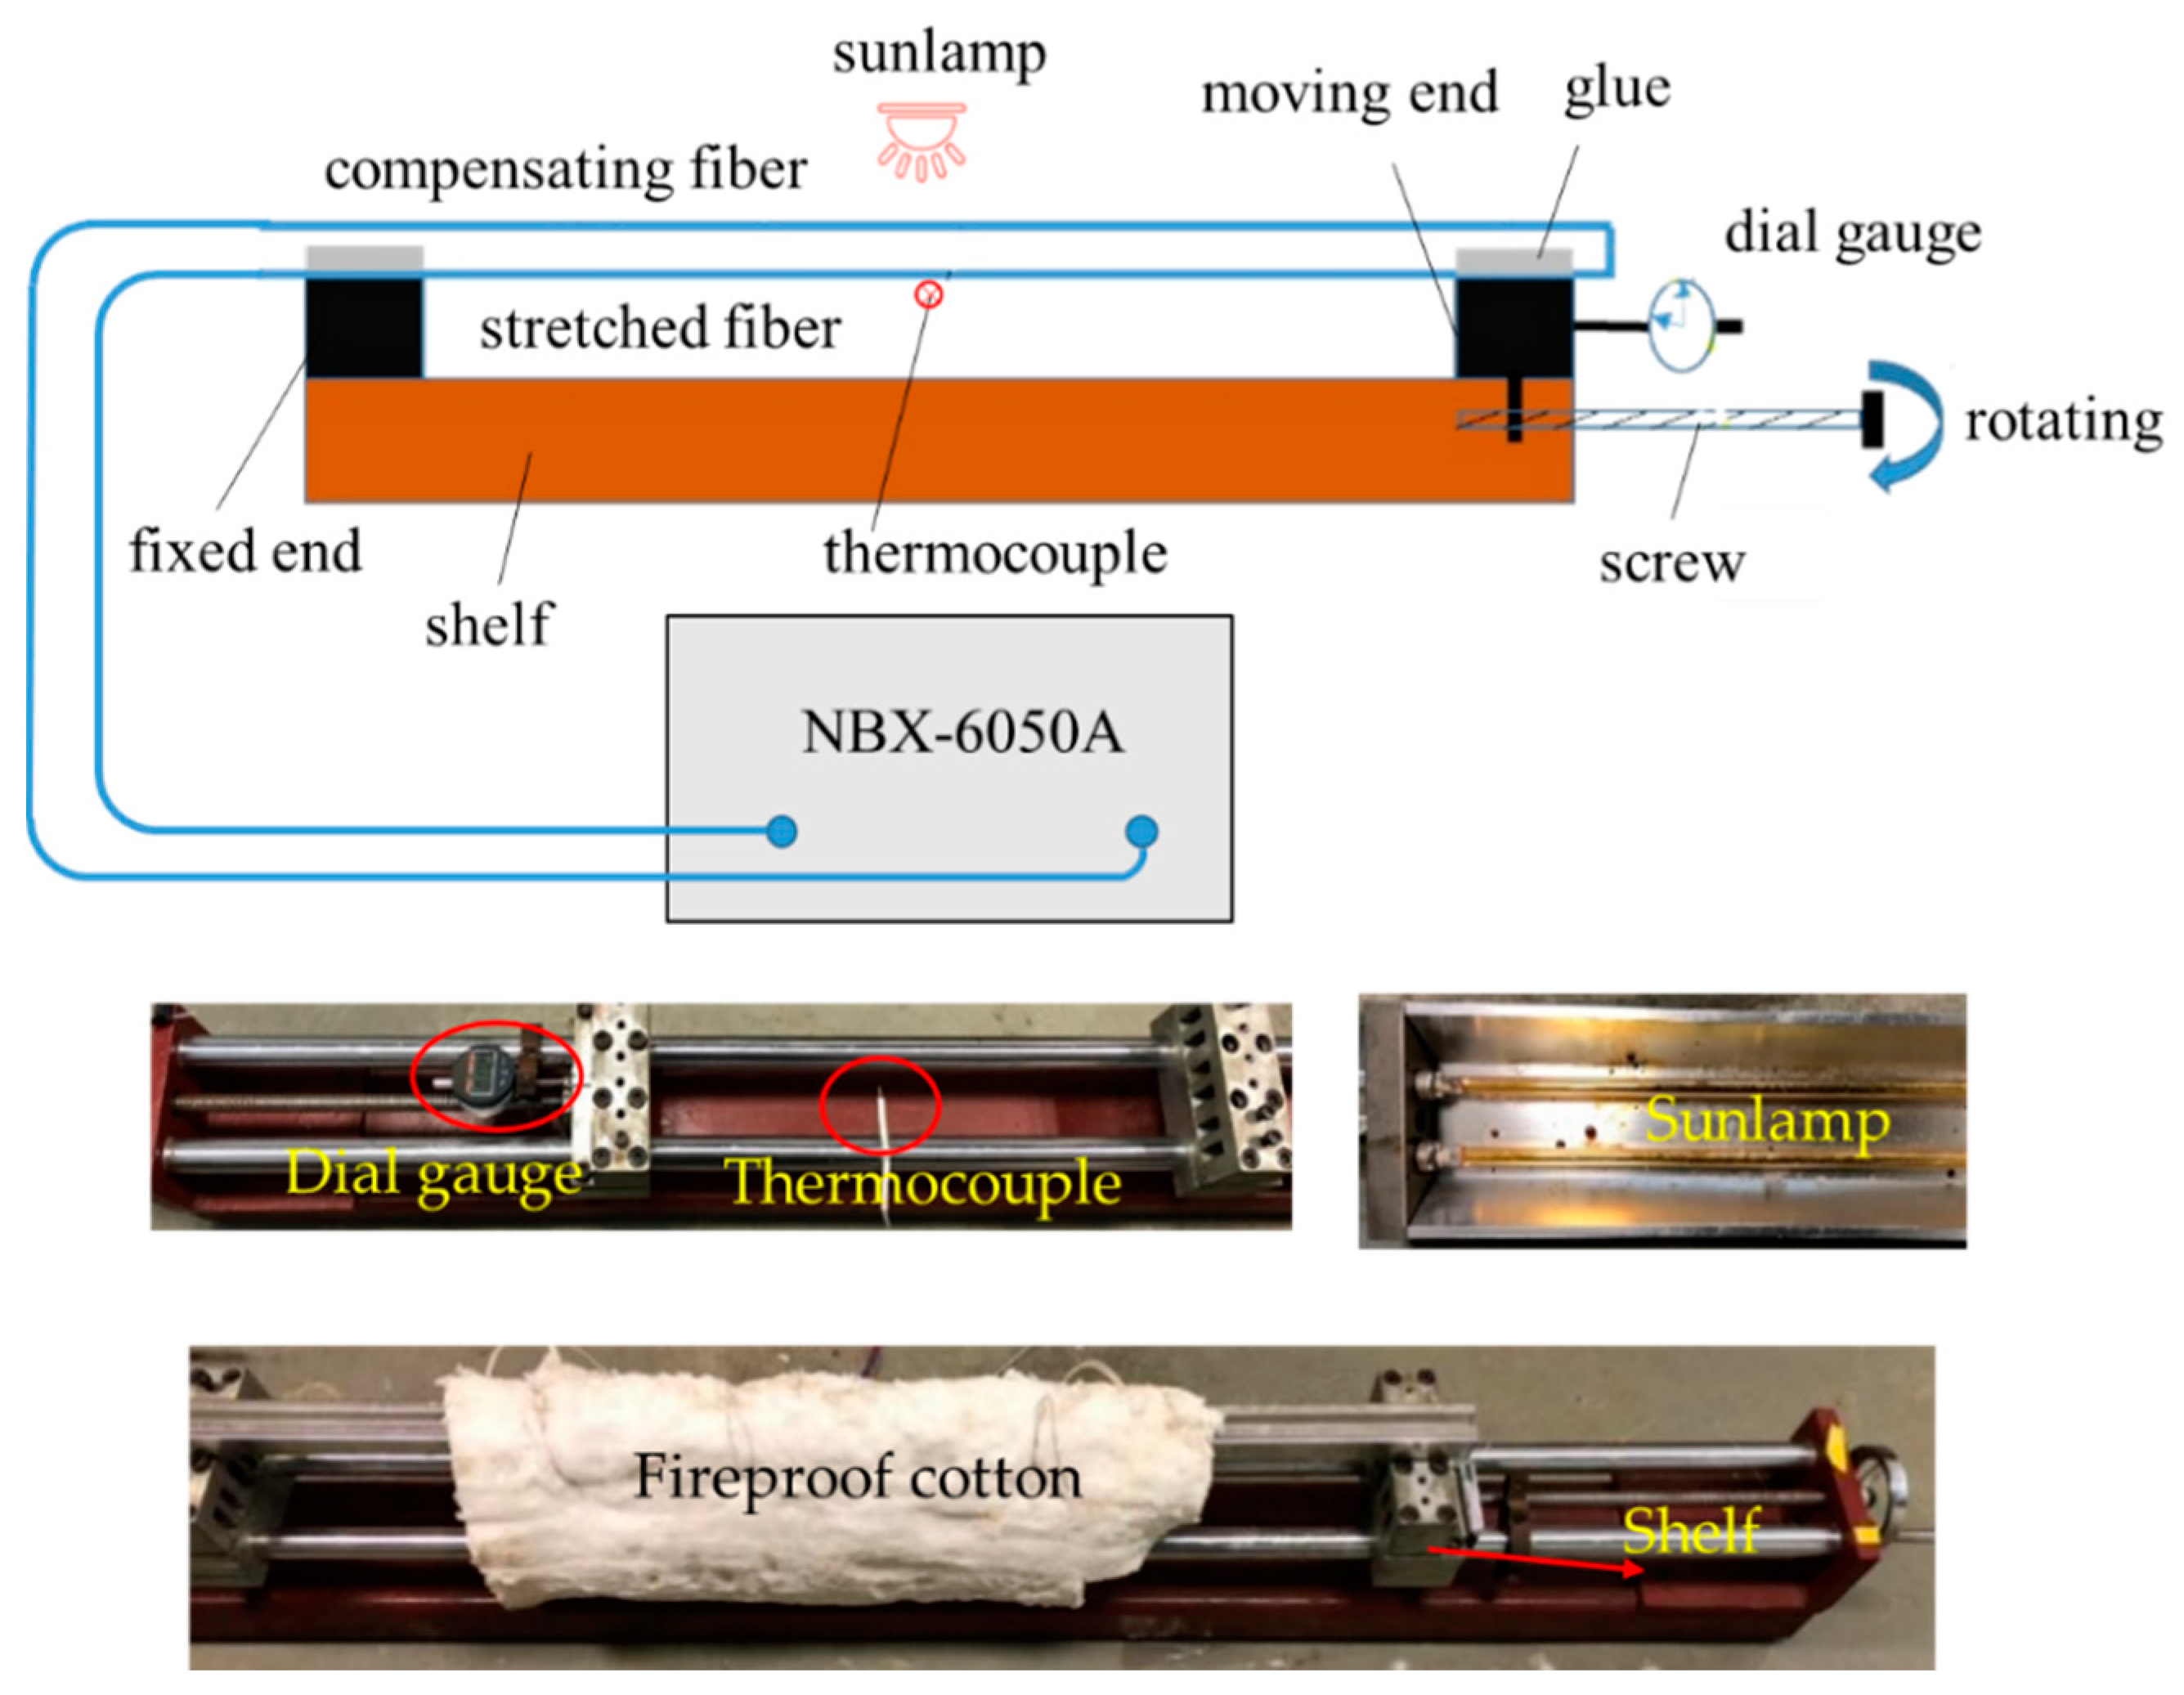
4.1. Experimental Program
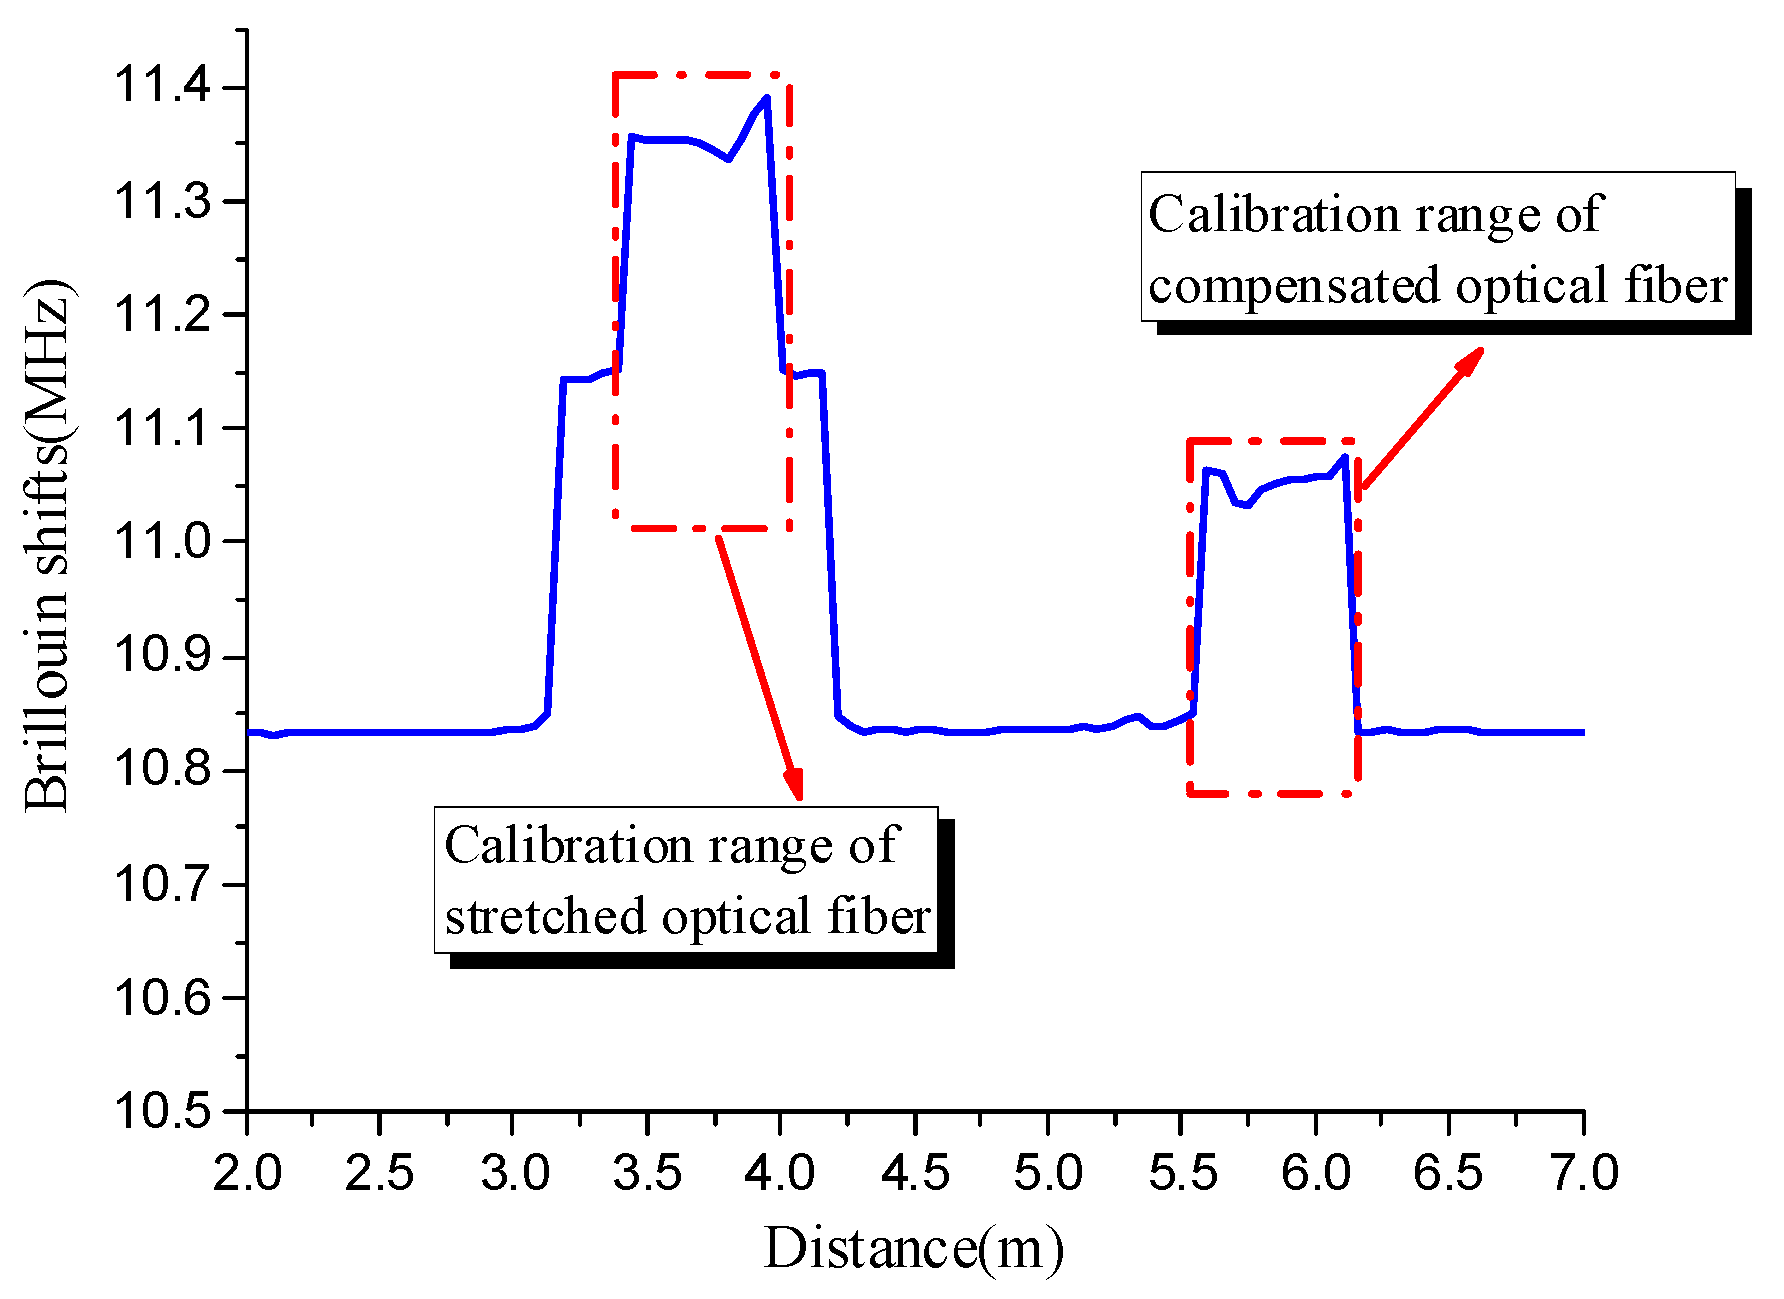
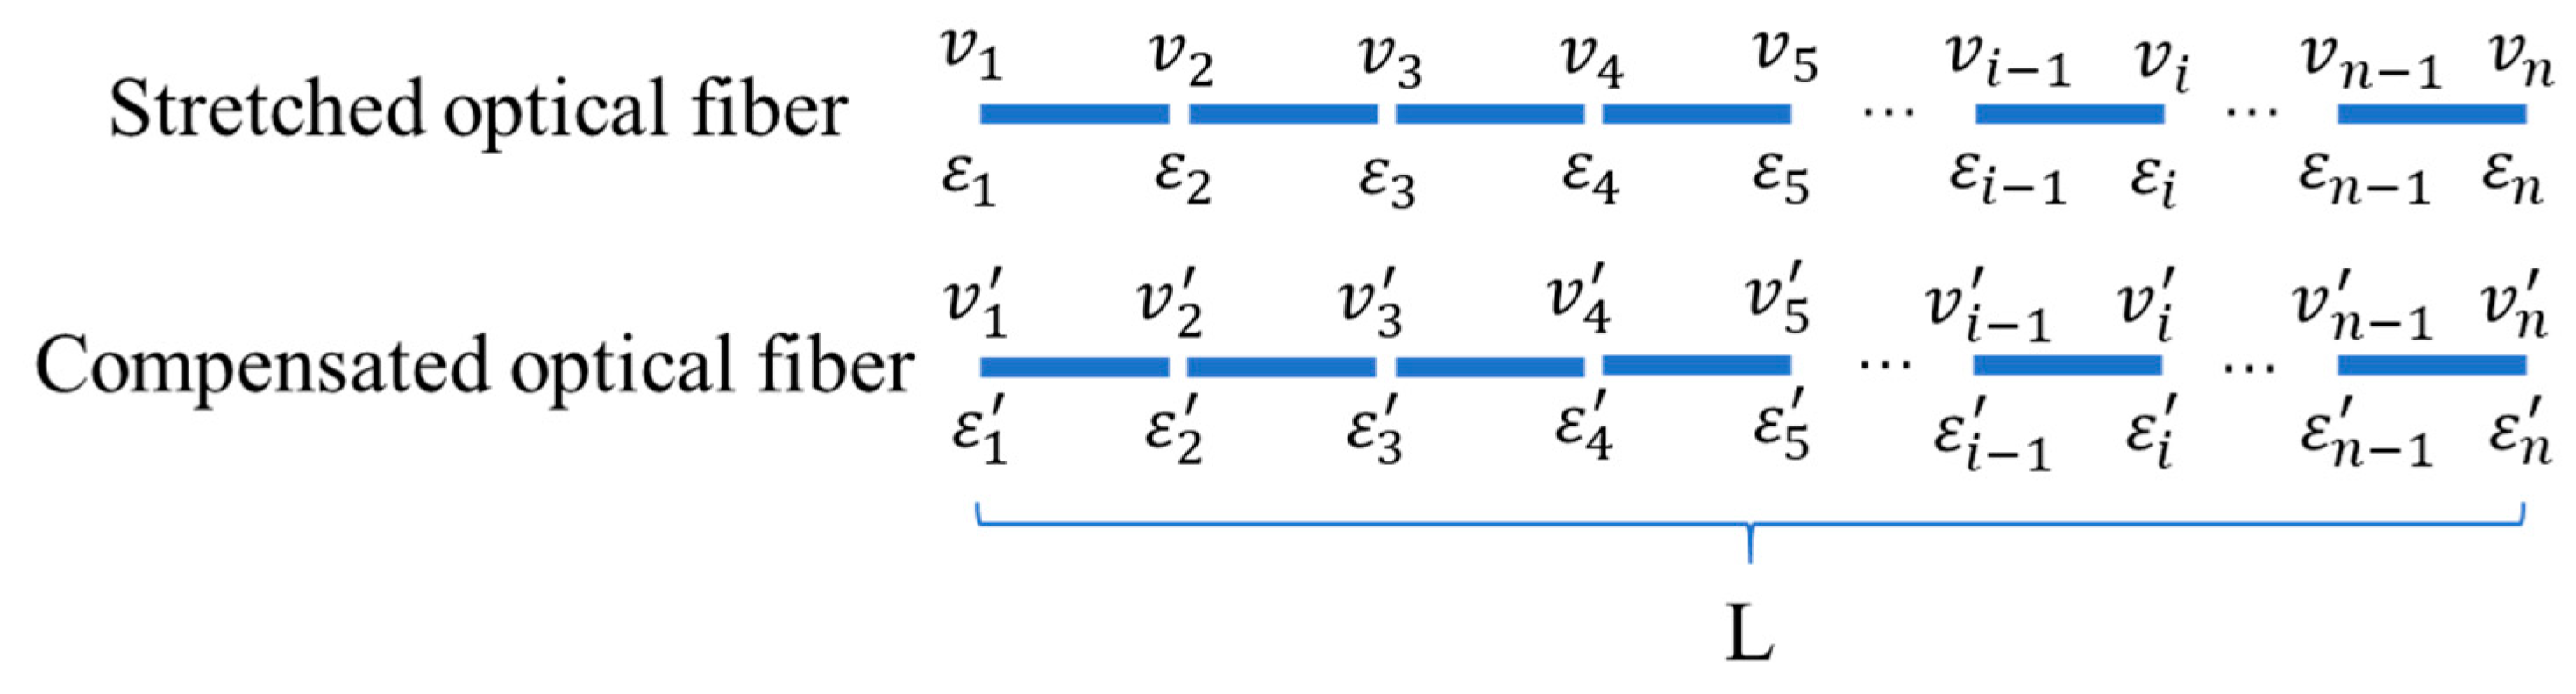
4.2. Results
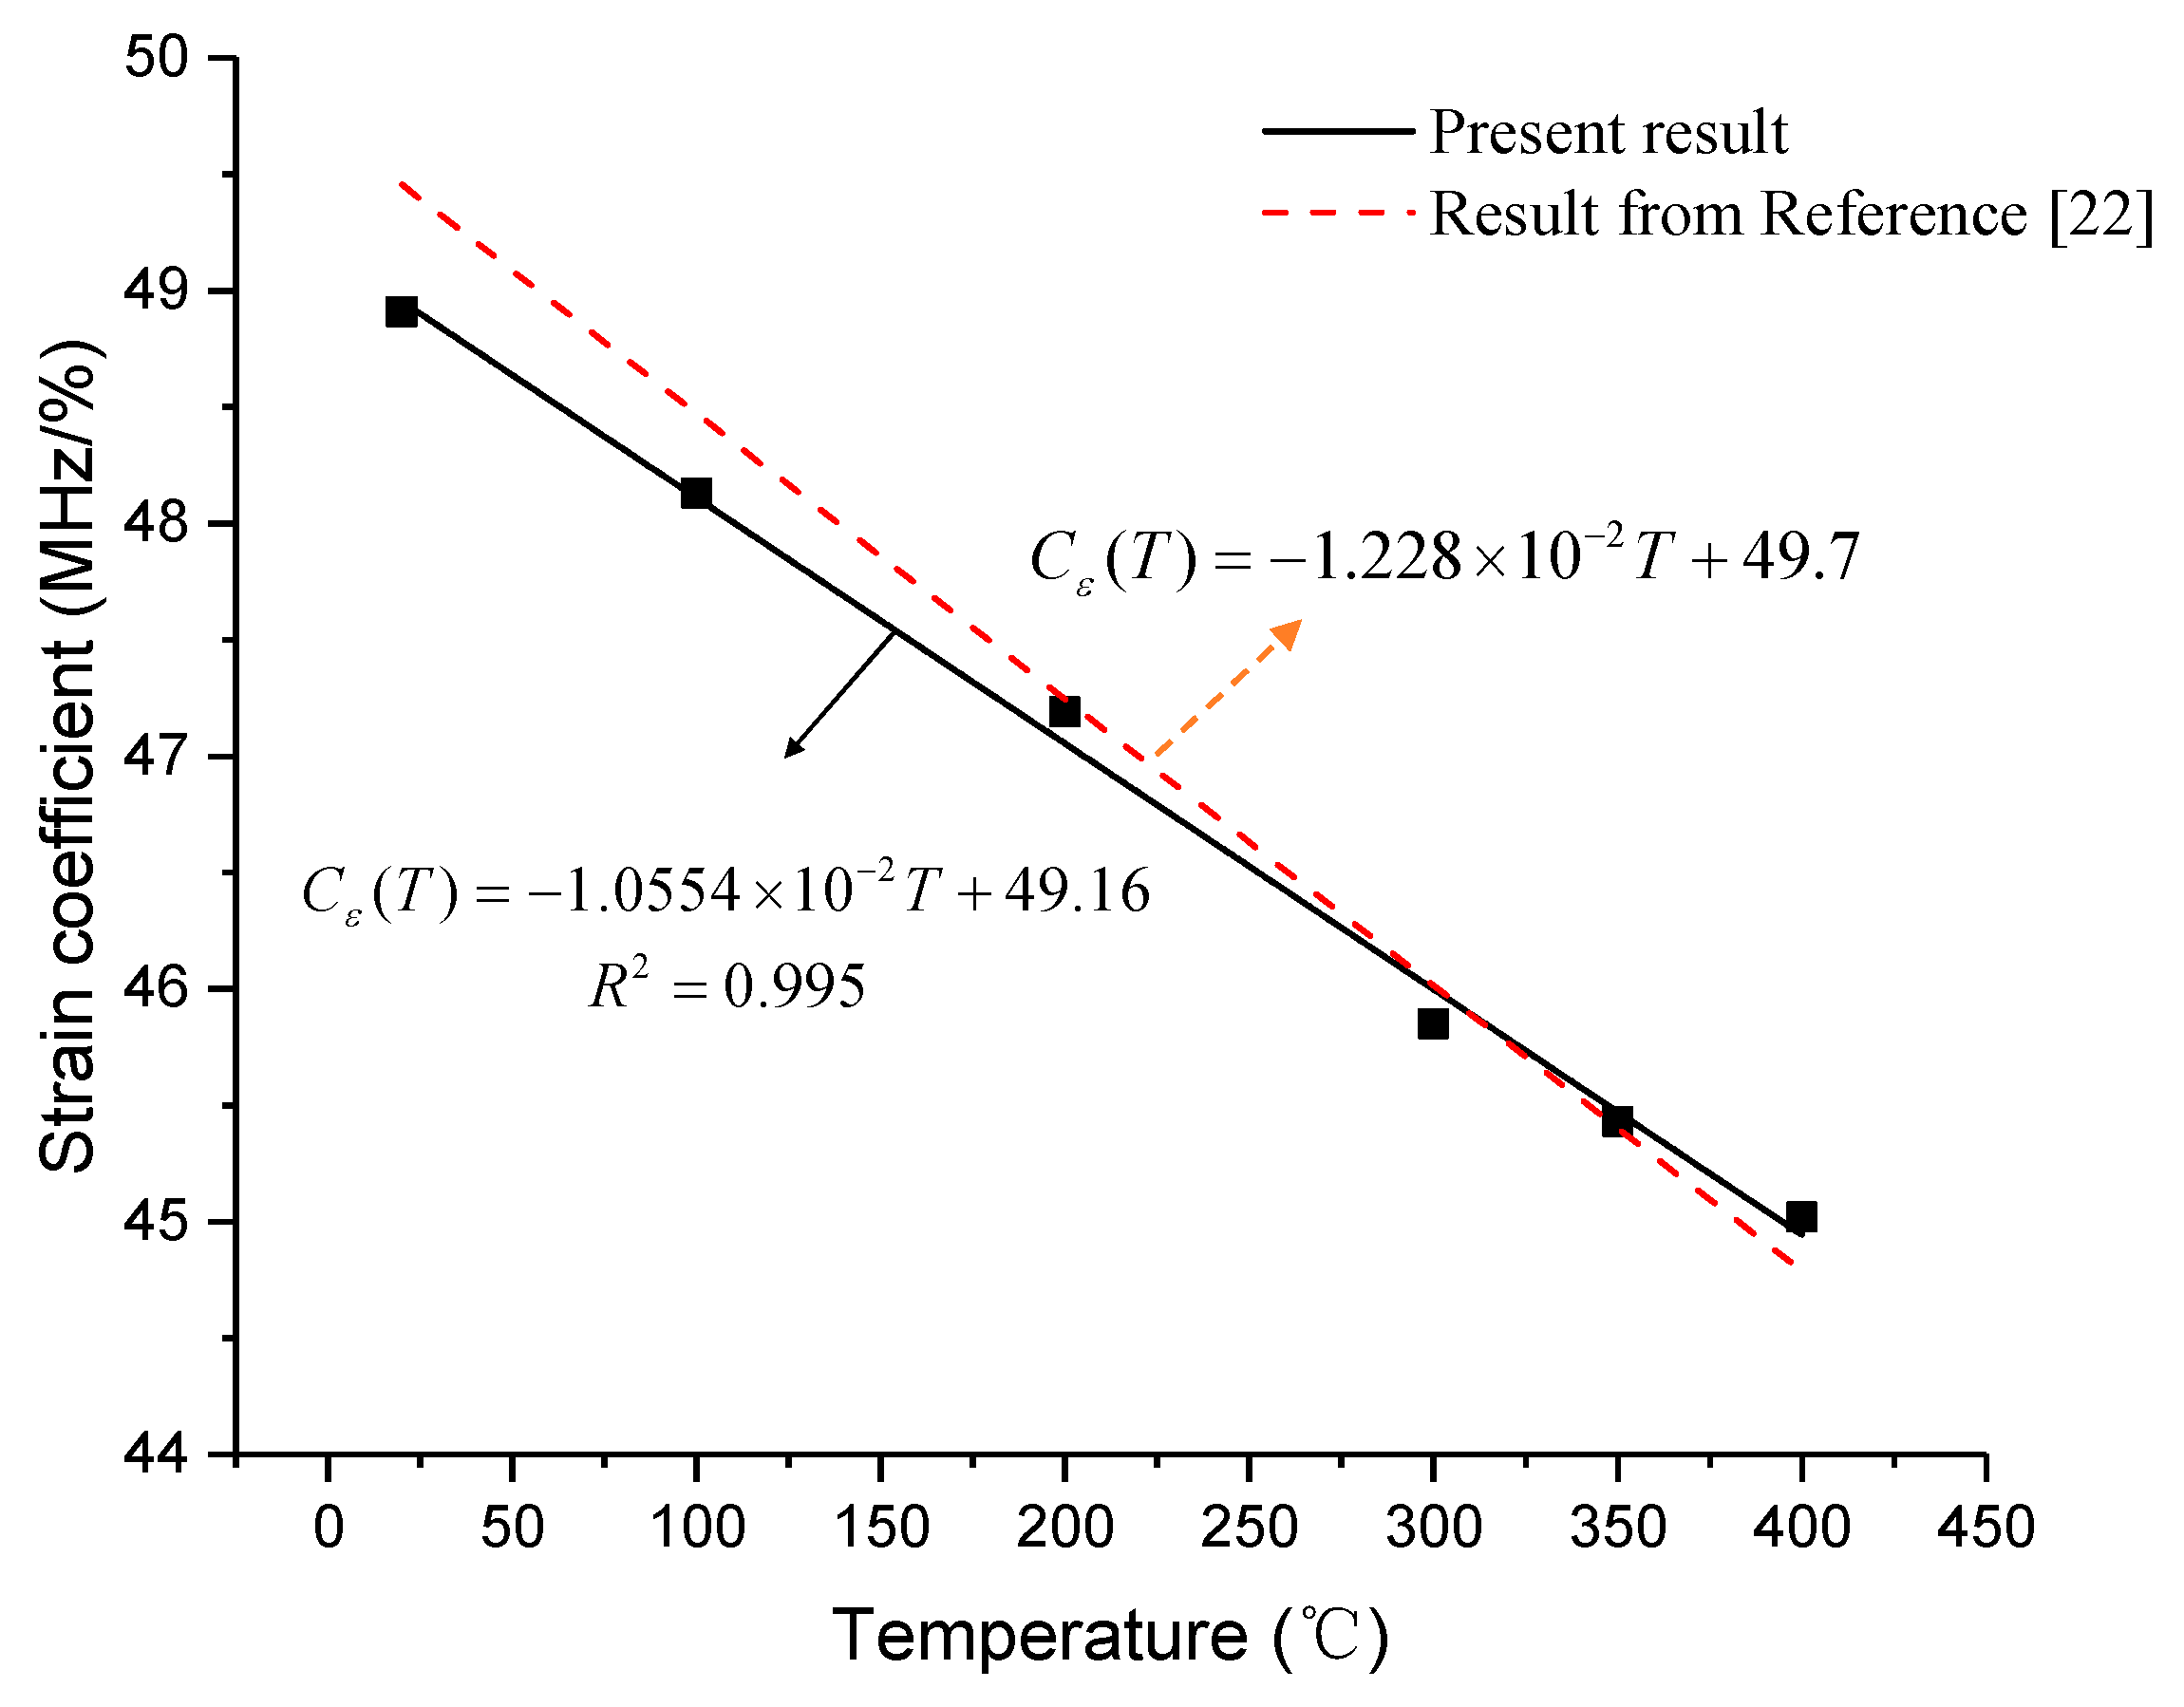
4.3. Discussion
5. Conclusions
- (1)
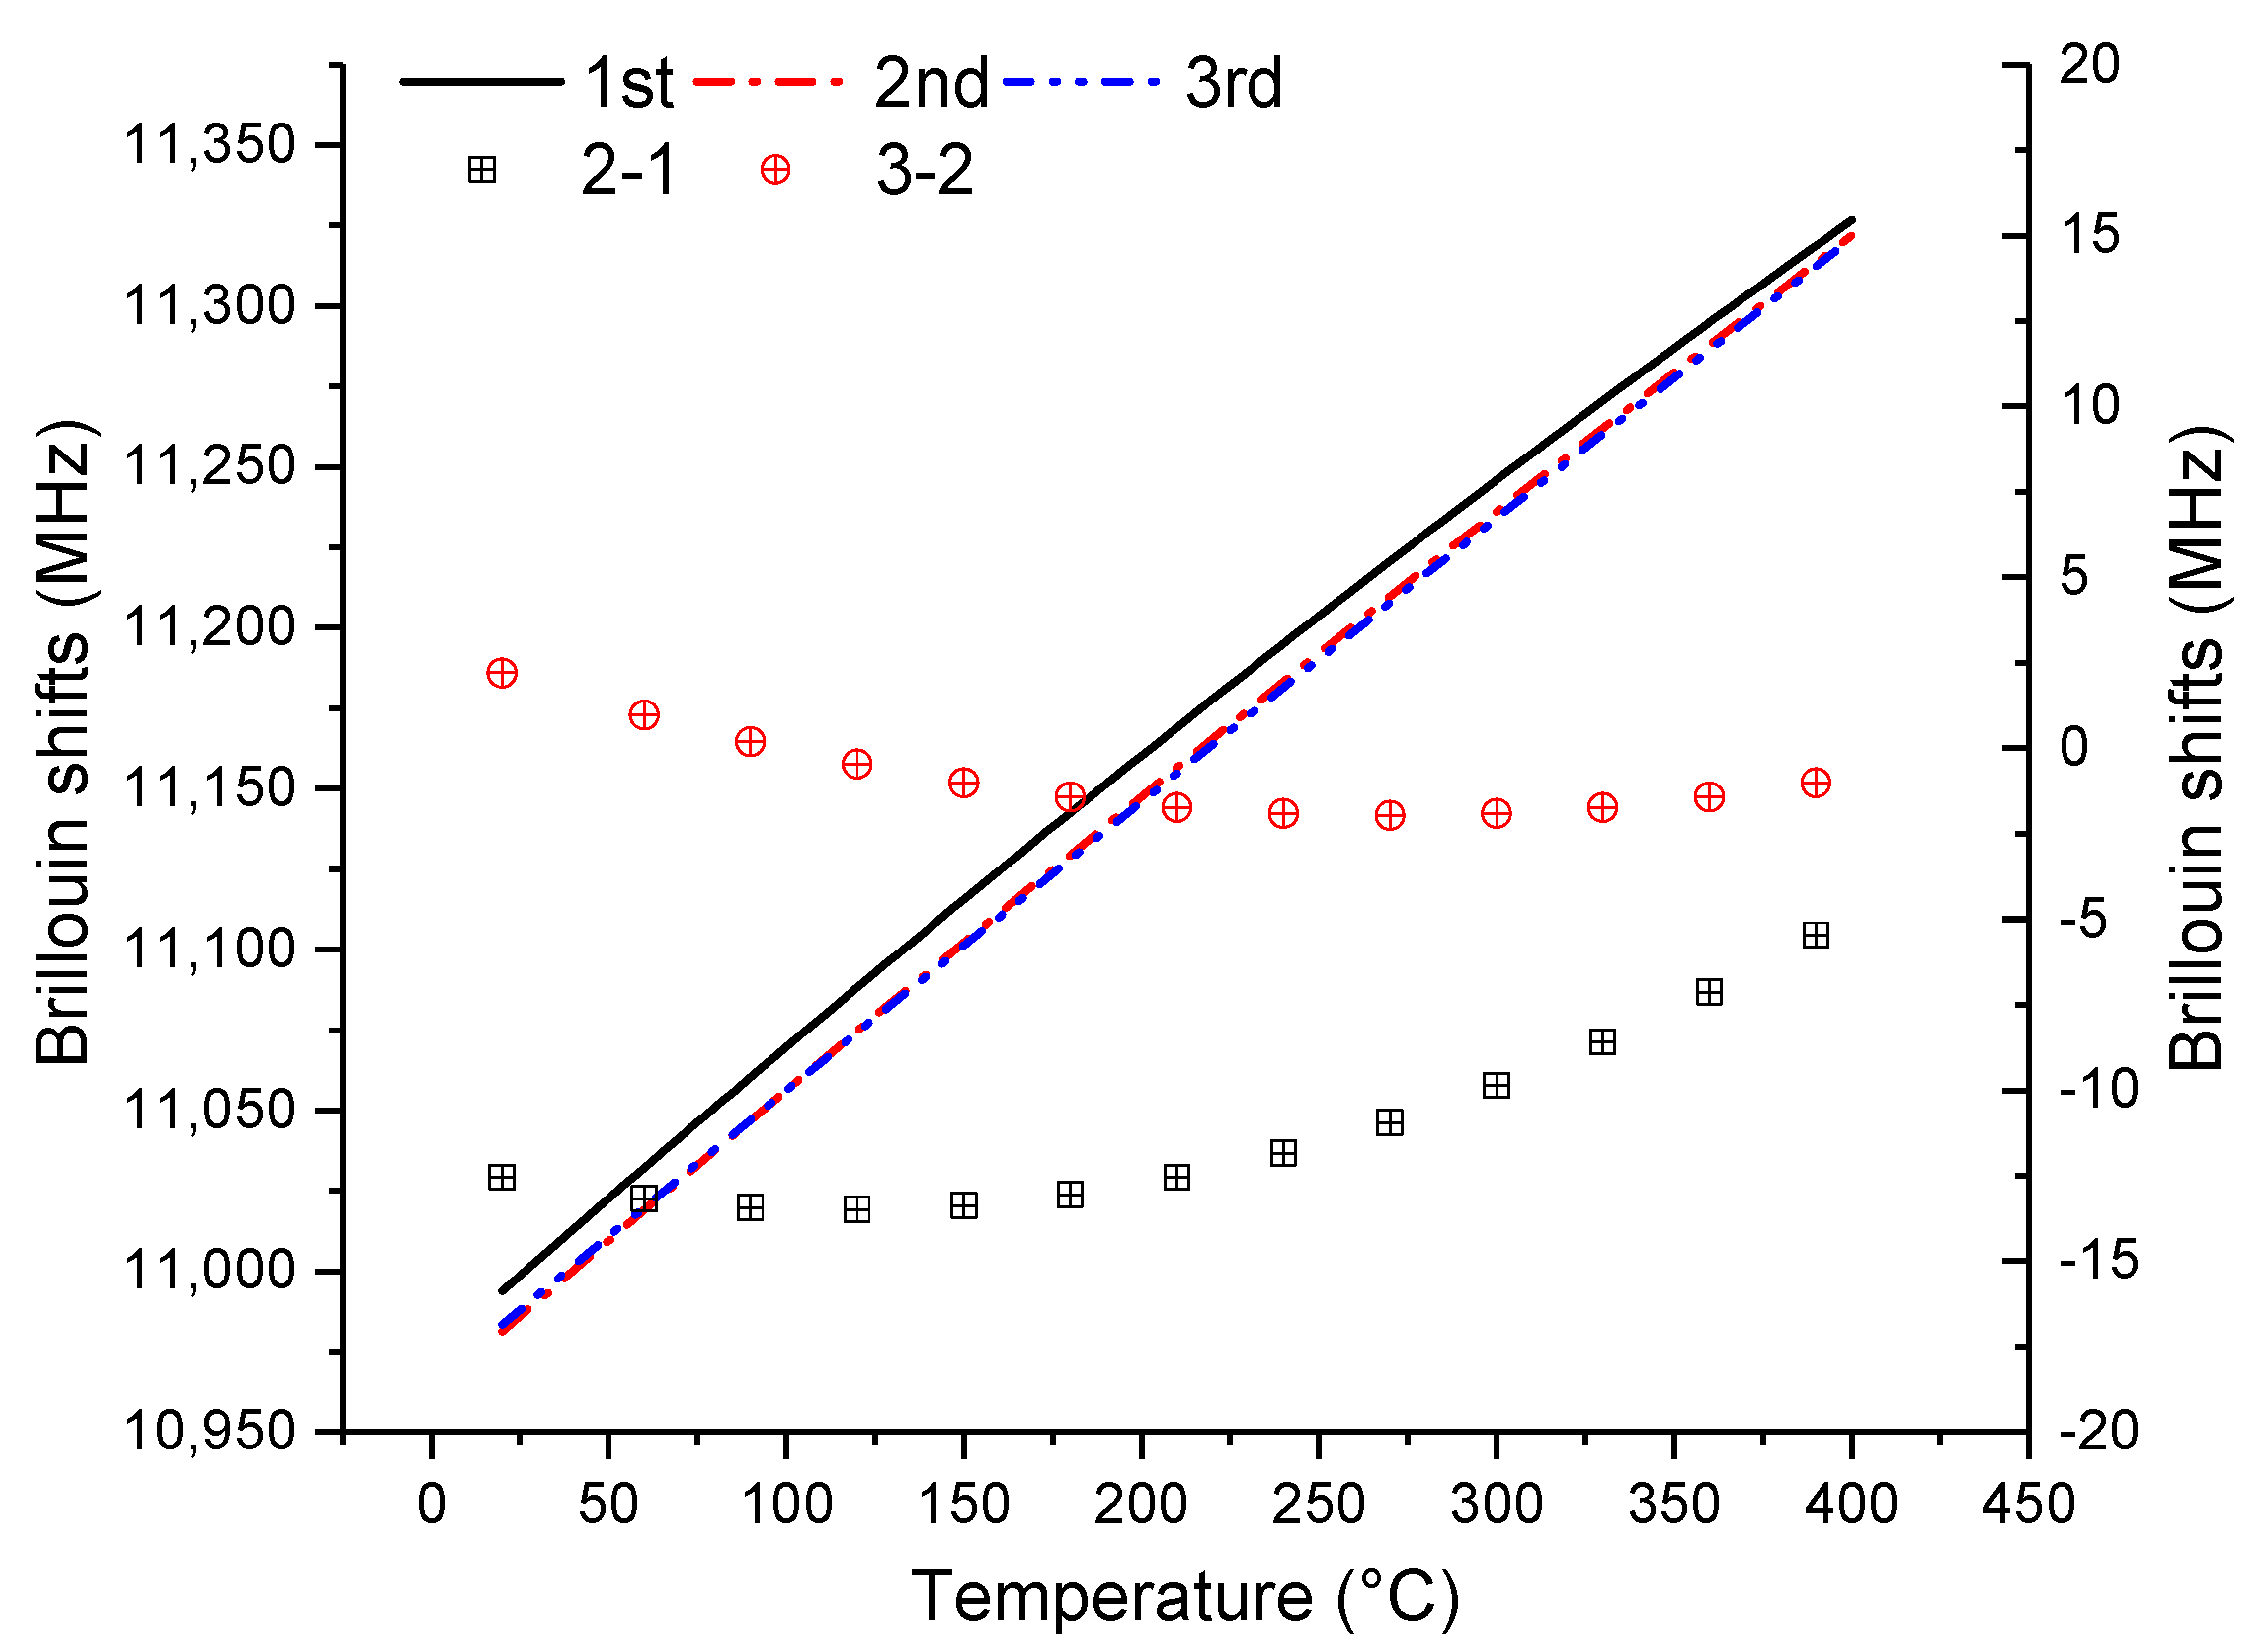
- Although burning of the coating will have an effect on sensing properties, ordinary optical fibers are still valid because the nonlinear relationship between Brillouin shift and temperature is great at different initial strains. Similarly, the linear relationship between Brillouin shift and strain is also great at different temperatures.
- (2)
- The temperature and strain coefficients tend to decrease with temperature, mainly because of the increase in Young’s modulus of silica with temperature, which will further change the strain of optical fibers.
- (3)
- The temperature coefficient can be determined by Formula (5), which is suitable for the range of 0–9000 με. The strain coefficient can be determined by Formula (16), which is consistent with experimental results and previous studies.
- (4)
- The research and development of smart FRP bars may solve the problem of obtaining strain at high temperatures. The calibration of two key parameters (temperature and strain coefficients) under different levels guarantees the reliability of the subsequent measured data. This result provides a basis for further high-temperature studies of smart FRP bars.
Author Contributions
Funding
Conflicts of Interest
References
- Barrias, A.; Casas, J.R.; Villalba, S. Embedded Distributed Optical Fiber Sensors in Reinforced Concrete Structures-A Case Study. Sensors 2018, 18, 980. [Google Scholar] [CrossRef] [PubMed]
- Lee, J.R.; Ryu, C.Y.; Koo, B.Y.; Kang, S.G.; Hong, C.S.; Kim, C.G. In-flight health monitoring of a subscale wing using a fiber Bragg grating sensor system. Smart Mater. Struct. 2003, 12, 147–155. [Google Scholar] [CrossRef]
- Baldwin, C.; Poloso, T.; Chen, P.; Niemczuk, J.; Kiddy, J.; Ealy, C. Structural monitoring of composite marine piles using fiber optic sensors. In Smart Structures and Materials 2001: Smart Systems for Bridges, Structures, and Highways; Liu, S.C., Ed.; Spie-Int Soc Optical Engineering: Bellingham, WA, USA, 2001; Volume 4330, pp. 487–497. [Google Scholar]
- Zhang, Y.X.; Shi, Y.F.; Zhao, Y.D.; Fu, L.R.; Yang, J.S. Determining the Cause of Damages in a Multiarch Tunnel Structure through Field Investigation and Numerical Analysis. J. Perform. Constr. Facil. 2017, 31, 7. [Google Scholar] [CrossRef]
- Chong, K.P.; Carino, N.J.; Washer, G. Health monitoring of civil infrastructures. Smart Mater. Struct. 2003, 12, 483–493. [Google Scholar] [CrossRef]
- Zhang, Y.X.; Liu, C.; Lu, W.H.; Xie, H.B.; Peng, H. Comparative Study of RC Members with Strengthening Using Strain Hardening Cementitious Composite and Fiber Reinforced Mortar. J. Test. Eval. 2019, 47, 35–42. [Google Scholar] [CrossRef]
- Wang, G.; Pran, K.; Sagvolden, G.; Havsgard, G.B.; Jensen, A.E.; Johnson, G.A.; Vohra, S.T. Ship hull structure monitoring using fibre optic sensors. Smart Mater. Struct. 2001, 10, 472–478. [Google Scholar] [CrossRef]
- Ohno, H.; Naruse, H.; Kihara, M.; Shimada, A. Invited paper—Industrial applications of the BOTDR optical fiber strain sensor. Opt. Fiber Technol. 2001, 7, 45–64. [Google Scholar] [CrossRef]
- Wolfbeis, O.S. Fiber-optic chemical sensors and biosensors. Anal. Chem. 2008, 80, 4269–4283. [Google Scholar] [CrossRef]
- Kinet, D.; Megret, P.; Goossen, K.W.; Qiu, L.; Heider, D.; Caucheteur, C. Fiber Bragg Grating Sensors toward Structural Health Monitoring in Composite Materials: Challenges and Solutions. Sensors 2014, 14, 7394–7419. [Google Scholar] [CrossRef]
- Cho, S.B.; Lee, J.J.; Kwon, I.B. Pulse base effect on the strain measurement of a Brillouin-scattering-based distributed optical fiber sensor. Smart Mater. Struct. 2006, 15, 315–324. [Google Scholar] [CrossRef]
- Yang, C.Q.; Wu, Z.S.; Ye, L.P. Self-diagnosis of hybrid CFRP rods and as-strengthened concrete structures. J. Intell. Mater. Syst. Struct. 2006, 17, 609–618. [Google Scholar] [CrossRef]
- Tang, Y.; Wu, Z.; Yang, C.; Shen, S.; Wu, G.; Hong, W. Development of self-sensing BFRP bars with distributed optic fiber sensors. In Proceedings of the Smart Sensor Phenomena, Technology, Networks, and Systems 2009, San Diego, CA, USA, 8–12 March 2009. [Google Scholar]
- Wu, Z.S.; Zhang, H.; Yang, C.Q. Development and Performance Evaluation of Non-slippage Optical Fiber as Brillouin Scattering-based Distributed Sensors. Struct. Health Monit. 2010, 9, 413–431. [Google Scholar]
- Tang, Y.; Wu, Z. Distributed Long-Gauge Optical Fiber Sensors Based Self-Sensing FRP Bar for Concrete Structure. Sensors 2016, 16, 286. [Google Scholar] [CrossRef] [PubMed]
- Tang, Y.S.; Wu, Z.S.; Yang, C.Q.; Wu, G.; Shen, S. A new type of smart basalt fiber-reinforced polymer bars as both reinforcements and sensors for civil engineering application. Smart Mater. Struct. 2010, 19, 14. [Google Scholar] [CrossRef]
- Xu, P.B.; Dong, Y.K.; Zhou, D.W.; Fu, C.; Zhang, J.W.; Zhang, H.Y.; Lu, Z.W.; Chen, L.; Bao, X.Y. 1200 degrees C high-temperature distributed optical fiber sensing using Brillouin optical time domain analysis. Appl. Opt. 2016, 55, 5471–5478. [Google Scholar] [CrossRef] [PubMed]
- Kurkjian, C.R.; Krause, J.T.; Matthewson, M.J. Strength and fatigue of silica optical fibers. J. Lightwave Technol. 1989, 7, 1360–1370. [Google Scholar] [CrossRef]
- Rose, A.H. Devitrification in annealed optical fiber. J. Lightwave Technol. 1997, 15, 808–814. [Google Scholar] [CrossRef]
- Xu, P.B.; Ba, D.X.; He, W.M.; Hu, H.P.; Dong, Y.K. Distributed Brillouin optical fiber temperature and strain sensing at a high temperature up to 1000 degrees C by using an annealed gold-coated fiber. Opt. Express 2018, 26, 29724–29734. [Google Scholar] [CrossRef]
- Ruiz-Lombera, R.; Laarossi, I.; Rodriguez-Cobo, L.; Quintela, M.A.; Lopez-Higuera, J.M.; Mirapeix, J. Distributed High-Temperature Optical Fiber Sensor Based on a Brillouin Optical Time Domain Analyzer and Multimode Gold-Coated Fiber. IEEE Sens. J. 2017, 17, 2393–2397. [Google Scholar] [CrossRef]
- Bao, Y.; Chen, G.D. Temperature-dependent strain and temperature sensitivities of fused silica single mode fiber sensors with pulse pre-pump Brillouin optical time domain analysis. Meas. Sci. Technol. 2016, 27, 11. [Google Scholar] [CrossRef]
- Bao, Y.; Hoehler, M.S.; Smith, C.M.; Bundy, M.; Chen, G.D. Temperature measurement and damage detection in concrete beams exposed to fire using PPP-BOTDA based fiber optic sensors. Smart Mater. Struct. 2017, 26, 11. [Google Scholar] [CrossRef] [PubMed]
- Firmo, J.P.; Correia, J.R. Fire behaviour of thermally insulated RC beams strengthened with NSM-CFRP strips: Experimental study. Compos. B Eng. 2015, 76, 112–121. [Google Scholar] [CrossRef]
- Scarcia, W.; Palma, G.; Falconi, M.C.; de Leonardis, F.; Passaro, V.M.N.; Prudenzano, F. Electromagnetic Modelling of Fiber Sensors for Low-Cost and High Sensitivity Temperature Monitoring. Sensors 2015, 15, 29855–29870. [Google Scholar] [CrossRef] [PubMed]
- Sakairi, Y.; Uchiyama, H.; Li, Z.M.; Adachi, S. A system for measuring temperature and strain separately by BOTDR and OTDR. In Advanced Sensor Systems and Applications; Rao, Y.J., Jones, J.D., Naruse, H., Chen, R.I., Eds.; Spie-Int Soc Optical Engineering: Bellingham, WA, USA, 2002; Volume 4920, pp. 274–284. [Google Scholar]
- Kwon, I.B.; Kim, C.Y.; Choi, M.Y. Distributed strain and temperature measurement of a beam using fiber optic BOTDA sensor. In Smart Structures and Materials 2003: Smart Systems and Nondestructive Evaluation for Civil Infrastructures; Liu, S.C., Ed.; Spie-Int Soc Optical Engineering: Bellingham, WA, USA, 2003; Volume 5057, pp. 486–496. [Google Scholar]
- Ruffle, B.; Ayrinhac, S.; Courtens, E.; Vacher, R.; Foret, M.; Wischnewski, A.; Buchenau, U. Scaling the temperature-dependent boson peak of vitreous silica with the high-frequency bulk modulus derived from Brillouin scattering data. Phys. Rev. Lett. 2010, 104, 067402. [Google Scholar] [CrossRef] [PubMed]
- De Faoite, D.; Browne, D.J.; Chang-Díaz, F.R.; Stanton, K.T. A review of the processing, composition, and temperature-dependent mechanical and thermal properties of dielectric technical ceramics. J. Mater. Sci. 2011, 47, 4211–4235. [Google Scholar] [CrossRef]
- Bucaro, J.A.; Dardy, H.D. High-temperature Brillouin scattering in fused quartz. J. Appl. Phys. 1974, 45, 5324–5329. [Google Scholar] [CrossRef]
- Hong, S.Y.; Kim, Y.C.; Wang, M.; Kim, H.-I.; Byun, D.-Y.; Nam, J.-D.; Chou, T.-W.; Ajayan, P.M.; Ci, L.; Suhr, J. Experimental investigation of mechanical properties of UV-Curable 3D printing materials. Polymer 2018, 145, 88–94. [Google Scholar] [CrossRef]


| 0 με | 171 με | 424 με | 957 με | 2107 με | |
|---|---|---|---|---|---|
| α | −2.9 × 10⁻⁴ | −3.1 × 10⁻⁴ | −2.86 × 10⁻⁴ | −2.73 × 10⁻⁴ | −2.51 × 10⁻⁴ |
| β | 1.035 | 1.037 | 1.025 | 1.015 | 0.986 |
| 3154 με | 4693 με | 5873 με | 7328 με | 8149 με | 9140 με | |
|---|---|---|---|---|---|---|
| α | −2.43 × 10⁻⁴ | −2.68 × 10⁻⁴ | −2.52 × 10⁻⁴ | −2.61 × 10⁻⁴ | −2.11 × 10⁻⁴ | −2.49 × 10⁻⁴ |
| β | 0.978 | 0.974 | 0.954 | 0.957 | 0.920 | 0.915 |
© 2019 by the authors. Licensee MDPI, Basel, Switzerland. This article is an open access article distributed under the terms and conditions of the Creative Commons Attribution (CC BY) license (http://creativecommons.org/licenses/by/4.0/).
Share and Cite
Shen, J.; Li, T.; Zhu, H.; Yang, C.; Zhang, K. Sensing Properties of Fused Silica Single-Mode Optical Fibers Based on PPP-BOTDA in High-Temperature Fields. Sensors 2019, 19, 5021. https://doi.org/10.3390/s19225021
Shen J, Li T, Zhu H, Yang C, Zhang K. Sensing Properties of Fused Silica Single-Mode Optical Fibers Based on PPP-BOTDA in High-Temperature Fields. Sensors. 2019; 19(22):5021. https://doi.org/10.3390/s19225021
Chicago/Turabian StyleShen, Jiahui, Ting Li, Hong Zhu, Caiqian Yang, and Kai Zhang. 2019. "Sensing Properties of Fused Silica Single-Mode Optical Fibers Based on PPP-BOTDA in High-Temperature Fields" Sensors 19, no. 22: 5021. https://doi.org/10.3390/s19225021
APA StyleShen, J., Li, T., Zhu, H., Yang, C., & Zhang, K. (2019). Sensing Properties of Fused Silica Single-Mode Optical Fibers Based on PPP-BOTDA in High-Temperature Fields. Sensors, 19(22), 5021. https://doi.org/10.3390/s19225021