K-Means Spreading Factor Allocation for Large-Scale LoRa Networks

 ,
,  , , and
Abstract
:1. Introduction
2. Related Work
3. System Model
3.1. Uplink Outage Probability
3.1.1. Outage Condition I
3.1.2. Outage Condition II
3.1.3. Coverage Probability
4. Proposed SF Allocation Algorithm
| Algorithm 1 K-Means-based SF Allocation | |
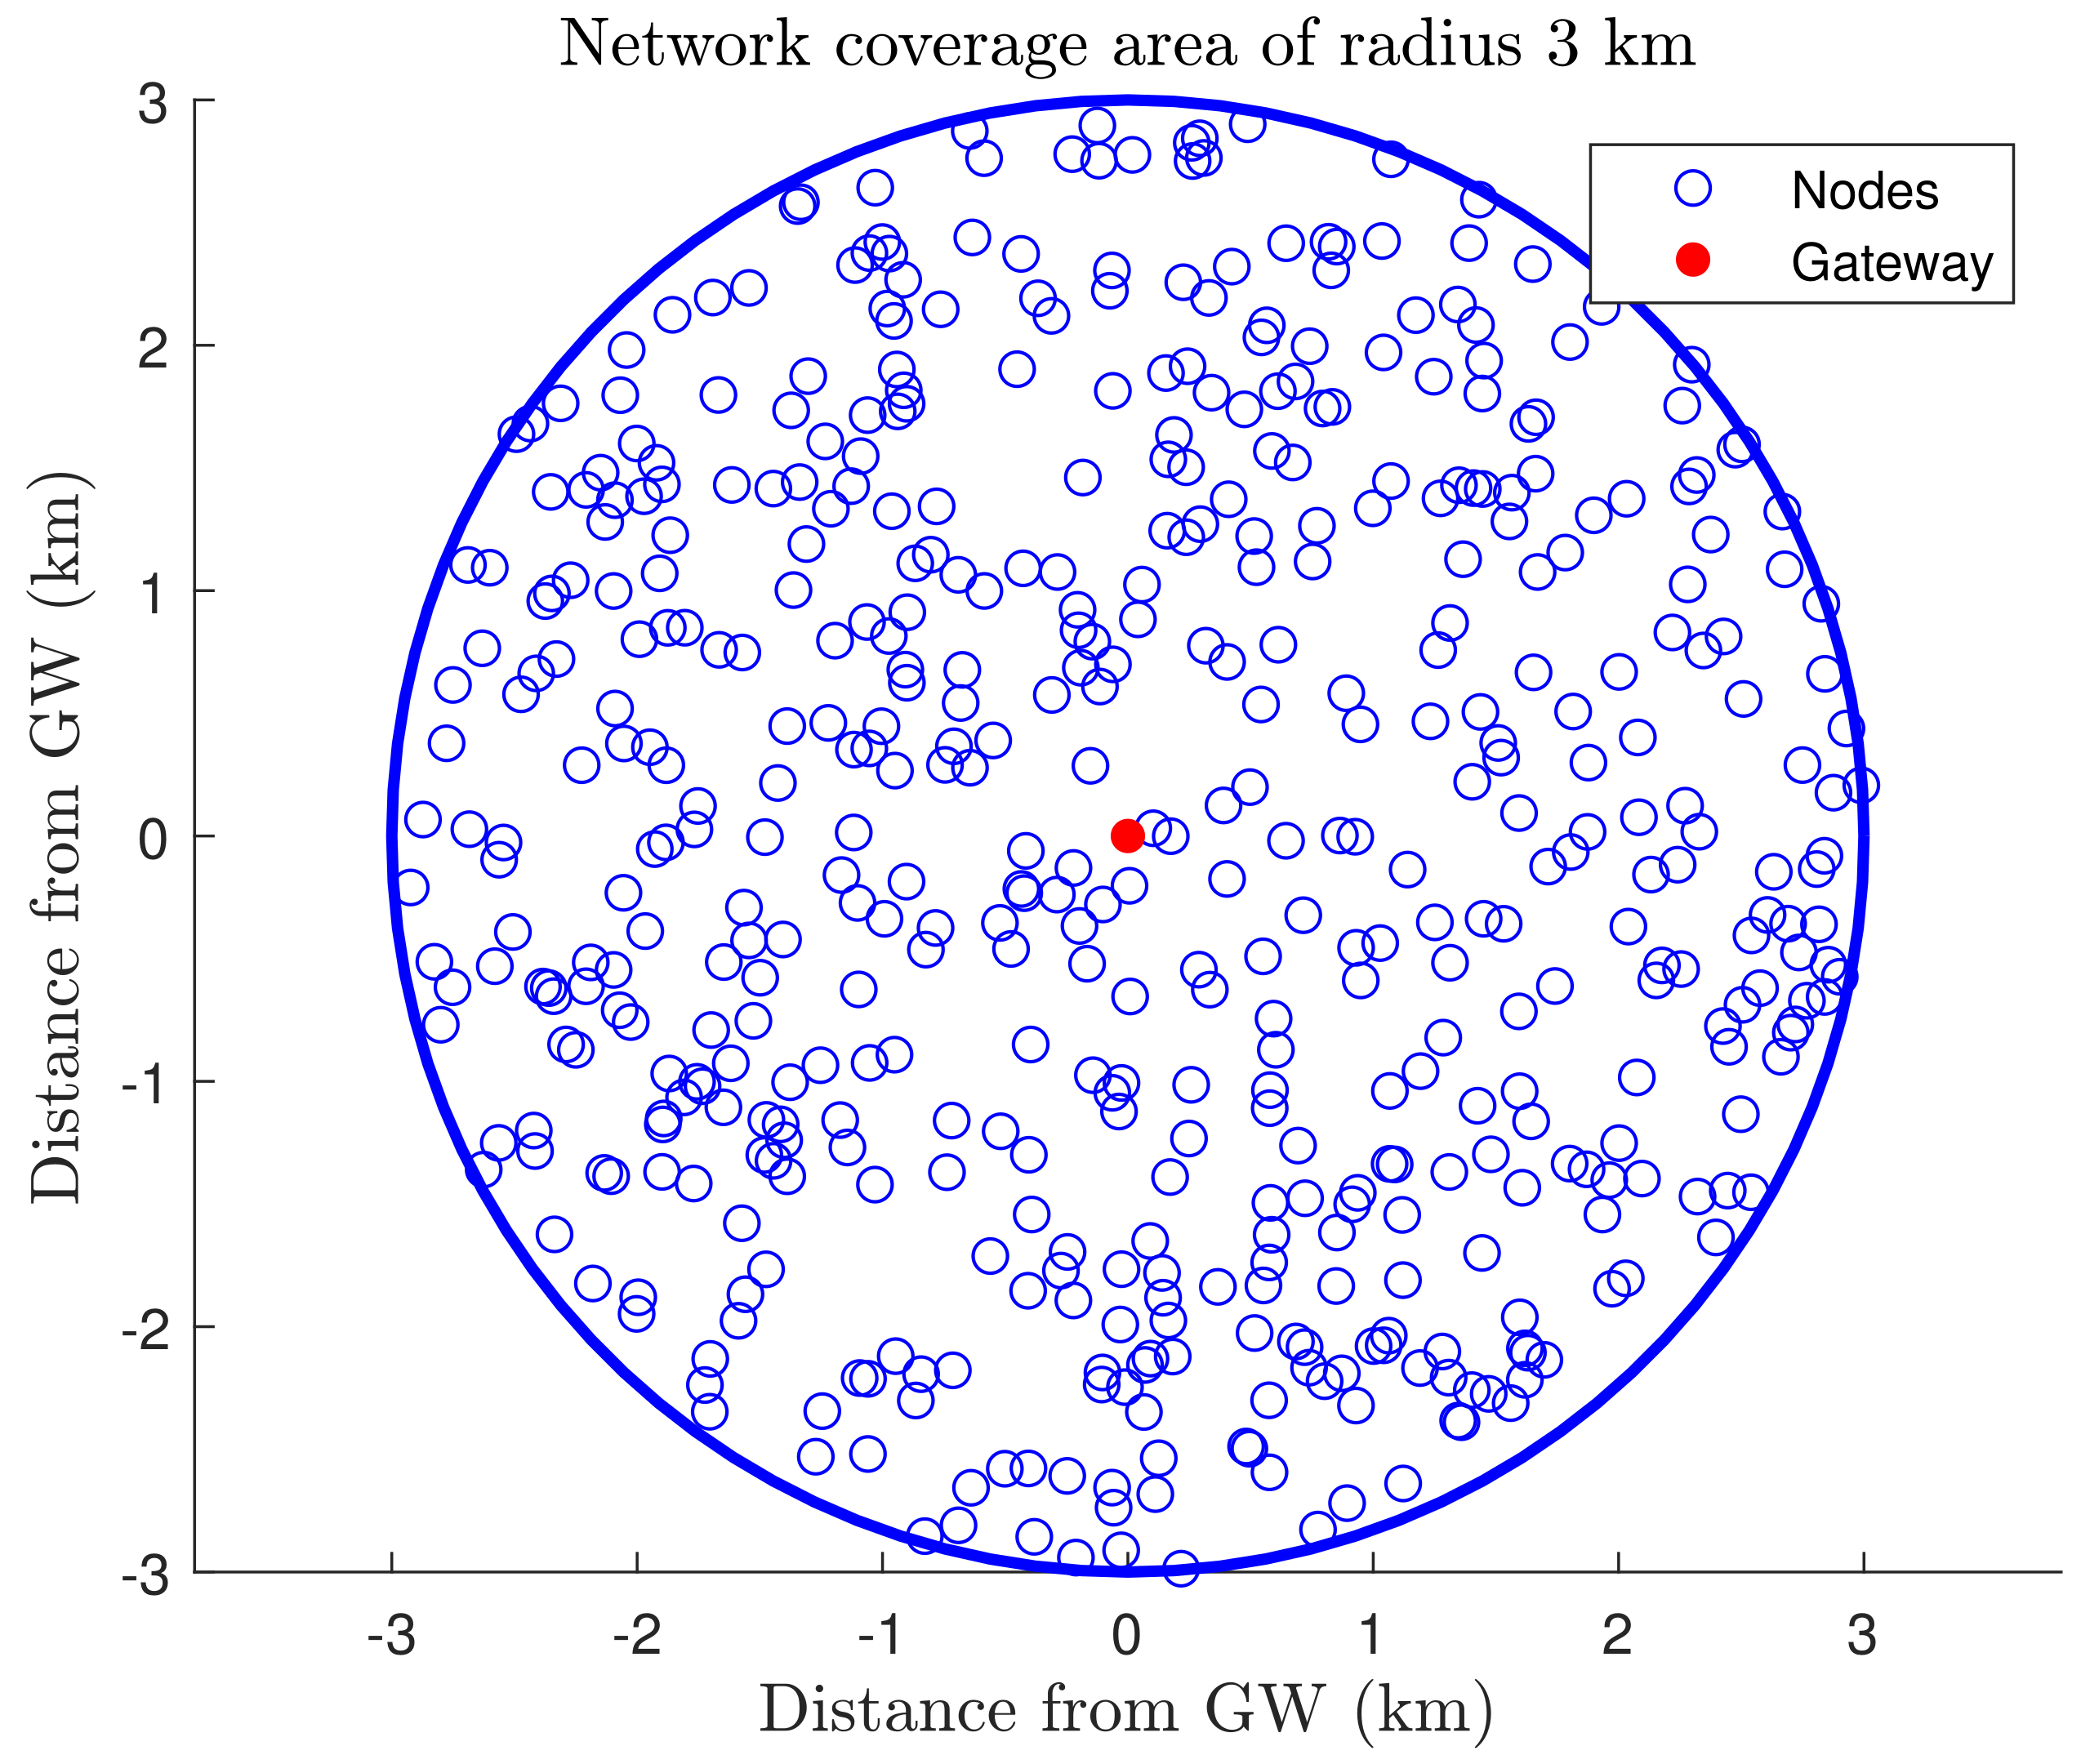
| Input: : = uniformly deployed nodes | |
| Output:L: = | |
| 1: : = R | |
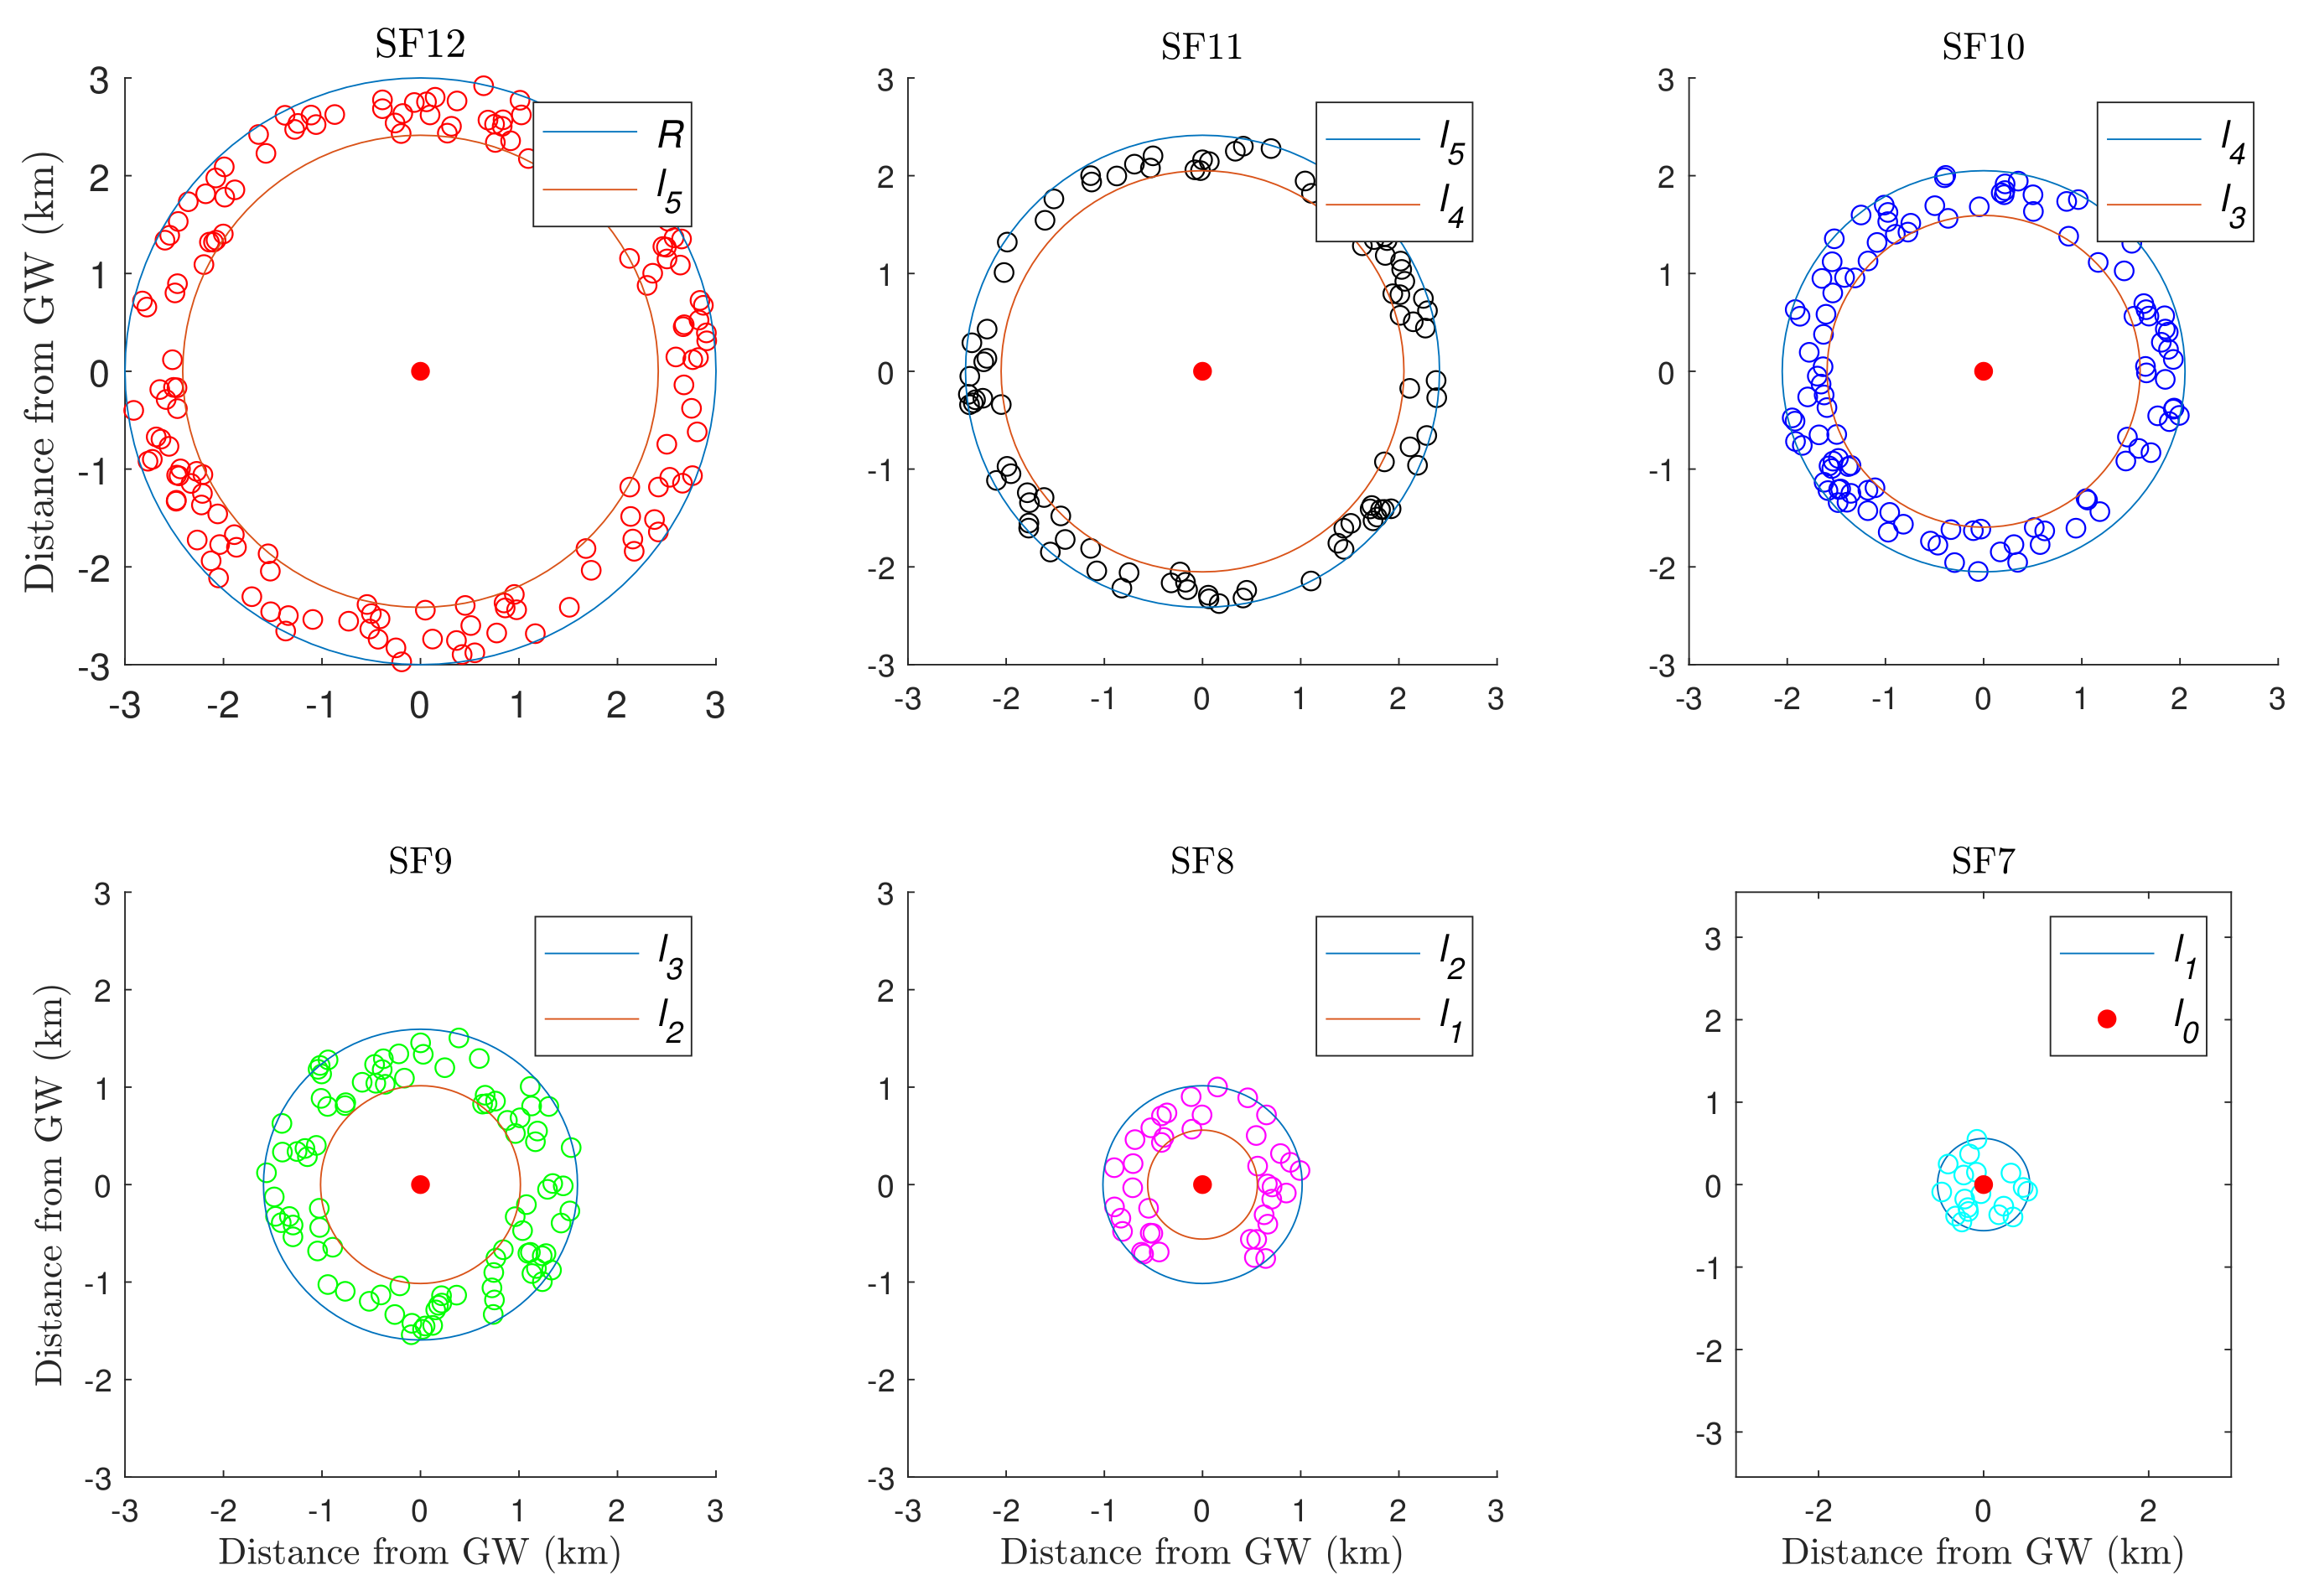
| 2: for i in do | ▹ For each SF ring, starting from the outermost ring |
| 3: K: = GetKfromSeries(i) | ▹ Set number of centroids for this iteration |
| 4: C: = Kmeans(, K) | ▹ Compute the centroids |
| 5: B: = boundary(C) | ▹ Compute the boundary of C |
| 6: I: = | ▹ Select nodes that are inside the boundary B |
| 7: | ▹ Compute the new SF ring limit |
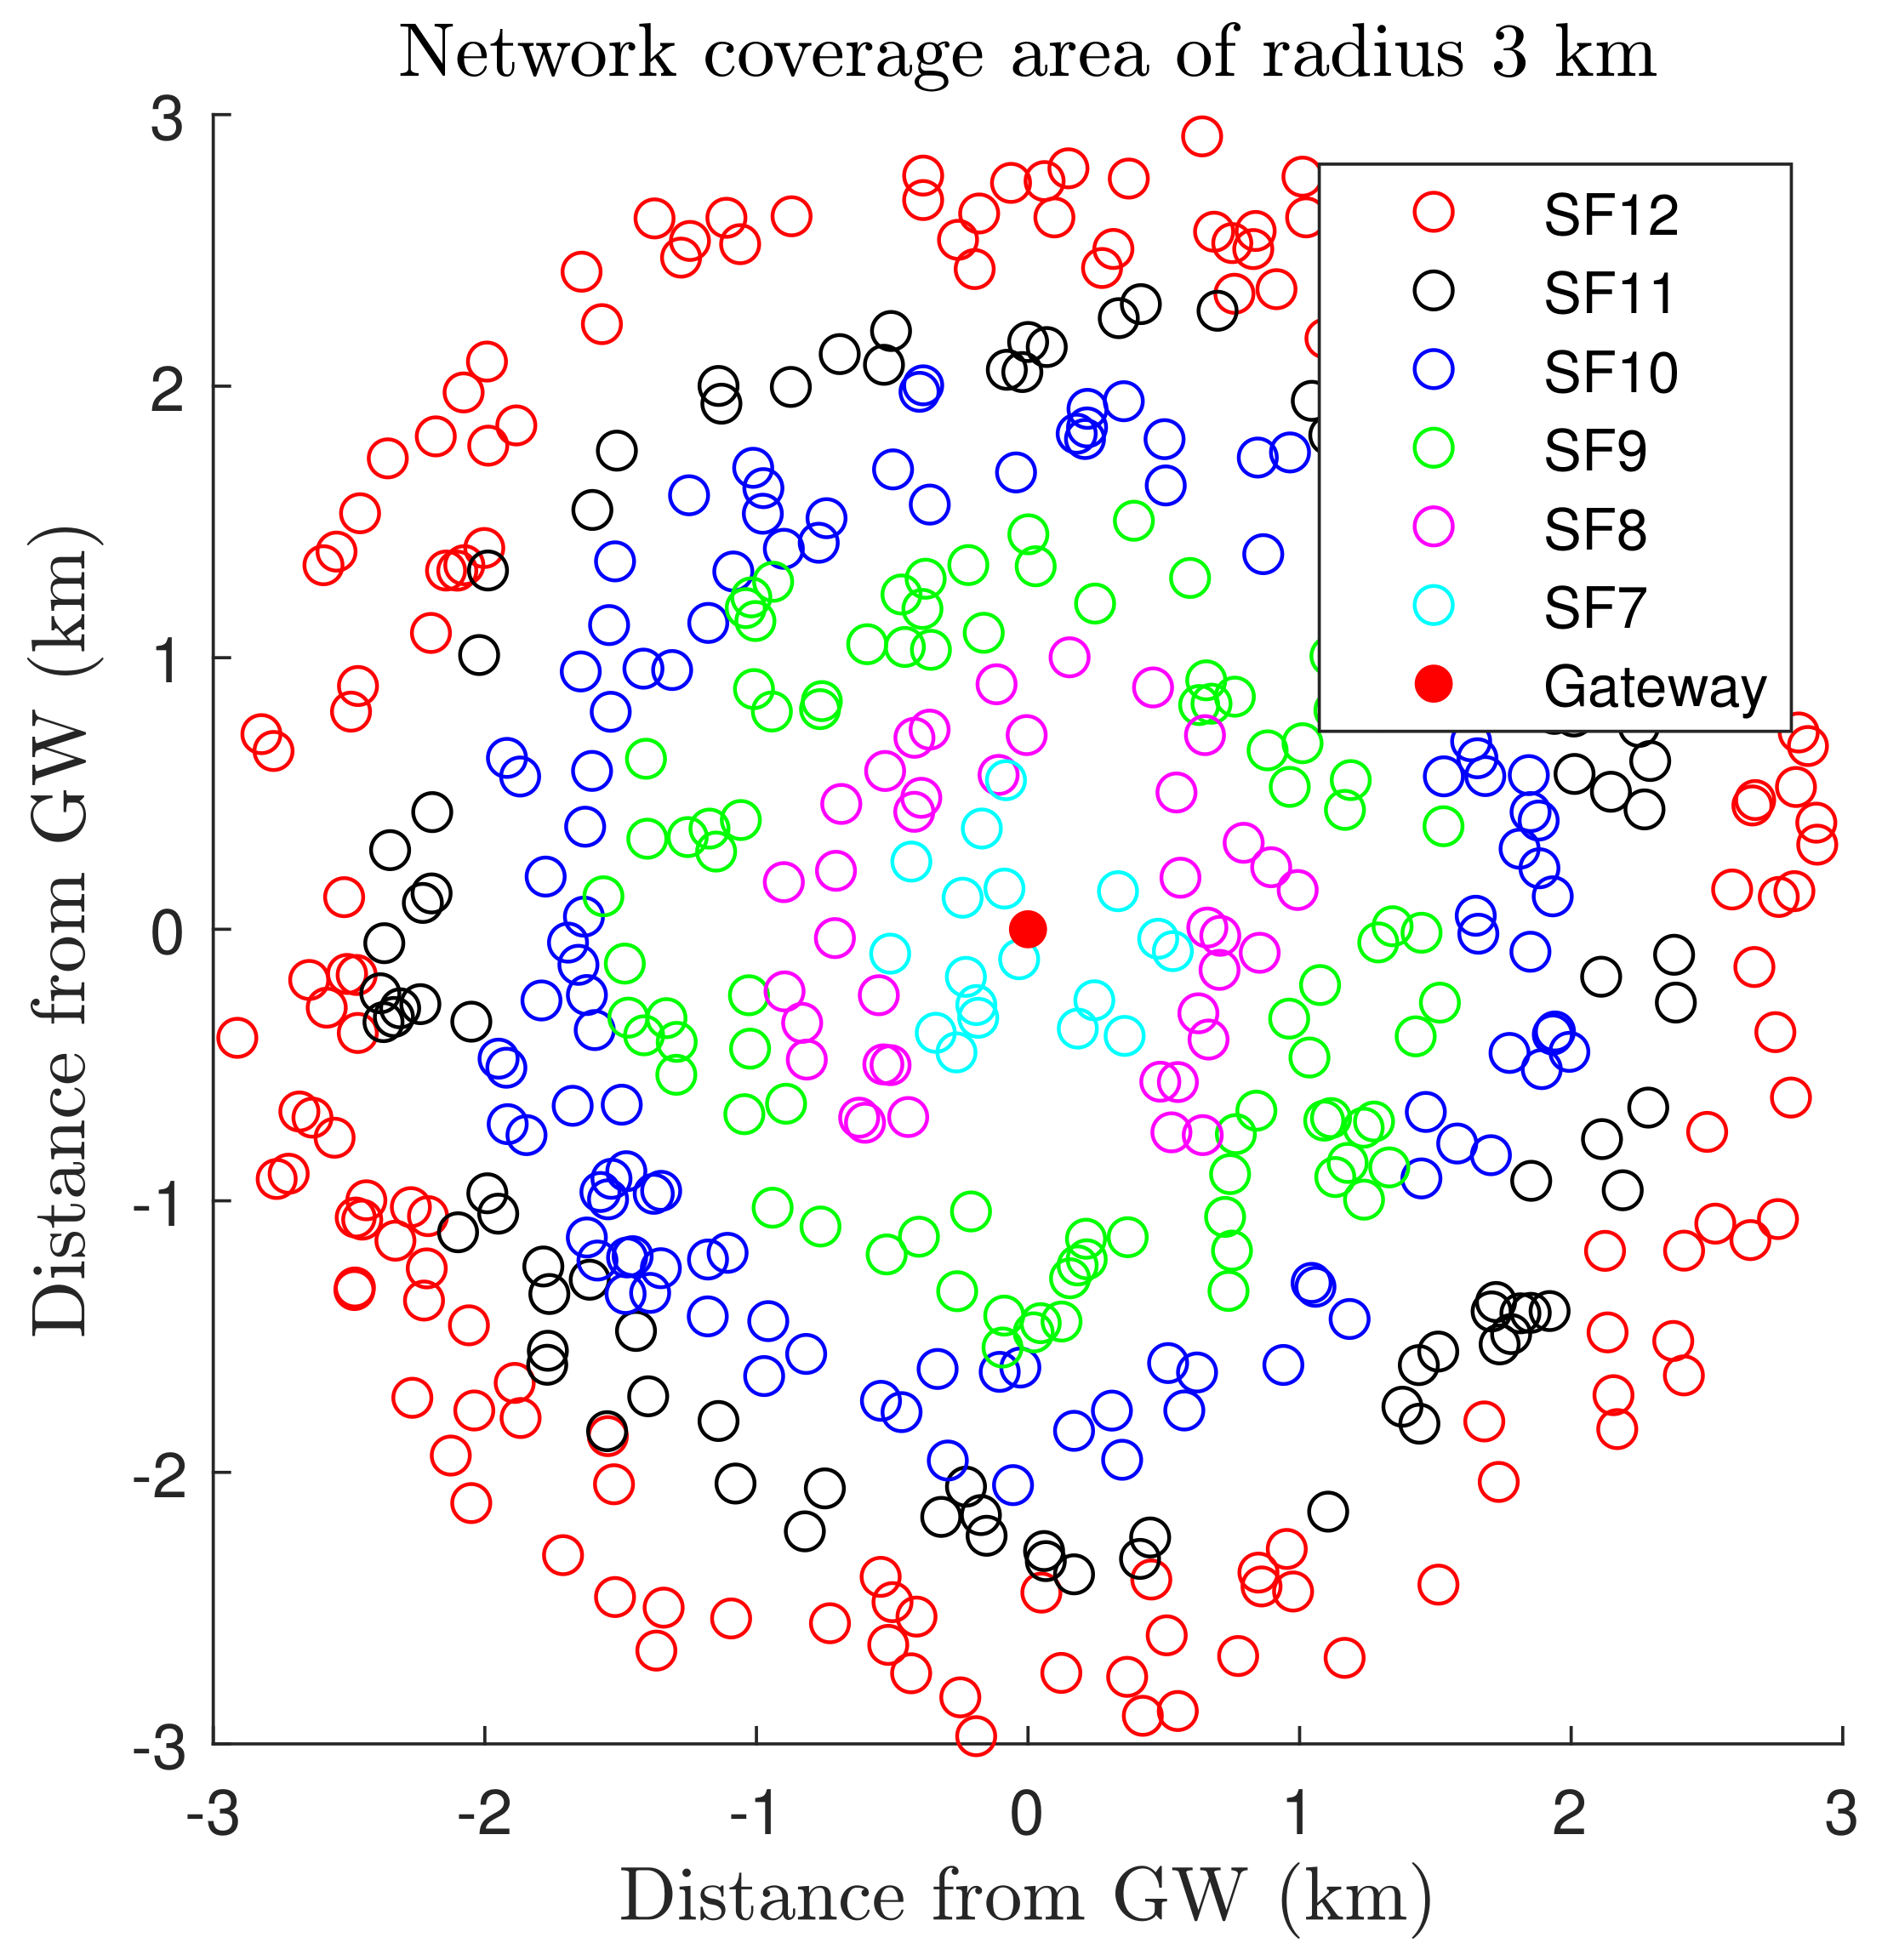
| 8: : = | ▹ Allocate to nodes outside the circle of radius |
| 9: : = | ▹ Remove nodes outside the circle of radius |
| 10: : = 0 | |
| 11: : = | ▹ Allocate to remaining nodes |
| 12: return L |
5. Numerical Results and Discussion
5.1. SF Allocation and Scalability Analysis
5.2. Performance Analysis
5.3. Discussion
6. Conclusions
Author Contributions
Funding
Conflicts of Interest
References
- Chen, S.; Xu, H.; Liu, D.; Hu, B.; Wang, H. A Vision of IoT: Applications, Challenges, and Opportunities With China Perspective. IEEE Internet Things J. 2014, 1, 349–359. [Google Scholar] [CrossRef]
- Sisinni, E.; Saifullah, A.; Han, S.; Jennehag, U.; Gidlund, M. Industrial Internet of Things: Challenges, Opportunities, and Directions. IEEE Trans. Ind. Inf. 2018, 14, 4724–4734. [Google Scholar] [CrossRef]
- Sotres, P.; Lanza, J.; Sánchez, L.; Santana, J.R.; López, C.; Muñoz, L. Breaking Vendors and City Locks through a Semantic-enabled Global Interoperable Internet-of-Things System: A Smart Parking Case. Sensors 2019, 19, 229. [Google Scholar] [CrossRef] [PubMed]
- Rodrigues, J.J.P.C.; De Rezende Segundo, D.B.; Junqueira, H.A.; Sabino, M.H.; Prince, R.M.; Al-Muhtadi, J.; De Albuquerque, V.H.C. Enabling Technologies for the Internet of Health Things. IEEE Access 2018, 6, 13129–13141. [Google Scholar] [CrossRef]
- Asadullah, M.; Ullah, K. Smart home automation system using Bluetooth technology. In Proceedings of the 2017 International Conference on Innovations in Electrical Engineering and Computational Technologies (ICIEECT), Karachi, Pakistan, 5–7 April 2017; pp. 1–6. [Google Scholar]
- Saha, H.N.; Mandal, A.; Sinha, A. Recent trends in the Internet-of-Things. In Proceedings of the 2017 IEEE 7th Annual Computing and Communication Workshop and Conference (CCWC), Las Vegas, NV, USA, 9–11 January 2017; pp. 1–4. [Google Scholar]
- Internet of Things (IoT) Connected Devices Installed Base Worldwide from 2015 to 2025 (in Billions). Available online: https://www.statista.com (accessed on 16 October 2019).
- Yasmin, R.; Petäjäjärvi, J.; Mikhaylov, K.; Pouttu, A. On the integration of LoRaWAN with the 5G test network. In Proceedings of the 2017 IEEE 28th Annual International Symposium on Personal, Indoor, and Mobile Radio Communications (PIMRC), Montreal, QC, Canada, 8–13 October 2017; pp. 1–6. [Google Scholar]
- Mikhaylov, K.; Petrov, V.; Gupta, R.; Lema, M.A.; Galinina, O.; Andreev, S.; Koucheryavy, Y.; Valkama, M.; Pouttu, A.; Dohler, M. Energy Efficiency of Multi-Radio Massive Machine-Type Communication (MR-MMTC): Applications, Challenges, and Solutions. IEEE Commun. Mag. 2019, 57, 100–106. [Google Scholar] [CrossRef]
- Vangelista, L.; Zanella, A.; Zorzi, M. Long-range IoT technologies: The dawn of LoRa. In Proceedings of the Future Access Enablers for Ubiquitous and Intelligent Infrastructures, Cham, Switzerland, 23–25 September 2015; pp. 51–58. [Google Scholar]
- Petajajarvi, J.; Mikhaylov, K.; Roivainen, A.; Hanninen, T.; Pettissalo, M. On the coverage of LPWANs: Range evaluation and channel attenuation model for LoRa technology. In Proceedings of the 2015 14th International Conference on ITS Telecommunications (ITST), Copenhagen, Denmark, 2–4 December 2015; pp. 55–59. [Google Scholar]
- Lauridsen, M.; Vejlgaard, B.; Kovacs, I.Z.; Nguyen, H.; Mogensen, P. Interference Measurements in the European 868 MHz ISM Band with Focus on LoRa and SigFox. In Proceedings of the 2017 IEEE Wireless Communications and Networking Conference (WCNC), San Francisco, CA, USA, 19–22 March 2017; pp. 1–6. [Google Scholar]
- Cattani, M.; Boano, C.A.; Romer, K. An experimental evaluation of the reliability of lora long-range low-power wireless communication. J. Sens. Actuator Netw. 2017, 6, 7. [Google Scholar] [CrossRef]
- AN1200.22 LoRa™ Modulation Basics, Rev. 2. Semtech. 2015. Available online: http://www.semtech.com/uploads/documents/an1200.22.pdf (accessed on 31 July 2019).
- LoRa Alliance. Available online: http://www.lora-alliance.org (accessed on 30 September 2019).
- Phung, K.H.; Tran, H.; Nguyen, Q.; Huong, T.T.; Nguyen, T.L.; Nguyen, H. Analysis and assessment of LoRaWAN. In Proceedings of the 2018 2nd International Conference on Recent Advances in Signal Processing, Telecommunications & Computing (SigTelCom), Ho Chi Minh City, Vietnam, 29–31 January 2018; pp. 241–246. [Google Scholar]
- LoRa Technology Is Connecting Our Smart Planet. Available online: https://www.semtech.com/lora/lora-applications (accessed on 31 July 2019).
- de Castro Tomé, M.; Nardelli, P.H.J.; Alves, H. Long-Range Low-Power Wireless Networks and Sampling Strategies in Electricity Metering. IEEE Trans. Ind. Electron. 2019, 66, 1629–1637. [Google Scholar] [CrossRef]
- Georgiou, O.; Raza, U. Low-Power Wide-Area Network Analysis: Can LoRa Scale? IEEE Wirel. Commun. Lett. 2017, 6, 162–165. [Google Scholar] [CrossRef]
- Hoeller, A.; Souza, R.D.; Alcaraz López, O.L.; Alves, H.; de Noronha Neto, M.; Brante, G. Analysis and Performance Optimization of LoRa Networks With Time and Antenna Diversity. IEEE Access 2018, 6, 32820–32829. [Google Scholar] [CrossRef]
- Augustin, A.; Yi, J.; Clausen, T.; Townsley, W. A Study of LoRa: Long-Range & Low-Power Networks for the Internet-of-Things. Sensors 2016, 16, 1466. [Google Scholar]
- Haxhibeqiri, J.; De Poorter, E.; Moerman, I.; Hoebeke, J. A Survey of LoRaWAN for IoT: From Technology to Application. Sensors 2018, 18, 3995. [Google Scholar] [CrossRef] [PubMed]
- Mikhaylov, K.; Petaejaejaervi, J.; Haenninen, T. Analysis of Capacity and Scalability of the LoRa Low-Power Wide-Area Network Technology. In Proceedings of the 22nd European Wireless Conference, Oulu, Finland, 18–20 May 2016; pp. 1–6. [Google Scholar]
- Haxhibeqiri, J.; Karaagac, A.; Van den Abeele, F.; Joseph, W.; Moerman, I.; Hoebeke, J. LoRa indoor coverage and performance in an industrial environment: Case study. In Proceedings of the 2017 22nd IEEE International Conference on Emerging Technologies and Factory Automation (ETFA), Limassol, Cyprus, 12–15 September 2017; pp. 1–8. [Google Scholar]
- Lavric, A.; Petrariu, A.I.; Popa, V. Long Range SigFox Communication Protocol Scalability Analysis Under Large-Scale, High-Density Conditions. IEEE Access 2019, 7, 35816–35825. [Google Scholar] [CrossRef]
- Mekki, K.; Bajic, E.; Chaxel, F.; Meyer, F. A comparative study of LPWAN technologies for large-scale IoT deployment. ICT Express 2019, 5, 1–7. [Google Scholar] [CrossRef]
- Noreen, U.; Bounceur, A.; Clavier, L. A study of LoRa low-power and wide-area network technology. In Proceedings of the 2017 International Conference on Advanced Technologies for Signal and Image Processing (ATSIP), Fez, Morocco, 22–24 May 2017; pp. 1–6. [Google Scholar]
- Cuomo, F.; Campo, M.; Caponi, A.; Bianchi, G.; Rossini, G.; Pisani, P. EXPLoRa: Extending the performance of LoRa by suitable spreading factor allocations. In Proceedings of the 2017 IEEE 13th International Conference on Wireless and Mobile Computing, Networking and Communications (WiMob), Rome, Italy, 9–11 October 2017; pp. 1–8. [Google Scholar]
- Cuomo, F.; Gámez, J.C.C.; Maurizio, A.; Scipione, L.; Campo, M.; Caponi, A.; Bianchi, G.; Rossini, G.; Pisani, P. Towards traffic-oriented spreading factor allocations in LoRaWAN systems. In Proceedings of the 2018 17th Annual Mediterranean Ad Hoc Networking Workshop (Med-Hoc-Net), Capri, Italy, 20–22 June 2018; pp. 1–8. [Google Scholar]
- Kim, D.Y.; Kim, S. Data Transmission Using K-Means Clustering in Low Power Wide Area Networks with Mobile Edge Cloud. Wirel. Pers. Commun. 2018, 105, 567–581. [Google Scholar] [CrossRef]
- Farhad, A.; Kim, D.; Pyun, J. Scalability of LoRaWAN in an Urban Environment: A Simulation Study. In Proceedings of the 2019 Eleventh International Conference on Ubiquitous and Future Networks (ICUFN), Zagreb, Croatia, 2–5 July 2019; pp. 677–681. [Google Scholar]
- Magrin, D.; Centenaro, M.; Vangelista, L. Performance evaluation of LoRa networks in a smart city scenario. In Proceedings of the 2017 IEEE International Conference on Communications (ICC), Paris, France, 21–25 May 2017; pp. 1–7. [Google Scholar]
- Zhu, G.; Liao, C.-H.; Sakdejayont, T.; Lai, I.-W.; Narusue, Y.; Morikawa, H. Improving the Capacity of a Mesh LoRa Network by Spreading-Factor-Based Network Clustering. IEEE Access 2019, 7, 21584–21596. [Google Scholar] [CrossRef]
- Vincenzo, V.D.; Heusse, M.; Tourancheau, B. Improving Downlink Scalability in LoRaWAN. In Proceedings of the ICC 2019—2019 IEEE International Conference on Communications (ICC), Shanghai, China, 20–24 May 2019; pp. 1–7. [Google Scholar]
- Hasegawa, Y.; Suzuki, K. A Multi-User ACK-Aggregation Method for Large-Scale Reliable LoRaWAN Service. In Proceedings of the ICC 2019—2019 IEEE International Conference on Communications (ICC), Shanghai, China, 20–24 May 2019; pp. 1–7. [Google Scholar]
- Li, L.; Ren, J.; Zhu, Q. On the application of LoRa LPWAN technology in sailing monitoring system. In Proceedings of the 13th Annual Conference on Wireless On-demand Network Systems and Services (WONS), Jackson, WY, USA, 21–24 February 2017; pp. 77–80. [Google Scholar]
- Yasmin, R.; Petäjäjärvi, J.; Mikhaylov, K.; Pouttu, A. Large and Dense LoRaWAN Deployment to Monitor Real Estate Conditions and Utilization Rate. In Proceedings of the 2018 IEEE 29th Annual International Symposium on Personal, Indoor and Mobile Radio Communications (PIMRC), Bologna, Italy, 9–12 September 2018. [Google Scholar]
- Abramson, N. The Aloha System—Another alternative for computer communications. In Proceedings of the FallJoint Computer Conference (AFIPS ’70 (Fall)), New York, NY, USA, 17–19 November 1970; pp. 281–285. [Google Scholar]
- Goursaud, C.; Gorce, J.M. Dedicated networks for IoT: PHY/MAC state of the art and challenges. EAI Endorsed Trans. Internet Things 2015, 1. [Google Scholar] [CrossRef]
- Na, S.; Xumin, L.; Yong, G. Research on k-means Clustering Algorithm: An Improved k-means Clustering Algorithm. In Proceedings of the 2010 Third International Symposium on Intelligent Information Technology and Security Informatics, Jinggangshan, China, 2–4 April 2010; pp. 63–67. [Google Scholar]
- Bouguera, T.; Diouris, J.F.; Chaillout, J.J.; Jaouadi, R.; Andrieux, G. Energy Consumption Model for Sensor Nodes Based on LoRa and LoRaWAN. Sensors 2018, 18, 2104. [Google Scholar] [CrossRef] [PubMed]


| SF (i) | Bit Rate kbps () | Receiver Sensitivity dBm | SNR dB () | Range km |
|---|---|---|---|---|
| 7 | 5.47 | −123 | −6 | |
| 8 | 3.13 | −126 | −9 | |
| 9 | 1.76 | −129 | −12 | |
| 10 | 0.98 | −132 | −15 | |
| 11 | 0.54 | −134.5 | −17.5 | |
| 12 | 0.29 | −137 | −20 | > |
| Iteration Series | 1st SF12 | 2nd SF11 | 3rd SF10 | 4th SF9 | 5th SF8 |
|---|---|---|---|---|---|
| Fibonacci series | 34 | 21 | 13 | 8 | 5 |
| Square number | 49 | 36 | 25 | 16 | 9 |
| Arithmetic series | 34 | 28 | 22 | 16 | 10 |
| Wythoff array | 37 | 32 | 24 | 16 | 11 |
| Parameter | Symbol | Value |
|---|---|---|
| Nodes | 300–700 | |
| Spreading Factor | SF | 7–12 |
| Bandwidth | 125 kHz | |
| Carrier frequency | f | 868 MHz |
| Noise figure | 6 dBm | |
| Transmit power | 14 dBm | |
| Duty cycle | 1% | |
| Path loss exponent | 2.75 |
| Series | SF7 | SF8 | SF9 | SF10 | SF11 | SF12 | |
|---|---|---|---|---|---|---|---|
| 300 | 18 | 19 | 48 | 66 | 75 | 77 | |
| Fibonacci series | 500 | 29 | 35 | 79 | 107 | 124 | 129 |
| 700 | 40 | 51 | 110 | 148 | 173 | 180 | |
| 300 | 44 | 24 | 43 | 52 | 63 | 77 | |
| Arithmetic series | 500 | 69 | 42 | 70 | 87 | 107 | 129 |
| 700 | 94 | 61 | 98 | 121 | 149 | 180 | |
| 300 | 53 | 33 | 55 | 44 | 58 | 61 | |
| Square numbers | 500 | 81 | 57 | 87 | 75 | 99 | 105 |
| 700 | 111 | 81 | 121 | 105 | 137 | 148 | |
| 300 | 49 | 24 | 45 | 52 | 60 | 73 | |
| Wythoff array | 500 | 77 | 42 | 75 | 87 | 100 | 123 |
| 700 | 103 | 62 | 103 | 121 | 140 | 173 | |
| 300 | 9 | 25 | 42 | 59 | 76 | 92 | |
| Reference model | 500 | 14 | 42 | 70 | 98 | 126 | 152 |
| 700 | 20 | 59 | 97 | 137 | 176 | 214 |
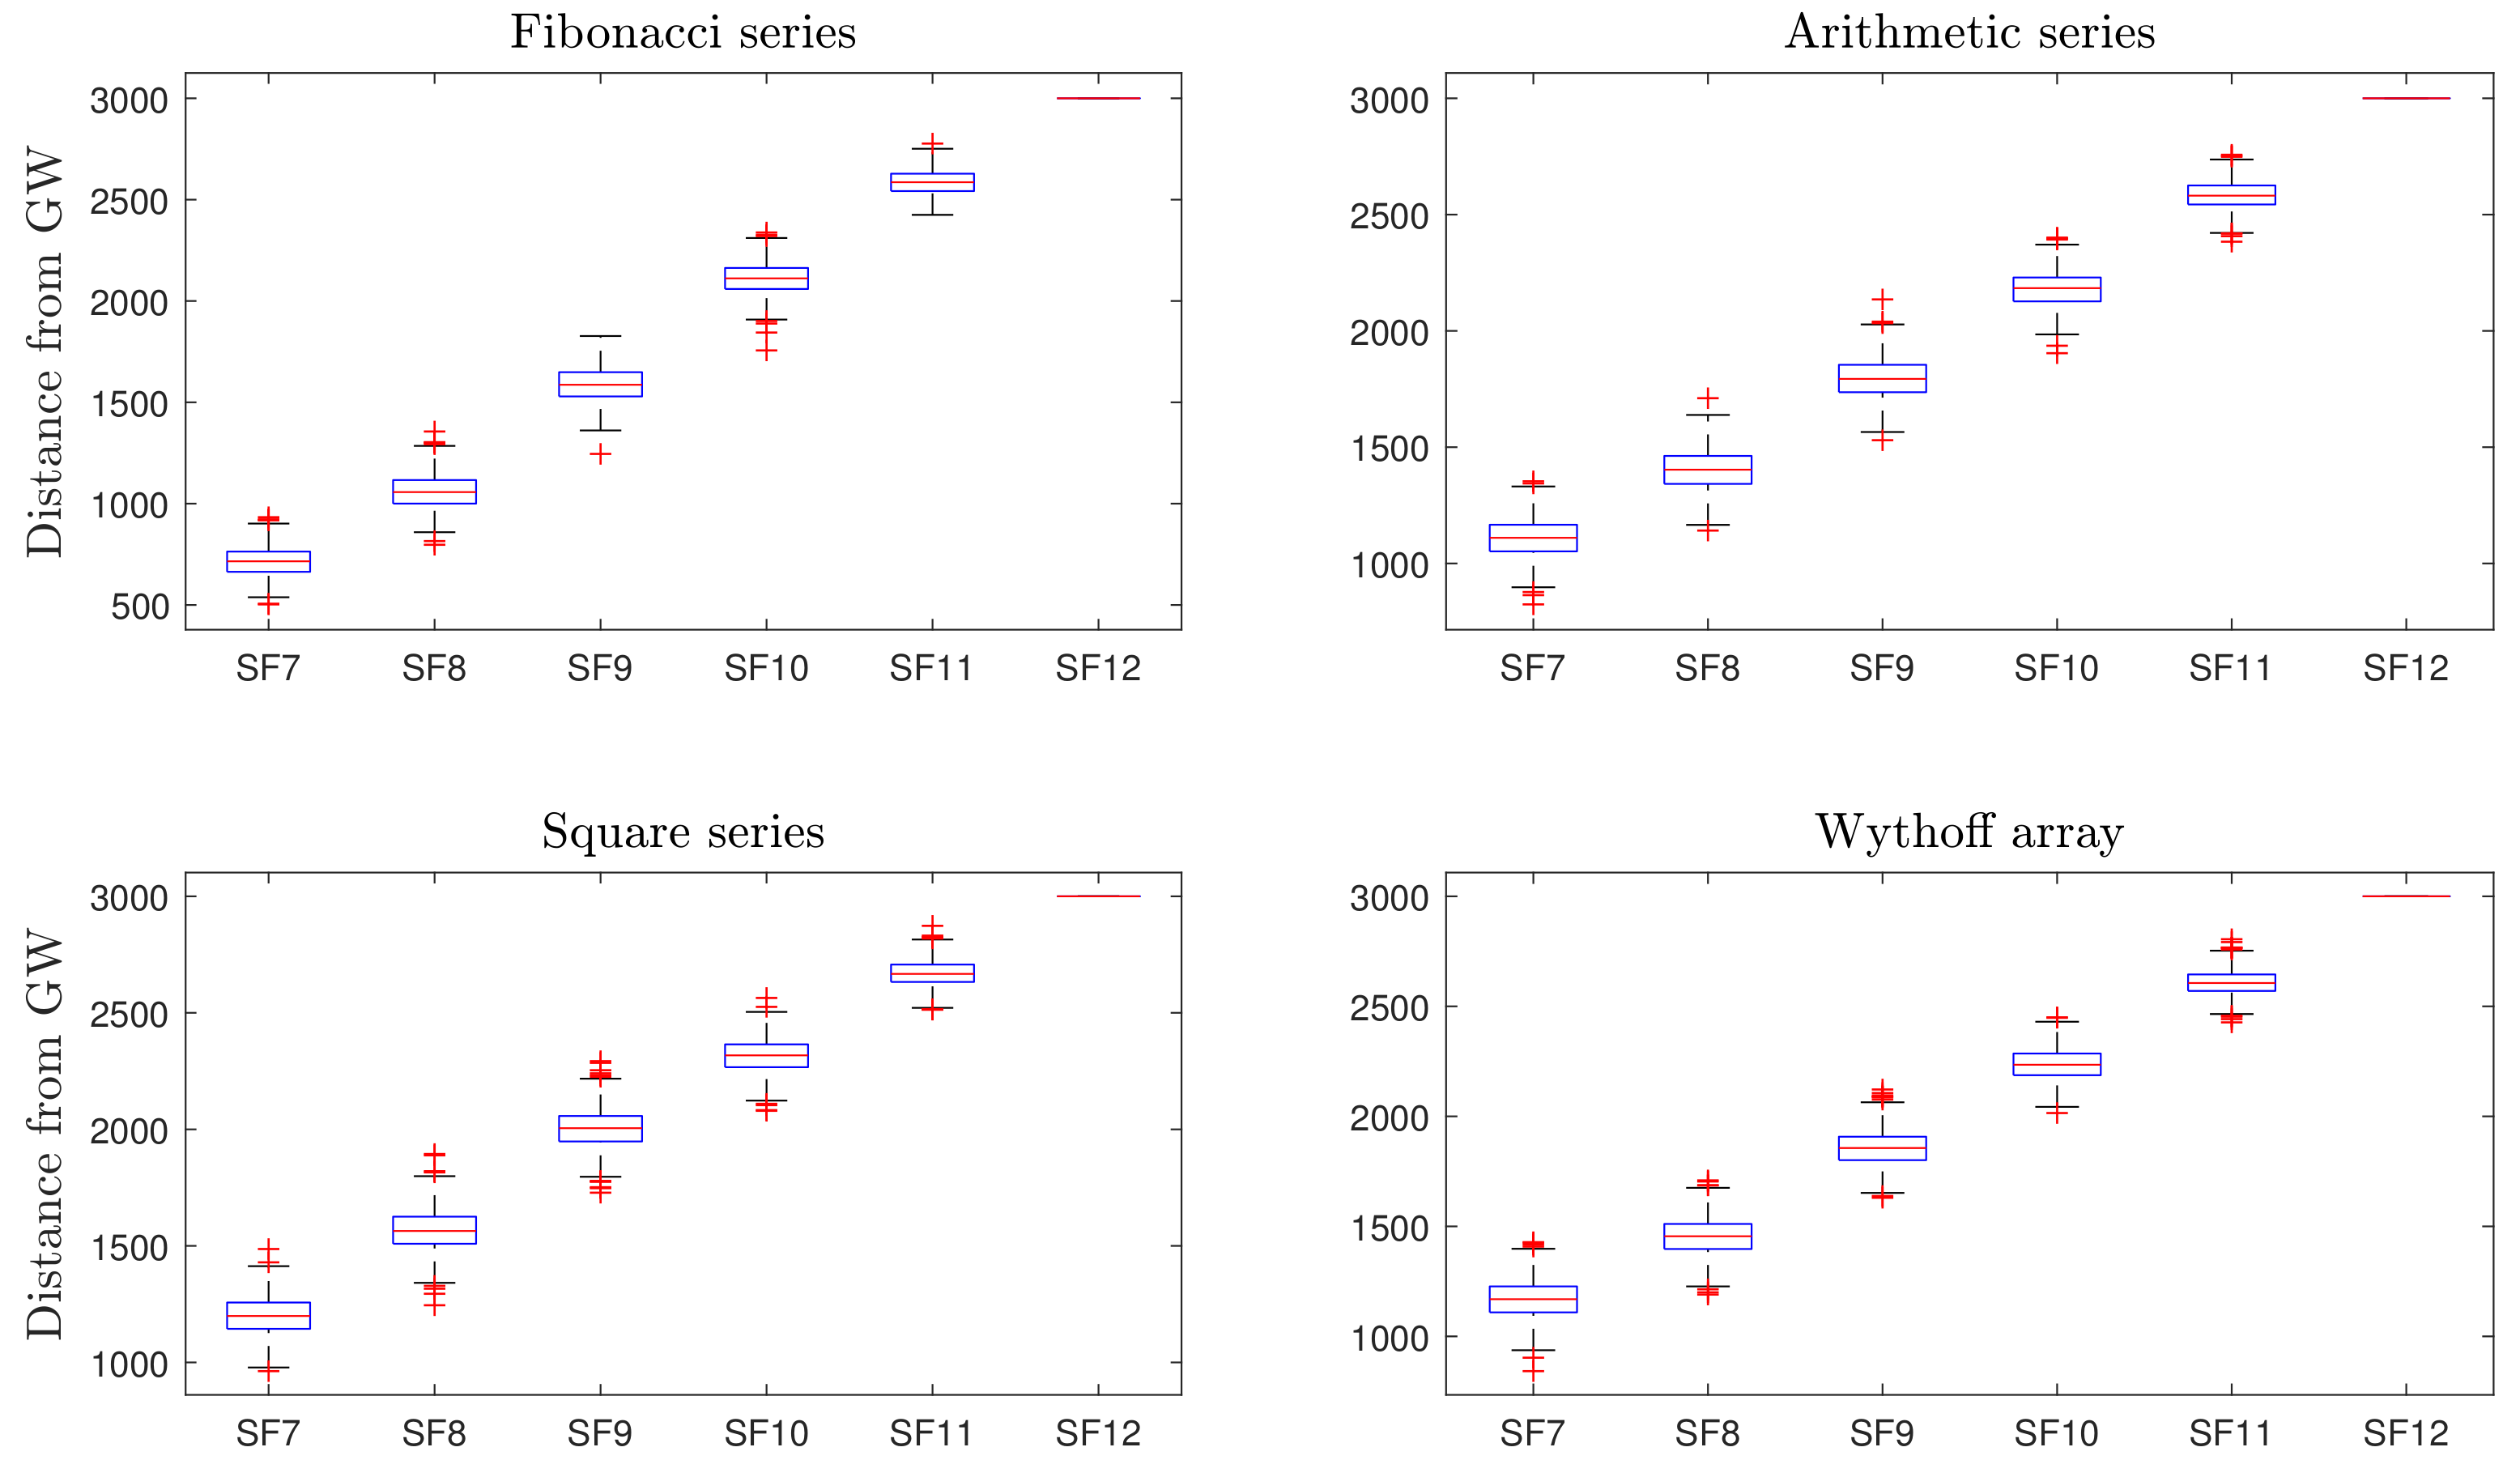
| Series | SF7 | SF8 | SF9 | SF10 | SF11 | SF12 | |
|---|---|---|---|---|---|---|---|
| 300 | 735 | 1049 | 1586 | 2112 | 2588 | 3000 | |
| Fibonacci series | 500 | 715 | 1060 | 1591 | 2112 | 2586 | 3000 |
| 700 | 707 | 1071 | 1601 | 2112 | 2587 | 3000 | |
| 300 | 1144 | 1412 | 1806 | 2194 | 2590 | 3000 | |
| Arithmetic series | 500 | 1110 | 1403 | 1795 | 2183 | 2584 | 3000 |
| 700 | 1099 | 1409 | 1801 | 2188 | 2588 | 3000 | |
| 300 | 1248 | 1591 | 2037 | 2336 | 2680 | 3000 | |
| Square numbers | 500 | 1201 | 1568 | 2004 | 2316 | 2670 | 3000 |
| 700 | 1190 | 1568 | 2002 | 2313 | 2667 | 3000 | |
| 300 | 1209 | 1469 | 1872 | 2246 | 2613 | 3000 | |
| Wythoff array | 500 | 1168 | 1453 | 1857 | 2237 | 2607 | 3000 |
| 700 | 1150 | 1450 | 1851 | 2231 | 2604 | 3000 | |
| 300 | 500 | 1000 | 1500 | 2000 | 2500 | 3000 | |
| Reference model | 500 | 500 | 1000 | 1500 | 2000 | 2500 | 3000 |
| 700 | 500 | 1000 | 1500 | 2000 | 2500 | 3000 |
© 2019 by the authors. Licensee MDPI, Basel, Switzerland. This article is an open access article distributed under the terms and conditions of the Creative Commons Attribution (CC BY) license (http://creativecommons.org/licenses/by/4.0/).
Share and Cite
Asad Ullah, M.; Iqbal, J.; Hoeller, A.; Souza, R.D.; Alves, H. K-Means Spreading Factor Allocation for Large-Scale LoRa Networks. Sensors 2019, 19, 4723. https://doi.org/10.3390/s19214723
Asad Ullah M, Iqbal J, Hoeller A, Souza RD, Alves H. K-Means Spreading Factor Allocation for Large-Scale LoRa Networks. Sensors. 2019; 19(21):4723. https://doi.org/10.3390/s19214723
Chicago/Turabian StyleAsad Ullah, Muhammad, Junnaid Iqbal, Arliones Hoeller, Richard Demo Souza, and Hirley Alves. 2019. "K-Means Spreading Factor Allocation for Large-Scale LoRa Networks" Sensors 19, no. 21: 4723. https://doi.org/10.3390/s19214723
APA StyleAsad Ullah, M., Iqbal, J., Hoeller, A., Souza, R. D., & Alves, H. (2019). K-Means Spreading Factor Allocation for Large-Scale LoRa Networks. Sensors, 19(21), 4723. https://doi.org/10.3390/s19214723