Enhanced Room Temperature NO2 Sensing Performance of RGO Nanosheets by Building RGO/SnO2 Nanocomposite System


Abstract
1. Introduction
2. Experimental
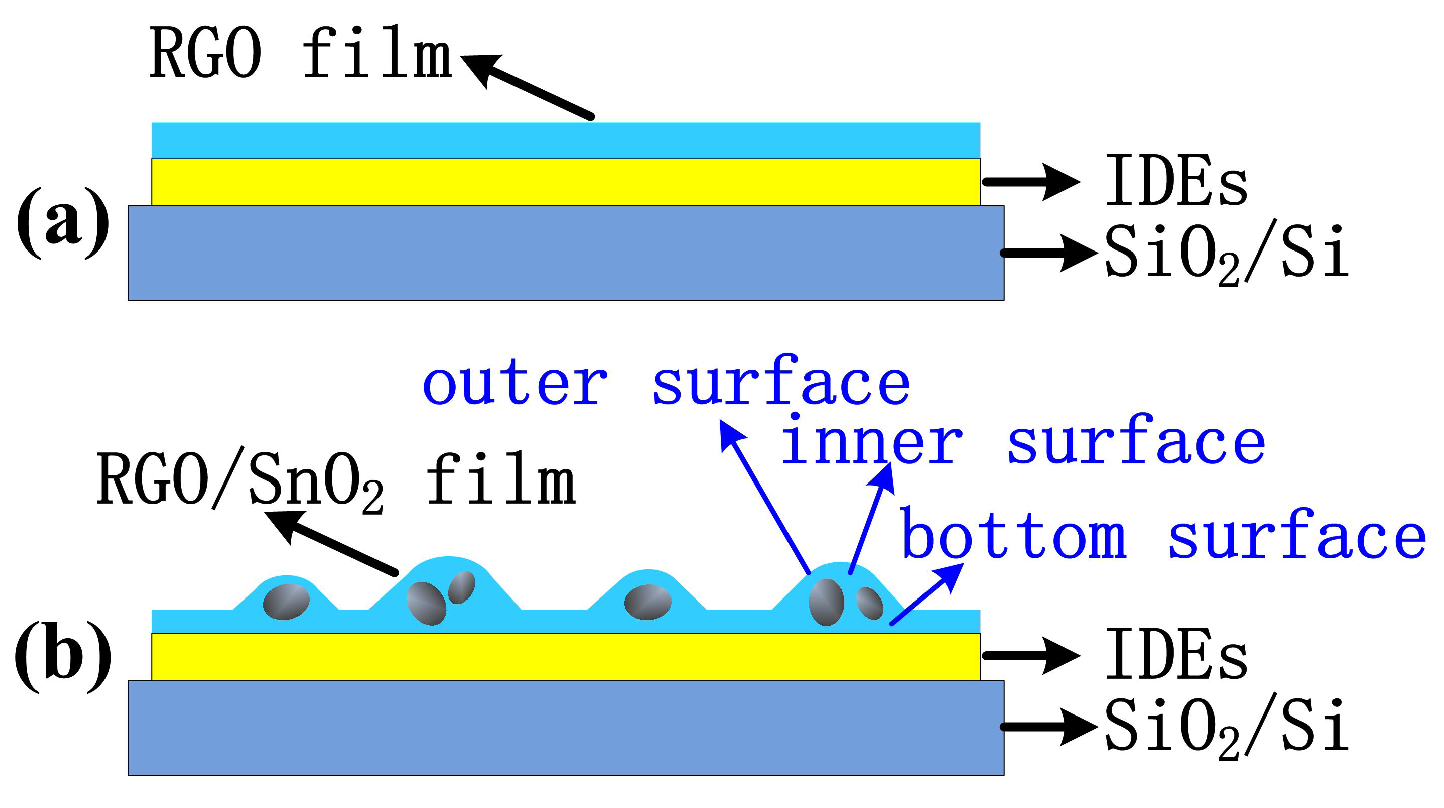
2.1. Materials Synthesis and Sensor Fabrication
2.2. Material Characterization
2.3. Test Instrument and Measurement Procedure
3. Results and Discussion
3.1. Characterizations
3.2. Influence of SnO Nanopowder Amount
3.3. Influence of Annealing
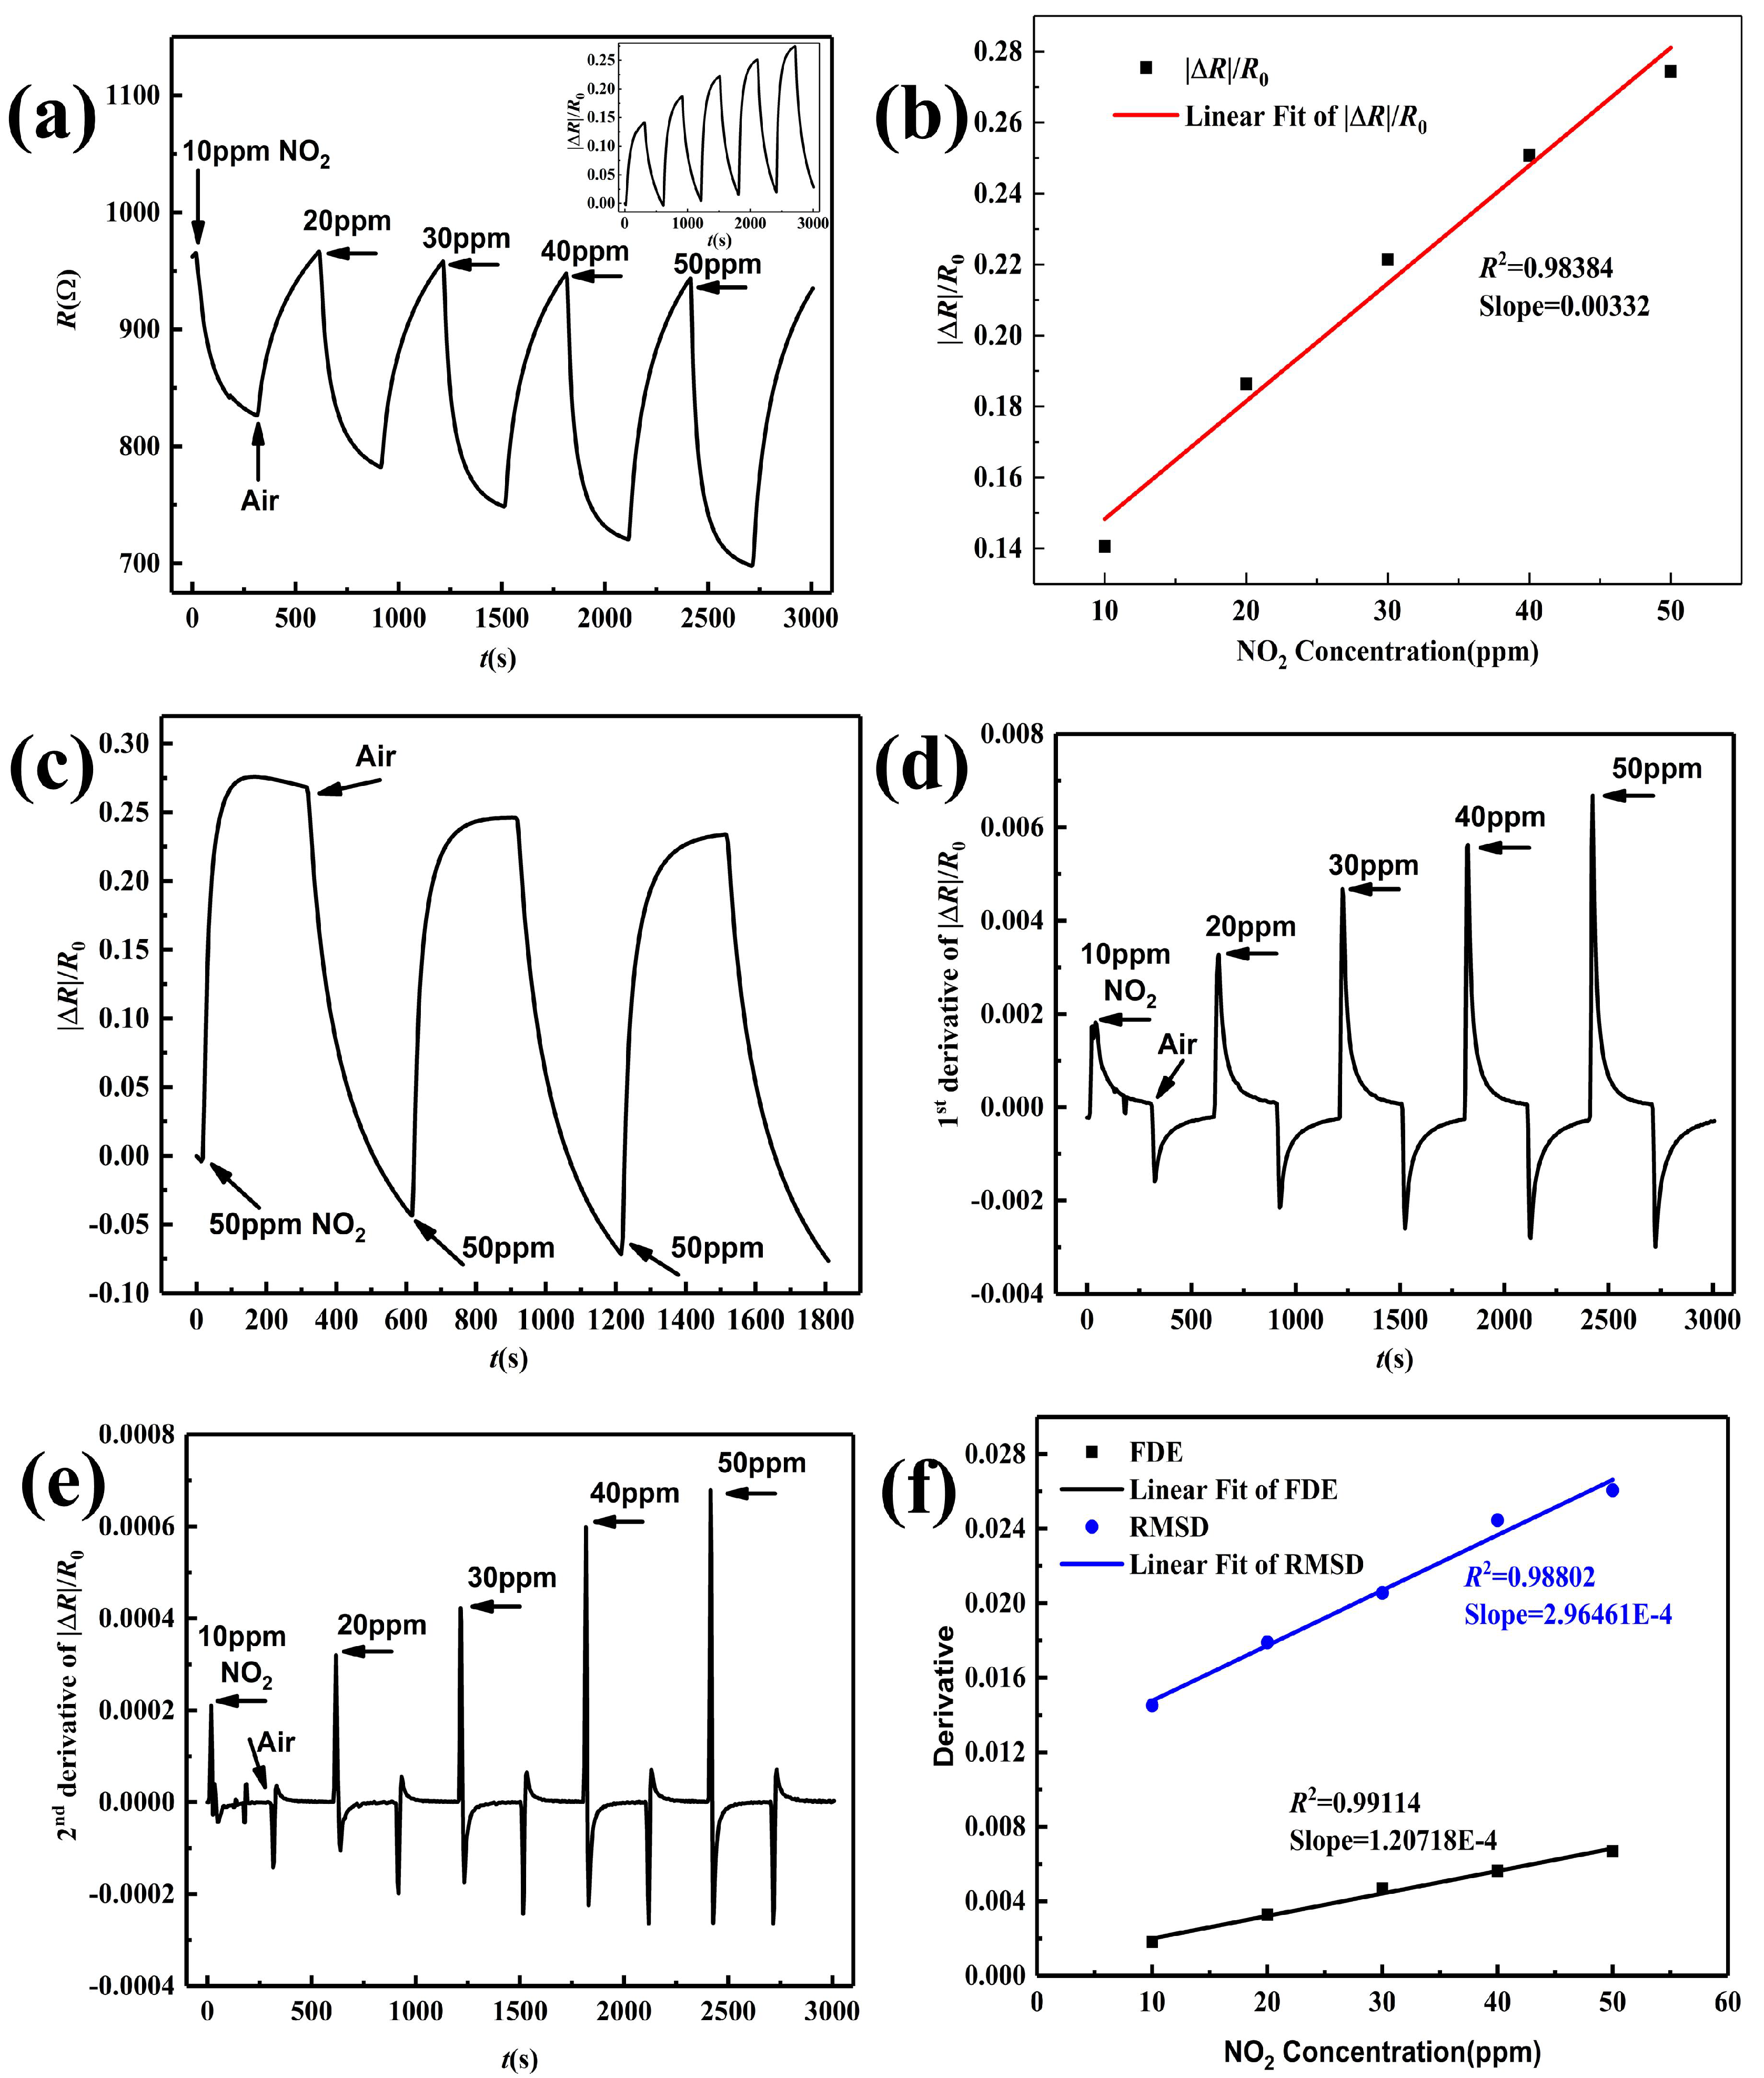
3.4. NO Sensing Performance
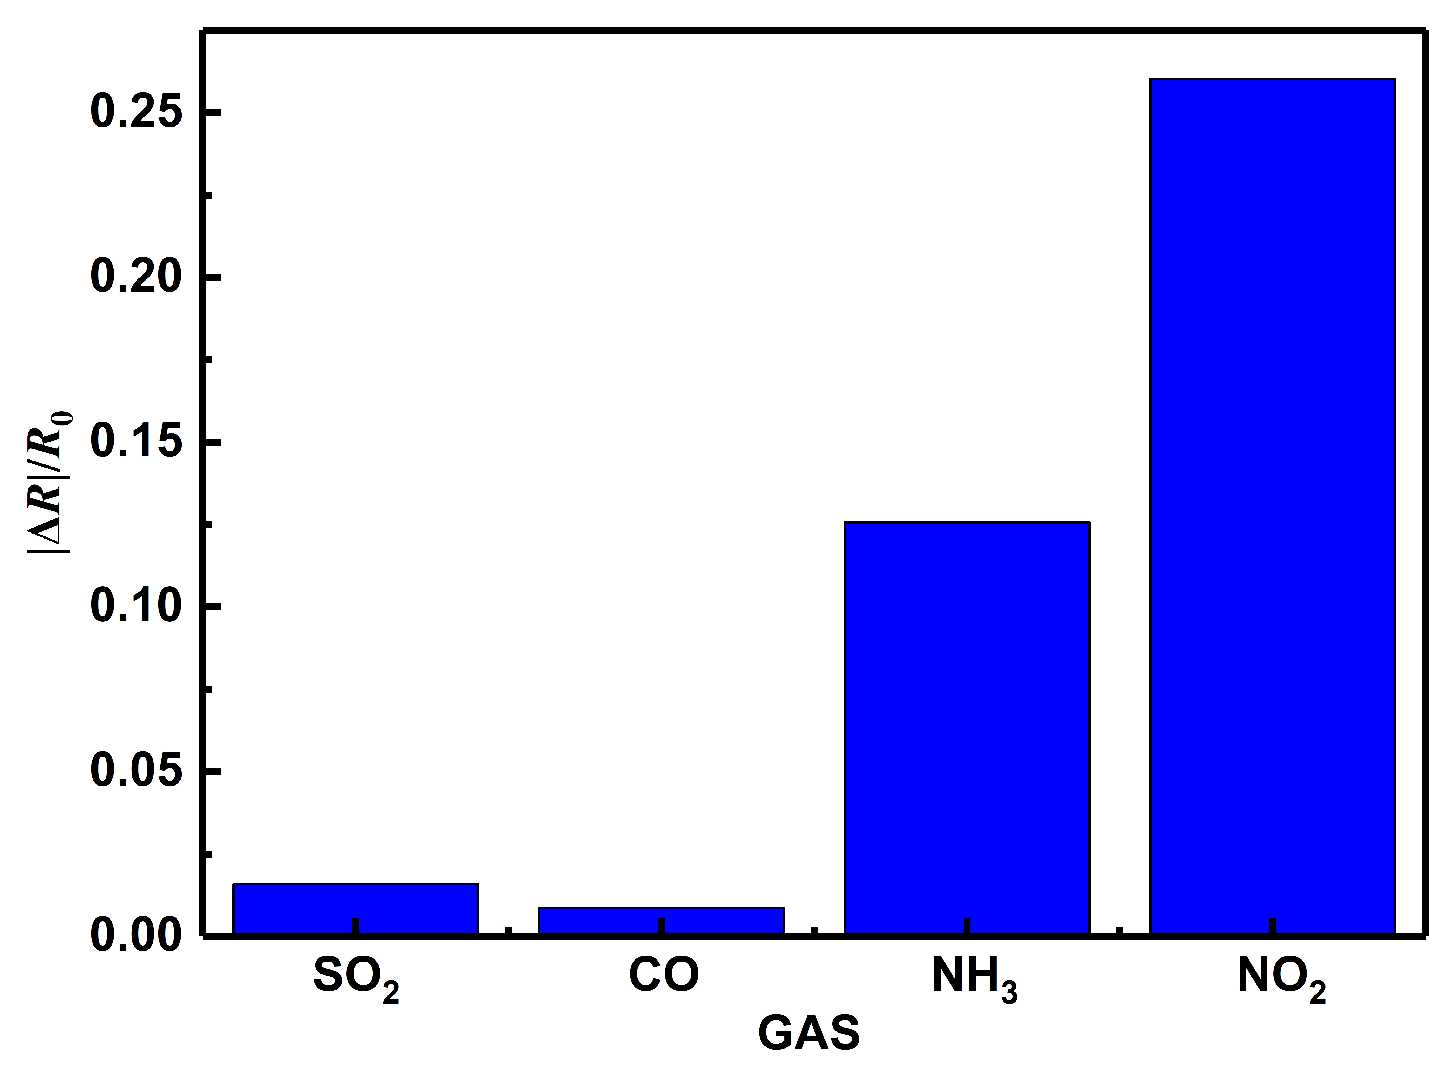
3.5. Selectivity
4. Conclusions
Author Contributions
Acknowledgments
Conflicts of Interest
References
- Nitrogen Dioxide. Available online: https://en.wikipedia.org/wiki/Nitrogen_dioxide (accessed on 26 October 2019).
- Nitrogen Dioxide. Available online: https://www.cdc.gov/niosh/idlh/10102440.html (accessed on 26 October 2019).
- Liu, X.; Cheng, S.; Liu, H.; Hu, S.; Zhang, D.; Ning, H. A survey on gas sensing technology. Sensors 2012, 12, 9635–9665. [Google Scholar] [CrossRef] [PubMed]
- Chang, Y.; Yao, Y.; Wang, B.; Luo, H.; Li, T.; Zhi, L. Reduced graphene oxide mediated SnO2 nanocrystals for enhanced gas-sensing properties. J. Mater. Sci. Technol. 2013, 29, 157–160. [Google Scholar] [CrossRef]
- Gui, Y.H.; Wang, H.Y.; Tian, K.; Yang, L.L.; Guo, H.S.; Zhang, H.Z.; Fang, S.M.; Wang, Y. Enhanced gas sensing properties to NO2 of SnO2/rGO nanocomposites synthesized by microwave-assisted gas-liquid interfacial method. Ceram. Int. J. 2018, 44, 4900–4907. [Google Scholar] [CrossRef]
- Kim, J.H.; Zheng, Y.; Mirzaei, A.; Kim, H.W.; Kim, S.S. Synthesis and selective sensing properties of rGO/metal-coloaded SnO2 nanofibers. J. Electron. Mater. 2017, 46, 3531–3541. [Google Scholar] [CrossRef]
- Tyagi, P.; Sharma, A.; Tomar, M.; Gupta, V. A comparative study of RGO-SnO2 and MWCNT-SnO2 nanocomposites based SO2 gas sensors. Sens. Actuators B Chem. 2017, 248, 980–986. [Google Scholar] [CrossRef]
- Su, P.; Yang, L. NH3 gas sensor based on Pd/SnO2/RGO ternary composite operated at room-temperature. Sens. Actuators B Chem. 2016, 223, 202–208. [Google Scholar] [CrossRef]
- Chen, Y.; Zhang, W.; Wu, Q. A highly sensitive room-temperature sensing material for NH3: SnO2-nanorods coupled by rGO. Sens. Actuators B Chem. 2017, 242, 1216–1226. [Google Scholar] [CrossRef]
- Wang, Z.; Zhao, C.; Han, T.; Zhang, Y.; Liu, S.; Fei, T.; Lu, G.; Zhang, T. High-performance reduced graphene oxide-based room-temperature NO2 sensors: A combined surface modification of SnO2 nanoparticles and nitrogen doping approach. Sens. Actuators B Chem. 2017, 242, 269–279. [Google Scholar] [CrossRef]
- Zhou, Y.; Xie, G.; Xie, T.; Yuan, H.; Tai, H.; Jiang, Y.; Chen, Z. A sensitive film structure improvement of reduced graphene oxide based resistive gas sensors. Appl. Phys. Lett. 2014, 105, 033502. [Google Scholar] [CrossRef]
- Lin, Q.; Li, Y.; Yang, M. Tin oxide/graphene composite fabricated via a hydrothermal method for gas sensors working at room temperature. Sens. Actuators B Chem. 2012, 173, 139–147. [Google Scholar] [CrossRef]
- Hao, S.; Zhao, X.; Duan, L.; Liu, R.; Wu, H.; Hou, T.; Jiang, X.; Gao, H. Influence of interface combination of RGO-photosensitized SnO2@RGO core-shell structures on their photocatalytic performance. Appl. Surf. Sci. 2017, 391, 627–634. [Google Scholar]
- Manish, K.S.; Rajiv, K.P.; Rajiv, P. High-performance photo detector based on hydrothermally grown SnO2nanowire/reduced graphene oxide (rGO) hybrid material. Org. Electron. 2017, 50, 359–366. [Google Scholar]
- Zhu, X.; Guo, Y.; Ren, H.; Gao, C.; Zhou, Y. Enhancing the NO2 gas sensing properties of rGO/SnO2 nanocomposite films by using microporous substrates. Sens. Actuators B Chem. 2017, 248, 560–570. [Google Scholar] [CrossRef]
- Du, H.; Xie, G.; Su, Y.; Tai, H.; Du, X.; Yu, H.; Zhang, Q. A new model and its application for the dynamic response of RGO resistive gas sensor. Sensors 2019, 19, 889. [Google Scholar] [CrossRef] [PubMed]
- Liu, S.; Wang, Z.; Zhang, Y.; Zhang, C.; Zhang, T. High performance room temperature NO2 sensors based on reduced graphene oxide-multiwalled carbon nanotubes-tin oxide nanoparticles hybrids. Sens. Actuators B Chem. 2015, 211, 318–324. [Google Scholar] [CrossRef]


| Annealing Temperature (C) | Response | Response Time (s) | Recovery Time (s) |
|---|---|---|---|
| 70 | 0.396 | 297 | >600 |
| 200 | 0.260 | 130 | 292 |
| 400 | 0.0629 | 101 | >300 |
| Materials | Concentra- Tion (ppm) | Opterating Temperature (C) | Response | Response /Recovery Times (s/s) | Range of Linearity (ppm) | Baseline Drift | Reference |
|---|---|---|---|---|---|---|---|
| RGO-CNTs-SnO | 5 | RT | 0.605 | 8/77 | 1–10 | - | [17] |
| RGO-SnO | 5 | RT | about 0.222 | 288/619 | - | - | [17] |
| SnO/N-RGO | 5 | RT | 0.275 | 45/168 | 1–20 | not obvious | [10] |
| SnO/RGO | 5 | RT | about 0.241 | 415/740 | - | - | [10] |
| RGO/SnO 10 mg/mL | 25 | RT | about 0.22 | -/- | 10–25 | obvious | [15] |
| 5.1%RGO/SnO | 50 | RT | 0.260 | 130/292 | 10–50 | not obvious | this paper |
© 2019 by the authors. Licensee MDPI, Basel, Switzerland. This article is an open access article distributed under the terms and conditions of the Creative Commons Attribution (CC BY) license (http://creativecommons.org/licenses/by/4.0/).
Share and Cite
Du, H.; Xie, G.; Zhang, Q. Enhanced Room Temperature NO2 Sensing Performance of RGO Nanosheets by Building RGO/SnO2 Nanocomposite System. Sensors 2019, 19, 4650. https://doi.org/10.3390/s19214650
Du H, Xie G, Zhang Q. Enhanced Room Temperature NO2 Sensing Performance of RGO Nanosheets by Building RGO/SnO2 Nanocomposite System. Sensors. 2019; 19(21):4650. https://doi.org/10.3390/s19214650
Chicago/Turabian StyleDu, Hongfei, Guangzhong Xie, and Qiuping Zhang. 2019. "Enhanced Room Temperature NO2 Sensing Performance of RGO Nanosheets by Building RGO/SnO2 Nanocomposite System" Sensors 19, no. 21: 4650. https://doi.org/10.3390/s19214650
APA StyleDu, H., Xie, G., & Zhang, Q. (2019). Enhanced Room Temperature NO2 Sensing Performance of RGO Nanosheets by Building RGO/SnO2 Nanocomposite System. Sensors, 19(21), 4650. https://doi.org/10.3390/s19214650