Camera Calibration Using Gray Code


Abstract
1. Problem Statement and Introduction
1.1. Camera Calibration
1.2. LCD Screen
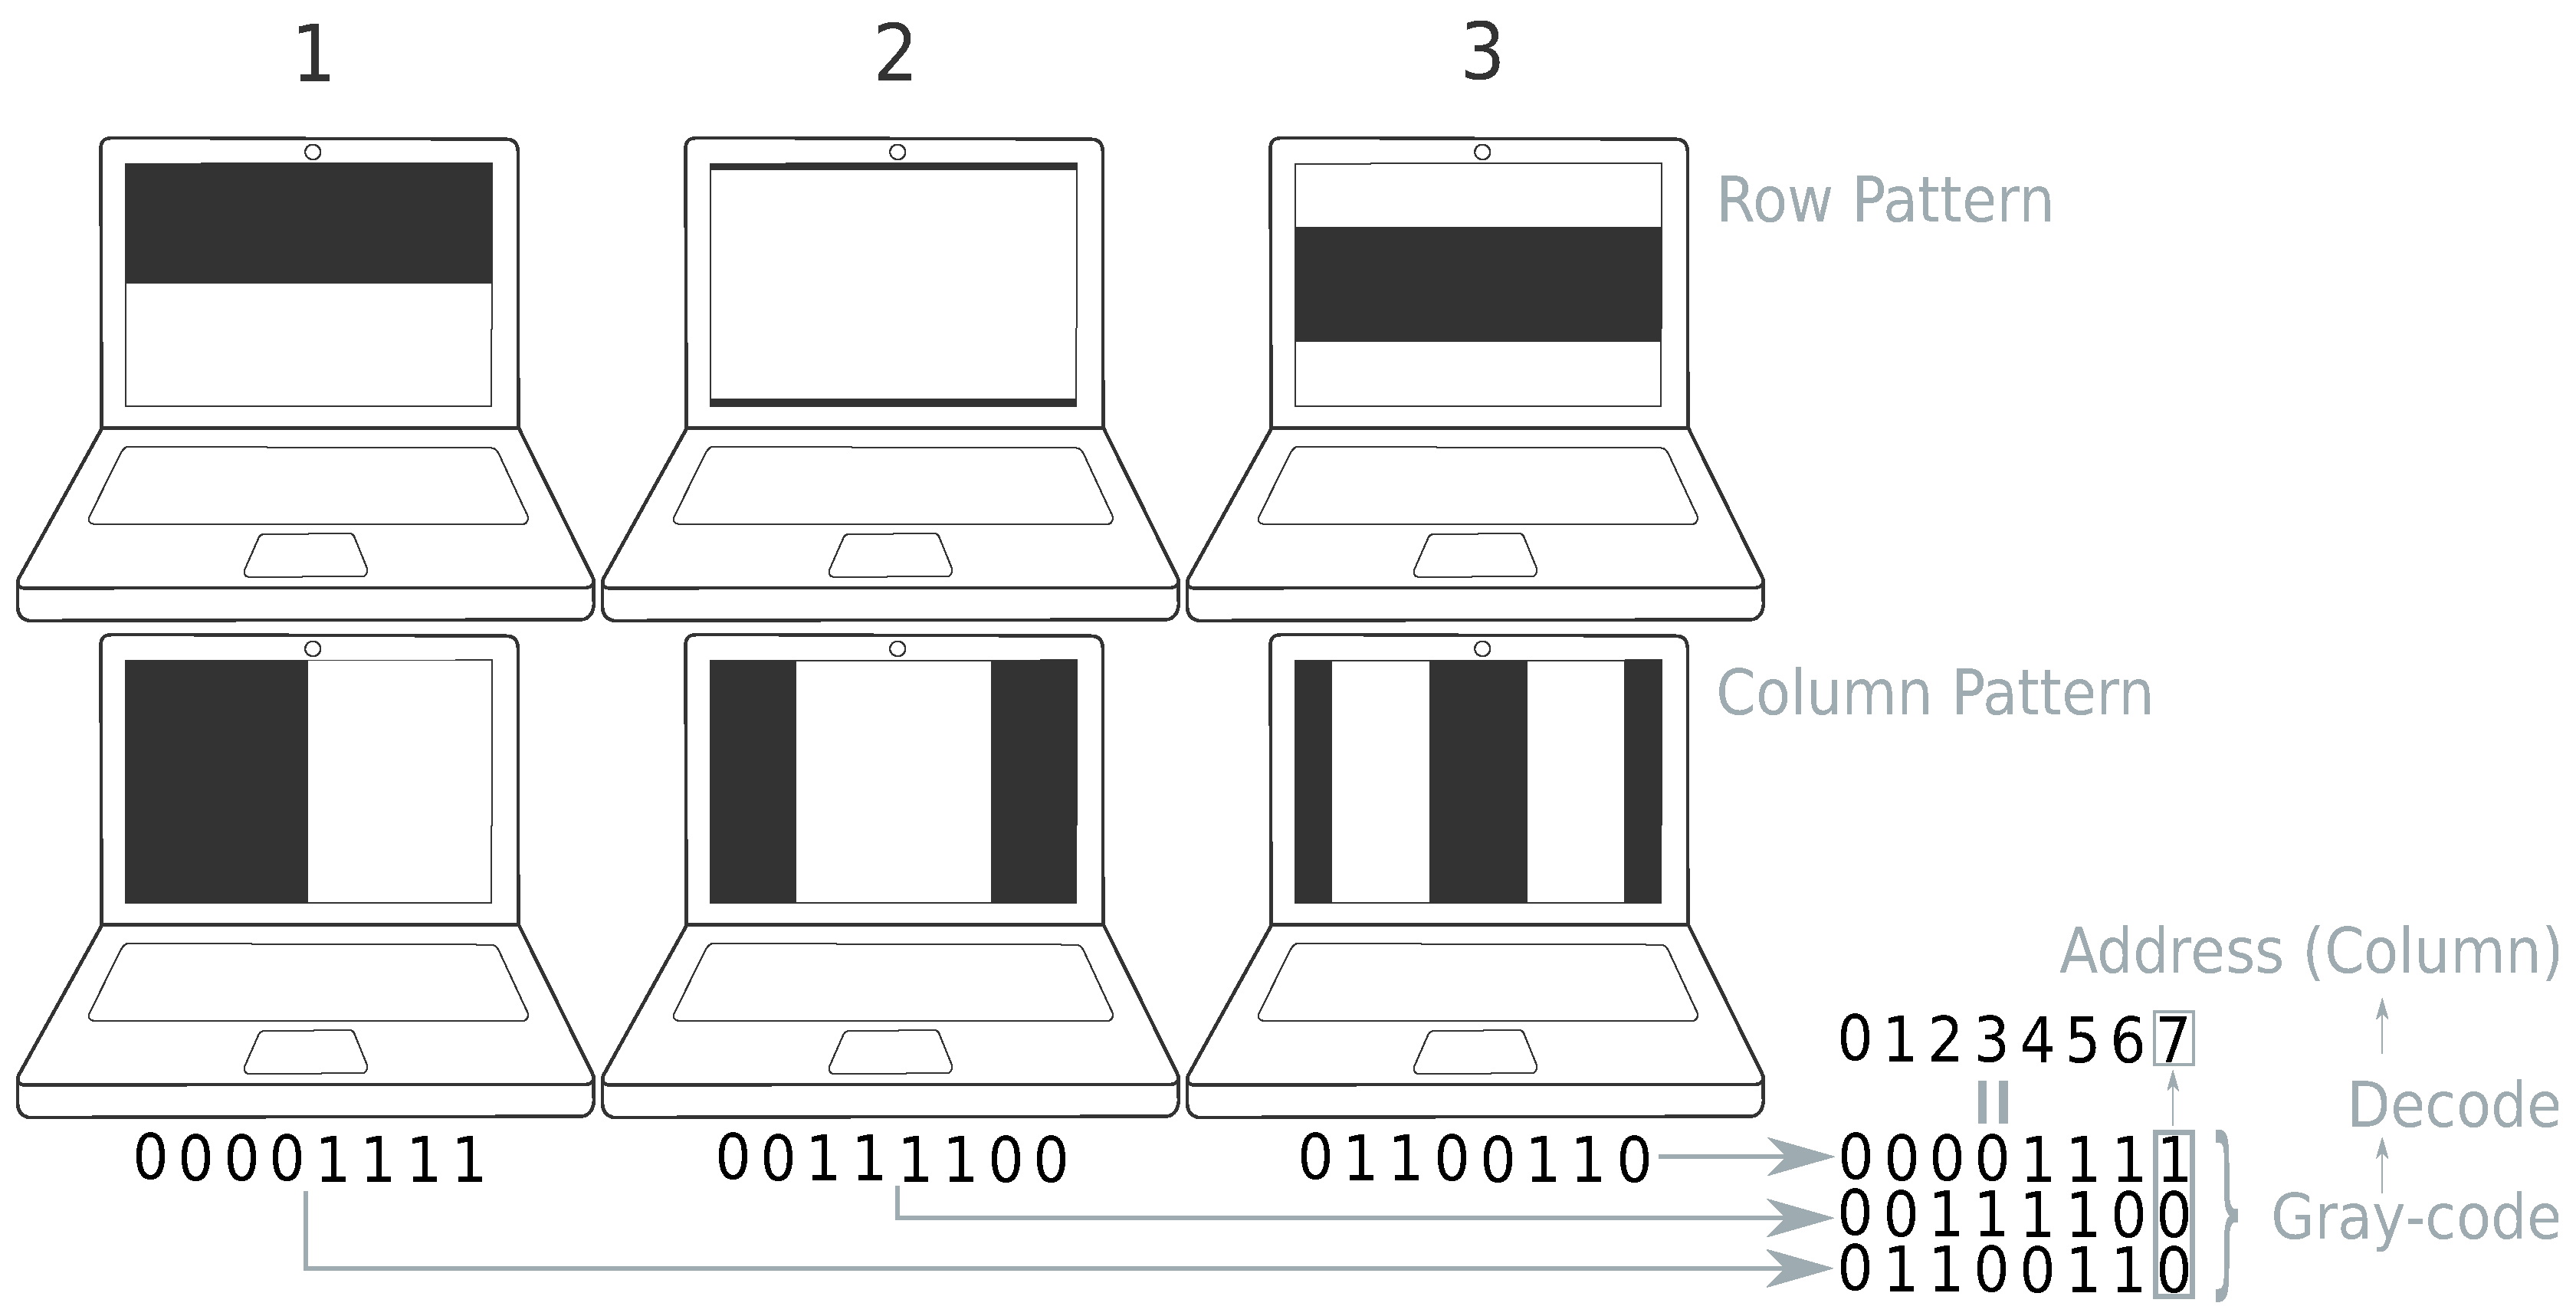
1.3. Gray Code
| Algorithm 1: Methodology. |
|
2. Experiments
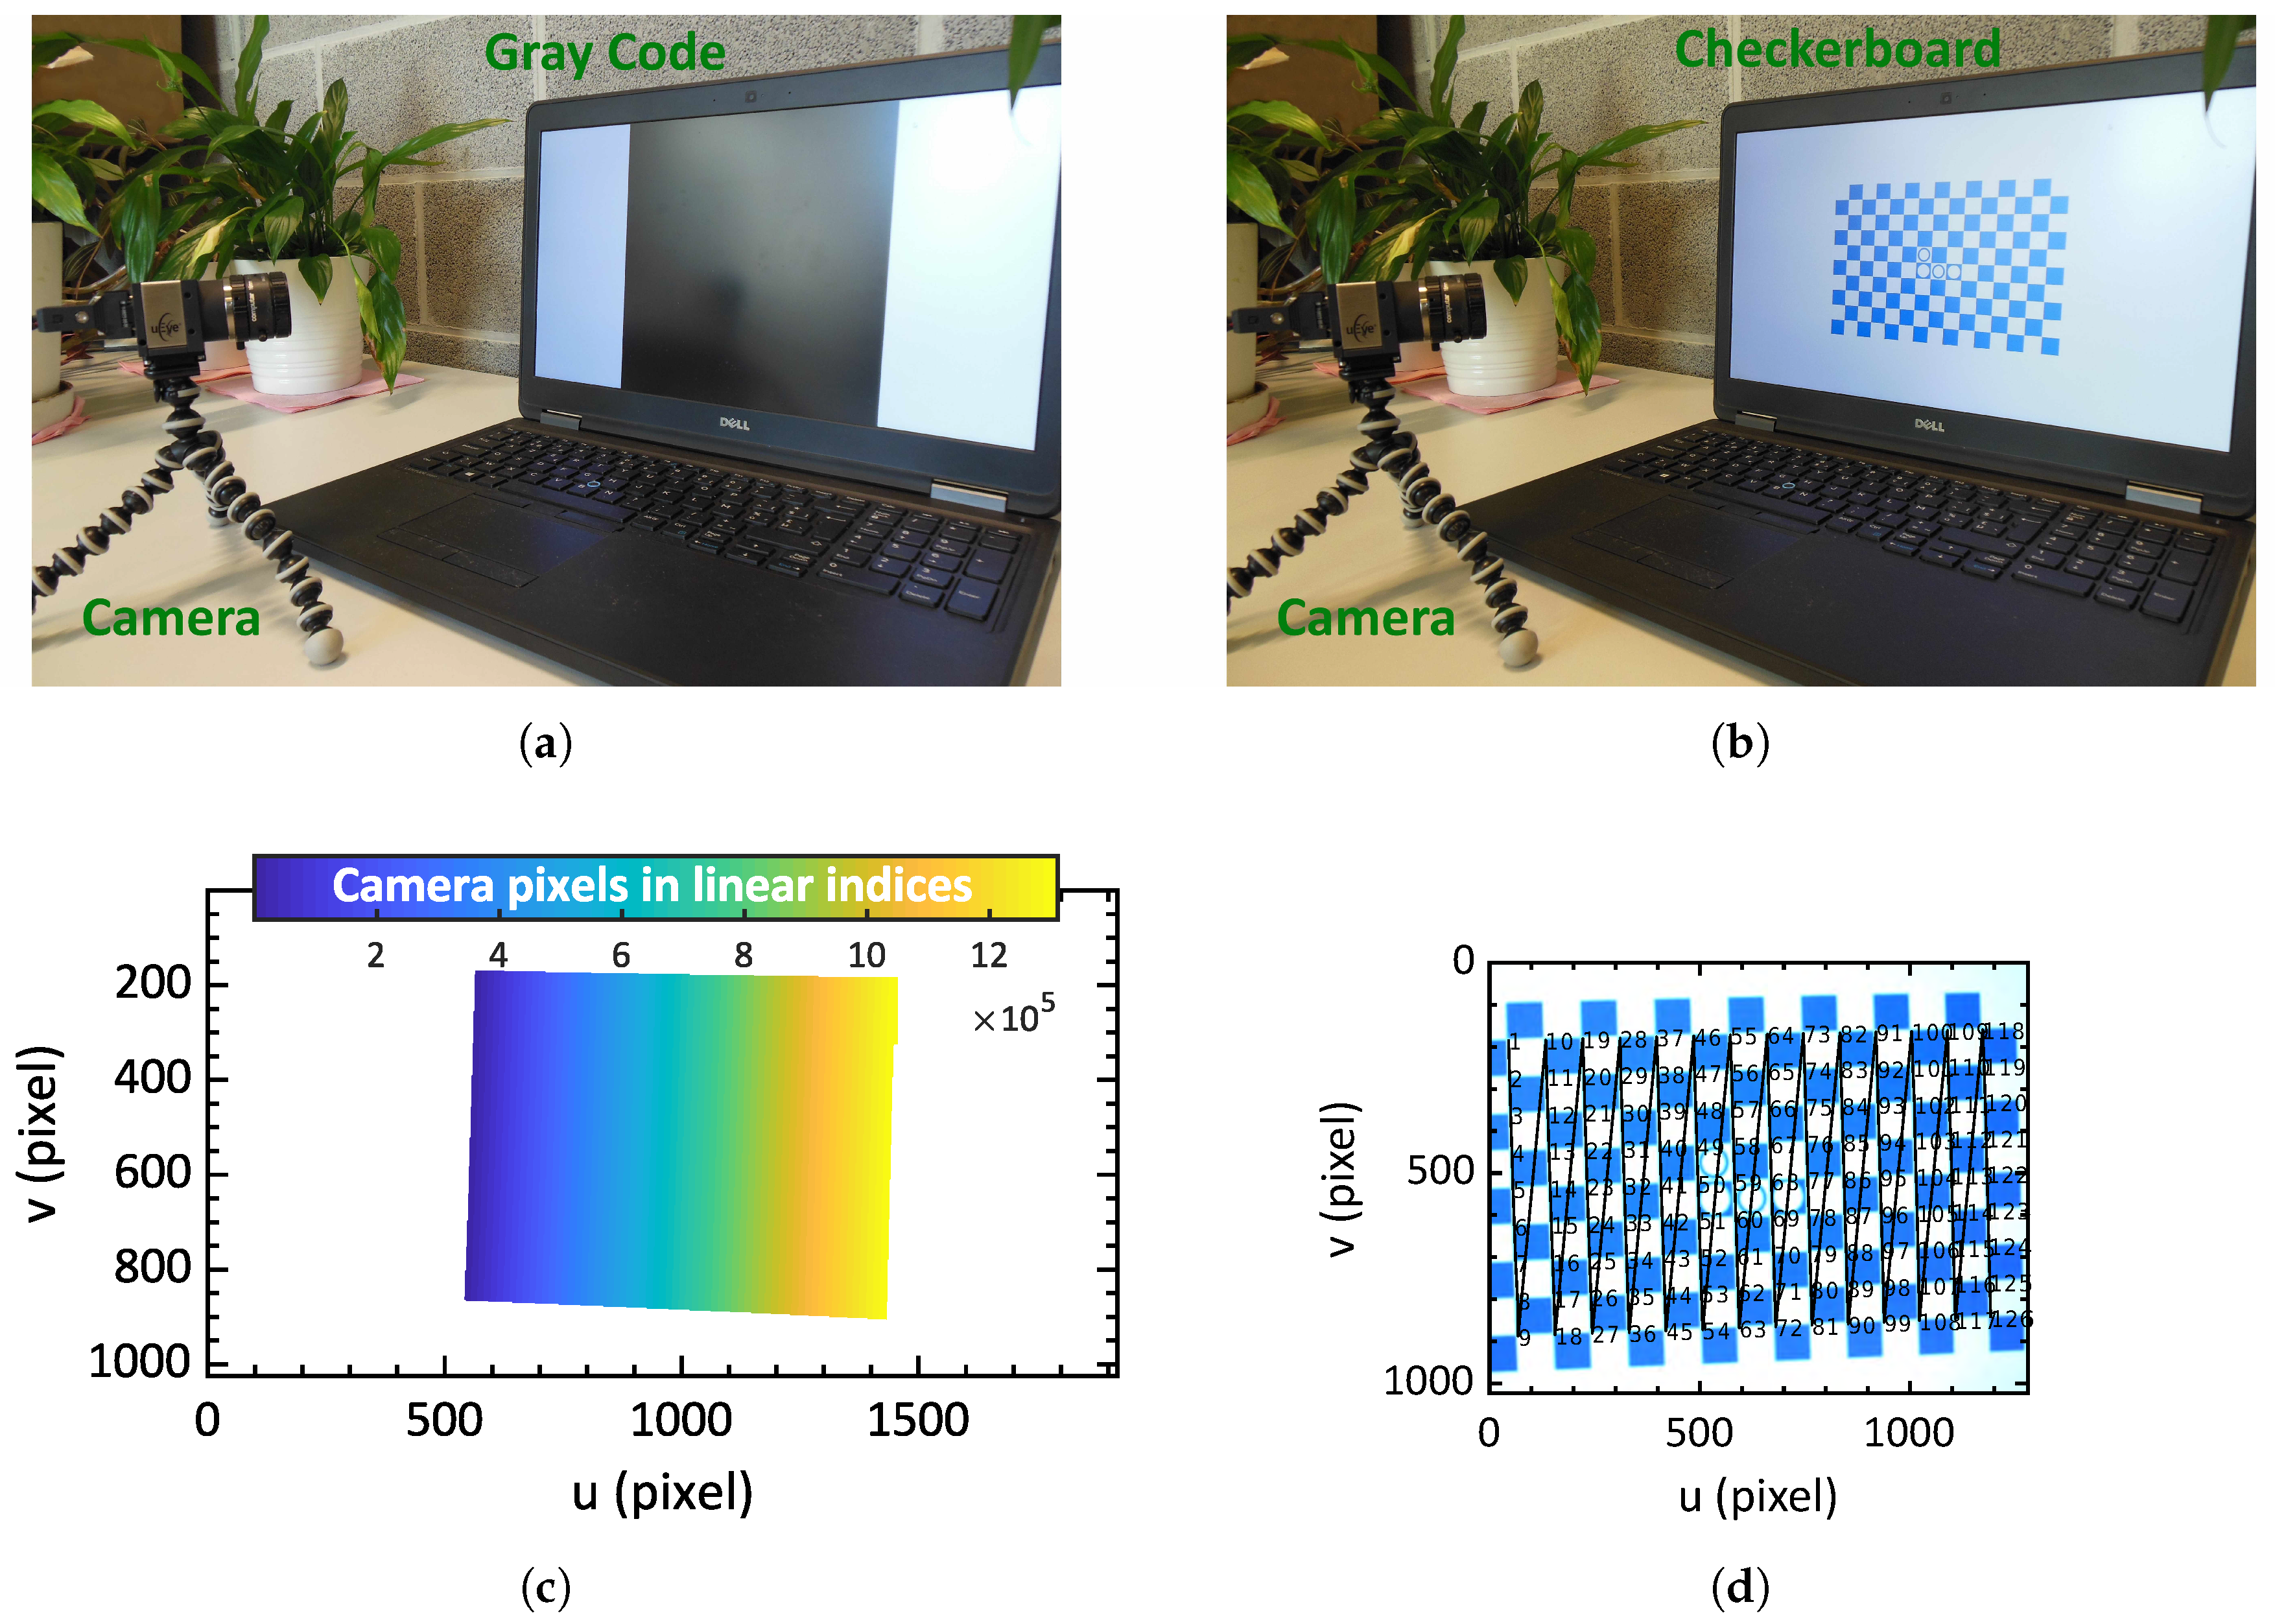
2.1. Experimental Setup
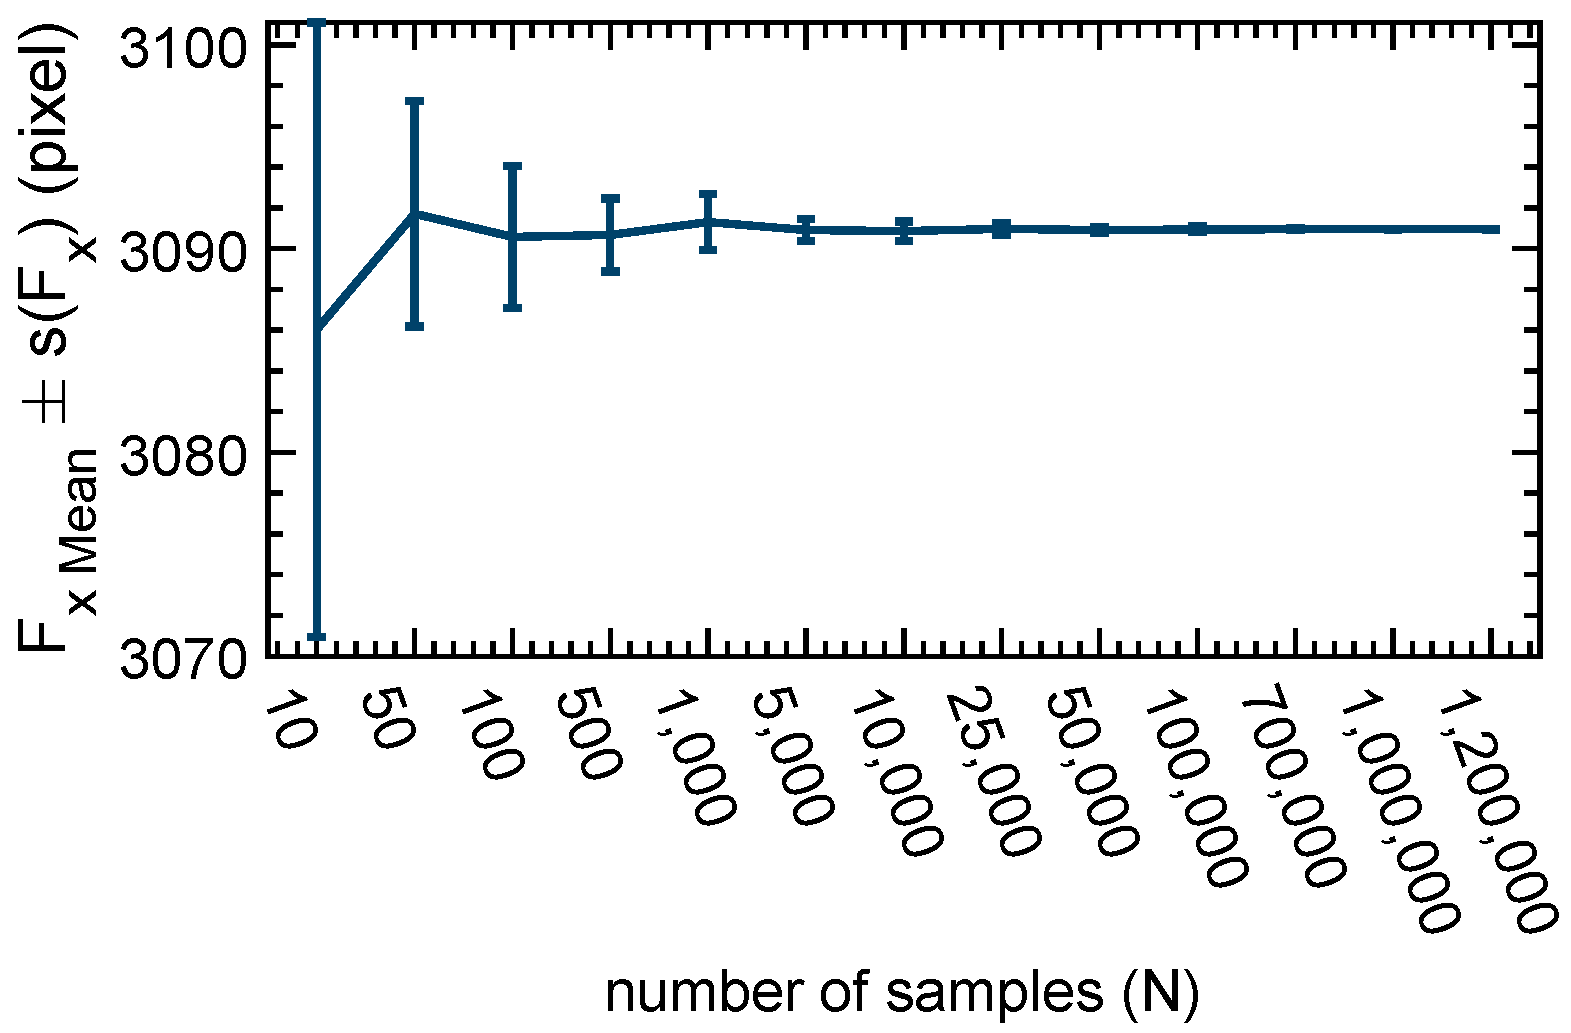
2.2. Number of Calibration Points
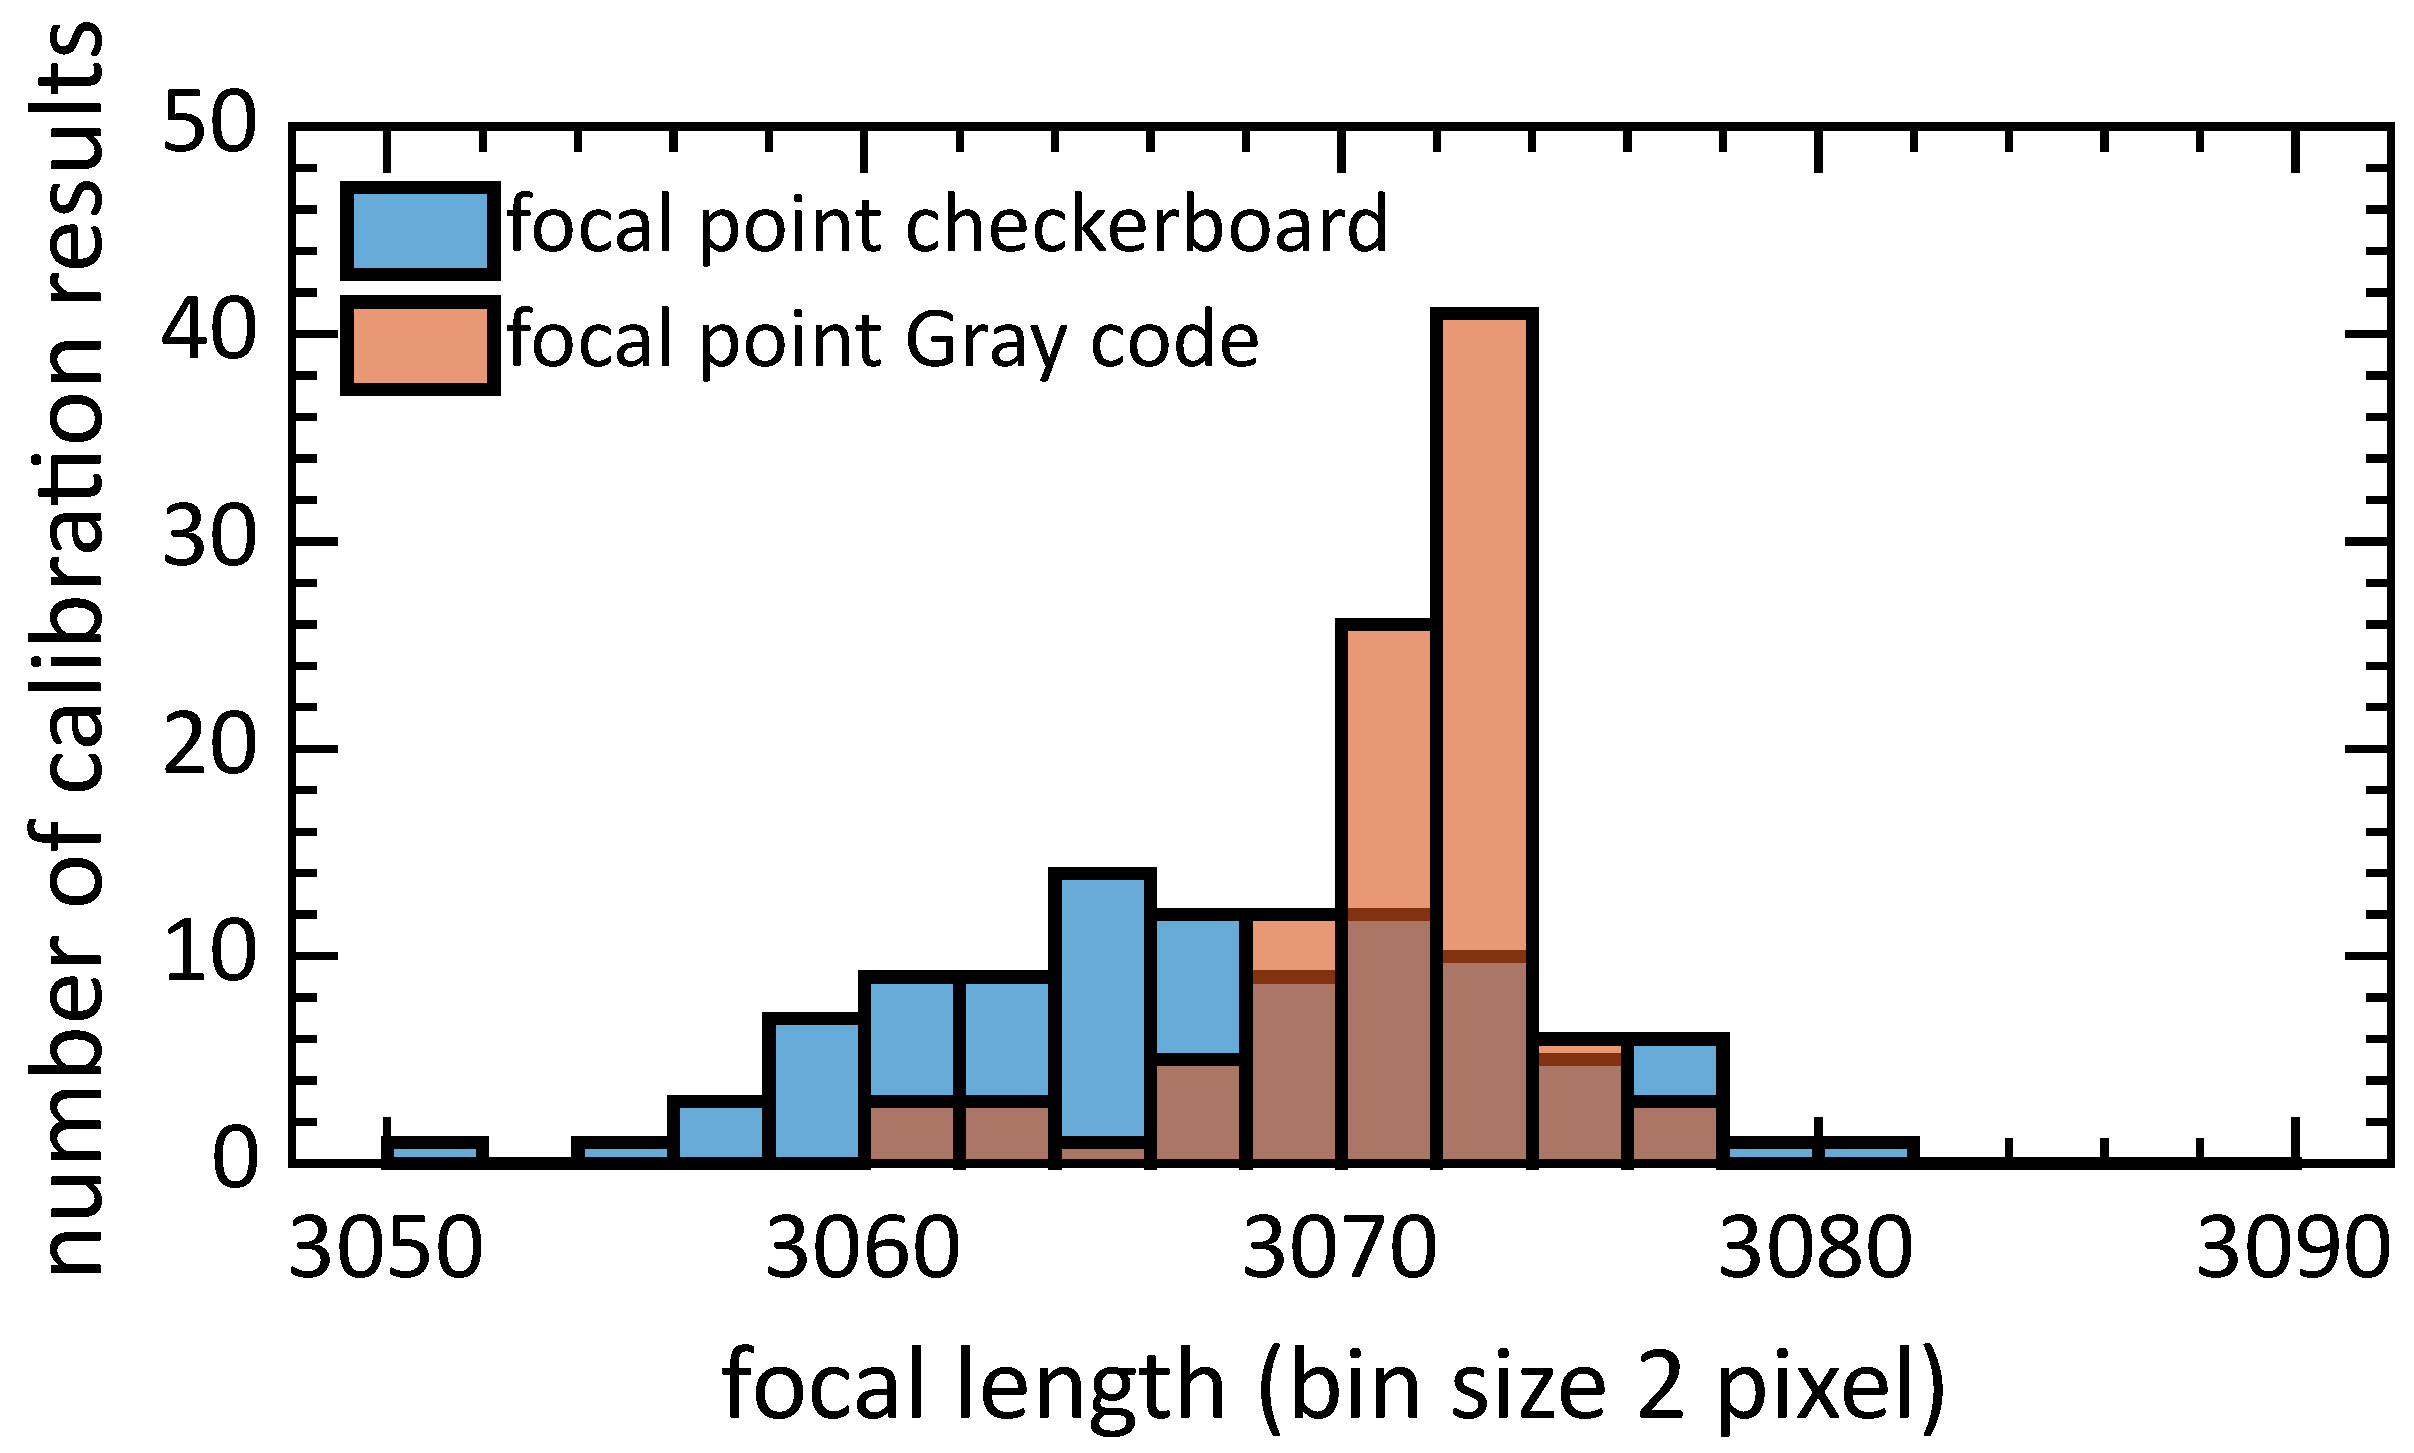
2.3. Comparison between Gray Code and Checkerboard
2.4. Repeatability
3. Conclusions
Author Contributions
Funding
Conflicts of Interest
References
- OpenCV. OpenCV: Detection of ChArUco Corners. Available online: https://docs.opencv.org/3.1.0/df/d4a/tutorial_charuco_detection.html (accessed on 25 July 2018).
- Albarelli, A.; Rodolà, E.; Torsello, A. Robust Camera Calibration using Inaccurate Targets. In Proceedings of the British Machine Vision Conference 2010, Wales, UK, 30 August–2 September 2010; pp. 16.1–16.10. [Google Scholar] [CrossRef]
- Zhan, Z. Camera calibration based on liquid crystal display (lcd). In Proceedings of the International Archives of the Photogrammetry, Remote Sensing and Spatial Information Sciences, ISPRS, Beijing, China, 3–11 July 2008. [Google Scholar]
- Tehrani, M.A.; Beeler, T.; Research, D.; Grundhöfer, A. A Practical Method for Fully Automatic Intrinsic Camera Calibration Using Directionally Encoded Light. In Proceedings of the IEEE Conference on Computer Vision and Pattern Recognition, CVPR 2017, Honolulu, HI, USA, 21–26 July 2017; pp. 1106–1114. [Google Scholar] [CrossRef]
- Song, Z.; Chung, R. Use of LCD panel for calibrating structured-light-based range sensing system. IEEE Trans. Instrum. Meas. 2008, 57, 2623–2630. [Google Scholar] [CrossRef]
- Hirooka, S.; Nakano, N.; Kazui, M. 3D camera calibration using gray code patterns. In Proceedings of the IEEE International Conference on Consumer Electronics, Digest of Technical Papers, Las Vegas, NV, USA, 9–13 January 2008; pp. 7–8. [Google Scholar] [CrossRef]
- Engelke, T.; Keil, J.; Rojtberg, P.; Wientapper, F.; Schmitt, M.; Bockholt, U. Content first a concept for industrial augmented reality maintenance applications using mobile devices. In Proceedings of the 6th Conference on ACM Multimedia Systems—MMSys’15, Portland, OR, USA, 18–20 March 2015; ACM Press: New York, NY, USA, 2015; pp. 105–111. [Google Scholar] [CrossRef]
- Hua, G.; Jégou, H. (Eds.) Computer Vision—ECCV 2016 Workshops. In Lecture Notes in Computer Science; Springer International Publishing: Cham, Switzerland, 2016; Volume 9915. [Google Scholar] [CrossRef]
- Tjaden, H.; Schwanecke, U.; Schömer, E. Real-Time Monocular Pose Estimation of 3D Objects using Temporally Consistent Local Color Histograms. In Proceedings of the IEEE International Conference on Computer Vision ICCV 2017, Venice, Italy, 22–29 October 2017. [Google Scholar] [CrossRef]
- Prisacariu, V.A.; Reid, I.D. PWP3D: Real-Time Segmentation and Tracking of 3D Objects. Int. J. Comput. Vis. 2012, 98, 335–354. [Google Scholar] [CrossRef]
- Kaehler, A. Learning OpenCV 3: Computer Vision in C++ with the OpenCV Library; O’Reilly Media: Sebastopol, CA, USA, 2016. [Google Scholar]
- Wuest, H.; Engekle, T.; Wientapper, F.; Schmitt, F.; Keil, J. From CAD to 3D Tracking—Enhancing & Scaling Model-Based Tracking for Industrial Appliances. In Proceedings of the 2016 IEEE International Symposium on Mixed and Augmented Reality, ISMAR-Adjunct 2016, Yucatan, Mexico, 19–23 September 2016; pp. 346–347. [Google Scholar] [CrossRef]
- Fischler, M.A.; Bolles, R.C. Random sample consensus: A paradigm for model fitting with applications to image analysis and automated cartography. Commun. ACM 1981, 24, 381–395. [Google Scholar] [CrossRef]
- Ferrara, P.; Piva, A.; Argenti, F.; Kusuno, J.; Niccolini, M.; Ragaglia, M.; Uccheddu, F. Wide-angle and long-range real time pose estimation: A comparison between monocular and stereo vision systems. J. Visual Commun. Image Represent. 2017, 48, 159–168. [Google Scholar] [CrossRef]
- Zhang, Z. A Flexible New Technique for Camera Calibration (Technical Report). IEEE Trans. Pattern Anal. Mach. Intell. 2002, 22, 1330–1334. [Google Scholar] [CrossRef]
- Bouguet, J.Y. Camera Calibration Toolbox for Matlab. 2015. Available online: http://www.vision.caltech.edu/bouguetj/calib_doc/ (accessed on 20 July 2018).
- Geiger, A.; Moosmann, F.; Car, O.; Schuster, B. Automatic camera and range sensor calibration using a single shot. In Proceedings of the 2012 IEEE International Conference on Robotics and Automation, St. Paul, MN, USA, 14–18 May 2012; pp. 3936–3943. [Google Scholar] [CrossRef]
- Romero-Ramirez, F.J.; Muñoz-Salinas, R.; Medina-Carnicer, R. Speeded up detection of squared fiducial markers. Image Vis. Comput. 2018, 76, 38–47. [Google Scholar] [CrossRef]
- Grossmann, E.; Woodfill, J.; Gordon, G. Display Screen for Camera Calibration. U.S. Patent 8,743,214, 3 June 2014. [Google Scholar]
- Gray, F. Pulse Code Communication. U.S. Patent 2,632,058, 17 March 1953. [Google Scholar]
- Kimura, M.; Mochimaru, M.; Kanade, T. Projector Calibration using Arbitrary Planes and Calibrated Camera. In Proceedings of the 2007 IEEE Conference on Computer Vision and Pattern Recognition, Minneapolis, MN, USA, 17–22 June 2007; pp. 1–2. [Google Scholar] [CrossRef]
- Rodriguez, L.; Quint, F.; Gorecky, D.; Romero, D.; Siller, H.R. Developing a Mixed Reality Assistance System Based on Projection Mapping Technology for Manual Operations at Assembly Workstations. Proc. Comput. Sci. 2015, 75, 327–333. [Google Scholar] [CrossRef]
- Schmalz, C. Robust Single-Shot Structured Light 3D Scanning. Ph.D. Thesis, Technischen Fakultät der Universität Erlangen-Nürnberg, Erlangen, Germany,, 2011. [Google Scholar]
- Salvi, J.; Pagès, J.; Batlle, J. Pattern codification strategies in structured light systems. Pattern Recognit. 2004, 37, 827–849. [Google Scholar] [CrossRef]
- Garbat, P.; Skarbek, W.; Tomaszewski, M. Structured light camera calibration. Opto-Electron. Rev. 2013, 21, 23–38. [Google Scholar] [CrossRef]
- Lanman, D.; Taubin, G. Build Your Own 3D Scanner: 3D Photography for Beginners. Siggraph 2009, 94. [Google Scholar] [CrossRef]
- Datta, A.; Kim, J.S.; Kanade, T. Accurate camera calibration using iterative refinement of control points. In Proceedings of the 2009 IEEE 12th International Conference on Computer Vision Workshops, ICCV Workshops 2009, Kyoto, Japan, 27 September–4 October 2009; pp. 1201–1208. [Google Scholar] [CrossRef]
- Usamentiaga, R.; Garcia, D.; Ibarra-Castanedo, C.; Maldague, X. Highly accurate geometric calibration for infrared cameras using inexpensive calibration targets. Measurement 2017, 112, 105–116. [Google Scholar] [CrossRef]
- DLR. DLR-Institute of Robotics and Mechatronics-ESS-OSS; DLR: Weßling, Germany, 2015. [Google Scholar]
- Halcon. Camera_calibration [HALCON Operator Reference/Version 12.0.2]; Halcon: Munich, Germany, 2015. [Google Scholar]
- Moreno, D.; Taubin, G. Simple, accurate, and robust projector-camera calibration. In Proceedings of the 2nd Joint 3DIM/3DPVT Conference: 3D Imaging, Modeling, Processing, Visualization and Transmission, 3DIMPVT 2012, Zürich, Switzerland, 13–15 October 2012; pp. 464–471. [Google Scholar] [CrossRef]
- Poulin-Girard, A.S.; Thibault, S.; Laurendeau, D. Influence of camera calibration conditions on the accuracy of 3D reconstruction. Opt. Express 2016, 24, 2678. [Google Scholar] [CrossRef] [PubMed]


| Type | s() | s() | Mean Reprojection Error | r1 | s(r1) | r2 | s(r2) | s() | s() | ||||
|---|---|---|---|---|---|---|---|---|---|---|---|---|---|
| [pixel] | [pixel] | [pixel] | [pixel] | [pixel] | [pixel] | [pixel] | [pixel] | [pixel] | |||||
| Gray-code | 3093.1 | 0.10 | 3091.7 | 0.09 | 1.15 | −0.14 | 0.26 | 0.21 | 0.0006 | 659.80 | 0.04 | 511.27 | 0.07 |
| 3095.0 | 0.11 | 3094.7 | 0.10 | 1.01 | −0.16 | 0.44 | −0.92 | 0.0006 | 654.93 | 0.04 | 509.43 | 0.08 | |
| 3087.9 | 0.07 | 3087.7 | 0.06 | 0.88 | −0.16 | 0.46 | −1.12 | 0.0005 | 655.62 | 0.03 | 512.87 | 0.05 | |
| 3091.9 | 0.08 | 3091.2 | 0.07 | 0.93 | −0.13 | 0.02 | 2.28 | 0.0005 | 658.27 | 0.03 | 513.02 | 0.06 | |
| 3090.9 | 0.10 | 3089.9 | 0.09 | 0.80 | −0.14 | 0.20 | 0.87 | 0.0005 | 657.81 | 0.04 | 510.73 | 0.06 | |
| 3085.7 | 0.07 | 3091.7 | 0.09 | 1.15 | −0.14 | 0.26 | 0.21 | 0.0006 | 659.80 | 0.04 | 511.27 | 0.07 | |
| 3091.0 | 0.07 | 3090.9 | 0.06 | 0.94 | −0.15 | 0.44 | −0.76 | 0.0005 | 653.75 | 0.03 | 514.89 | 0.05 | |
| mean ± s | 3090.8 ± 3.1 | 3091.1 ± 2.1 | 0.98 ± 0.13 | −0.15 ± 0.01 | 0.11 ± 1.2 | 657.14 ± 2.4 | 511.93 ± 1.8 | ||||||
| checkerboard | 3080.1 | 2.13 | 3079.8 | 1.87 | 0.17 | −0.16 | 0.85 | −7.73 | 0.0097 | 658.80 | 0.78 | 510.53 | 1.74 |
| 3079.8 | 2.87 | 3080.0 | 2.70 | 0.37 | −0.16 | 0.61 | −5.29 | 0.0188 | 658.52 | 1.59 | 513.45 | 2.42 | |
| 3088.7 | 1.74 | 3087.7 | 1.52 | 0.20 | −0.17 | 1.02 | −7.99 | 0.0125 | 659.64 | 0.85 | 508.38 | 1.43 | |
| 3078.4 | 2.07 | 3078.7 | 1.87 | 0.21 | −0.15 | 0.69 | −6.76 | 0.0113 | 656.52 | 0.93 | 519.11 | 1.38 | |
| 3082.0 | 3.87 | 3081.9 | 3.53 | 0.23 | −0.16 | 1.31 | −14.33 | 0.0165 | 656.99 | 1.21 | 515.91 | 2.53 | |
| 3073.0 | 7.70 | 3074.4 | 7.44 | 0.39 | −0.17 | 1.28 | −12.97 | 0.0293 | 656.24 | 2.83 | 524.64 | 4.49 | |
| 3077.3 | 2.22 | 3078.0 | 2.06 | 0.21 | −0.16 | 0.90 | −6.73 | 0.0120 | 660.55 | 1.03 | 519.41 | 1.46 | |
| mean ± s | 3079.9 ± 4.8 | 3080.1 ± 4.1 | 0.25 ± 0.09 | −0.16 ± 0.01 | −8.83 ± 3.43 | 658.18 ±1.64 | 515.92 ± 5.63 | ||||||
© 2019 by the authors. Licensee MDPI, Basel, Switzerland. This article is an open access article distributed under the terms and conditions of the Creative Commons Attribution (CC BY) license (http://creativecommons.org/licenses/by/4.0/).
Share and Cite
Sels, S.; Ribbens, B.; Vanlanduit, S.; Penne, R. Camera Calibration Using Gray Code. Sensors 2019, 19, 246. https://doi.org/10.3390/s19020246
Sels S, Ribbens B, Vanlanduit S, Penne R. Camera Calibration Using Gray Code. Sensors. 2019; 19(2):246. https://doi.org/10.3390/s19020246
Chicago/Turabian StyleSels, Seppe, Bart Ribbens, Steve Vanlanduit, and Rudi Penne. 2019. "Camera Calibration Using Gray Code" Sensors 19, no. 2: 246. https://doi.org/10.3390/s19020246
APA StyleSels, S., Ribbens, B., Vanlanduit, S., & Penne, R. (2019). Camera Calibration Using Gray Code. Sensors, 19(2), 246. https://doi.org/10.3390/s19020246