Integrated Laser Sensor (ILS) for Remote Surface Analysis: Application for Detecting Explosives in Fingerprints

 ,
,  ,
, 
Abstract
:1. Introduction
2. Experimental
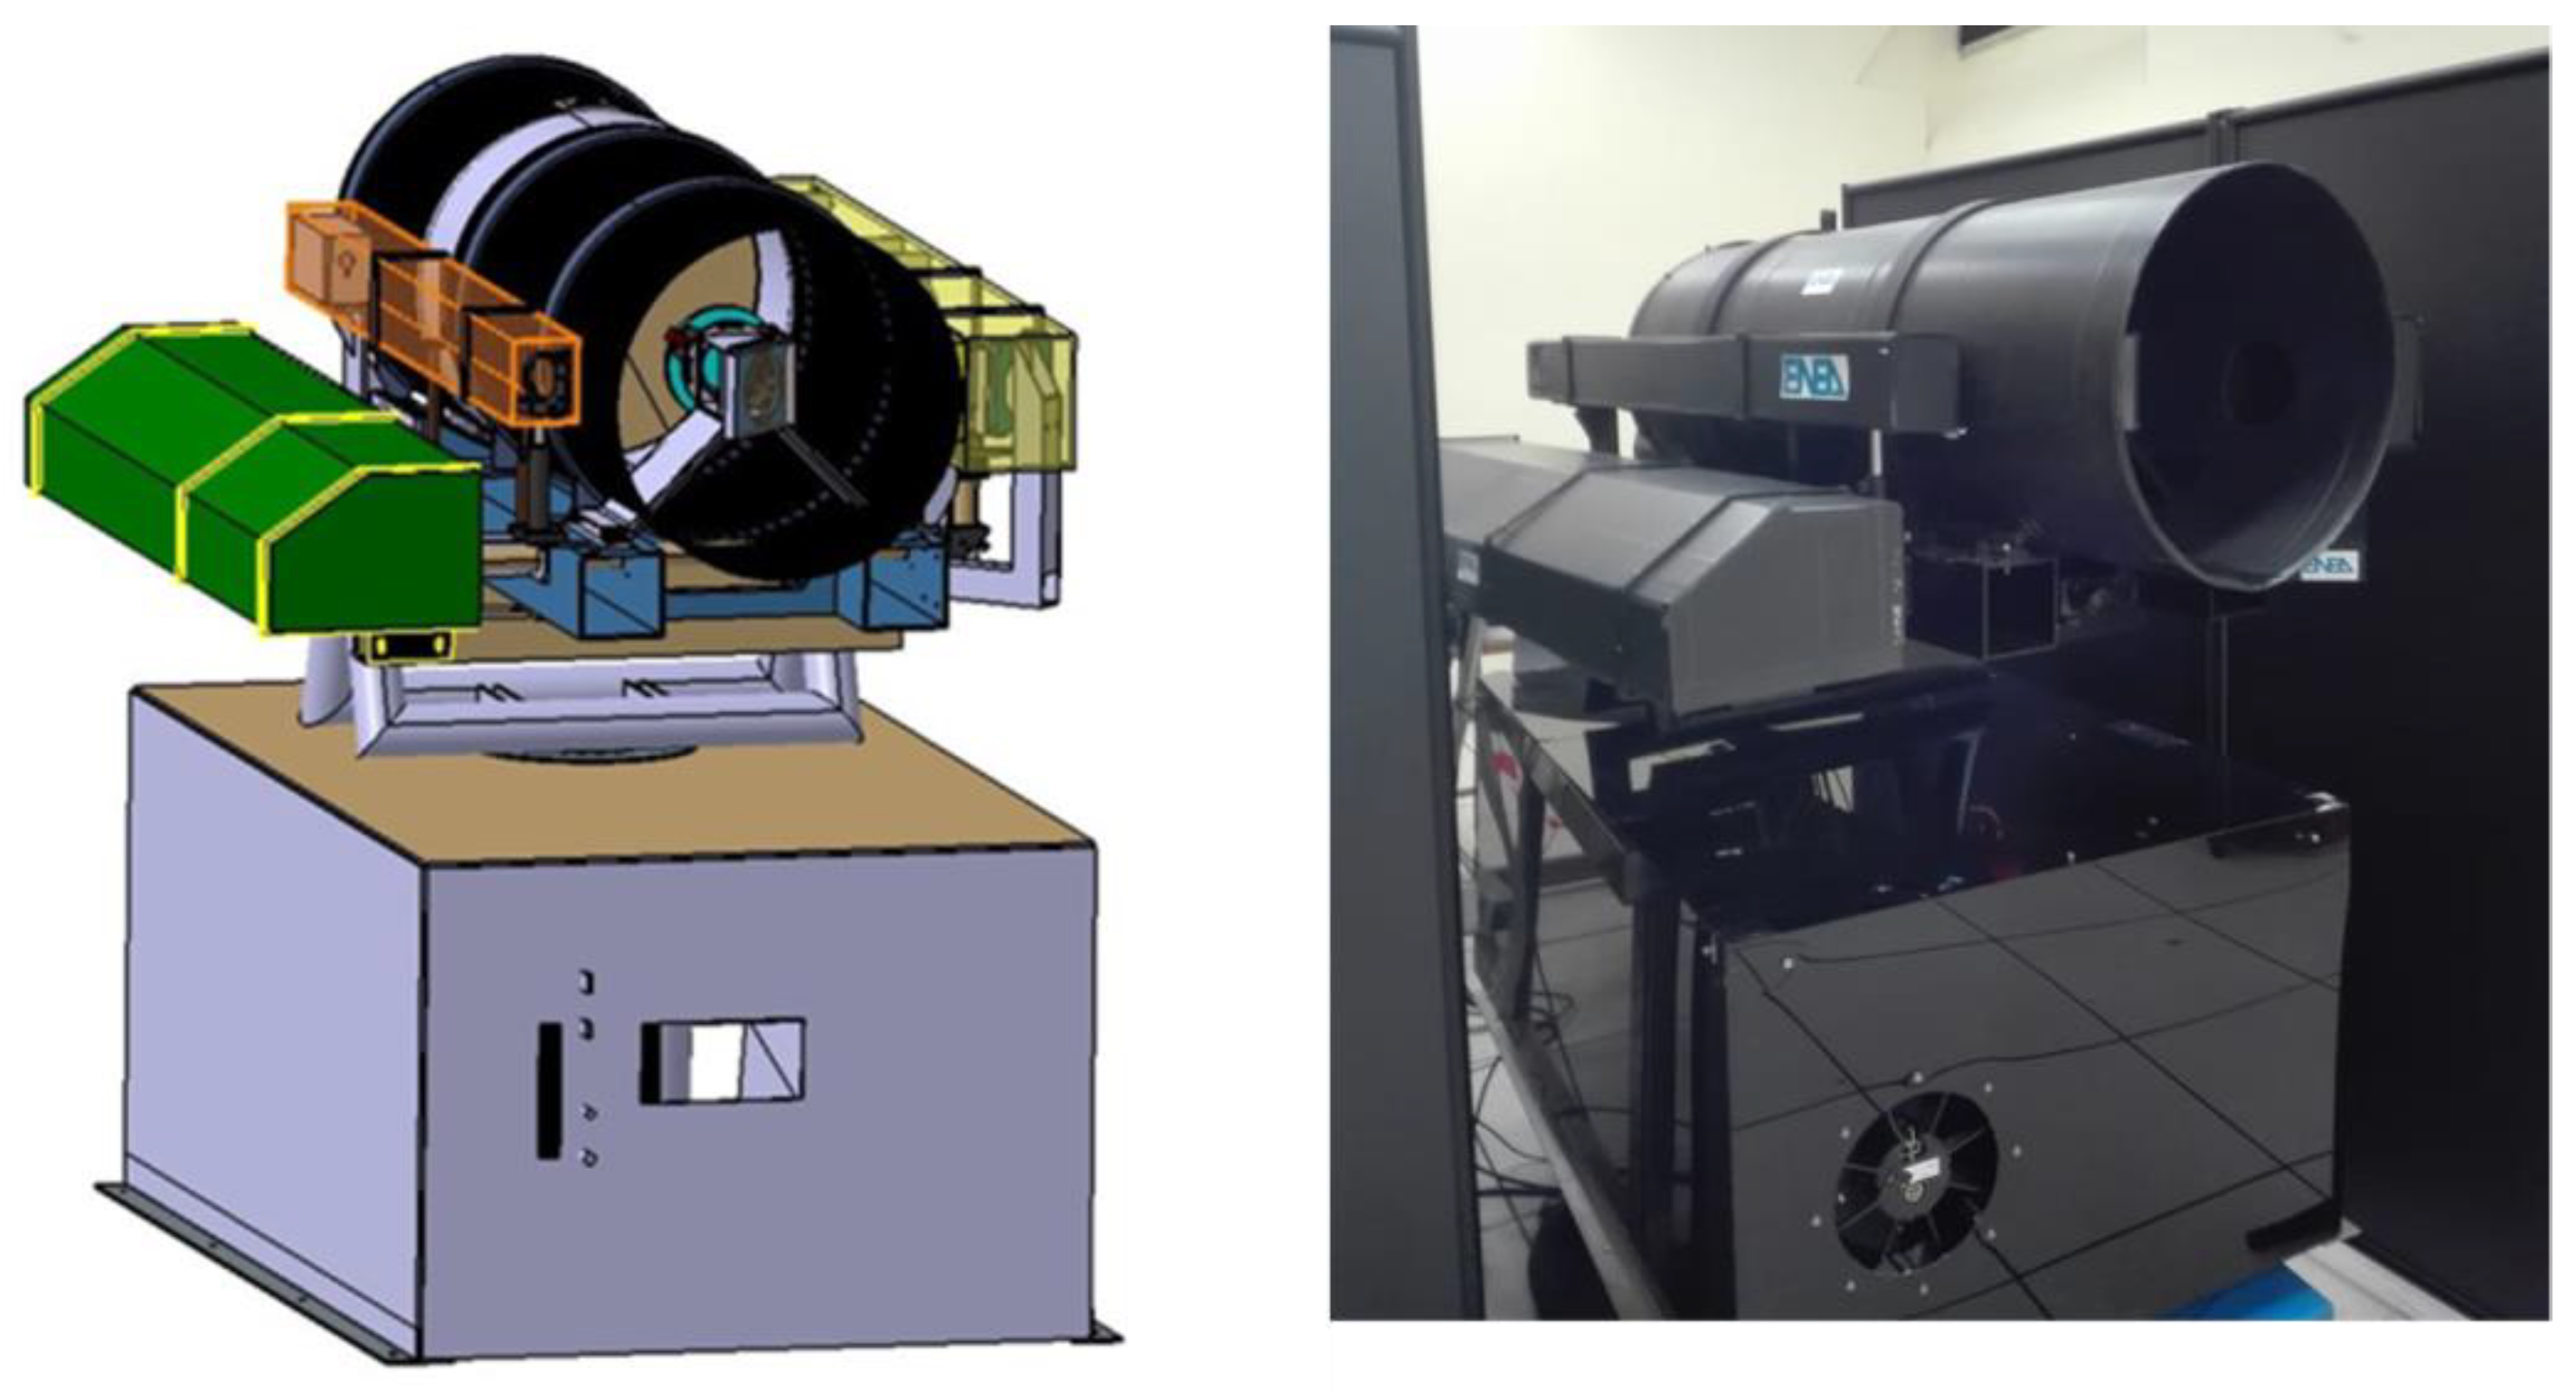
2.1. Overview
2.2. Optical System
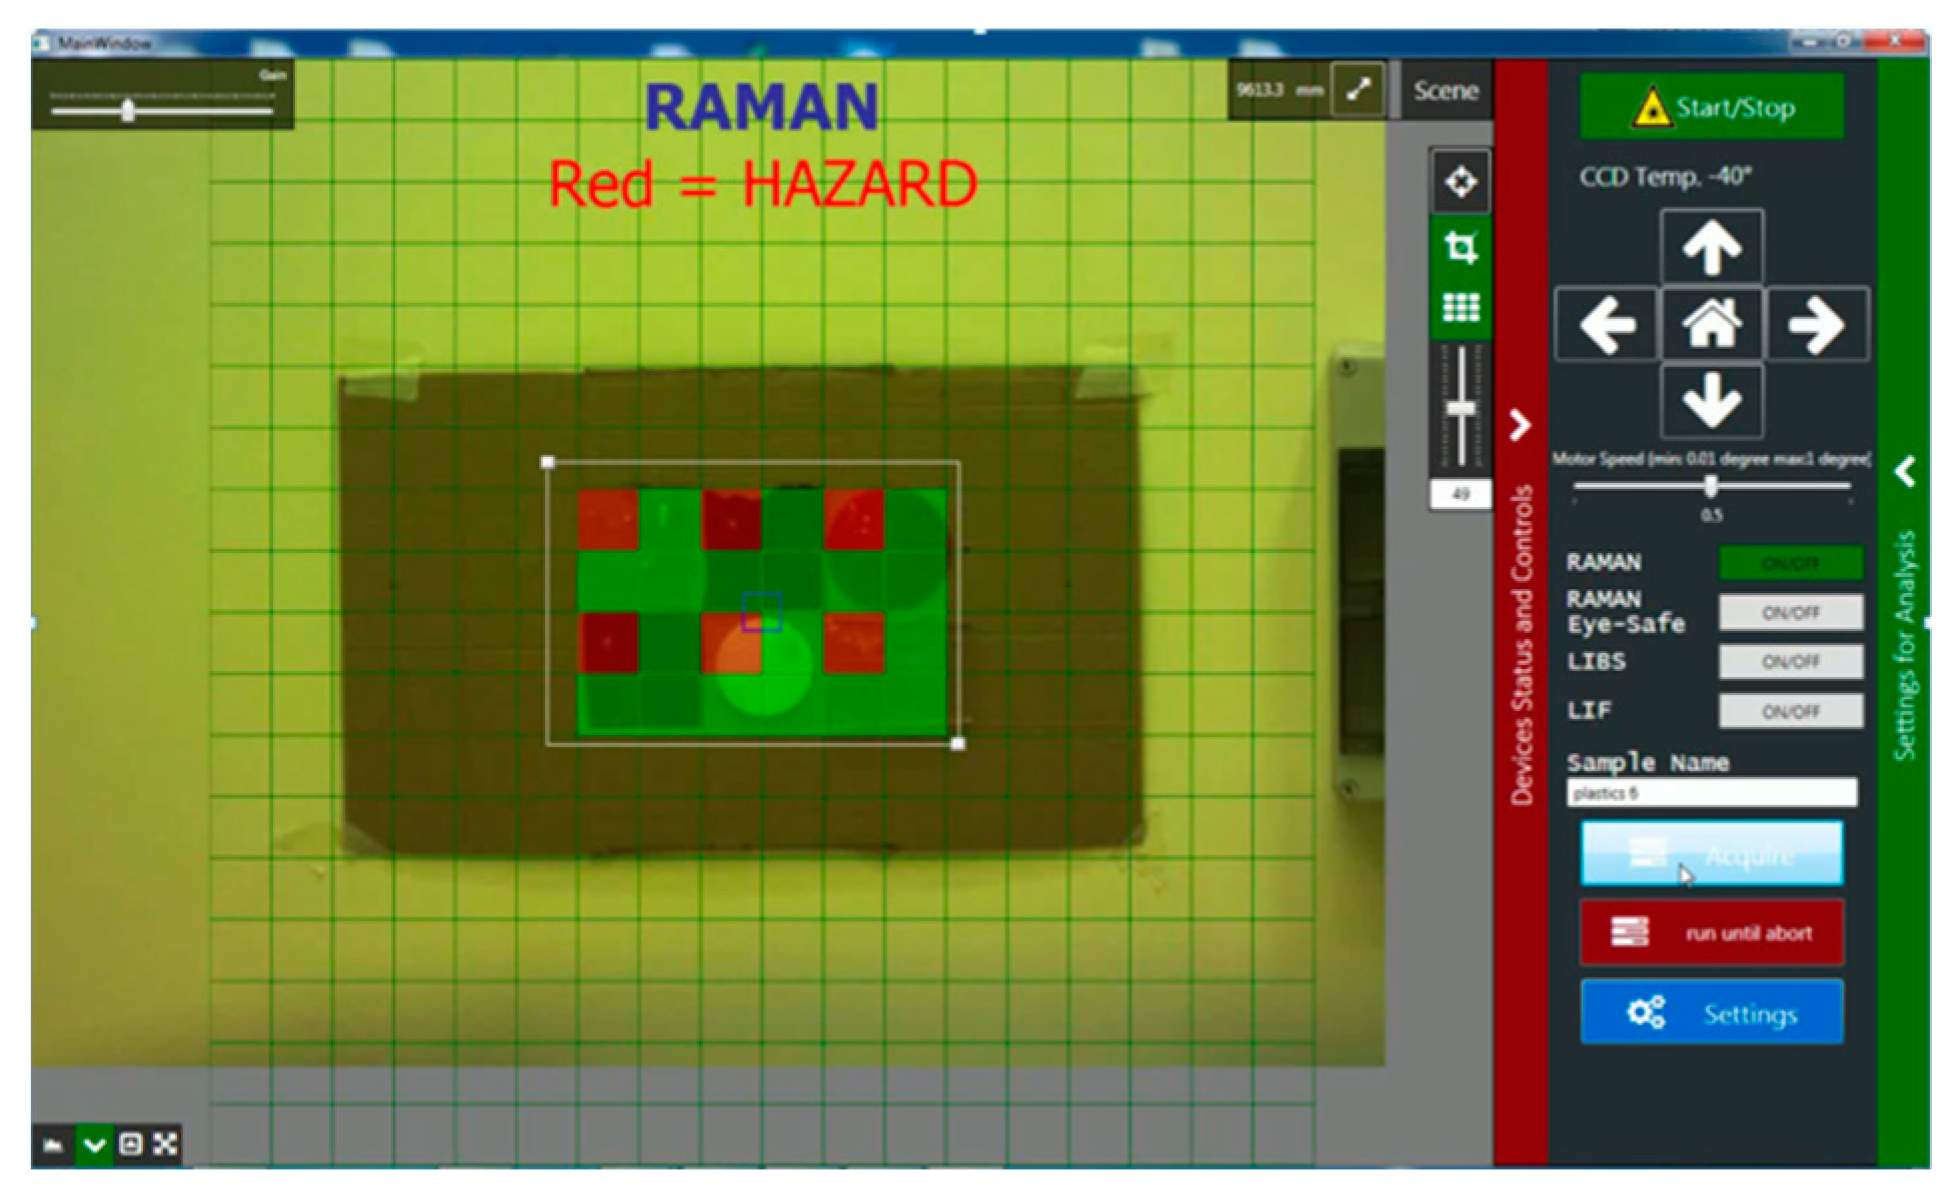
2.3. Software
2.4. Materials and Methods
3. Results
- LIF and LS measurements for identifying eventual changes of the target material (roughness and surface contamination).
- Eventual inspection of the previously-tagged interesting areas by the internal camera.
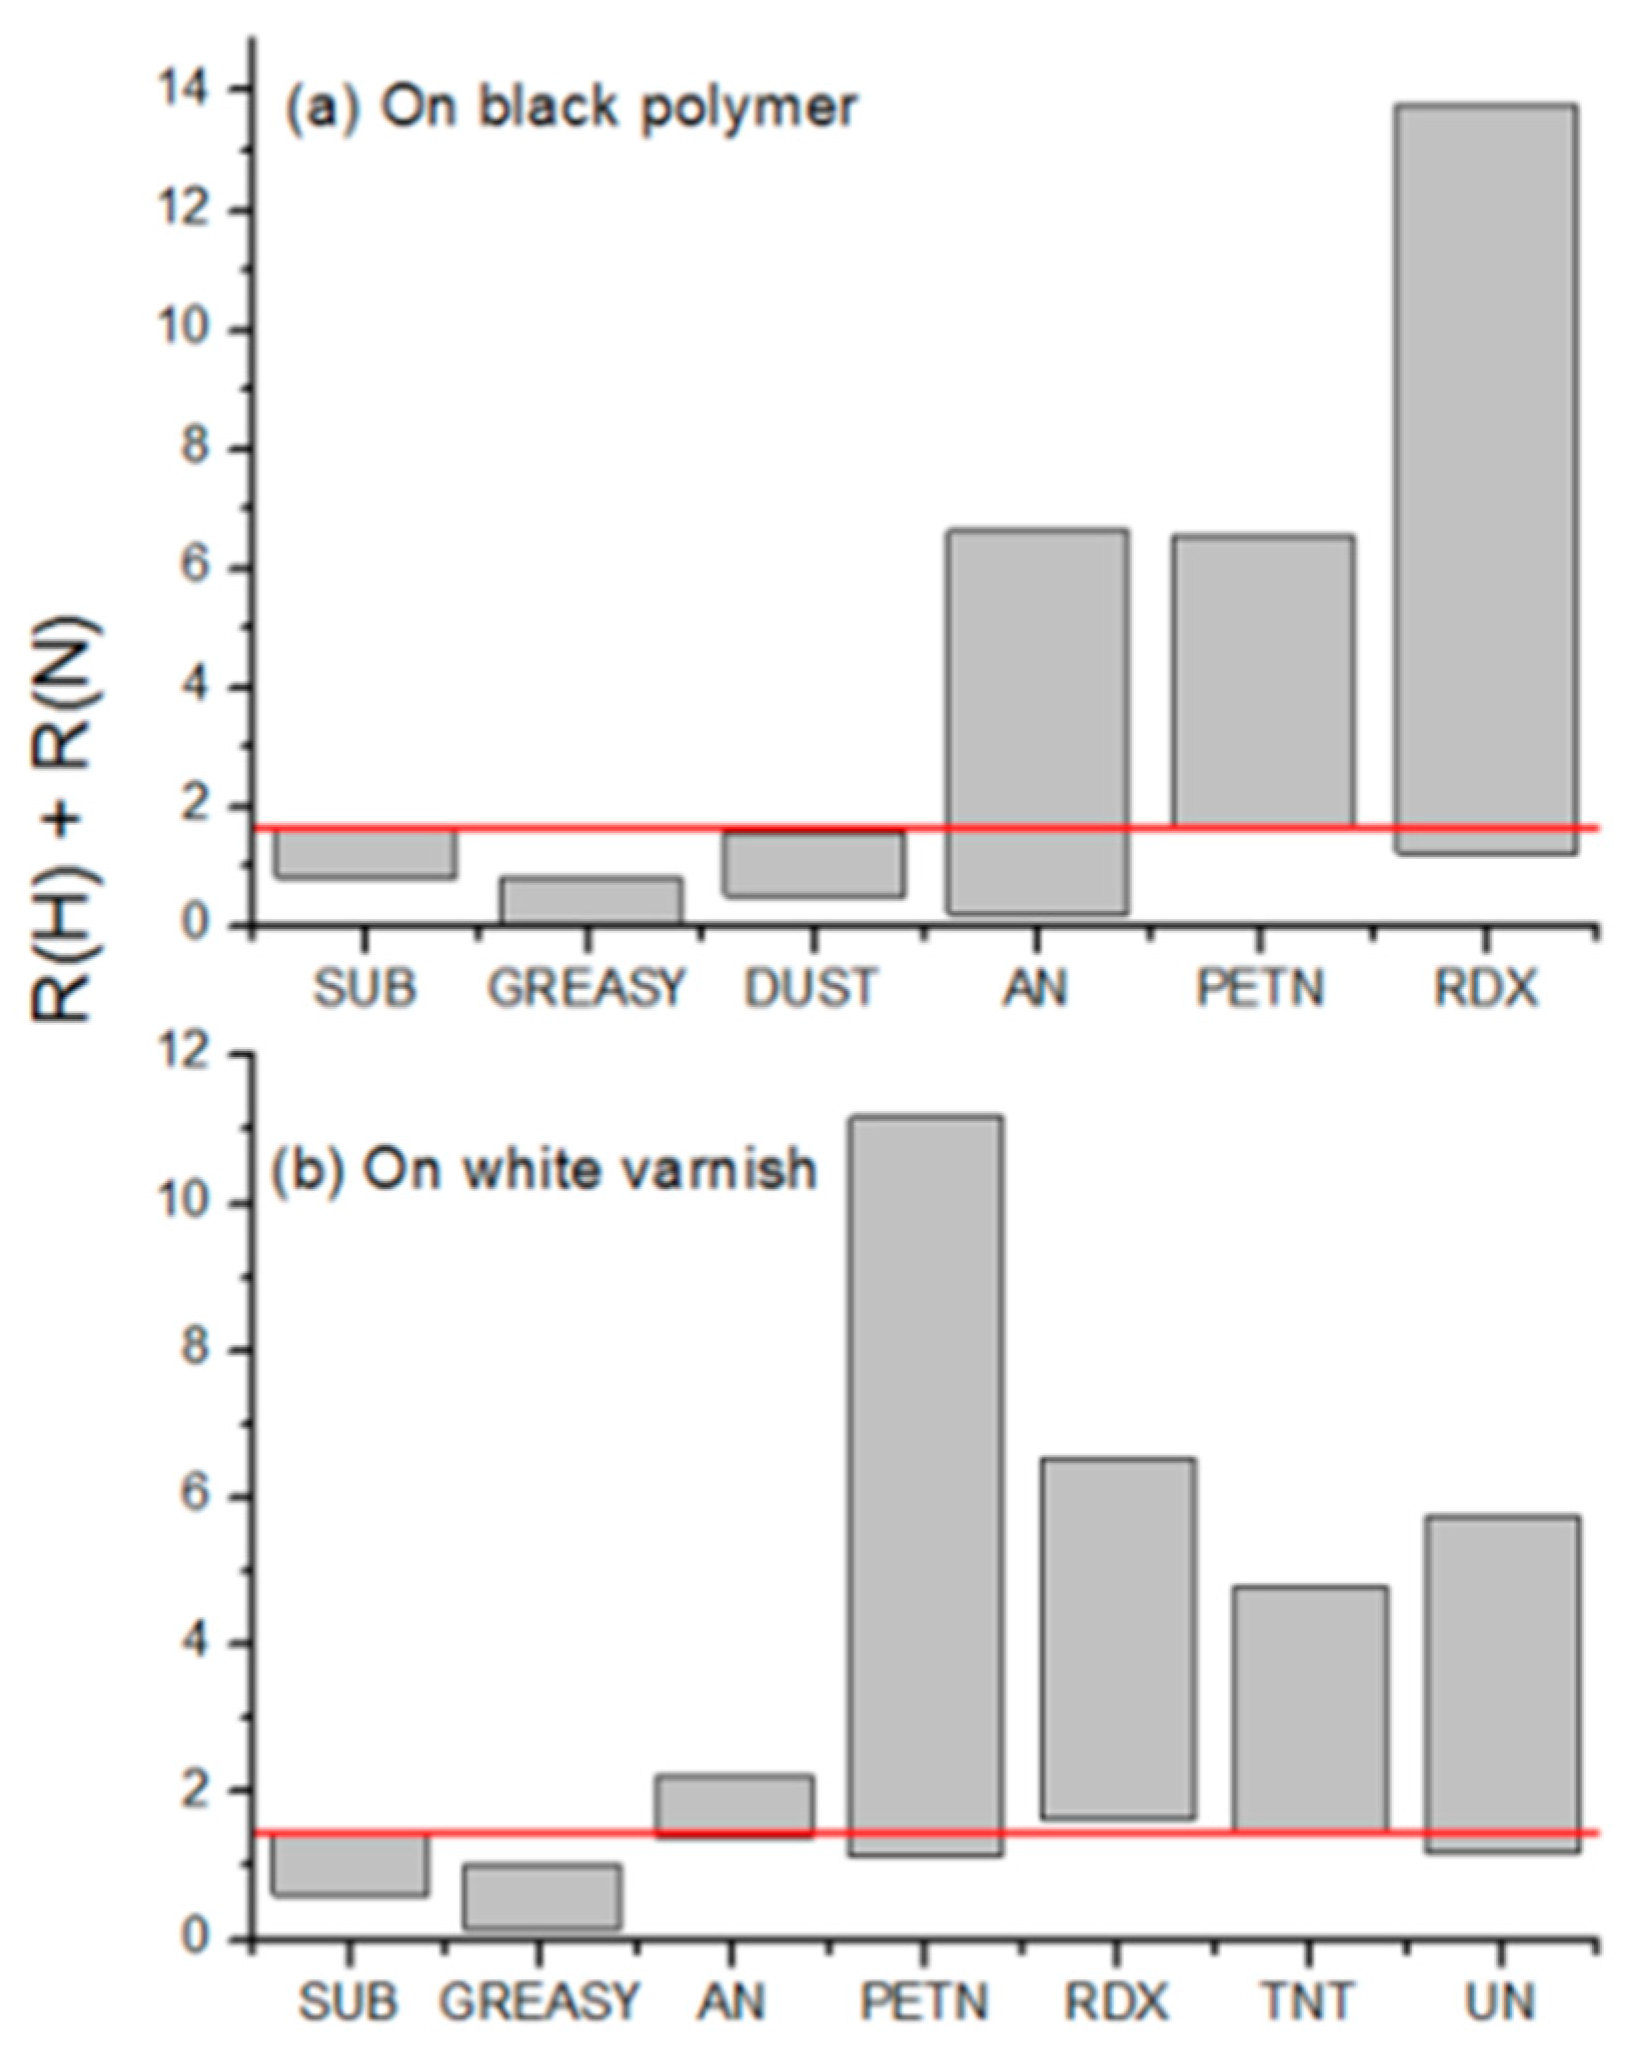
- Raman measurements over the whole target or just over the previously-tagged areas, in order to obtain eventual molecular identification.
- At the end, we performe LIBS measurements (micro-destructive) that supplies information about the elemental composition of the top sample layer(s).
3.1. LIF and LS Measurements
3.2. Internal Camera
3.3. Raman
3.4. LIBS
4. Discussion
5. Conclusions
6. Patents
Author Contributions
Funding
Conflicts of Interest
References
- Acosta-Maeda, T.E.; Misra, A.; Muzangwa, L.G.; Berlanga, G.; Muchow, D.; Porter, J.; Sharma, S.K. Remote Raman measurements of minerals, organics, and inorganics at 430 m range. Appl. Opt. 2016, 55, 10283–10289. [Google Scholar] [CrossRef] [PubMed]
- Chirico, R.; Almaviva, S.; Colao, F.; Fiorani, L.; Nuvoli, M.; Schweikert, W.; Schnürer, F.; Cassioli, L.; Grossi, S.; Murra, D.; et al. Proximal Detection of Traces of Energetic Materials with an Eye-Safe UV Raman Prototype Developed for Civil Applications. Sensors 2016, 16, 8. [Google Scholar] [CrossRef] [PubMed]
- Gaft, M.; Nagli, L. UV gated Raman spectroscopy for standoff detection of explosives. Opt. Mater. 2018, 30, 1739–1746. [Google Scholar] [CrossRef]
- Sharma, S.K.; Misra, A.K.; Sharma, B. Portable remote Raman system for monitoring hydrocarbon, gas hydrates and explosives in the environment. Spectrochim. Acta Part A 2005, 61, 2404–2412. [Google Scholar] [CrossRef]
- Sharma, S.K. New trends in telescopic remote Raman spectroscopic instrumentation. Spectrochim. Acta Part A 2007, 68, 1008–1022. [Google Scholar] [CrossRef] [PubMed]
- Spizzichino, V.; Caneve, L.; Colao, F.; Ruggiero, L. Characterization and Discrimination of Plastic Materials Using Laser-Induced Fluorescence. Appl. Spectrosc. 2016, 70, 1001–1008. [Google Scholar] [CrossRef]
- Kumar, D.; Sharma, R.C.; Maini, A.K. Standoff Laser-Induced Fluorescence Sensors for Biological Warfare Agents. Spectrosc. Lett. 2013, 46, 147–153. [Google Scholar] [CrossRef]
- Caneve, L.; Colao, F.; Fantoni, R.; Fiorani, L. Scanning lidar fluorosensor for remote diagnostic of surfaces. Nucl. Instrum. Methods Phys. Res. A 2013, 720, 164–167. [Google Scholar] [CrossRef]
- Matvienko, G.G.; Grishin, A.I.; Kharchenko, O.V.; Romanovskii, O.A. Application of laser-induced fluorescence for remote sensing of vegetation. Opt. Eng. 2006, 45, 056201. [Google Scholar] [CrossRef]
- Álvarez-Trujillo, L.A.; Lazic, V.; Moros, J.; Laserna, J.J. Standoff monitoring of aqueous aerosols using nanosecond laser-induced breakdown spectroscopy: Droplet size and matrix effects. Appl. Opt. 2017, 56, 3773–3782. [Google Scholar] [CrossRef]
- Lazic, V.; Trujillo-Vazquez, A.; Sobral, H.; Márquez, C.; Palucci, A.; Ciaffi, M.; Pistilli, M. Corrections for variable plasma parameters in laser induced breakdown spectroscopy: Application on archeological samples. Spectrochim. Acta Part B 2016, 122, 103–113. [Google Scholar] [CrossRef]
- Kumar, S.; Vasa, N.J.; Sarathi, R. Remote surface pollutant measurement by adopting a variable stand-off distance based laser induced spectroscopy technique. J. Phys. D Appl. Phys. 2015, 48, 435504. [Google Scholar] [CrossRef]
- Gaona, I.; Lucena, P.; Moros, J.; Fortes, F.J.; Guirado, S.; Serrano, J.; Laserna, J.J. Evaluating the use of standoff LIBS in architectural heritage: Surveying the Cathedral of Màlaga. J. Anal. At. Spectrom. 2013, 28, 810–820. [Google Scholar] [CrossRef]
- Vítková, G.; Novotný, K.; Prokeš, L.; Hrdlička, A.; Kaiser, J.; Novotný, J.; Malina, R.; Prochazka, D. Fast identification of biominerals by means of stand-off laser-induced breakdown spectroscopy using linear discriminant analysis and artificial neural networks. Spectrochim. Acta Part B 2012, 73, 1–6. [Google Scholar] [CrossRef]
- Lòpez-Moreno, C.; Palanco, S.; Laserna, J.J.; DeLucia, F., Jr.; Miziolek, A.W.; Rose, J.; Walters, R.A.; Whitehouse, A.I. Test of a stand-off laser-induced breakdown spectroscopy sensor for the detection of explosive residues on solid surfaces. J. Anal. At. Spectrom. 2006, 21, 55–60. [Google Scholar] [CrossRef]
- López-Moreno, C.; Palanco, S.; Laserna, J.J. Stand-off analysis of moving targets using laser-induced breakdown spectroscopy. J. Anal. At. Spectrom. 2007, 22, 84–87. [Google Scholar] [CrossRef]
- Wiens, R.C.; Sharma, S.K.; Thompson, J.; Misra, A.; Lucey, P.G. Joint analyses by laser-induced breakdown spectroscopy (LIBS) and Raman spectroscopy at stand-off distances. Spectrochim. Acta Part A 2005, 61, 2324–2334. [Google Scholar] [CrossRef]
- Moros, J.; Lorenzo, J.A.; Lucena, P.; Tobaria, L.M.; Laserna, J. Simultaneous Raman spectroscopy-laser-induced breakdown spectroscopy for instant standoff analysis of explosives using a mobile integrated sensor platform. Anal. Chem. 2010, 82, 1389–1400. [Google Scholar] [CrossRef] [PubMed]
- Lin, Q.; Niu, G.; Wang, Q.; Yu, Q.; Duan, Y. Combined Laser-Induced Breakdown with Raman Spectroscopy: Historical Technology Development and Recent Applications. Appl. Spectrosc. Rev. 2013, 48, 487–508. [Google Scholar] [CrossRef]
- Lednev, V.N.; Pershin, S.M.; Sdvizhenskii, P.A.; Grishin, M.Y.; Fedorov, A.N.; Bukin, V.V.; Shchegolikhin, A.N. Combining Raman and laser induced breakdown spectroscopy by double pulse lasing. Anal. Bioanal. Chem. 2018, 410, 277–286. [Google Scholar] [CrossRef]
- Osticioli, I.; Mendes, N.F.C.; Nevin, A.; Zoppi, A.; Lofrumento, C.; Becucci, M.; Castellucci, E.M. A new compact instrument for Raman, laser-induced breakdown, and laser-induced fluorescence spectroscopy of works of art and their constituent materials. Rev. Sci. Instrum. 2009, 80, 076109. [Google Scholar] [CrossRef] [PubMed]
- Abedin, M.N.; Bradley, A.T.; Sharma, S.K.; Misra, A.K.; Lucey, P.G.; McKay, C.P.; Ismail, S.; Sandford, S.P. Mineralogy and astrobiology detection using laser remote sensing instrument. Appl. Opt. 2015, 54, 7598–7611. [Google Scholar] [CrossRef] [PubMed]
- Perez, R.; Parès, L.P.; Newell, R.; Robinson, S. The Supercam instrument on the NASA Mars 2020 mission: Optical design and performance. Proc. SPIE 2016, 10562, 105622K. [Google Scholar]
- Wiens, R.C.; Maurice, S.; Perez, F.R. The SuperCam Remote Sensing Instrument Suite for the Mars 2020 Rover: A Preview. Spectroscopy 2017, 32, 50–55. [Google Scholar]
- Wallin, S.; Pettersson, A.; Östmark, H.; Hobro, A. Laser-based standoff detection of explosives: A critical review. Anal. Bioanal. Chem. 2009, 395, 259–274. [Google Scholar] [CrossRef] [PubMed]
- Skvortsov, L.A. Laser methods for detecting explosive residues on surfaces of distant objects. Quantum Electron. 2012, 42, 1–11. [Google Scholar] [CrossRef]
- Hallowell, S.F. Screening people for illicit substances: A survey of current portal technology. Talanta 2001, 54, 447–458. [Google Scholar] [CrossRef]
- Gresham, G.L.; Davies, J.P.; Goodrich, L.D.; Blackwood, L.G.; Liu, B.Y.H.; Thimsem, D.; Yoo, S.H.; Hallowel, S.F. Development of particle standards for testing detection systems: Mass of RDX and particle size distribution of composition 4 residues. Proc. SPIE 1994, 2275, 34–44. [Google Scholar]
- Verkouteren, J.R.; Coleman, J.L.; Cho, I. Automated Mapping of Explosives Particles in Composition C-4 Fingerprints. J. Forensic Sci. 2010, 55, 334–340. [Google Scholar] [CrossRef]
- Lees, H.; Zapata, F.; Vaher, M.; García-Ruiz, C. Study of the adhesion of explosive residues to the finger and transfer to clothing and luggage. Sci. Justice 2018, 58, 415–424. [Google Scholar] [CrossRef]
- Yan, Z.; Zhang, C.; Liu, W.; Li, J.; Huang, M.; Wang, X.; Zhou, G.; Tan, B.; Yang, Z.; Li, Z.; et al. Ultraviolet Laser-induced ignition of RDX single crystal. Sci. Rep. 2016, 6, 20251. [Google Scholar] [CrossRef] [PubMed]
- Kalenskii, A.V.; Zvekov, А.A.; Galkina, E.V. The critical parameters of the thermal explosion micro hotspot model dependence on the pulse duration. IOP Conf. Ser. J. Phys. 2017, 830, 012128. [Google Scholar] [CrossRef]
- Gottfried, J.L.; De Lucia Jr, F.C.; Munson, C.A.; Miziolek, A.W. Strategies for residue explosives detection using laser-induced breakdown spectroscopy. J. Anal. At. Spectrom. 2008, 23, 205–216. [Google Scholar] [CrossRef]
- Shaik, A.K.; Epuru, N.R.; Syed, H.; Byram, C.; Soma, V.R. Femtosecond laser induced breakdown spectroscopy based standoff detection of explosives and discrimination using principal component analysis. Opt. Express 2018, 26, 8069–8083. [Google Scholar] [CrossRef] [PubMed]
- Lazic, V.; Palucci, A.; Jovicevic, S.; Poggi, C.; Buono, E. Analysis of explosive and other organic residues by laser induced breakdown spectroscopy. Spectrochim. Acta Part B 2009, 64, 1028–1039. [Google Scholar] [CrossRef]
- Lazic, V.; Palucci, A.; Jovicevic, S.; Carpanese, M. Detection of explosives in traces by laser induced breakdown spectroscopy: Differences from organic interferents and conditions for a correct classification. Spectrochim. Acta Part B 2011, 66, 644–655. [Google Scholar] [CrossRef]


| Feature | Specifications | Notes |
|---|---|---|
| Distance measurements | Limit 500 m (1), resolution 0.1 mm | (1) On reflective target |
| Target distance | 8.5–30 m (2) | (2) tested; estimated >100 m |
| Autofocus | Yes | |
| Scanning resolution | 0.1 mrad | 1 mm at a distance of 10 m |
| LIF measurements | Laser @355 nm, filter (3), Echelle spectrometer | (3) Razor edge 355 nm |
| Scattering measurements | Laser @650 nm, filter (3), Echelle spectrometer | Simultaneous with LIF |
| Raman measurements | Laser @355 nm, filter (3), Czerny-Turner (4) | (4) Higher throughput than Echelle |
| LIBS measurements | Laser @1064 nm, Echelle spectrometer | |
| Switching time between two measuring techniques | 10 s (5) | (5) Limited by the software |
| External camera | Color, 1280 × 1024 pixel, with objective f 35 | Always acquiring |
| Internal camera | Color, 1280 × 1024 pixel, magnification 3.5X − 22 × for the target distance of 8.5−30 m | Alternative to the spectroscopic measurements |
| Control | WiFi and the dedicated software (6) | (6) ENEA’s property |
| Ambient temperature | 10 °C (7)–35 °C | (7) tested 10 °C–40 °C |
| Distance (m) | Th. Spot ø (mm) 355/1064 nm | Used Spot ø (mm) 355/1064 nm | Area ø (mm) Imaged on the Fiber Bundle | Area ø (mm) Imaged on the Large Core Fiber | Lateral Resolution (mm) Raman/LIF/LIBS |
|---|---|---|---|---|---|
| 8.5 | 0.19/0.55 | 7.2/1.1 | 7.7 | 2.8 | 7.2/2.8/1.1 |
| 10 | 0.22/0.68 | 9.2/1.3 | 9.2 | 3.3 | 9.2/3.3/1.3 |
| 30 | 0.67/1.96 | 28.2/2.2 | 28.6 | 10.4 | 28.6/10.4/2.2 |
© 2019 by the authors. Licensee MDPI, Basel, Switzerland. This article is an open access article distributed under the terms and conditions of the Creative Commons Attribution (CC BY) license (http://creativecommons.org/licenses/by/4.0/).
Share and Cite
Lazic, V.; Palucci, A.; De Dominicis, L.; Nuvoli, M.; Pistilli, M.; Menicucci, I.; Colao, F.; Almaviva, S. Integrated Laser Sensor (ILS) for Remote Surface Analysis: Application for Detecting Explosives in Fingerprints. Sensors 2019, 19, 4269. https://doi.org/10.3390/s19194269
Lazic V, Palucci A, De Dominicis L, Nuvoli M, Pistilli M, Menicucci I, Colao F, Almaviva S. Integrated Laser Sensor (ILS) for Remote Surface Analysis: Application for Detecting Explosives in Fingerprints. Sensors. 2019; 19(19):4269. https://doi.org/10.3390/s19194269
Chicago/Turabian StyleLazic, Violeta, Antonio Palucci, Luigi De Dominicis, Marcello Nuvoli, Marco Pistilli, Ivano Menicucci, Francesco Colao, and Salvatore Almaviva. 2019. "Integrated Laser Sensor (ILS) for Remote Surface Analysis: Application for Detecting Explosives in Fingerprints" Sensors 19, no. 19: 4269. https://doi.org/10.3390/s19194269
APA StyleLazic, V., Palucci, A., De Dominicis, L., Nuvoli, M., Pistilli, M., Menicucci, I., Colao, F., & Almaviva, S. (2019). Integrated Laser Sensor (ILS) for Remote Surface Analysis: Application for Detecting Explosives in Fingerprints. Sensors, 19(19), 4269. https://doi.org/10.3390/s19194269