Influence of Tuning Fork Resonance Properties on Quartz-Enhanced Photoacoustic Spectroscopy Performance


 , , ,
, , ,  ,
,  ,
, 
Abstract
1. Introduction
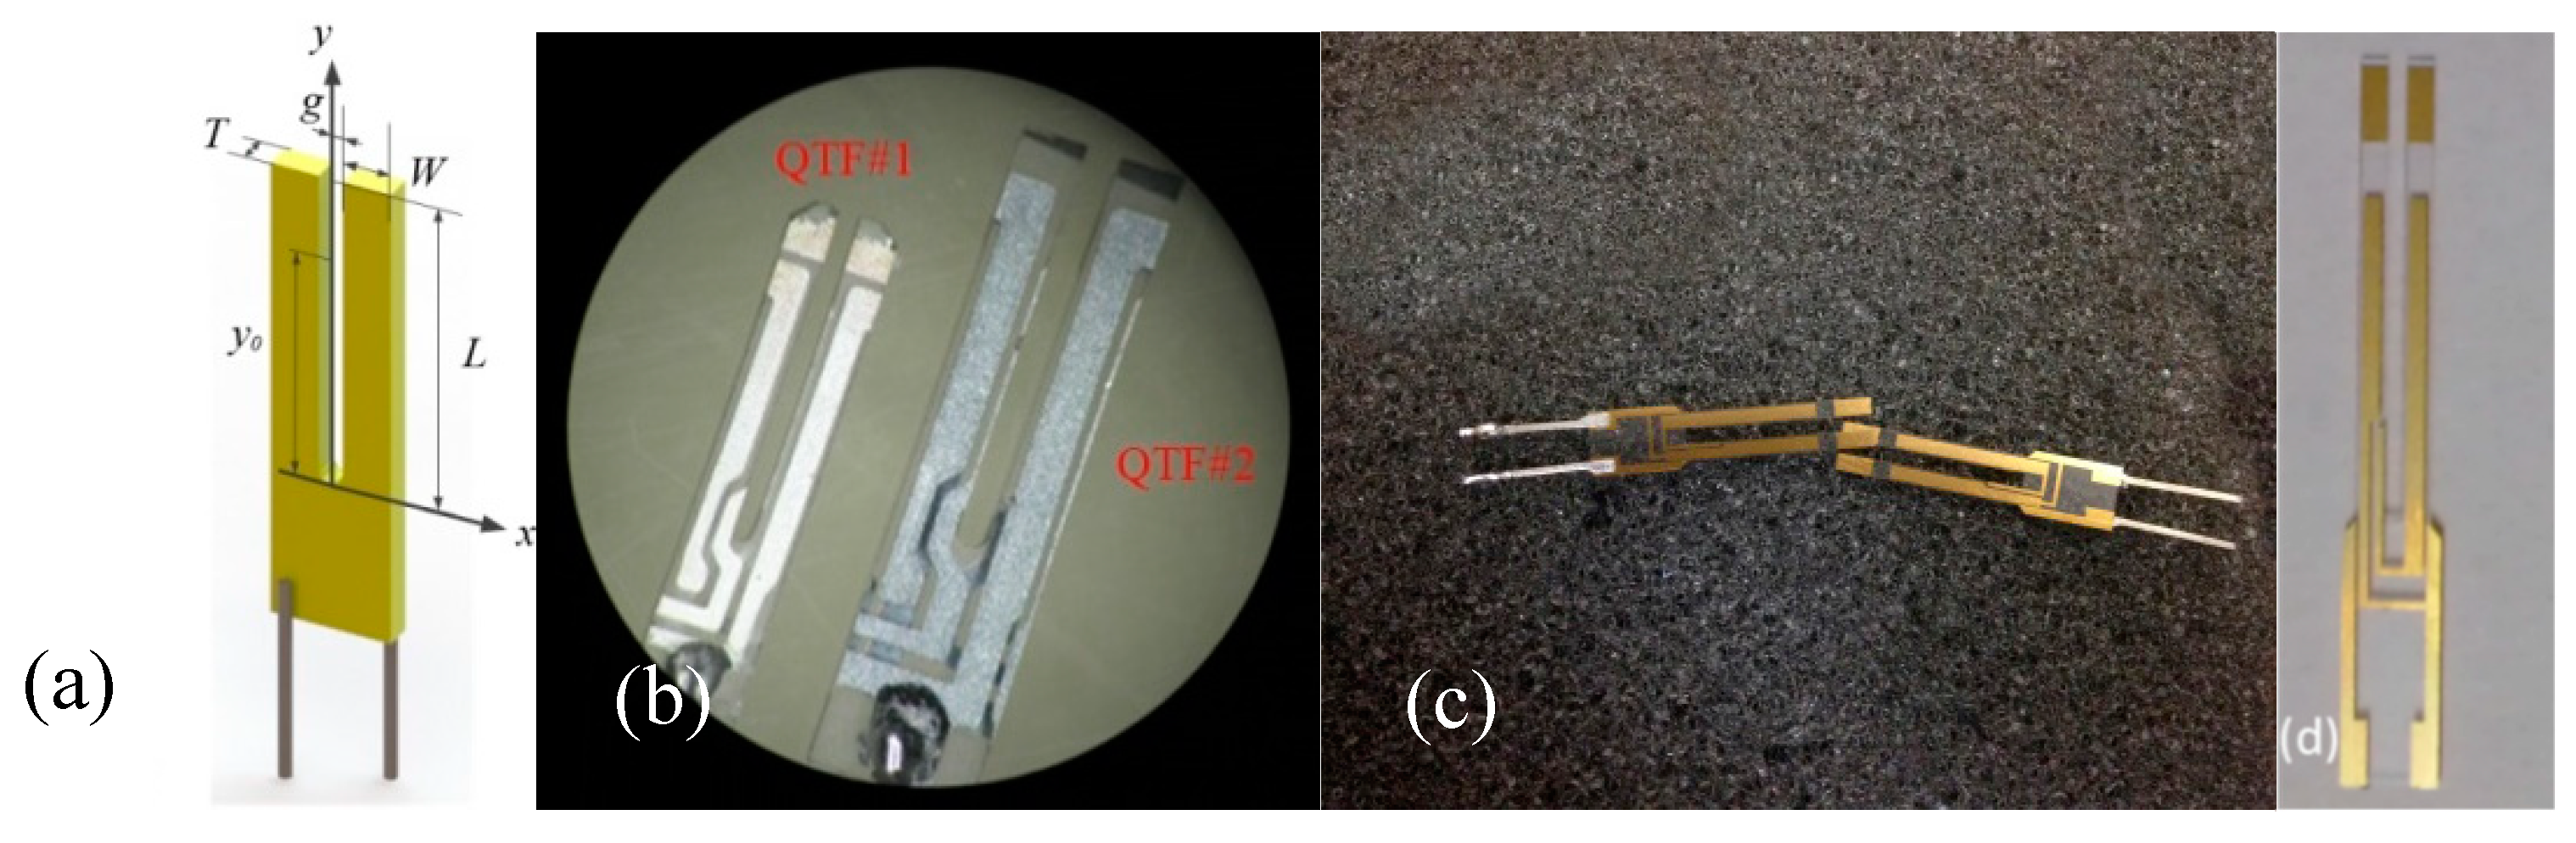
2. Quartz Tuning Fork Characterization
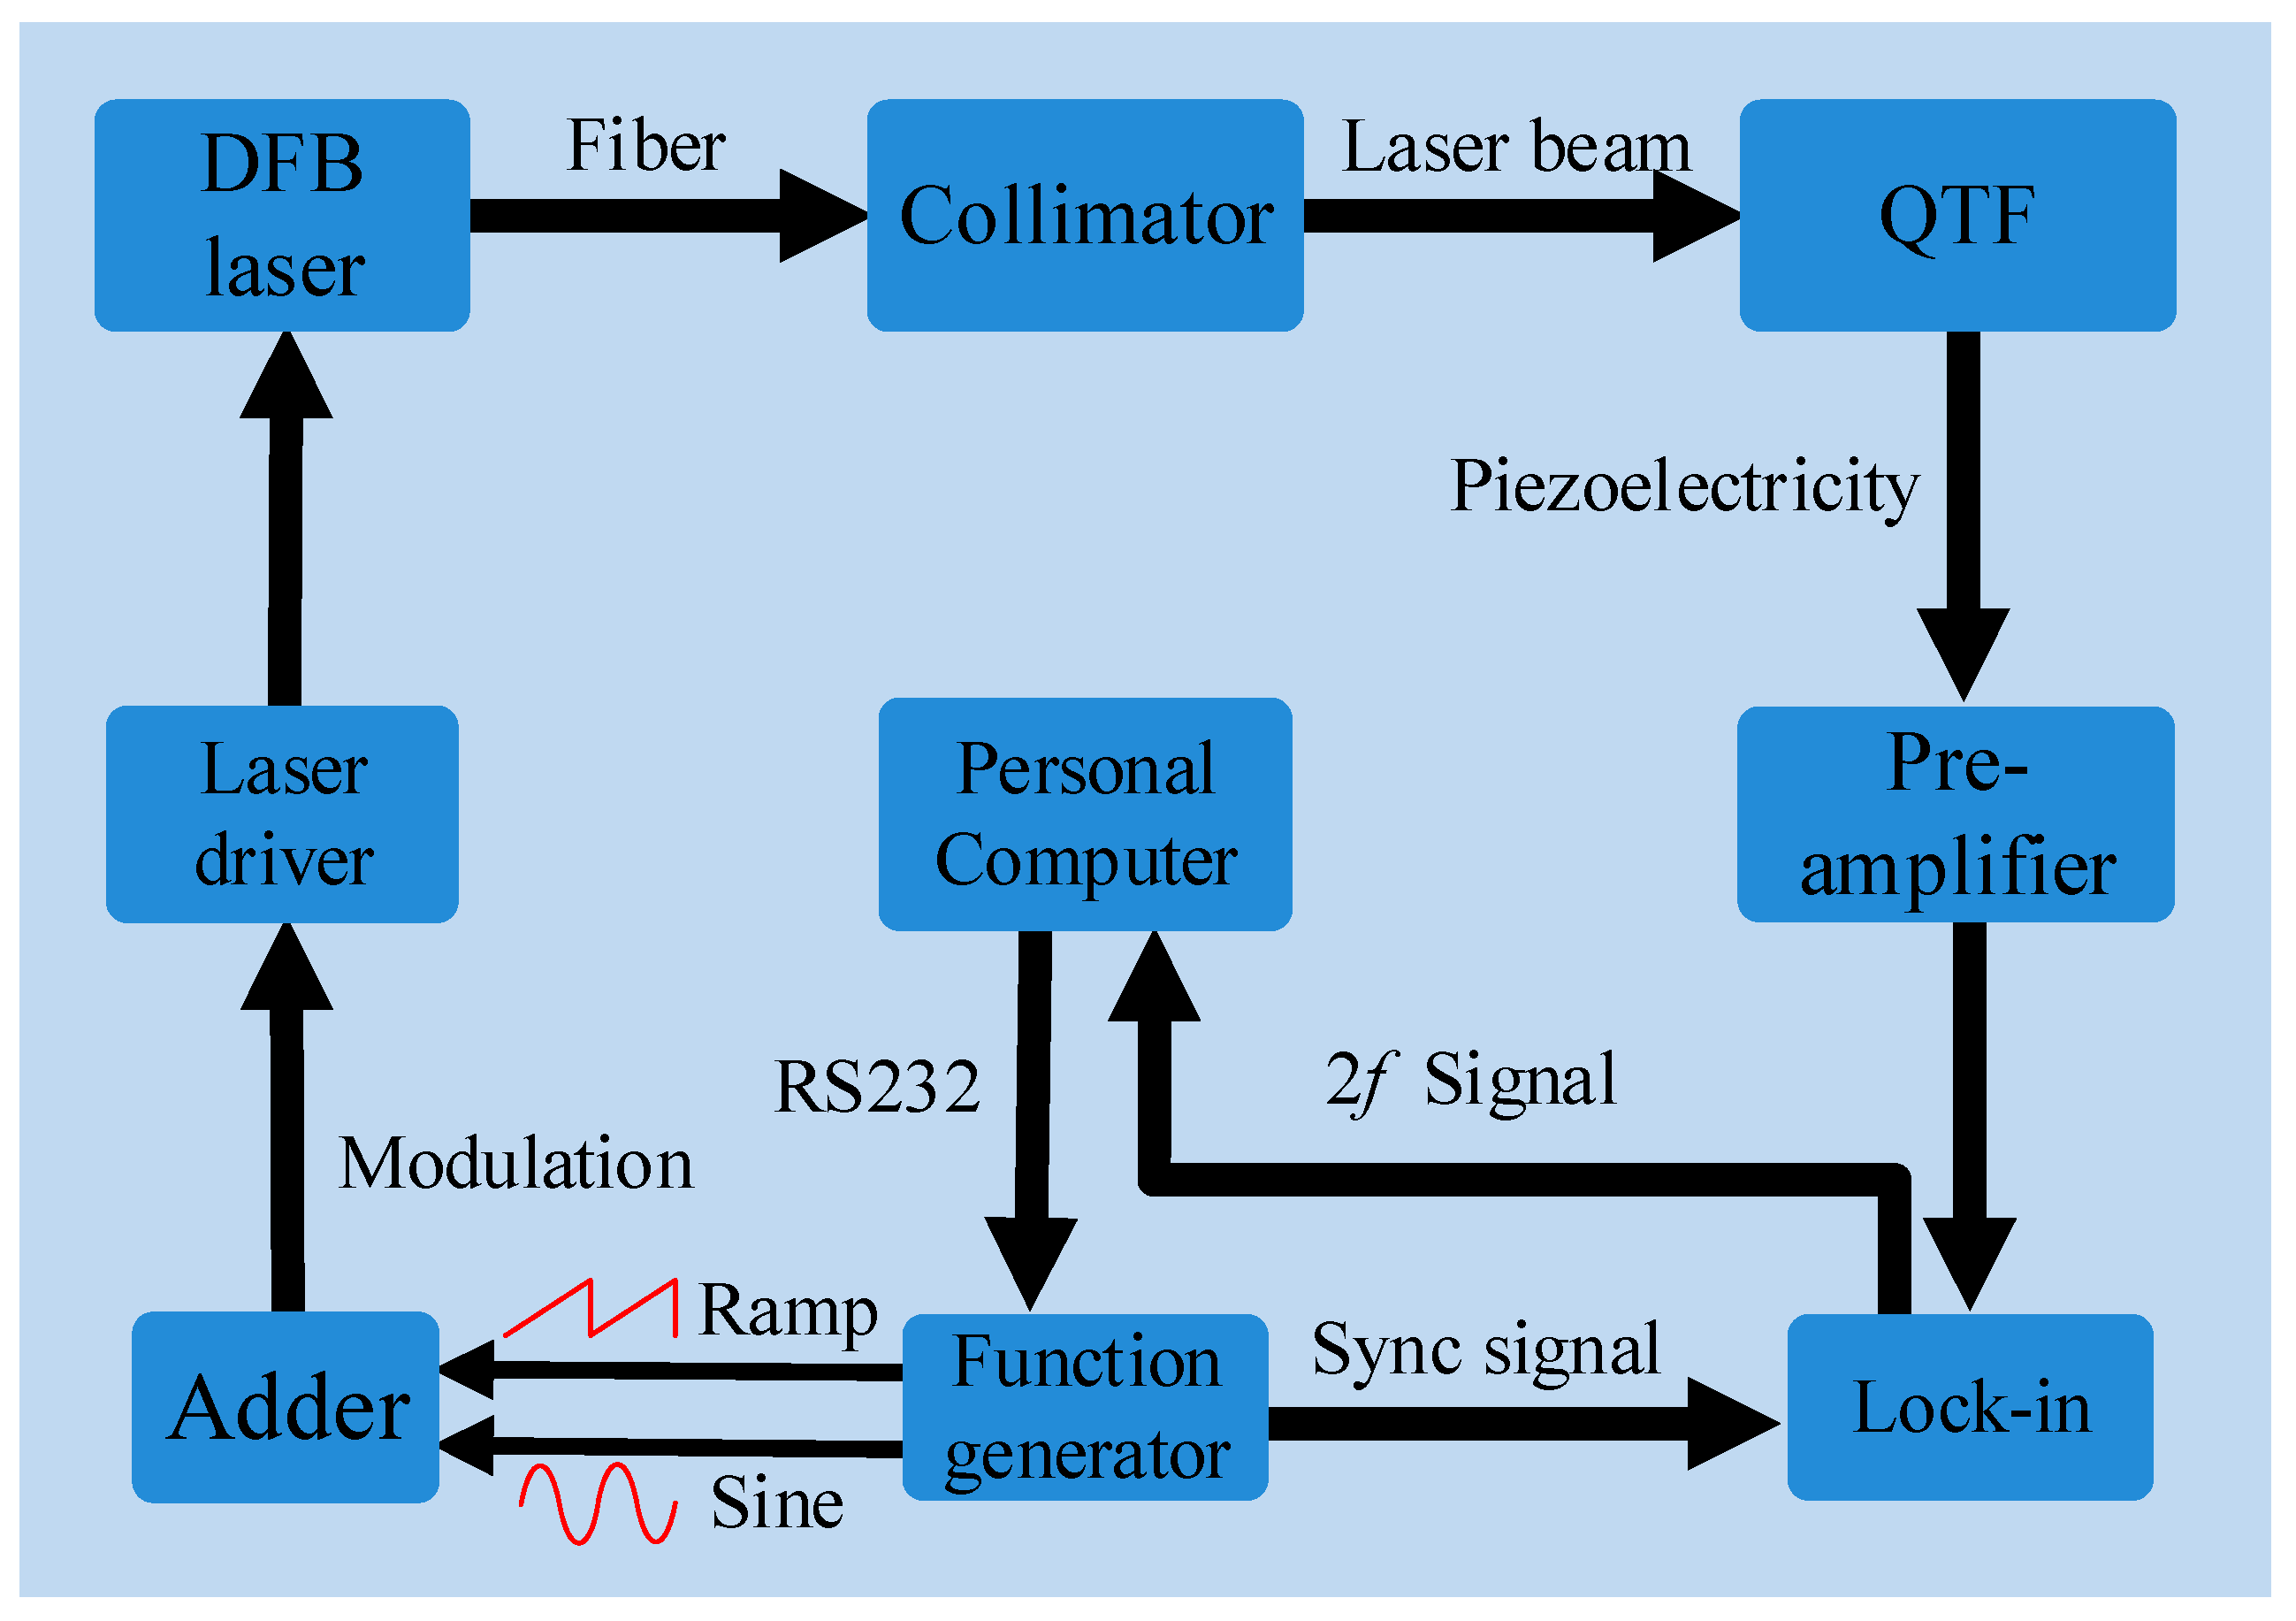
3. Quartz-Enhanced Photoacoustic Sensor
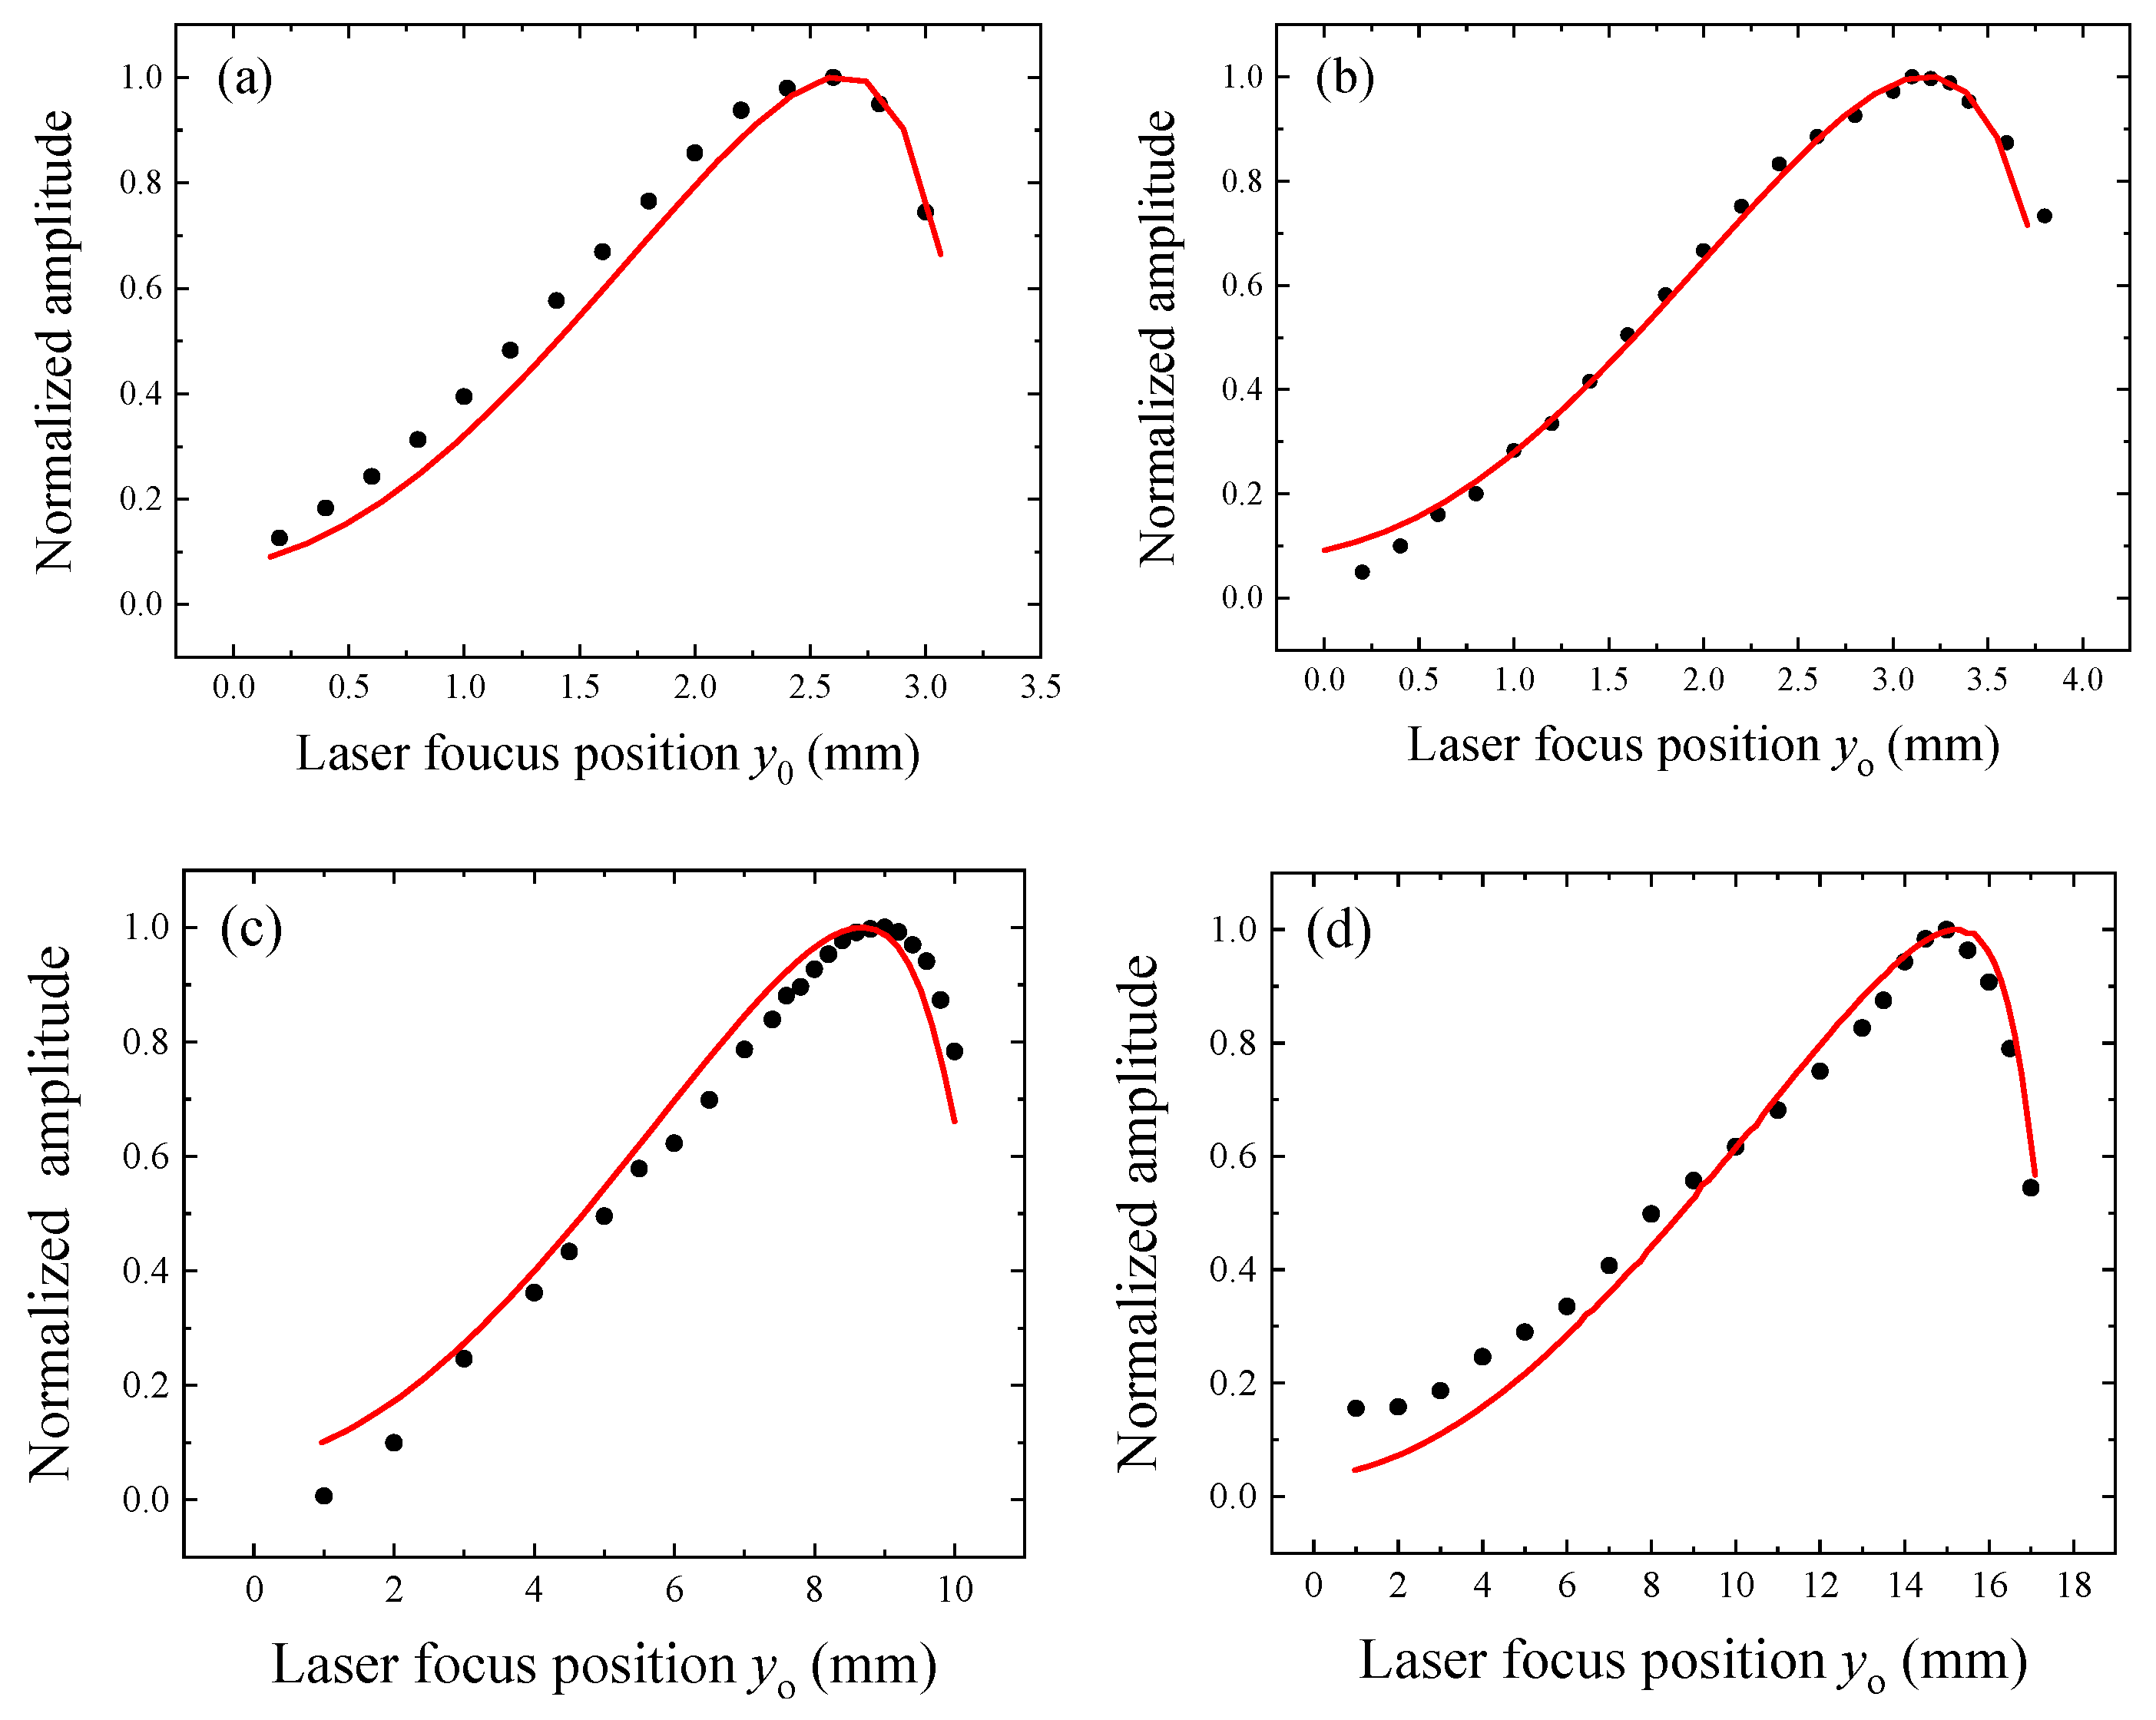
3.1. Optimization of Laser Beam Position
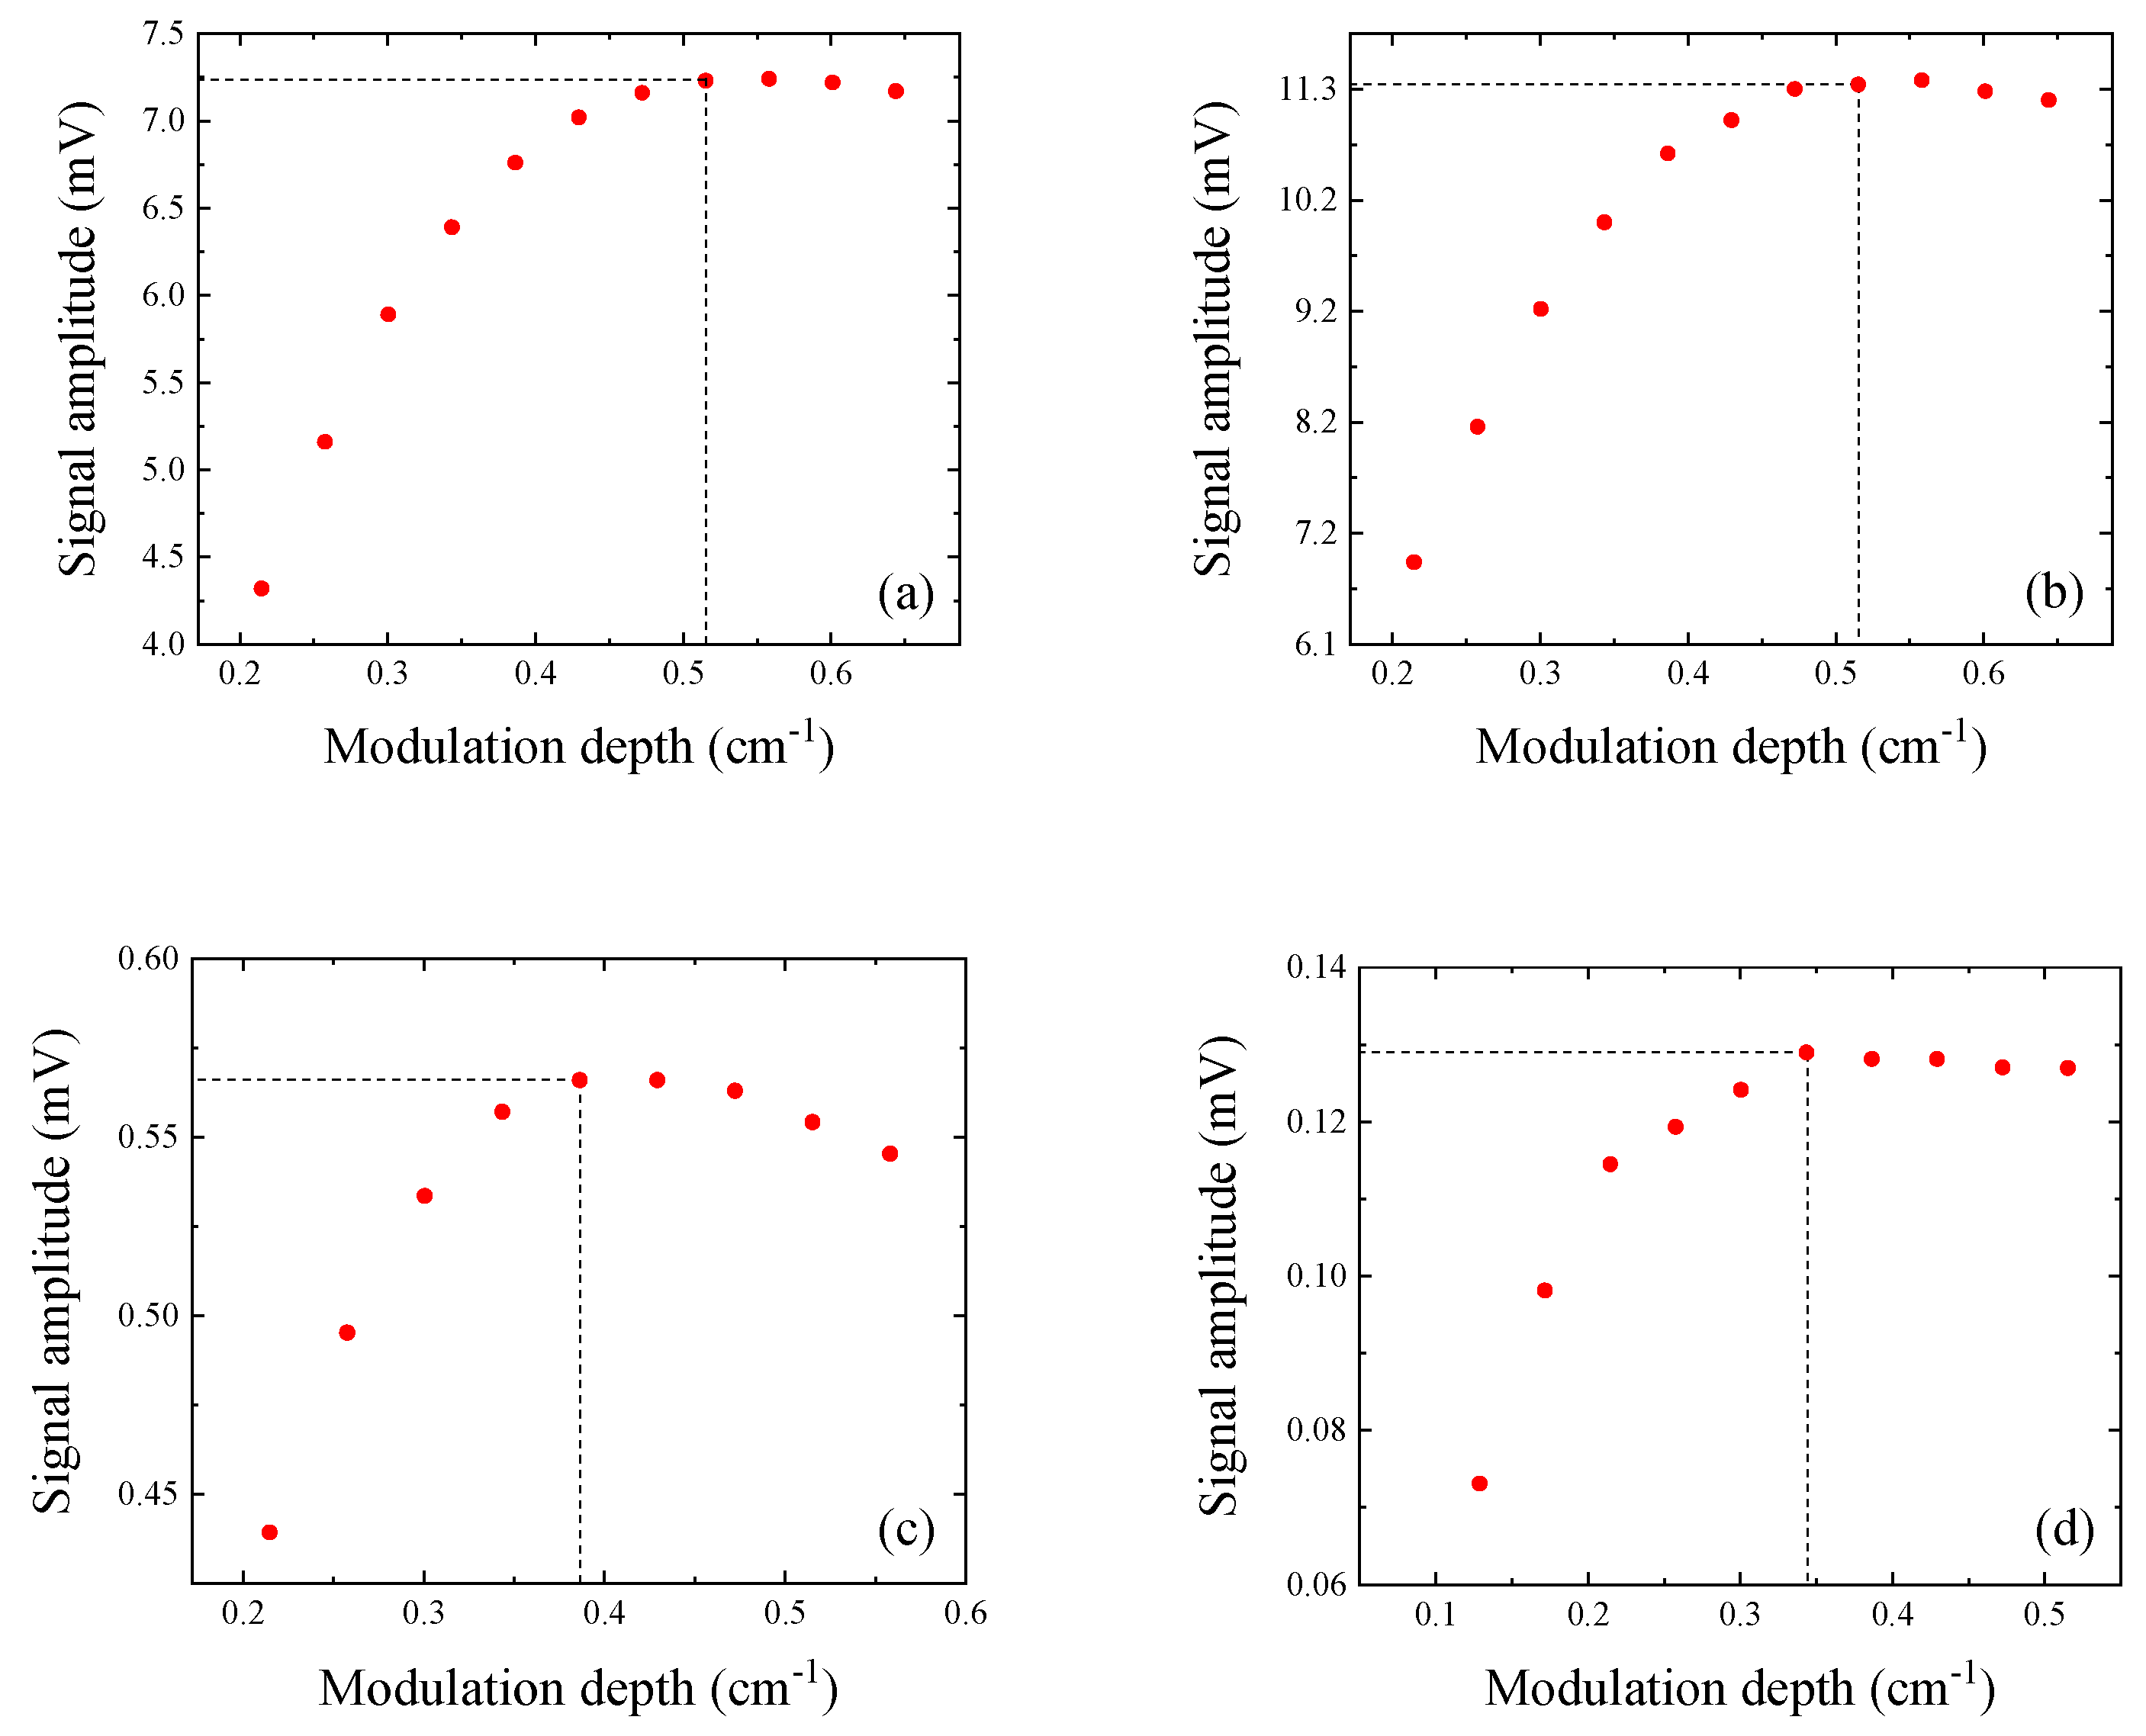
3.2. Optimization of Laser Modulation Depth
4. QEPAS Sensor Performance
5. Conclusions
Author Contributions
Funding
Conflicts of Interest
References
- Sigrist, M.W. Trace gas monitoring by laser photoacoustic spectroscopy and related techniques. Rev. Sci. Instrum. 2003, 74, 486–490. [Google Scholar] [CrossRef]
- Elia, A.; Lugarà, P.M.; Franco, C.D.; Spagnolo, V. Photoacoustic Techniques for Trace Gas Sensing Based on Semiconductor Laser Sources. Sensors 2009, 9, 9616–9628. [Google Scholar] [CrossRef] [PubMed]
- Tomberg, T.; Vainio, M.; Hieta, T.; Halonen, L. Sub-parts-per-trillion level sensitivity in trace gas detection by cantilever-enhanced photo-acoustic spectroscopy. Sci. Rep. 2018, 8, 1848. [Google Scholar] [CrossRef] [PubMed]
- Kosterev, A.A.; Bakhirkin, Y.A.; Curl, R.F.; Tittel, F.K. Quartz-enhanced photoacoustic spectroscopy. Opt. Lett. 2002, 27, 1902–1904. [Google Scholar] [CrossRef] [PubMed]
- Kosterev, A.A.; Tittel, F.K.; Serebryakov, D.V.; Malinovsky, A.L.; Morozov, I.V. Applications of quartz tuning forks in spectroscopic gas sensing. Rev. Sci. Instrum. 2005, 76, 043105. [Google Scholar] [CrossRef]
- Patimisco, P.; Sampaolo, A.; Dong, L.; Tittel, F.K.; Spagnolo, V. Recent advances in quartz enhanced photoacoustic sensing. Appl. Phys. Rev. 2018, 5, 011106. [Google Scholar] [CrossRef]
- Patimisco, P.; Scamarcio, G.; Tittel, F.K.; Spagnolo, V. Quartz-Enhanced Photoacoustic Spectroscopy: A Review. Sensors 2014, 14, 6165–6206. [Google Scholar] [CrossRef] [PubMed]
- Patimisco, P.; Borri, S.; Sampaolo, A.; Beere, H.E.; Ritchie, D.A.; Vitiello, M.S.; Scamarcio, G.; Spagnolo, V. A quartz enhanced photo-acoustic gas sensor based on a custom tuning fork and a terahertz quantum cascade laser. Analyst 2014, 139, 2079–2087. [Google Scholar] [CrossRef] [PubMed]
- Wang, Q.; Wang, Z.; Ren, W.; Patimisco, P.; Sampaolo, A.; Spagnolo, V. Fiber-ring laser intracavity QEPAS gas sensor using a 7.2 kHz quartz tuning fork. Sens. Actuators B Chem. 2018, 268, 512–518. [Google Scholar] [CrossRef]
- Böttger, S.; Köhring, M.; Willer, U.; Schade, W. Off-beam quartz-enhanced photoacoustic spectroscopy with LEDs. Appl. Phys. B 2013, 113, 227–232. [Google Scholar] [CrossRef]
- Dong, L.; Kosterev, A.A.; Thomazy, D.; Tittel, F.K. QEPAS spectrophones: Design, optimization, and performance. Appl. Phys. B 2010, 100, 627–635. [Google Scholar] [CrossRef]
- Sampaolo, A.; Patimisco, P.; Dong, L.; Geras, A.; Scamarcio, G.; Starecki, T.; Tittel, F.K.; Spagnolo, V. Quartz-enhanced photoacoustic spectroscopy exploiting tuning fork overtone modes. Appl. Phys. Lett. 2015, 107, 231102. [Google Scholar] [CrossRef]
- Tittel, F.K.; Sampaolo, A.; Patimisco, P.; Dong, L.; Geras, A.; Starecki, T.; Spagnolo, V. Analysis of overtone flexural modes operation in quartz-enhanced photoacoustic spectroscopy. Opt. Express 2016, 24, A682–A692. [Google Scholar] [CrossRef] [PubMed]
- Spagnolo, V.; Patimisco, P.; Borri, S.; Scamarcio, G.; Bernacki, B.E.; Kriesel, J. Mid-infrared fiber-coupled QCL-QEPAS sensor. Appl. Phys. B 2013, 122, 25–33. [Google Scholar] [CrossRef]
- Wu, H.; Sampaolo, A.; Dong, L.; Patimisco, P.; Liu, X.; Zheng, H.; Yin, X.; Ma, W.; Zhang, L.; Yin, W.; et al. Quartz enhanced photoacoustic H2S gas sensor based on a fiber-amplifier source and a custom tuning fork with large prong spacing. Appl. Phys. Lett. 2015, 107, 111104. [Google Scholar] [CrossRef]
- Giglio, M.; Patimisco, P.; Sampaolo, A.; Zifarelli, A.; Blanchard, R.; Pfluegl, C.; Witinski, M.F.; Vakhshoori, D.; Tittel, F.K.; Spagnolo, V. Nitrous oxide quartz-enhanced photoacoustic detection employing a broadband distributed-feedback quantum cascade laser array. Appl. Phys. Lett. 2018, 113, 171101. [Google Scholar] [CrossRef]
- Giglio, M.; Elefante, A.; Patimisco, P.; Sampaolo, A.; Sgobba, F.; Rossmadl, H.; Mackowiak, V.; Wu, H.; Tittel, F.K.; Dong, L.; et al. Quartz-enhanced photoacoustic sensor for ethylene detection implementing optimized custom tuning fork-based spectrophone. Opt. Express 2019, 27, 4271–4280. [Google Scholar] [CrossRef] [PubMed]
- Patimisco, P.; Sampaolo, A.; Giglio, M.; Dello Russo, S.; Mackowiak, V.; Rossmadl, H.; Cable, A.; Tittel, F.K.; Spagnolo, V. Tuning forks with optimized geometries for quartz-enhanced photoacoustic spectroscopy. Opt. Express 2019, 27, 1401–1415. [Google Scholar] [CrossRef] [PubMed]
- Zheng, H.; Dong, L.; Patimisco, P.; Wu, H.; Sampaolo, A.; Yin, X.; Li, S.; Ma, W.; Zhang, L.; Yin, W.; et al. Double antinode excited quartz-enhanced photoacoustic spectrophone. Appl. Phys. Lett. 2017, 110, 021110. [Google Scholar] [CrossRef]
- Wu, H.; Yin, X.; Dong, L.; Pei, K.; Sampaolo, A.; Patimisco, P.; Zheng, H.; Ma, W.; Zhang, L.; Yin, W.; et al. Simultaneous dual-gas QEPAS detection based on a fundamental and overtone combined vibration of quartz tuning fork. Appl. Phys. Lett. 2017, 110, 121104. [Google Scholar] [CrossRef]
- Lee, S.; Lee, J.Y.; Park, T.S. Fabrication of SMD 32.768 kHz tuning fork-type crystals: Photolithography and selective etching of an array of quartz tuning fork resonators. Mater. Corros. 2001, 52, 712–715. [Google Scholar] [CrossRef]
- Patimisco, P.; Sampaolo, A.; Dong, L.; Giglio, M.; Scamarcio, G.; Tittel, F.K.; Spagnolo, V. Analysis of the electro-elastic properties of custom quartz tuning forks for optoacoustic gas sensing. Sens. Actuators B Chem. 2016, 227, 539–546. [Google Scholar] [CrossRef]
- Patimisco, P.; Sampaolo, A.; Bidaux, Y.; Bismuto, A.; Scott, M.; Jiang, J.; Muller, A.; Faist, J.; Tittel, F.K.; Spagnolo, V. Purely wavelength- and amplitude-modulated quartz-enhanced photoacoustic spectroscopy. Opt. Express 2016, 24, 25943–25954. [Google Scholar] [CrossRef] [PubMed]
- The HITRAN Database. Available online: https://hitran.org/ (accessed on 1 September 2019).
- Giglio, M.; Menduni, G.; Patimisco, P.; Sampaolo, A.; Elefante, A.; Passaro, V.M.N.; Spagnolo, V. Damping Mechanisms of Piezoelectric Quartz Tuning Forks Employed in Photoacoustic Spectroscopy for Trace Gas Sensing. Phys. Status Solidi 2019, 216, 1800552. [Google Scholar] [CrossRef]
- Patimisco, P.; Sampaolo, A.; Mackowiak, V.; Rossmadl, H.; Cable, A.; Tittel, F.K.; Spagnolo, V. Loss Mechanisms Determining the Quality Factors in Quartz Tuning Forks Vibrating at the Fundamental and First Overtone Modes. IEEE Trans. Ultrason. Ferroelectr. Freq. Control 2018, 65, 1951–1957. [Google Scholar] [CrossRef] [PubMed]
- Giglio, M.; Patimisco, P.; Sampaolo, A.; Scamarcio, G.; Tittel, F.K.; Spagnolo, V. Allan Deviation Plot as a Tool for Quartz Enhanced Photoacoustic Sensors Noise Analysis. IEEE Trans. Ultrason. Ferroelectr. Freq. Control 2016, 63, 555–560. [Google Scholar] [CrossRef] [PubMed]
- Macias-Bobadilla, G.; Rodríguez-Reséndiz, J.; Mota-Valtierra, G.; Soto-Zarazúa, G.; Méndez-Loyola, M.; Garduño-Aparicio, M. Dual-phase lock-in amplifier based on FPGA for low-frequencies experiments. Sensors 2016, 16, 379. [Google Scholar] [CrossRef]


| QTF | Geometric Parameters | |||
|---|---|---|---|---|
| W (mm) | G (mm) | L (mm) | T (mm) | |
| #1 | 0.38 | 0.20 | 3.00 | 0.33 |
| #2 | 0.58 | 0.29 | 3.73 | 0.32 |
| #3 | 0.90 | 0.80 | 10.0 | 0.25 |
| #4 | 1.00 | 0.70 | 17.0 | 0.25 |
| QTF | Electric Parameters | |||
|---|---|---|---|---|
| fth (kHz) | f0 (kHz) | Q | R (kΩ) | |
| #1 | 32.55 | 32.75 | 8900 | 208 |
| #2 | 32.10 | 32.77 | 14,300 | 93 |
| #3 | 7.58 | 7.21 | 6900 | 351 |
| #4 | 2.91 | 2.86 | 5800 | 721 |
| Method | QTF#1 | QTF#2 | QTF#3 | QTF#4 |
|---|---|---|---|---|
| Theoretical (mm) | 2.6 | 3.1 | 9.0 | 15.0 |
| Experimental (mm) | 2.6 | 3.2 | 8.7 | 15.2 |
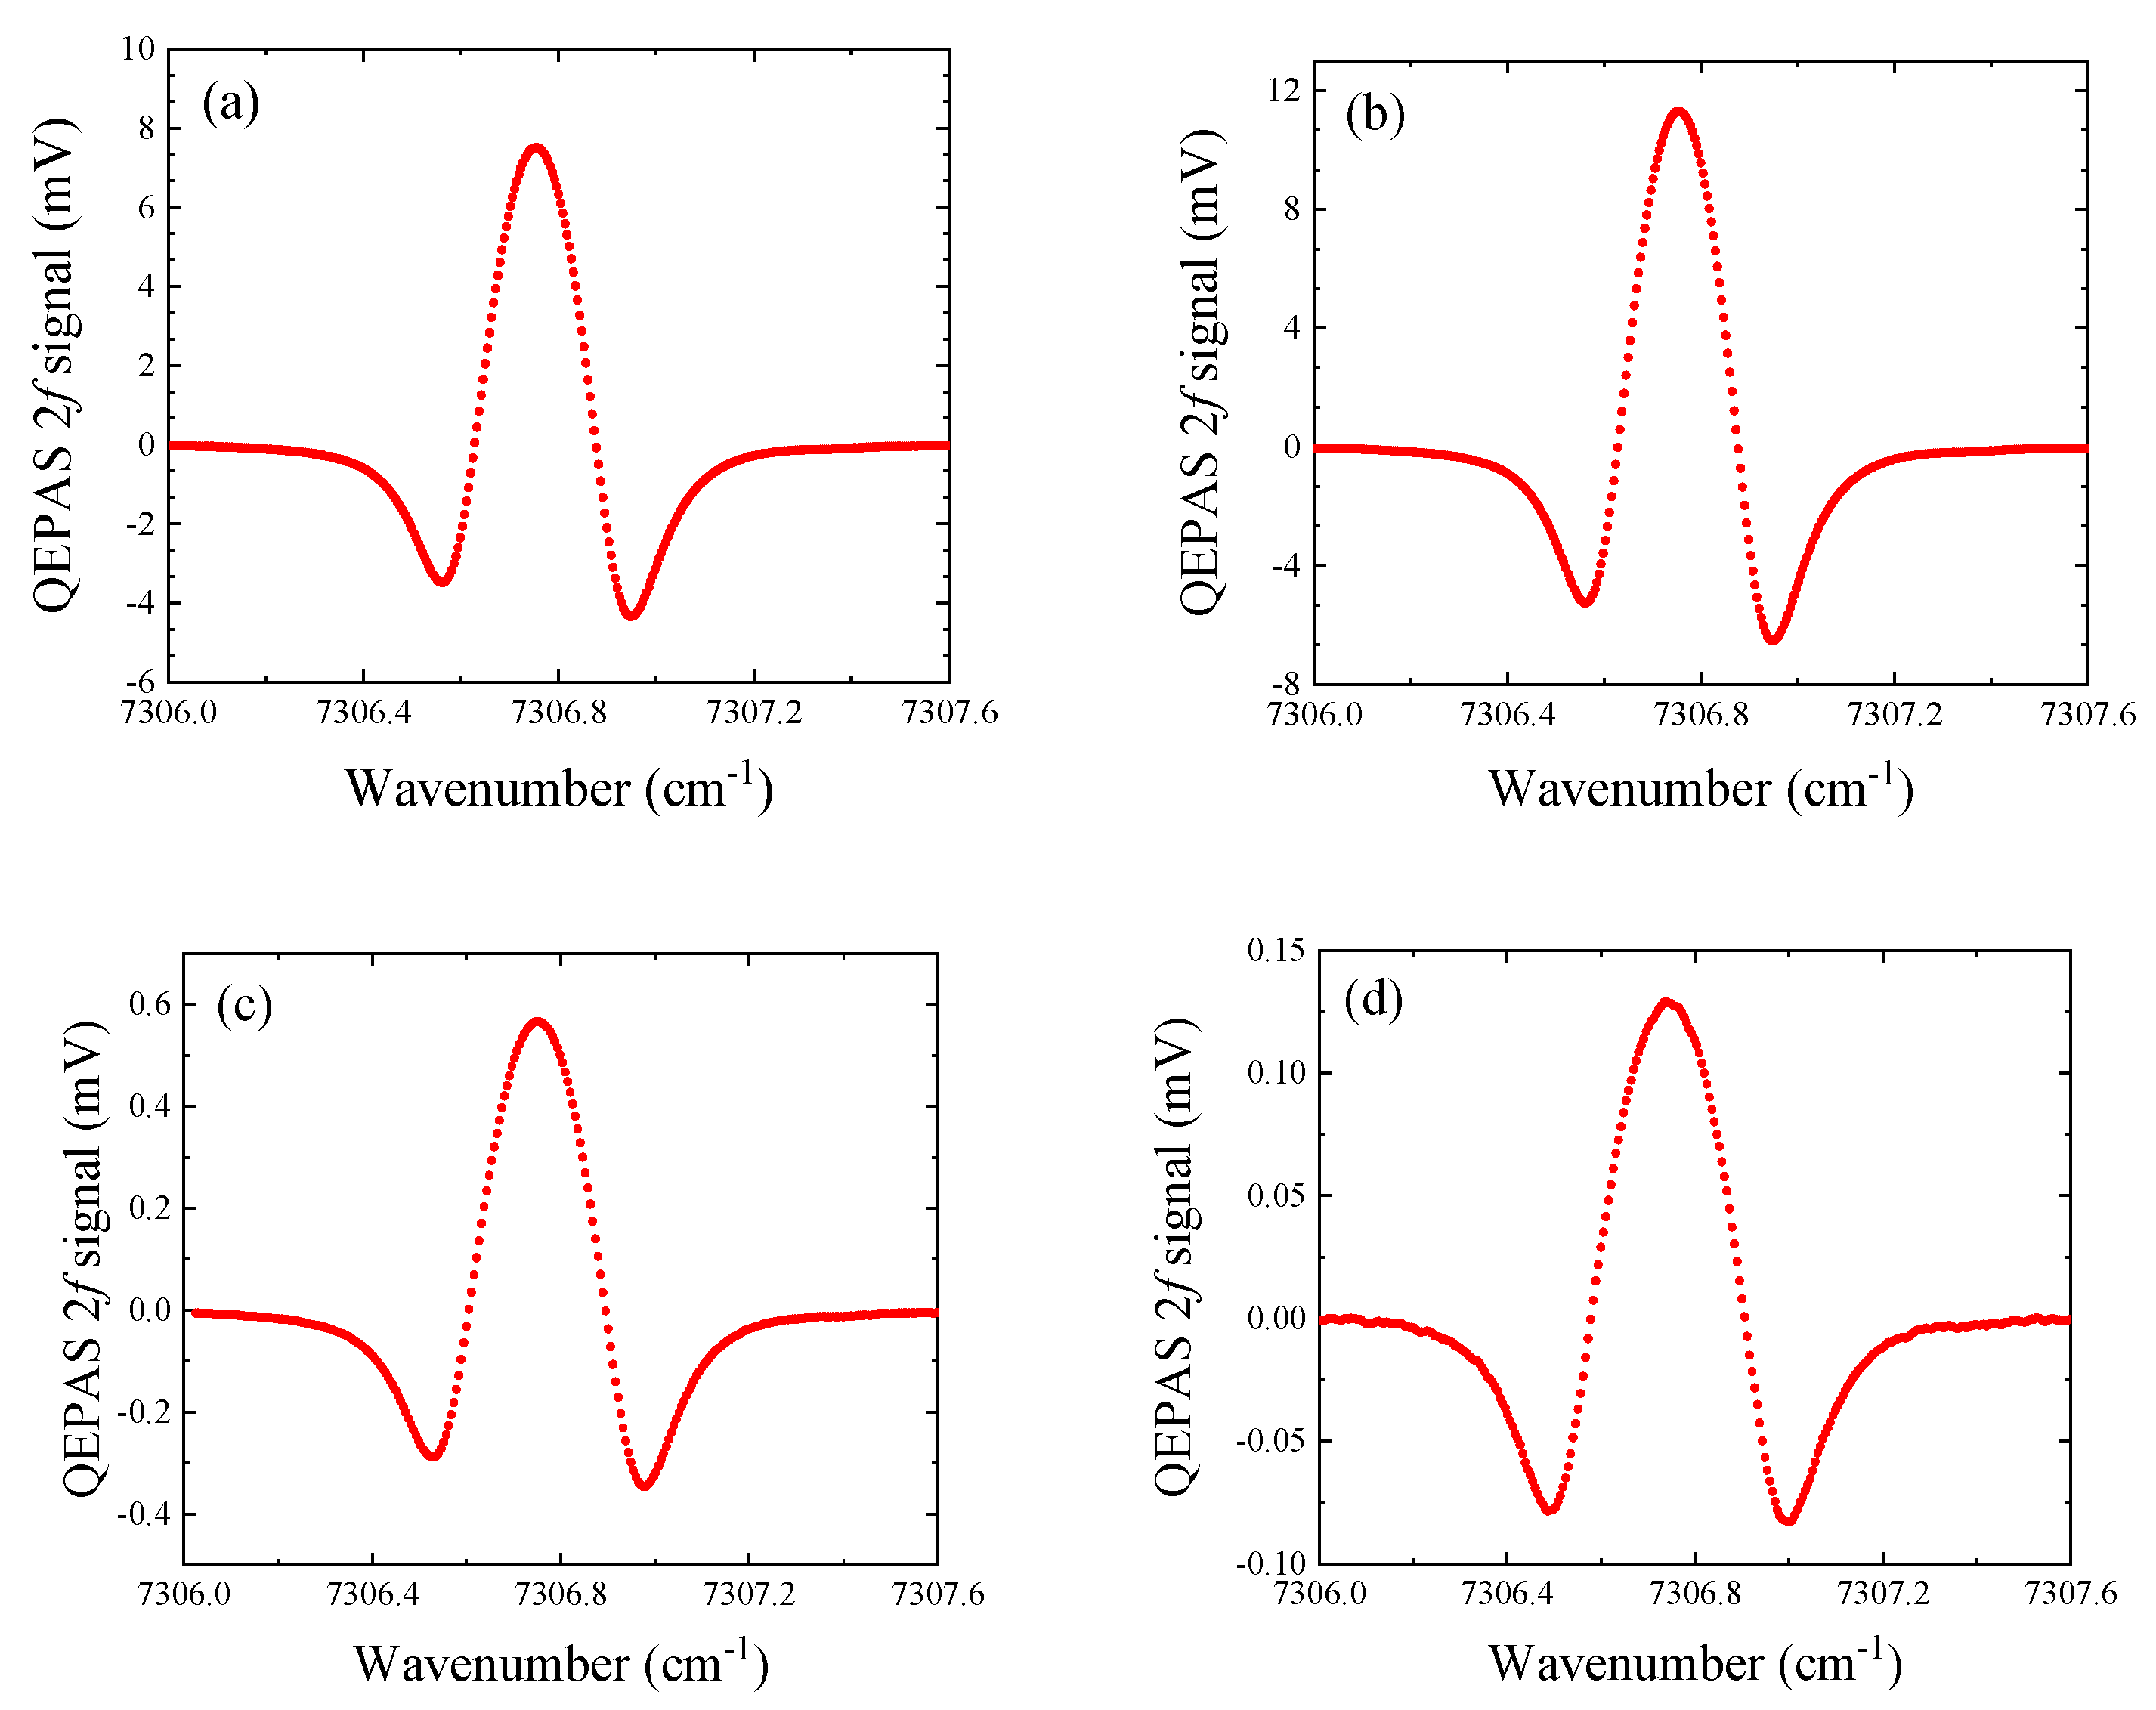
| QTF | Peak Signal (mV) | 1σ Noise (µV) | αmin (cm−1) | NNEA (W·cm−1·Hz−1/2) |
|---|---|---|---|---|
| #1 | 7.5 | 3.1 | 1.2 × 10⁻⁵ | 4.5 × 10⁻⁷ |
| #2 | 11.3 | 3.9 | 1.0 × 10⁻⁵ | 3.8 × 10⁻⁷ |
| #3 | 0.57 | 2.4 | 1.2 × 10⁻⁴ | 4.5 × 10⁻⁶ |
| #4 | 0.13 | 1.6 | 3.6 × 10⁻⁴ | 1.4 × 10⁻⁵ |
© 2019 by the authors. Licensee MDPI, Basel, Switzerland. This article is an open access article distributed under the terms and conditions of the Creative Commons Attribution (CC BY) license (http://creativecommons.org/licenses/by/4.0/).
Share and Cite
Zheng, H.; Lin, H.; Dong, L.; Liu, Y.; Patimisco, P.; Zweck, J.; Mozumder, A.; Sampaolo, A.; Spagnolo, V.; Huang, B.; et al. Influence of Tuning Fork Resonance Properties on Quartz-Enhanced Photoacoustic Spectroscopy Performance. Sensors 2019, 19, 3825. https://doi.org/10.3390/s19183825
Zheng H, Lin H, Dong L, Liu Y, Patimisco P, Zweck J, Mozumder A, Sampaolo A, Spagnolo V, Huang B, et al. Influence of Tuning Fork Resonance Properties on Quartz-Enhanced Photoacoustic Spectroscopy Performance. Sensors. 2019; 19(18):3825. https://doi.org/10.3390/s19183825
Chicago/Turabian StyleZheng, Huadan, Haoyang Lin, Lei Dong, Yihua Liu, Pietro Patimisco, John Zweck, Ali Mozumder, Angelo Sampaolo, Vincenzo Spagnolo, Bincheng Huang, and et al. 2019. "Influence of Tuning Fork Resonance Properties on Quartz-Enhanced Photoacoustic Spectroscopy Performance" Sensors 19, no. 18: 3825. https://doi.org/10.3390/s19183825
APA StyleZheng, H., Lin, H., Dong, L., Liu, Y., Patimisco, P., Zweck, J., Mozumder, A., Sampaolo, A., Spagnolo, V., Huang, B., Tang, J., Dong, L., Zhu, W., Yu, J., Chen, Z., & Tittel, F. K. (2019). Influence of Tuning Fork Resonance Properties on Quartz-Enhanced Photoacoustic Spectroscopy Performance. Sensors, 19(18), 3825. https://doi.org/10.3390/s19183825