Development of Miniaturized Water Quality Monitoring System Using Wireless Communication

 , and
, and 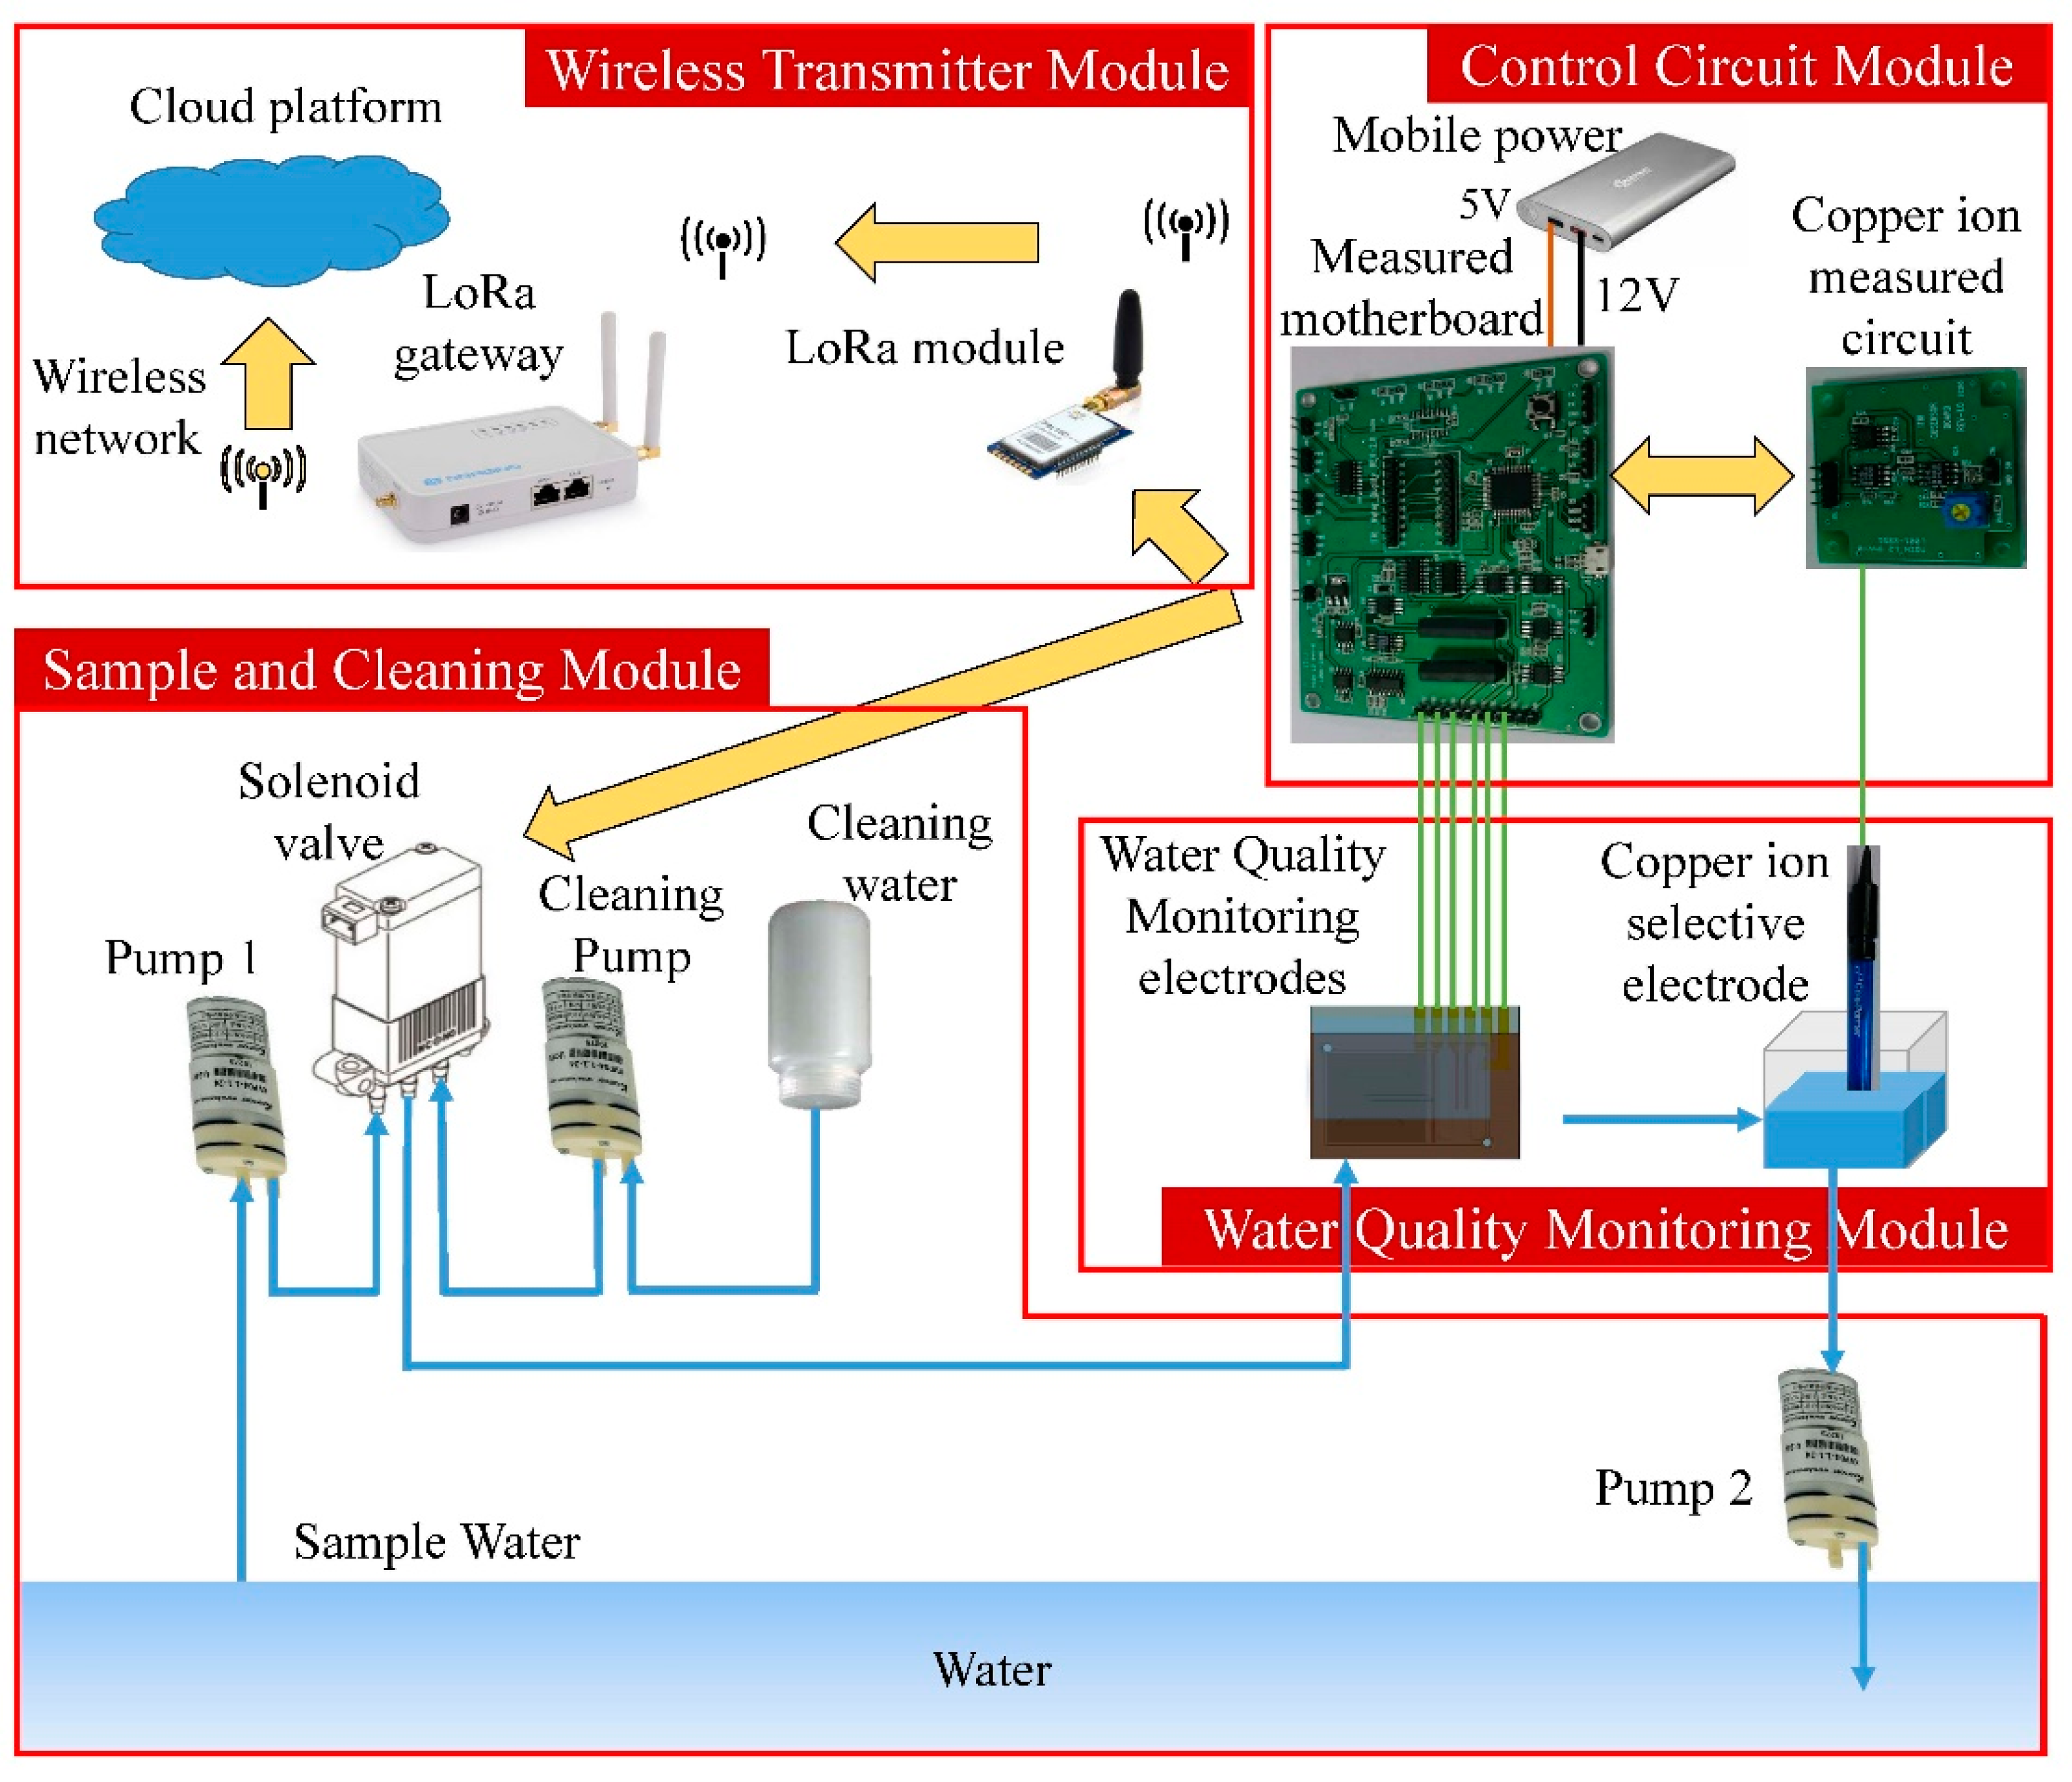
Abstract
:1. Introduction
2. Measurement Principle
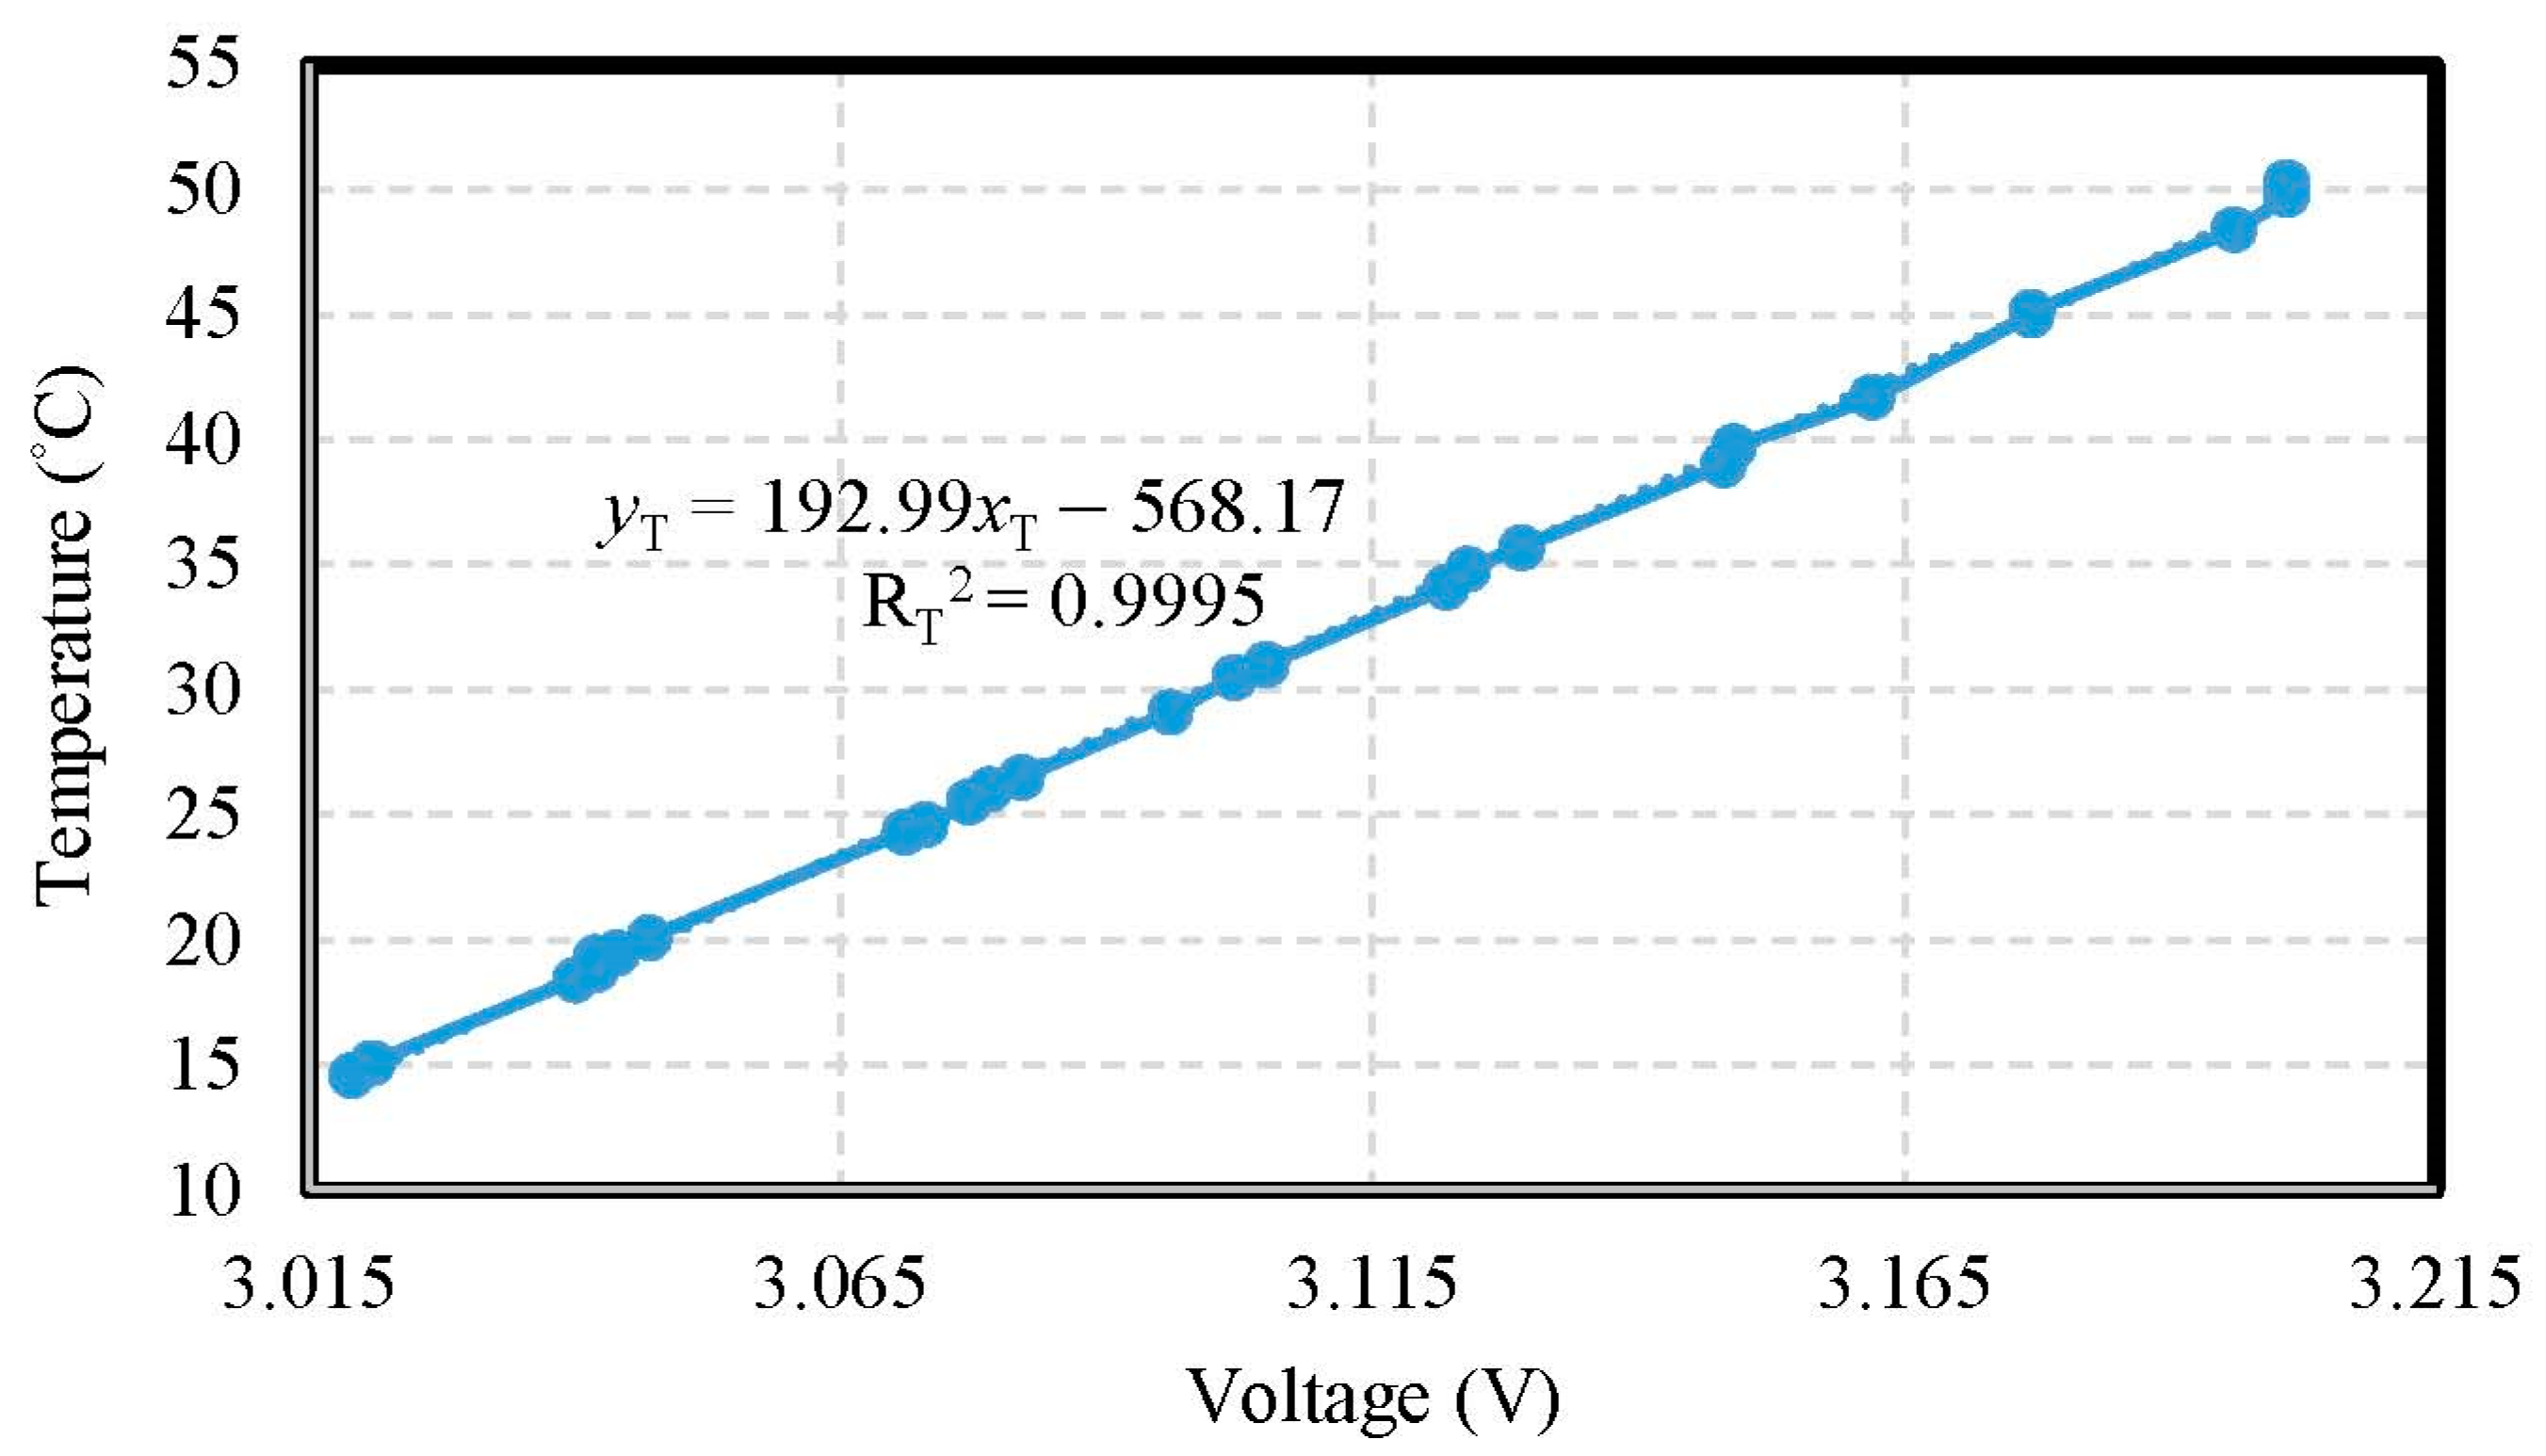
2.1. Measurement of Temperature
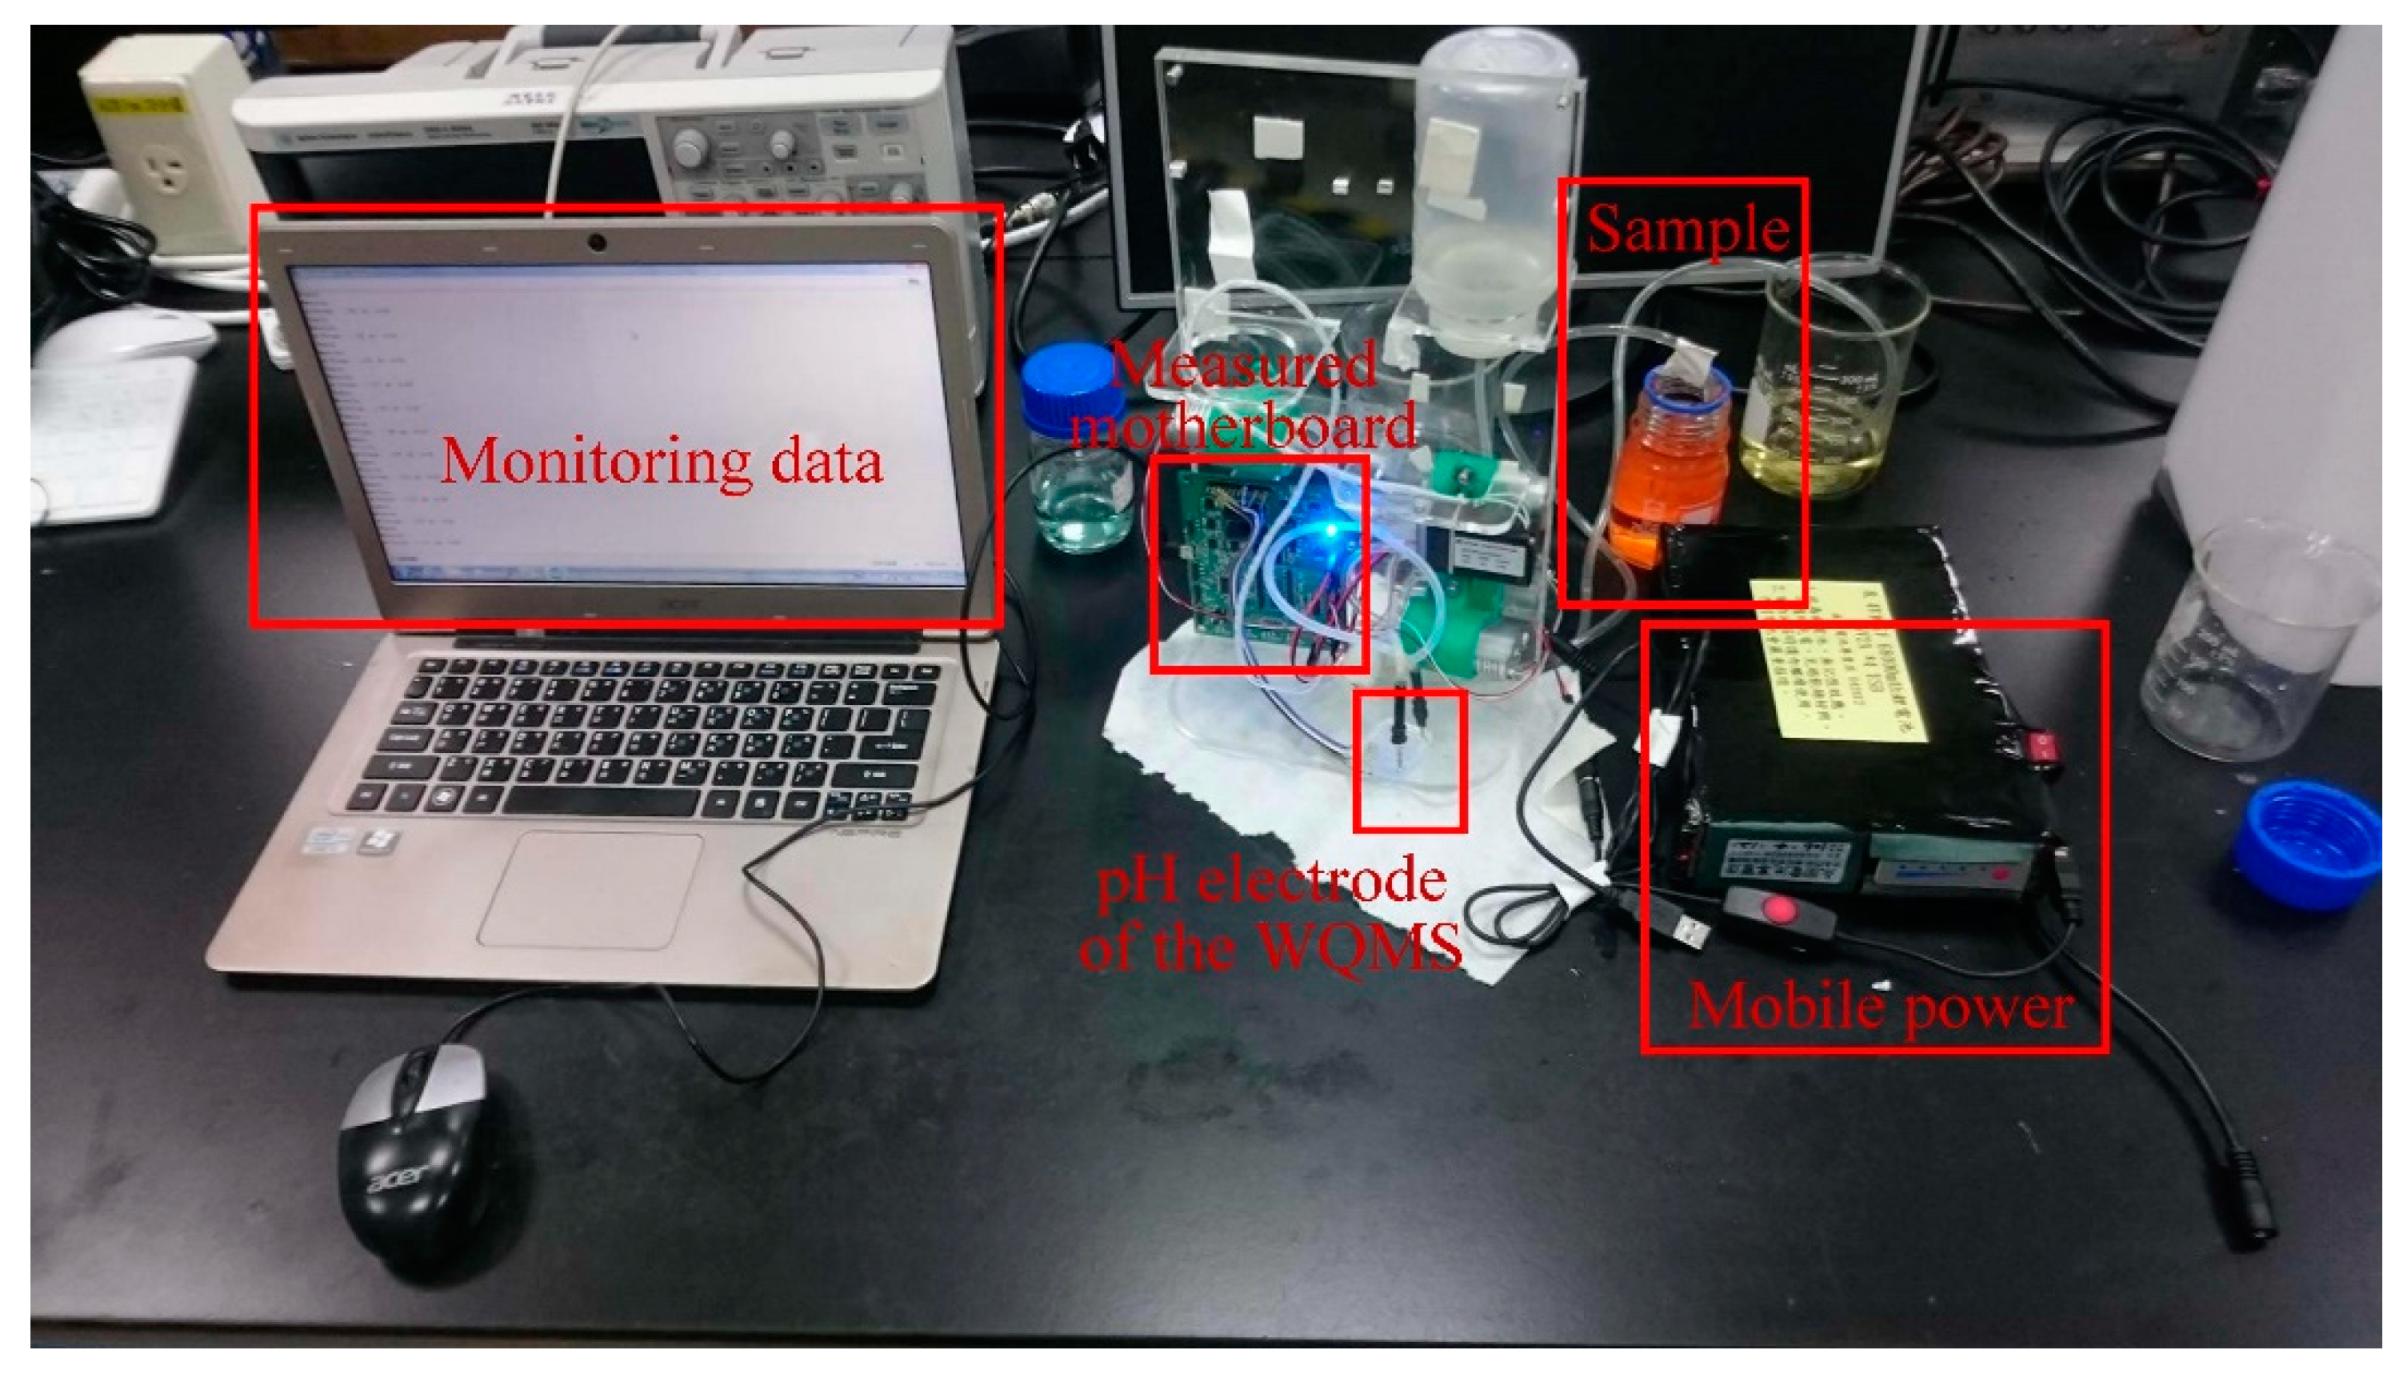
2.2. Measurement of pH Value in Water
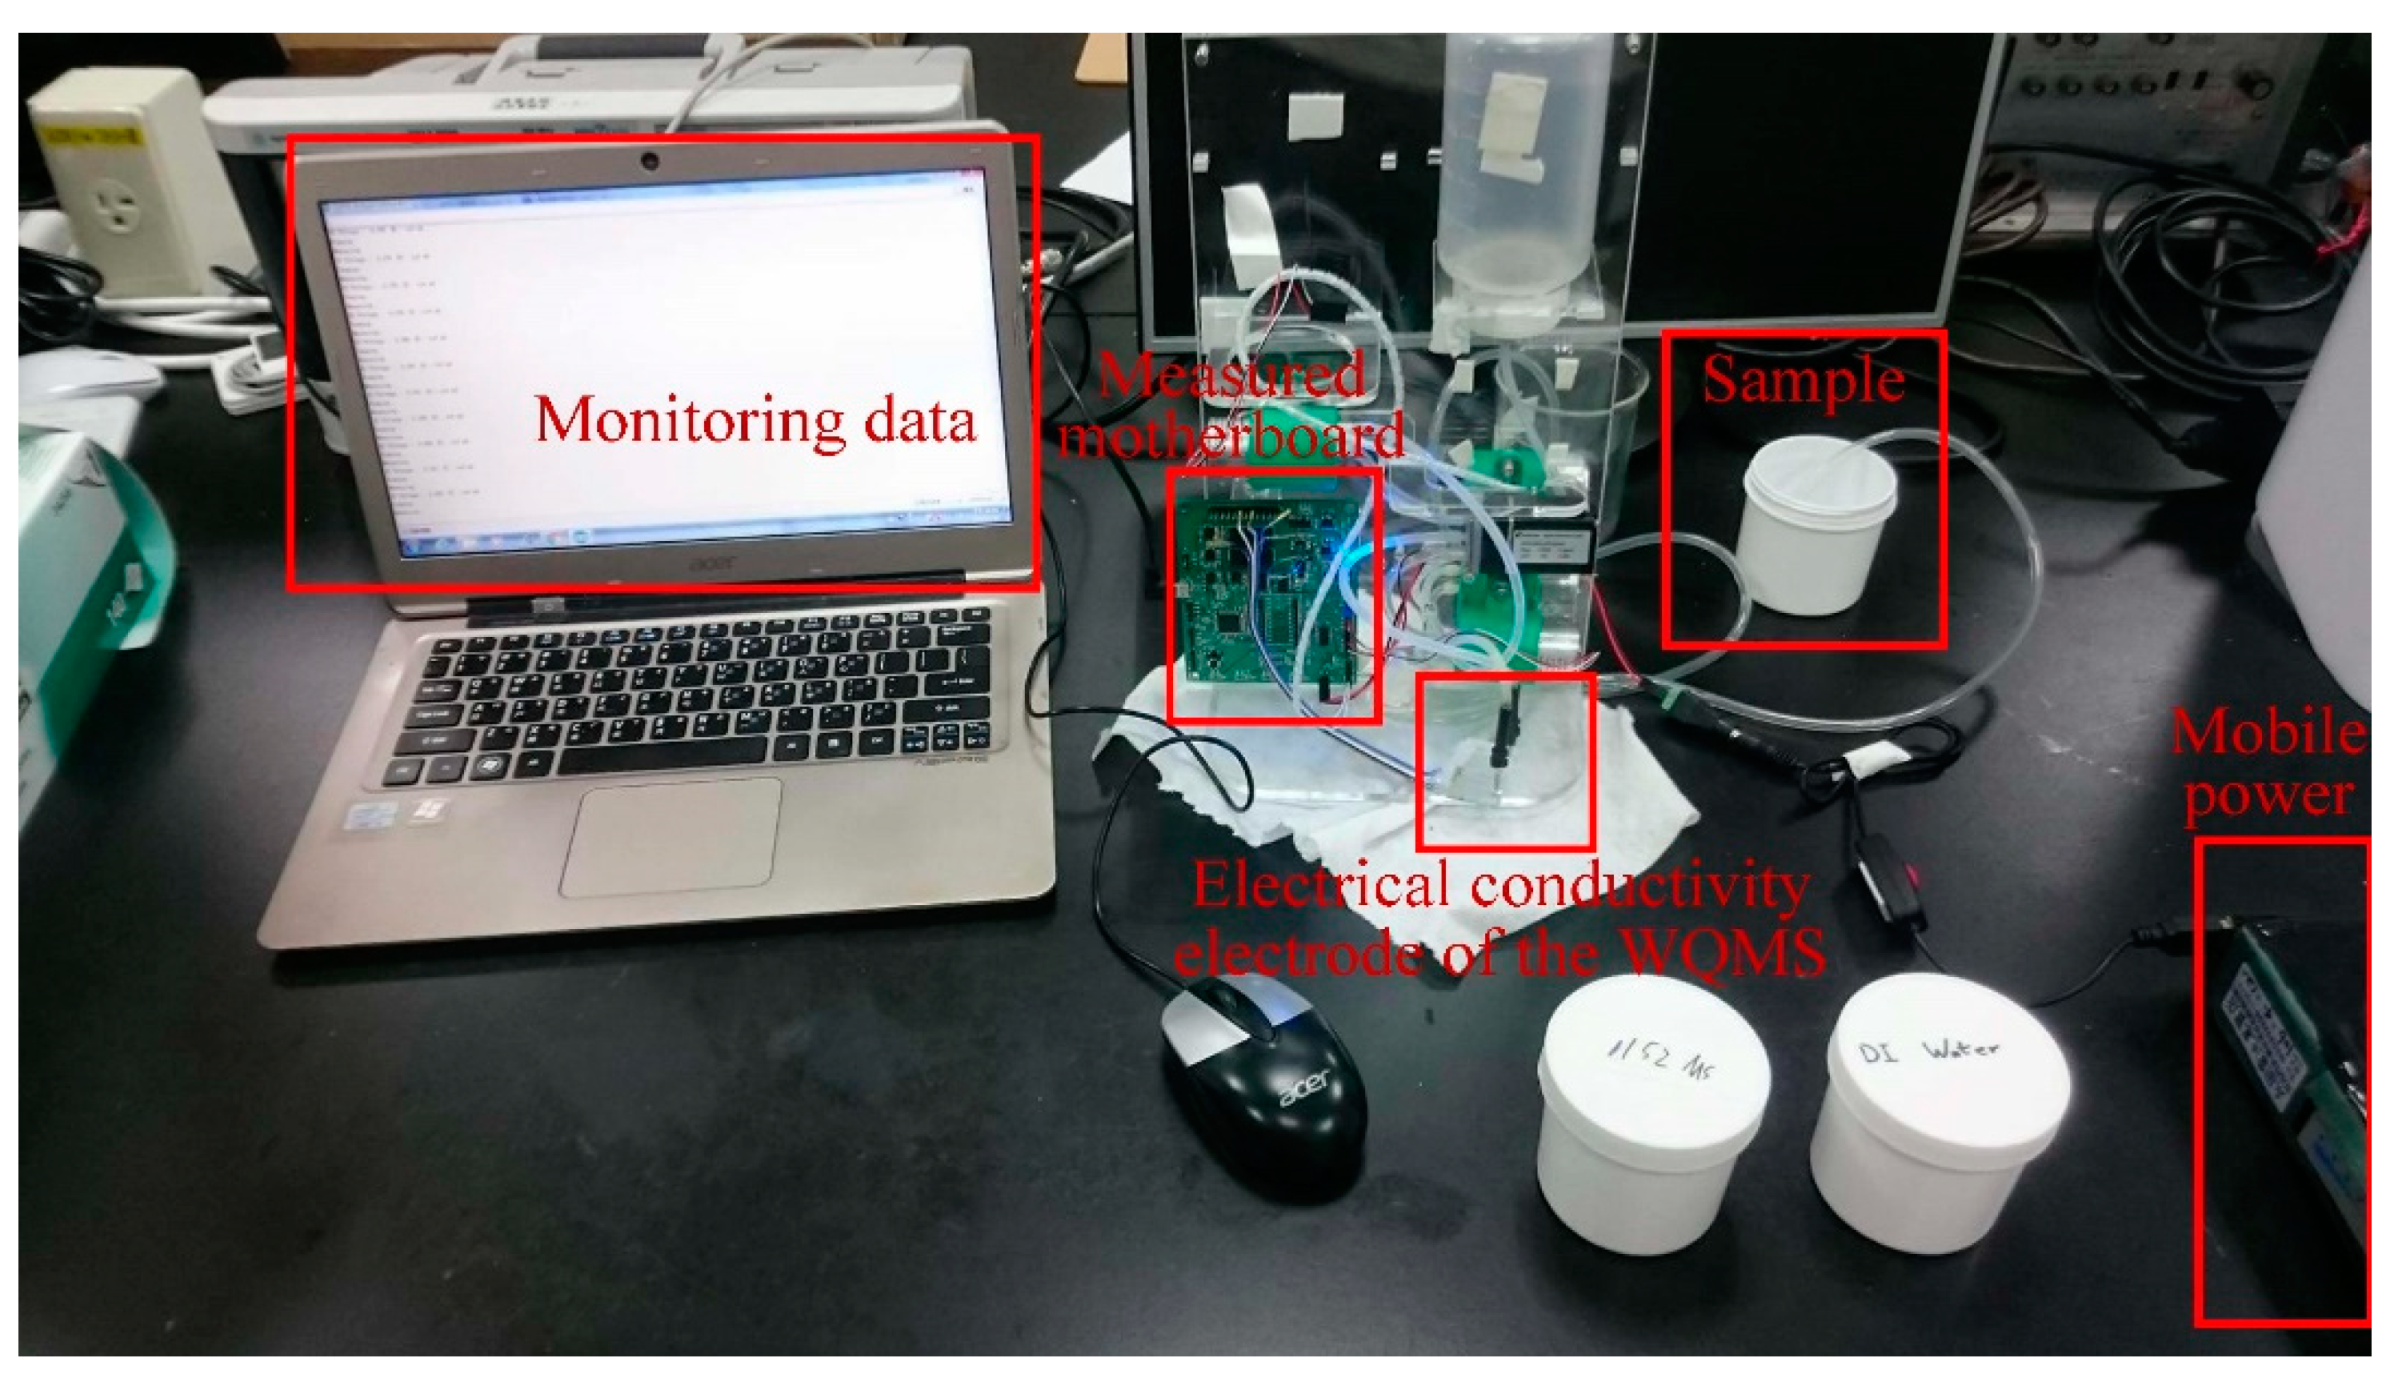
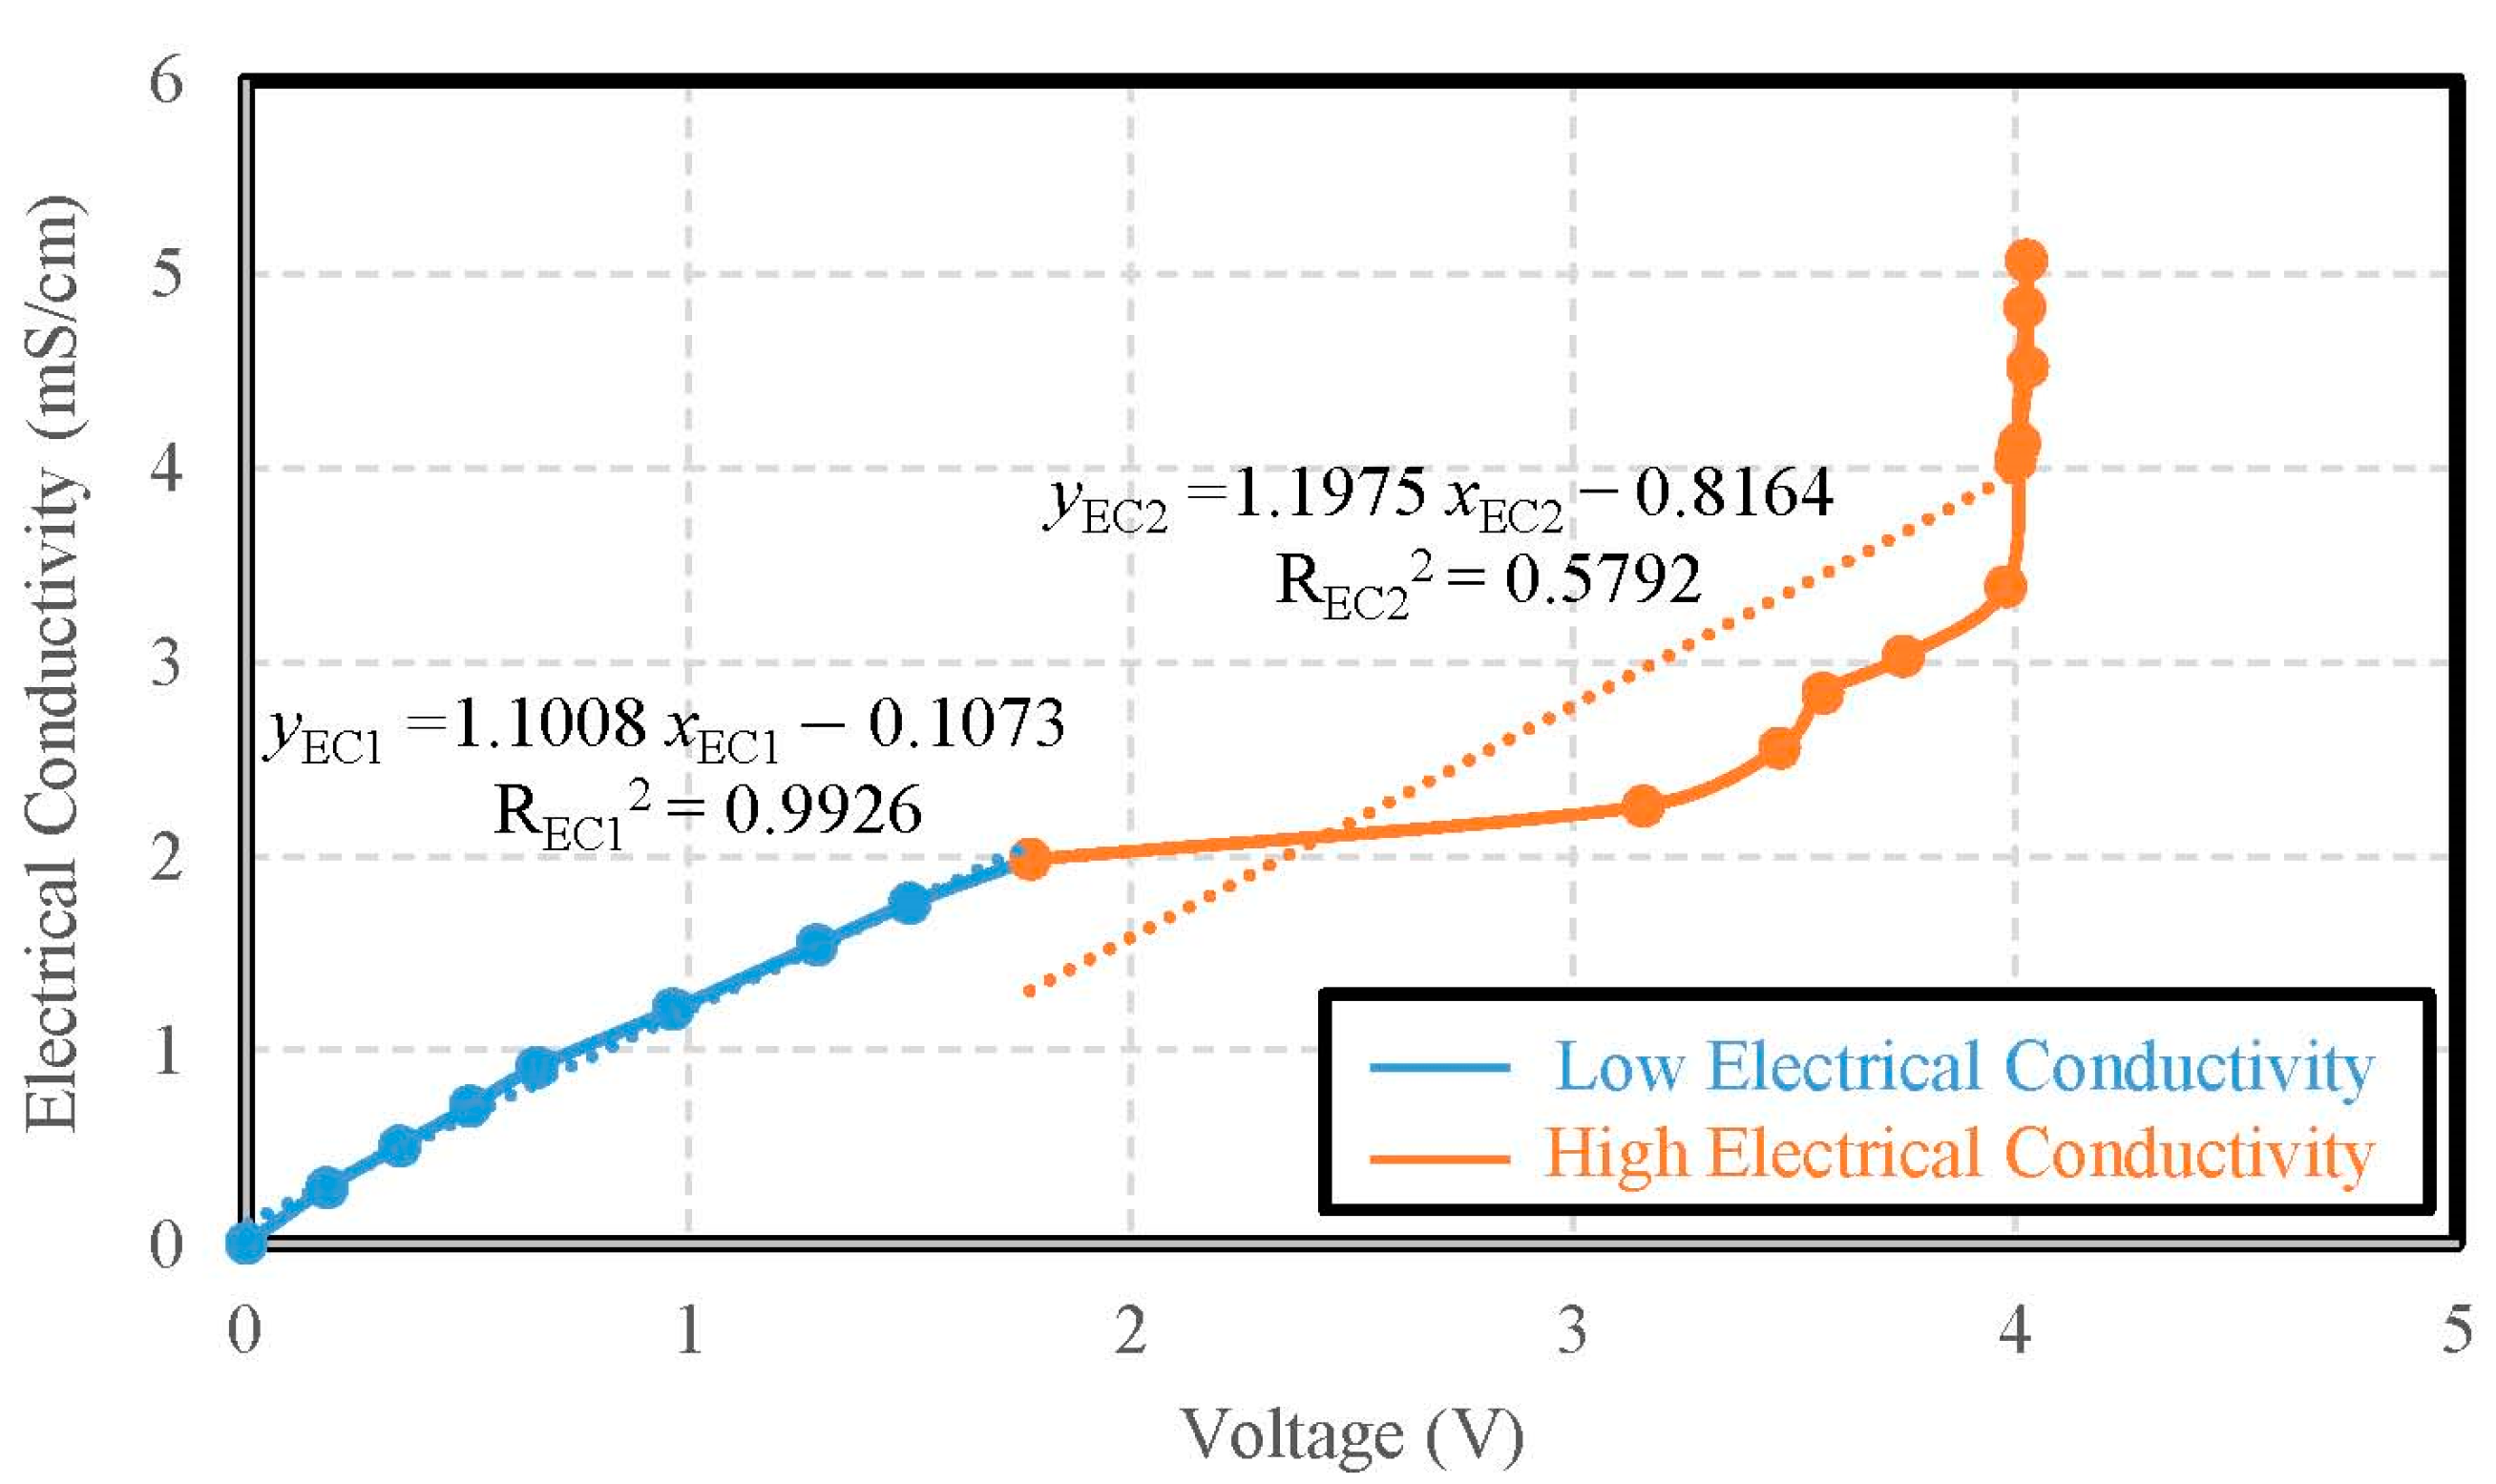
2.3. Measurement of Electrical Conductivity
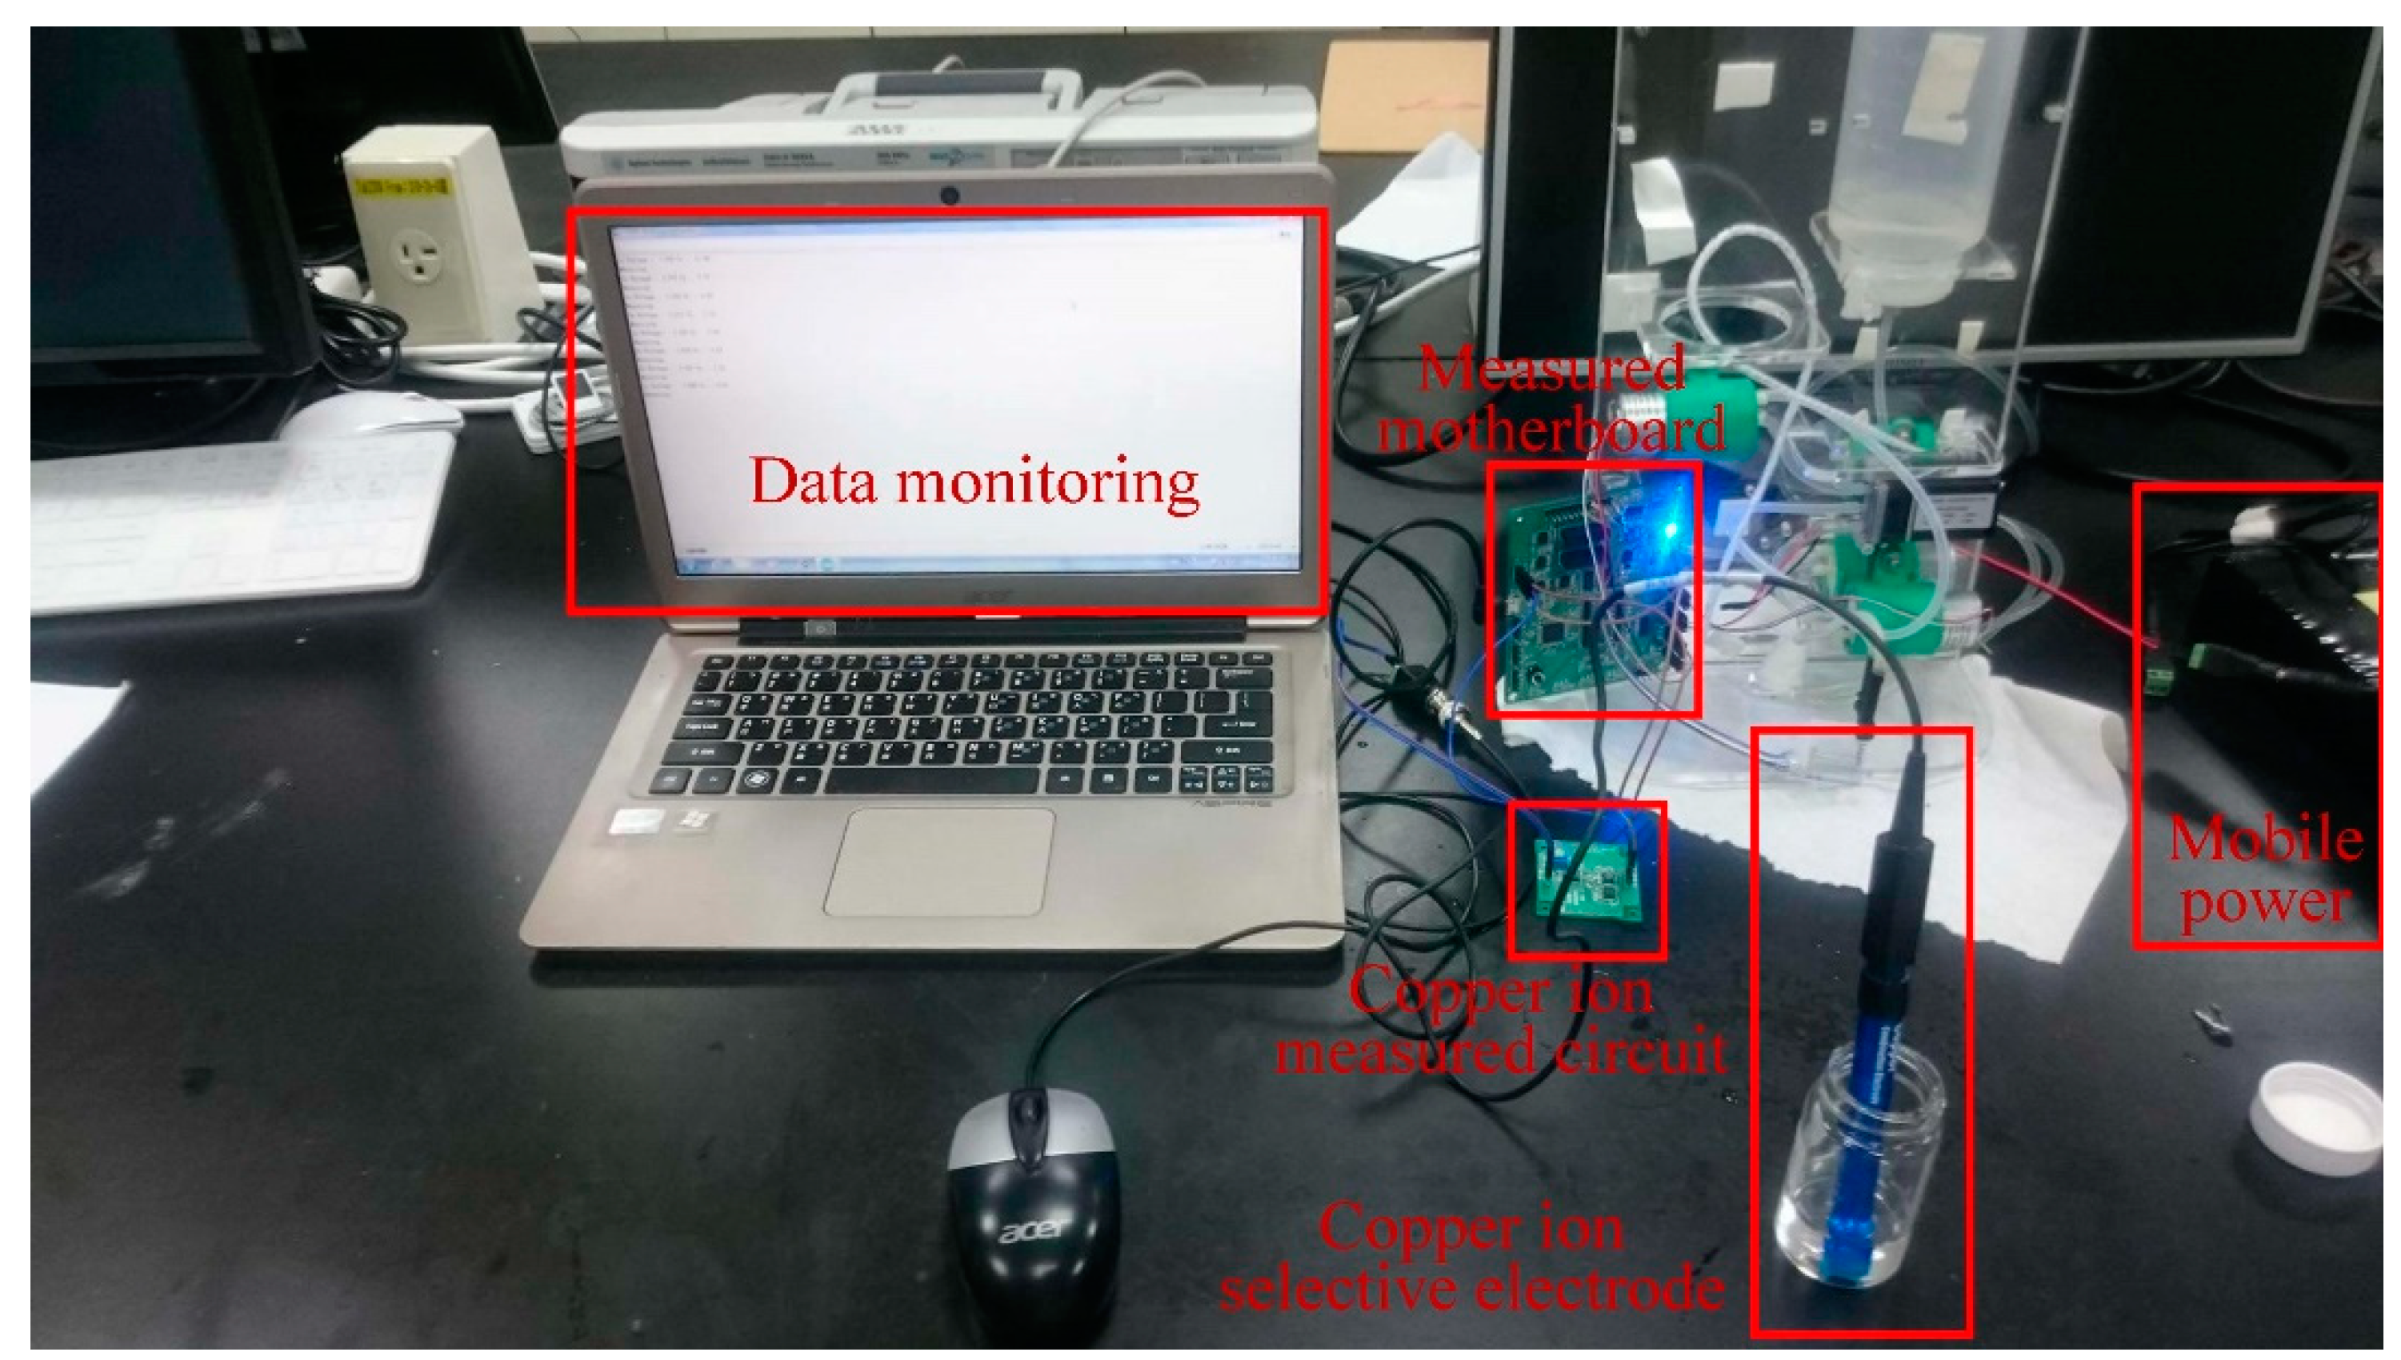
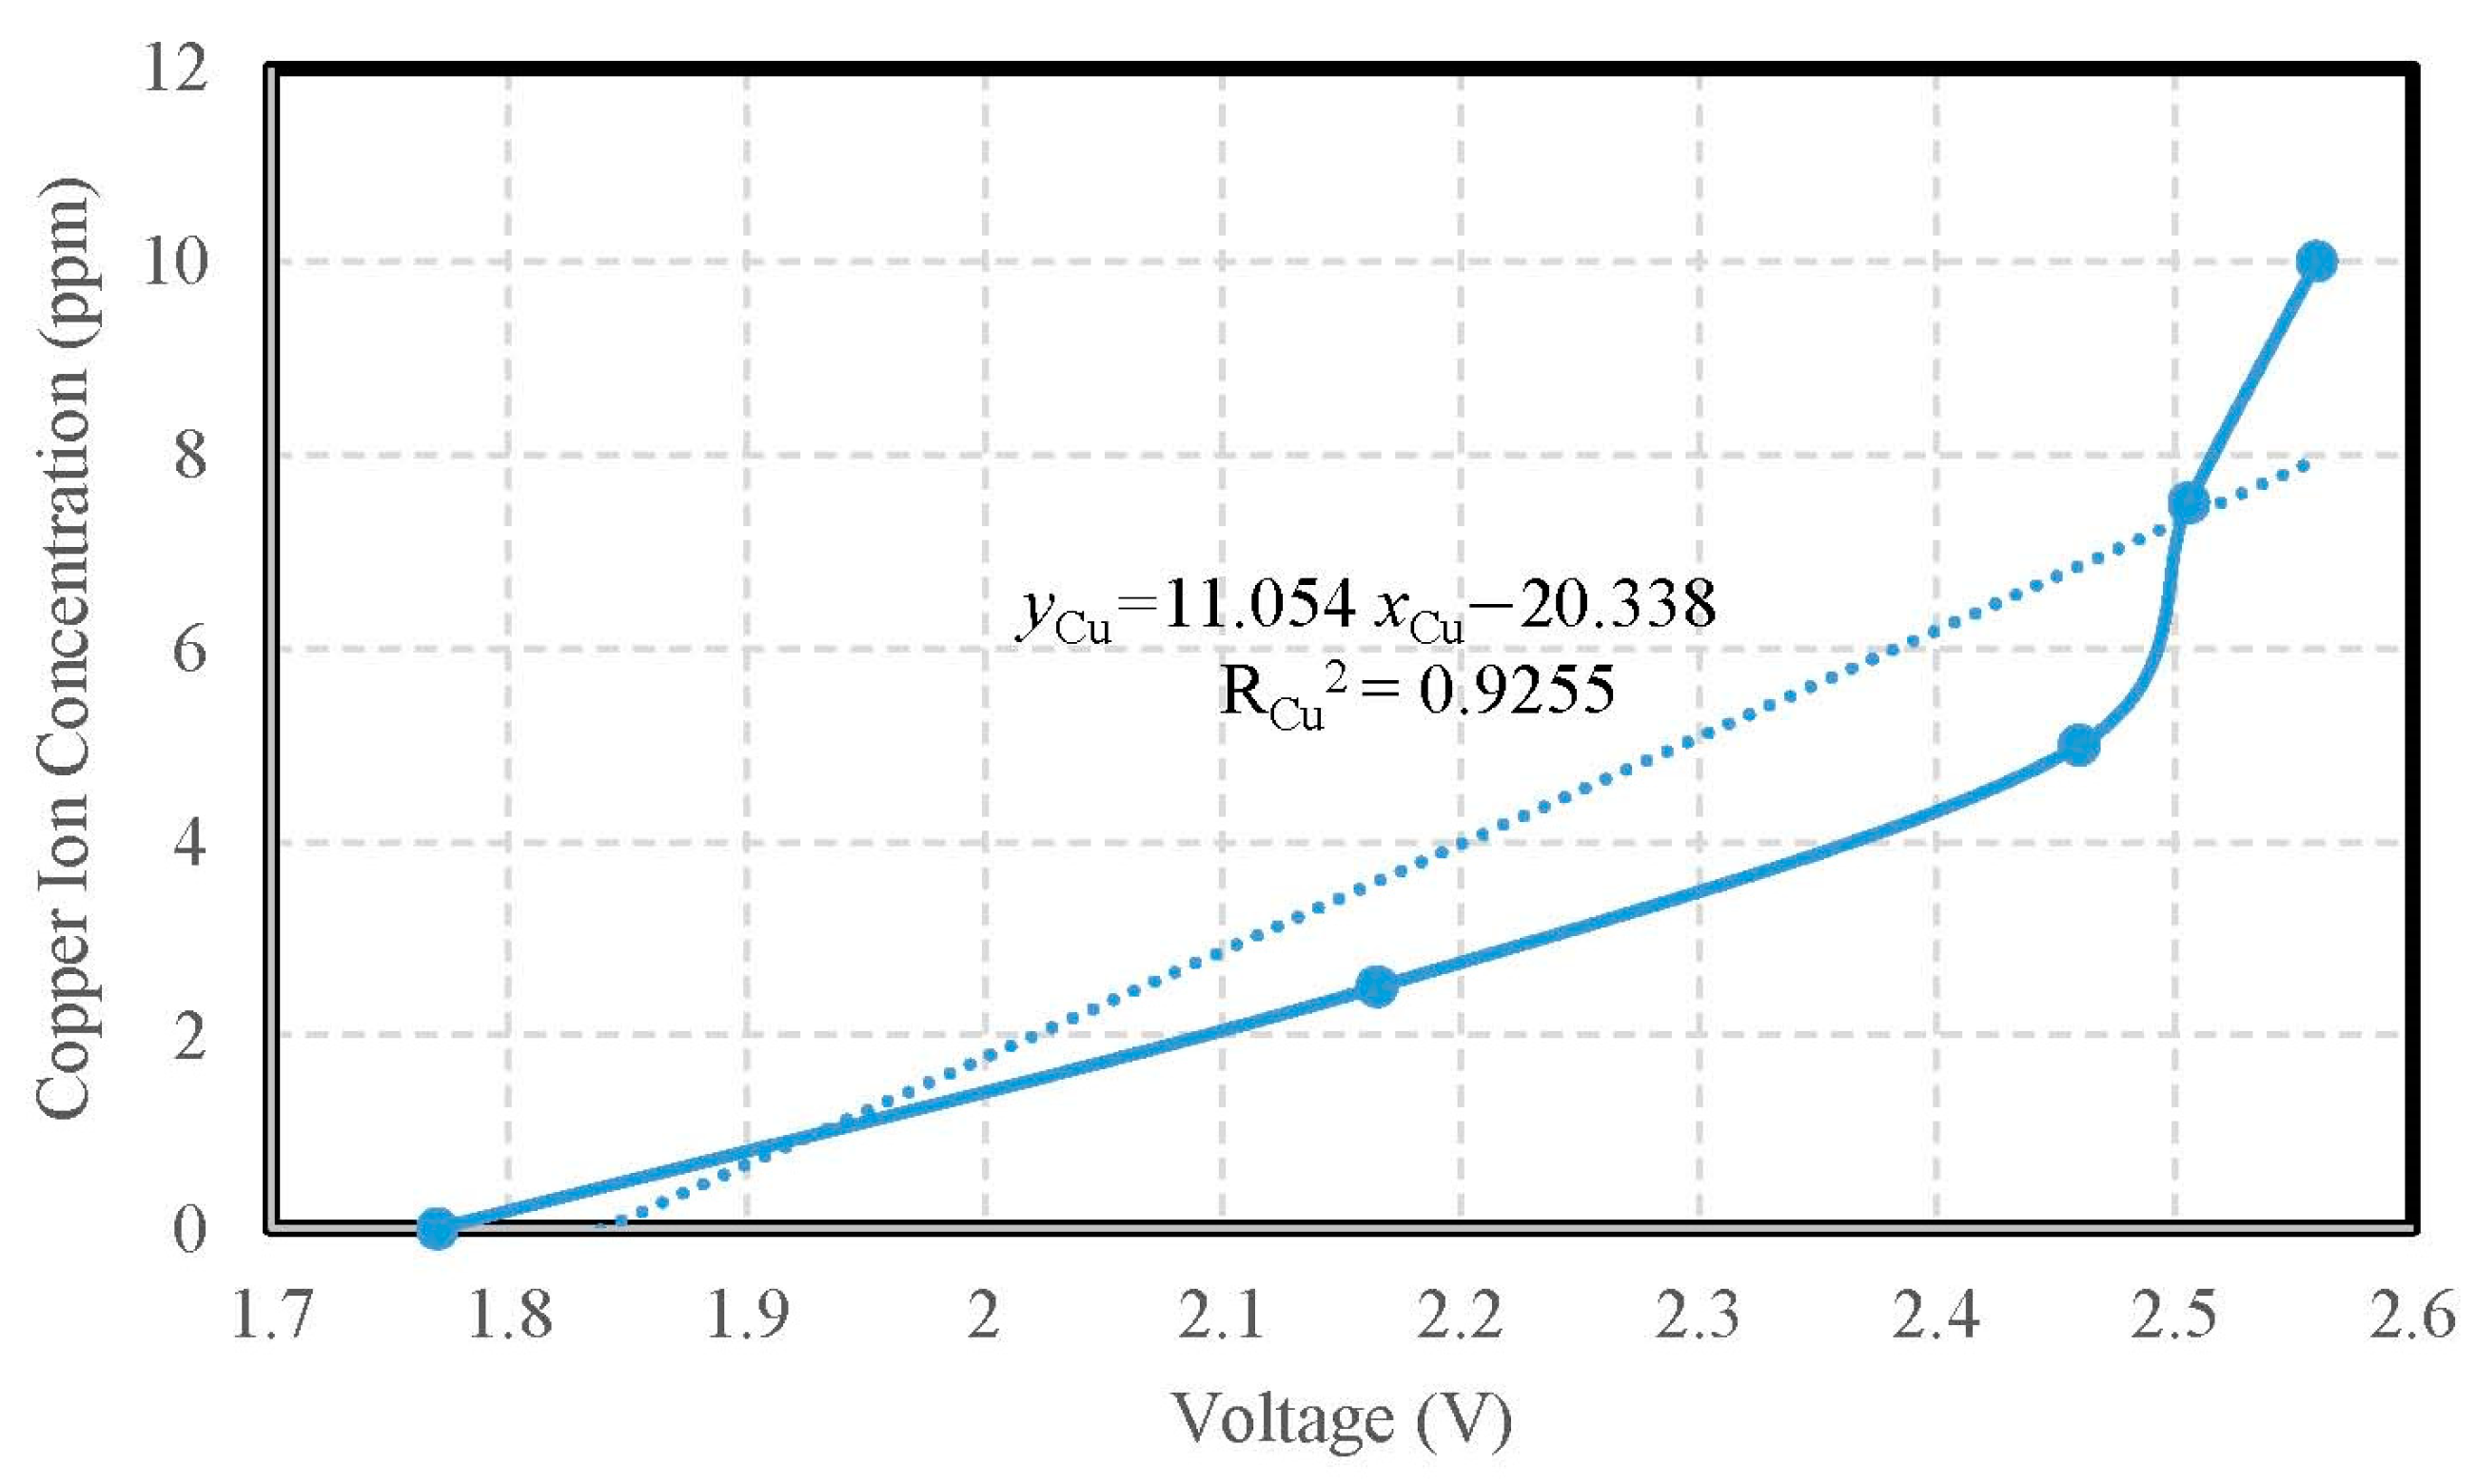
2.4. Measurement of Copper Ion Concentration
2.5. Measurement of LoRa Wireless Transmission
3. Experimental Setup
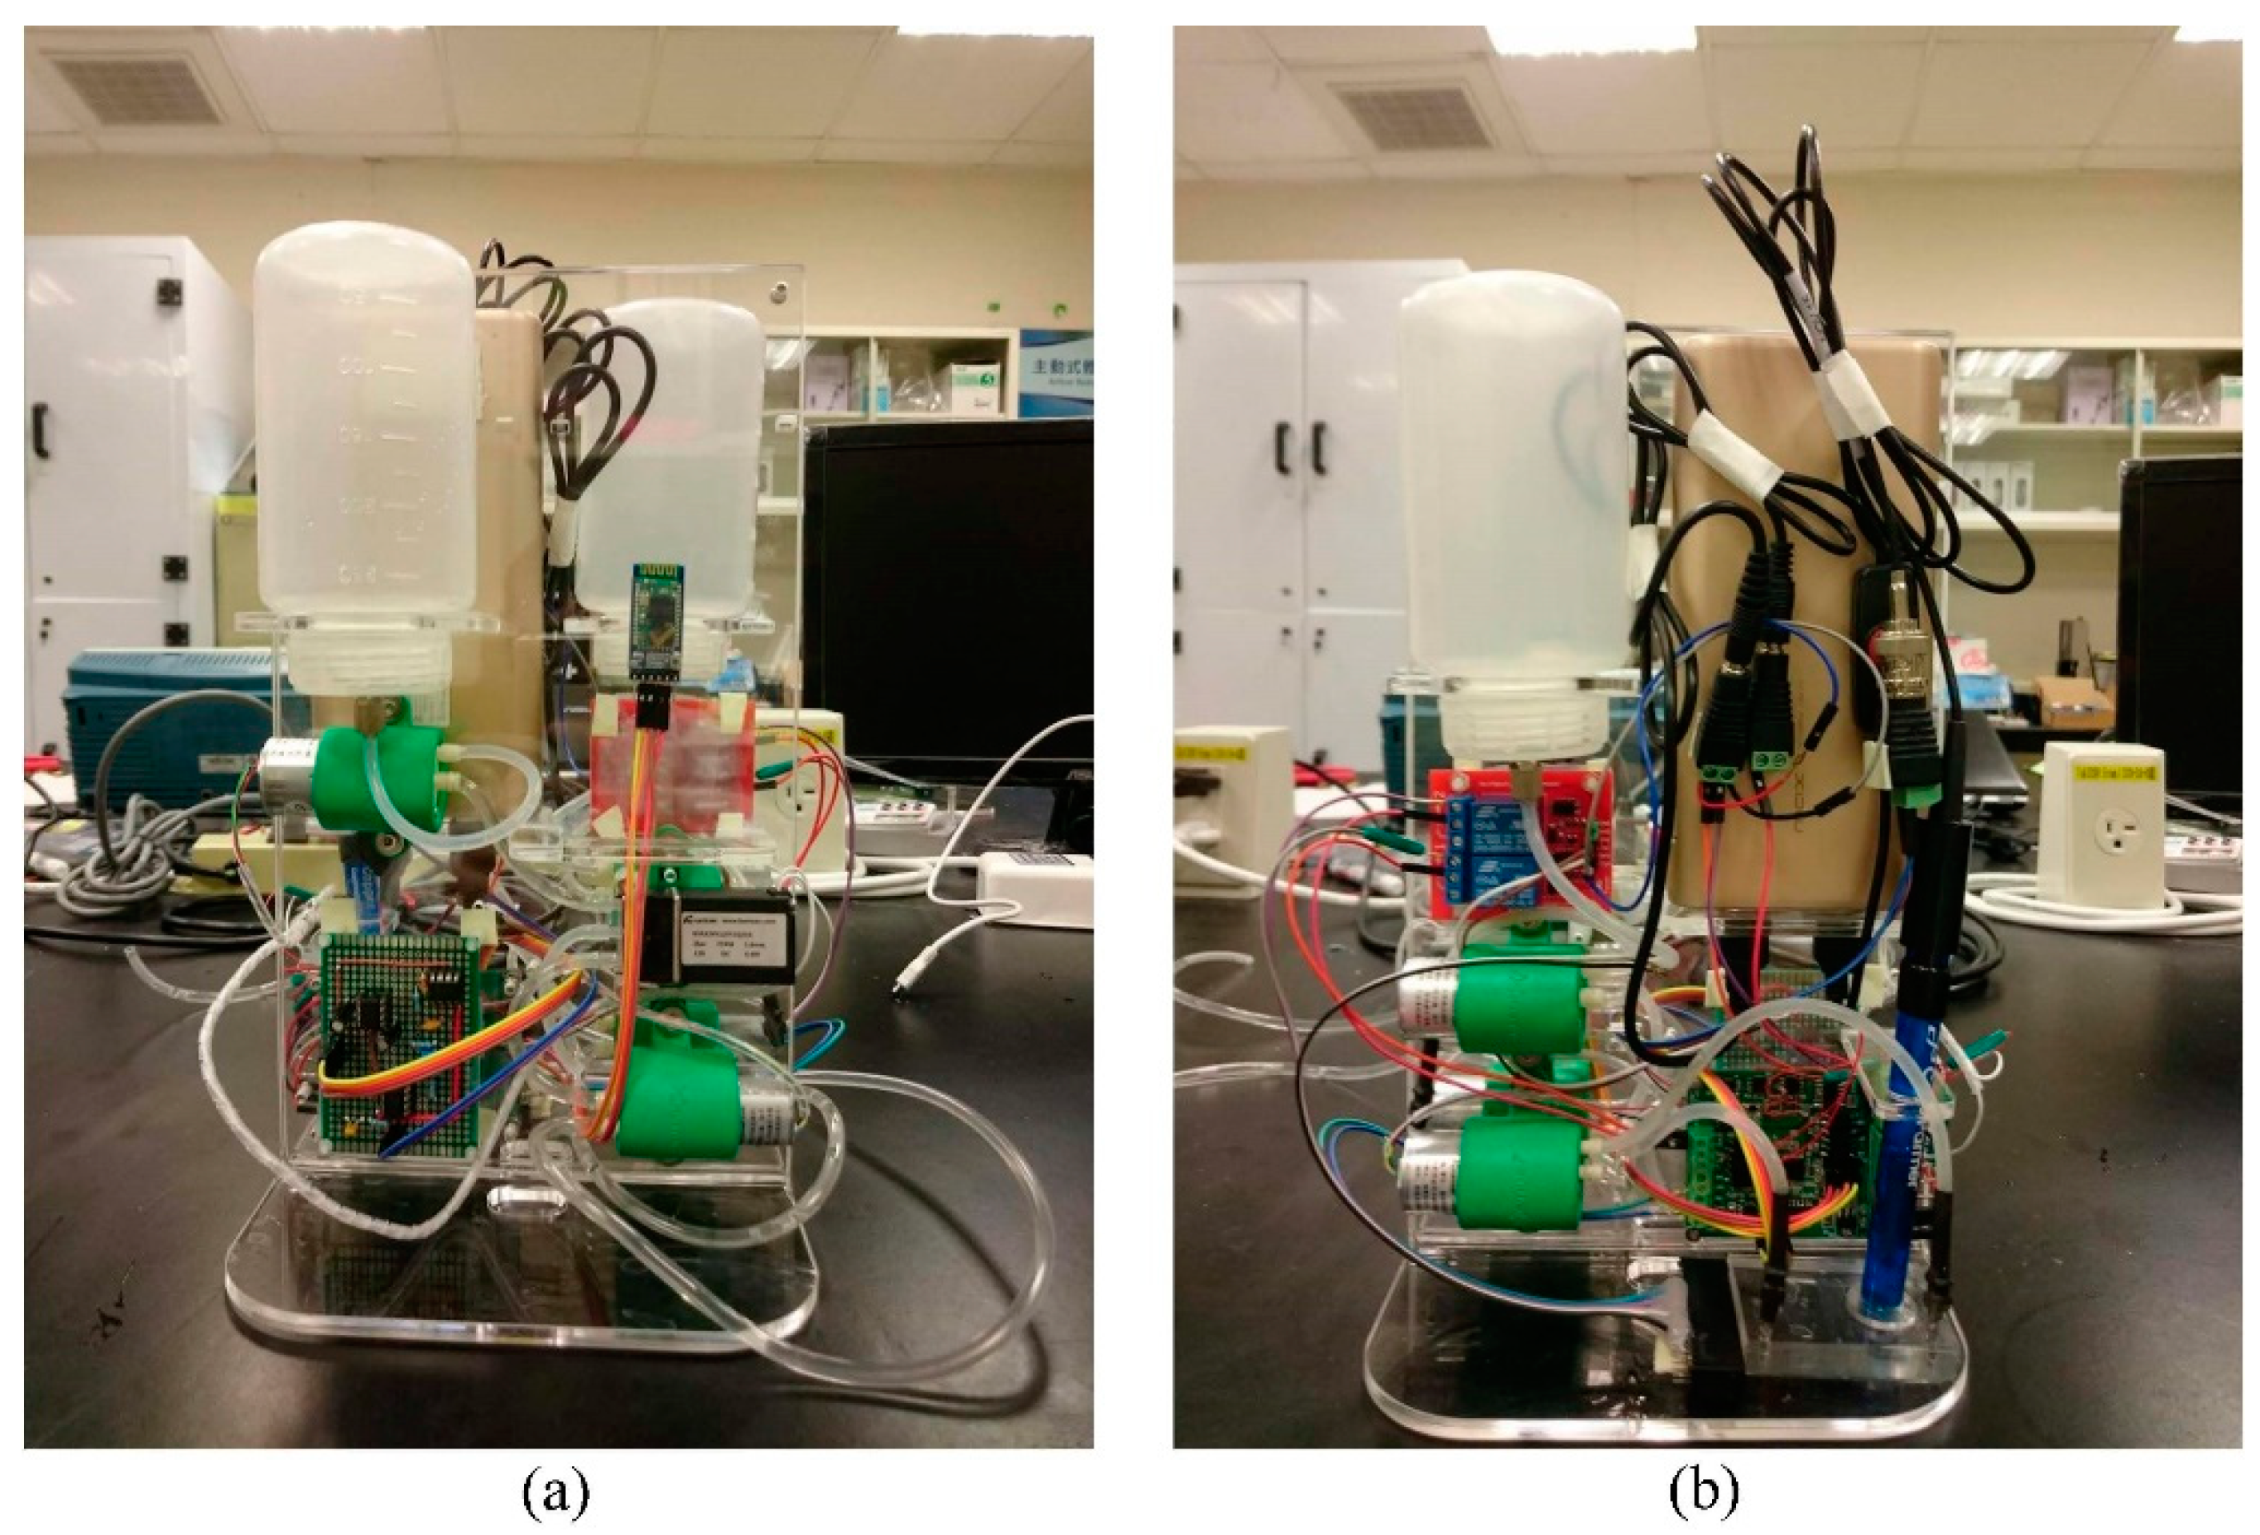
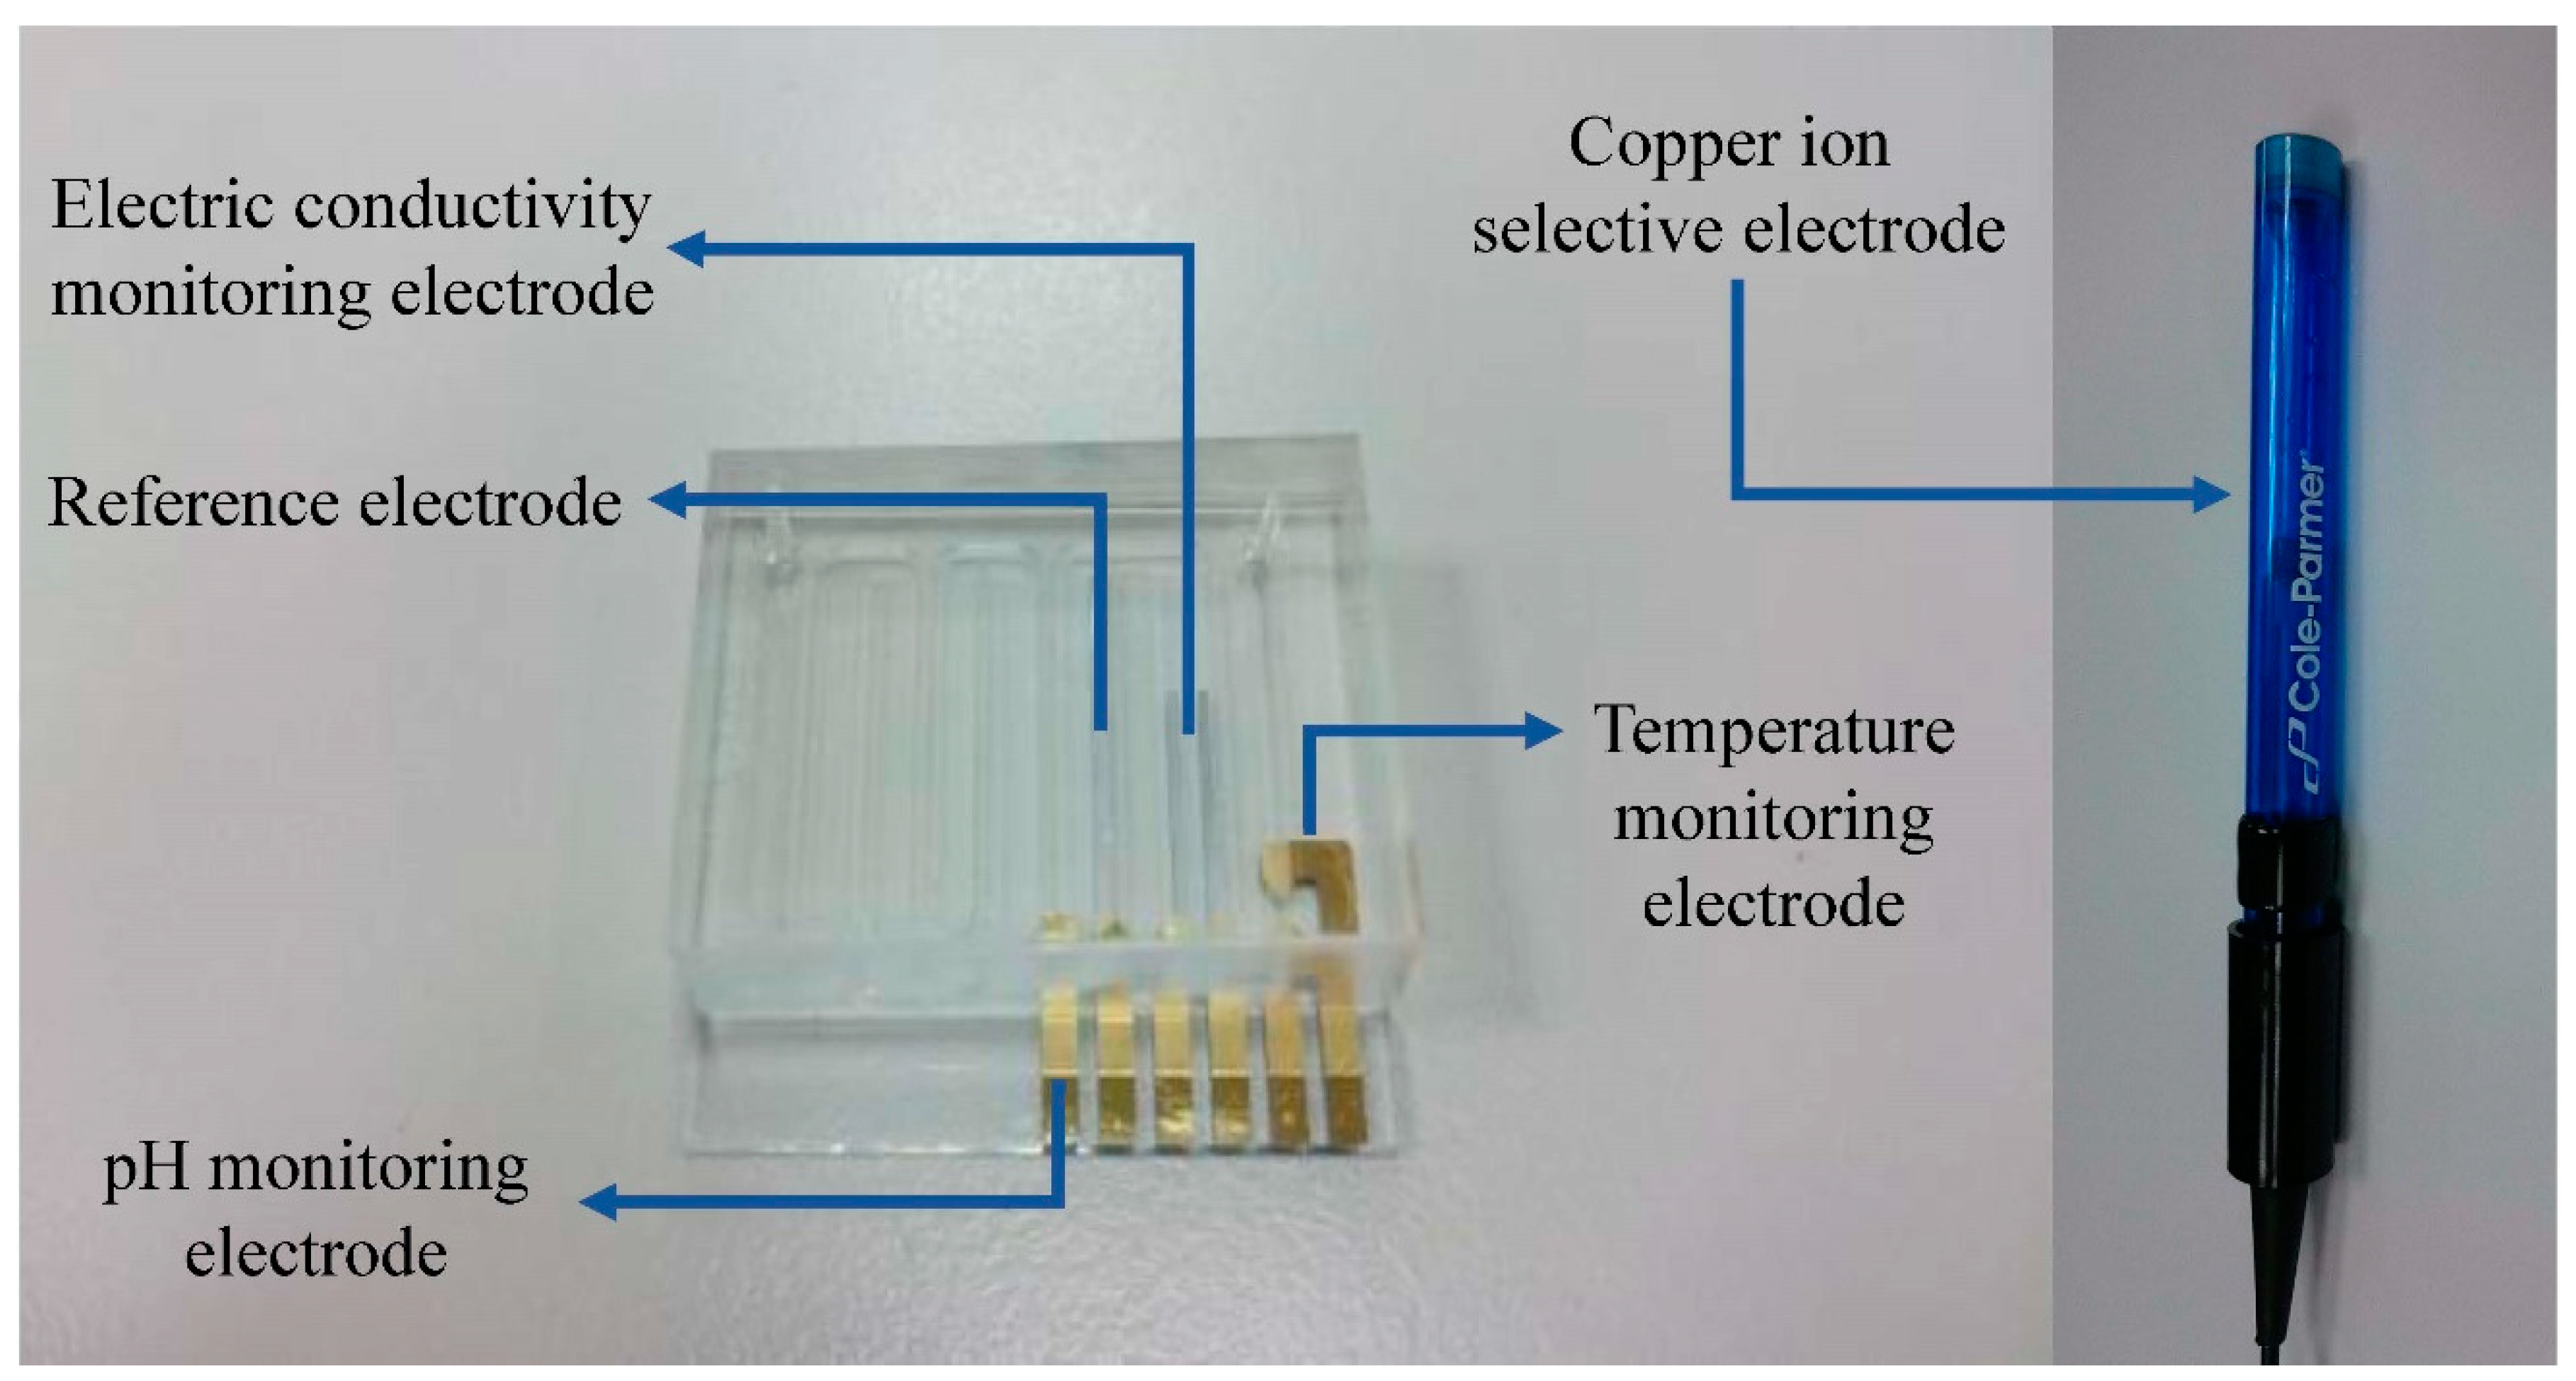
3.1. Water Quality Monitoring Module
3.2. Control Circuit Module
4. Experimental Results
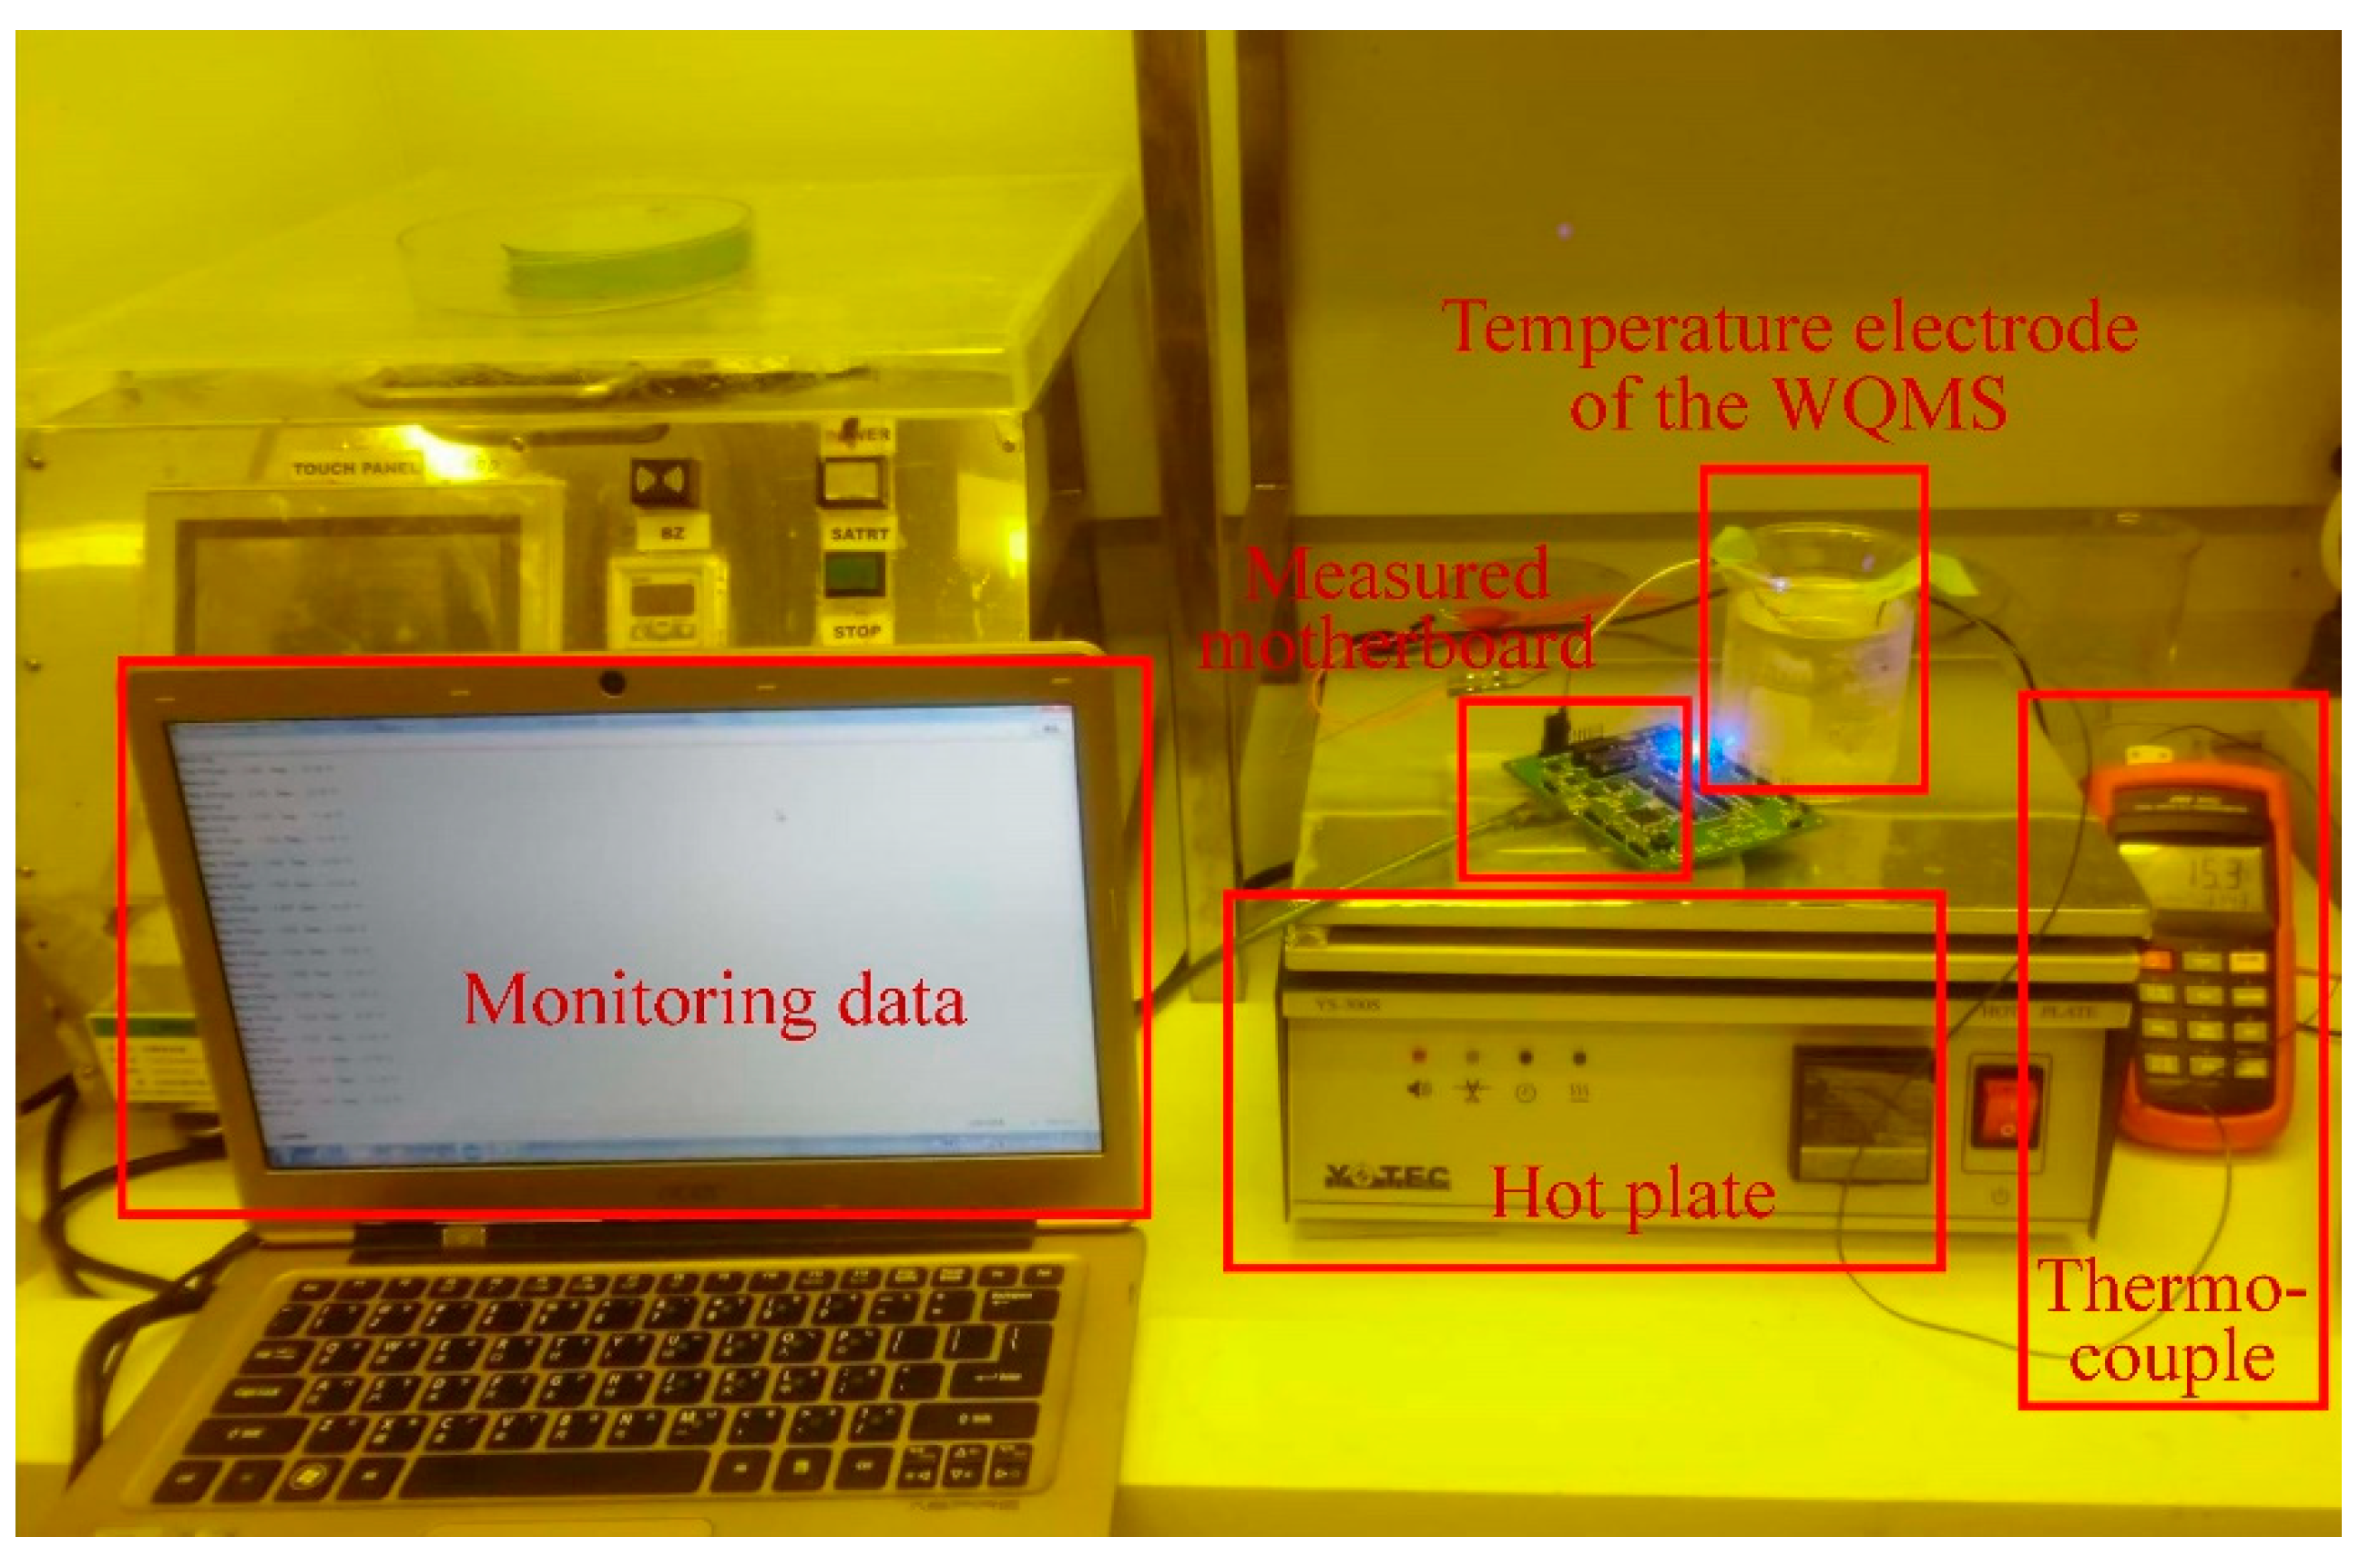
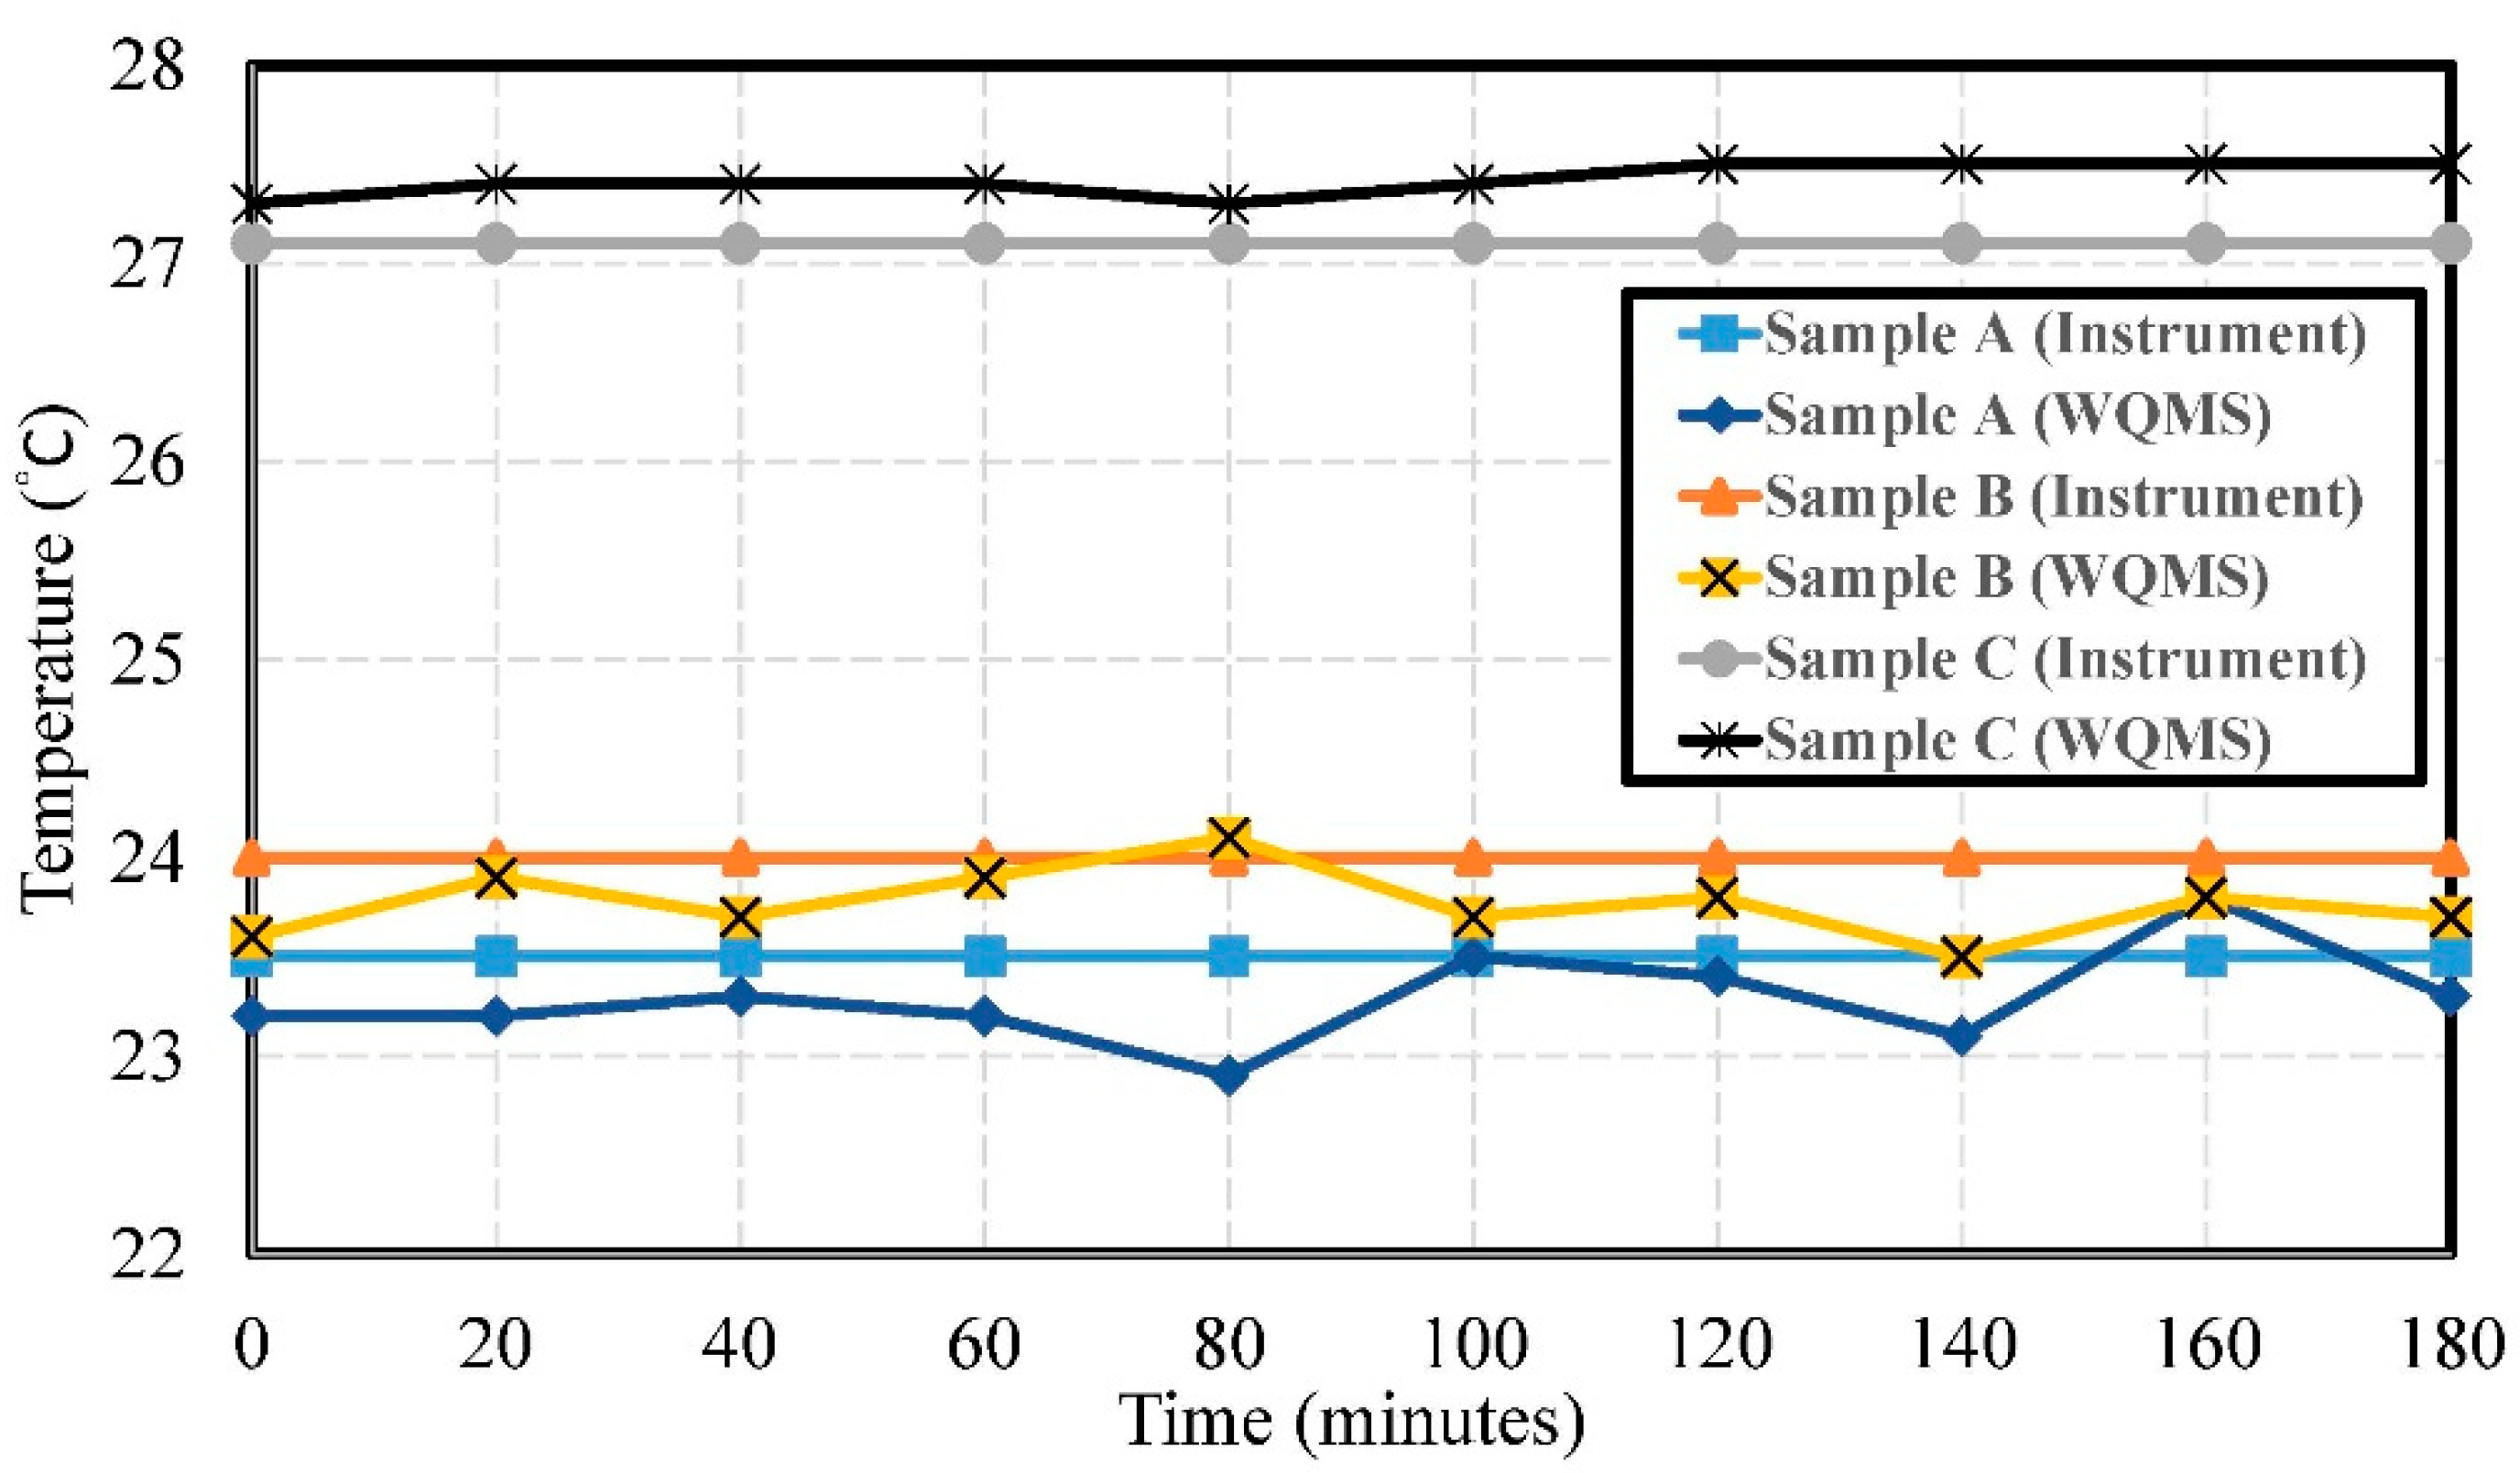
4.1. Monitoring of Temperature
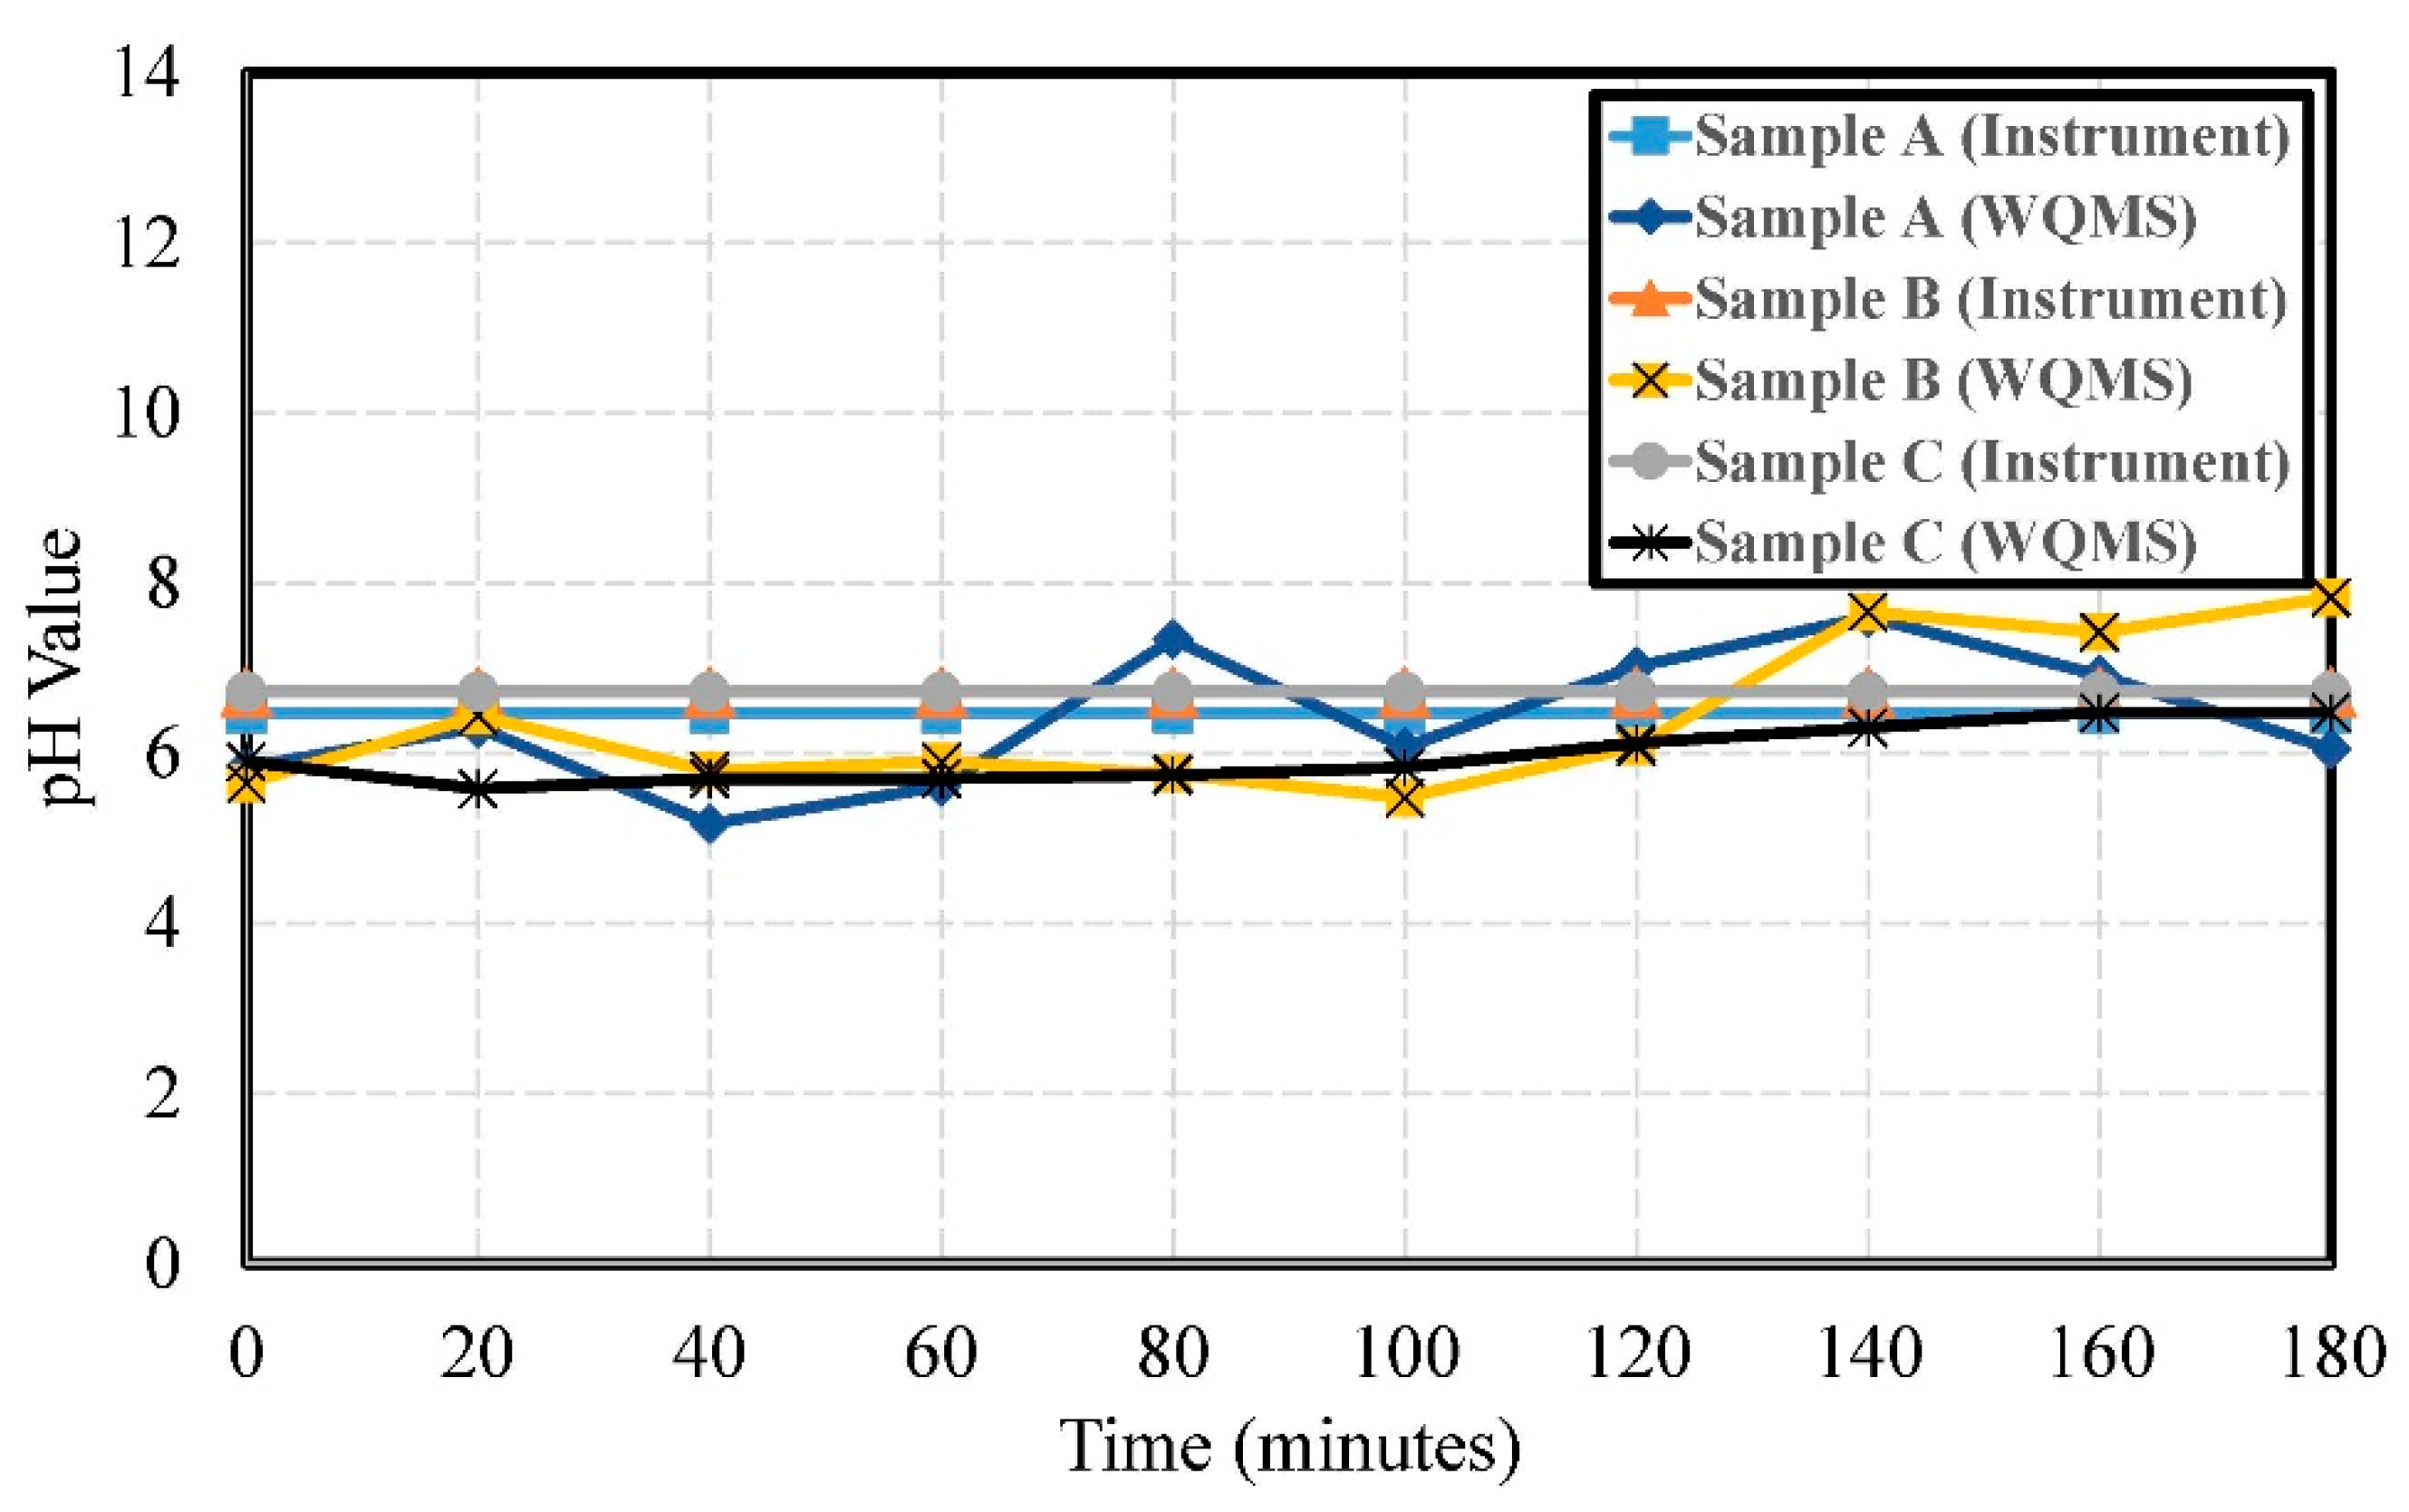
4.2. Monitoring of pH Value
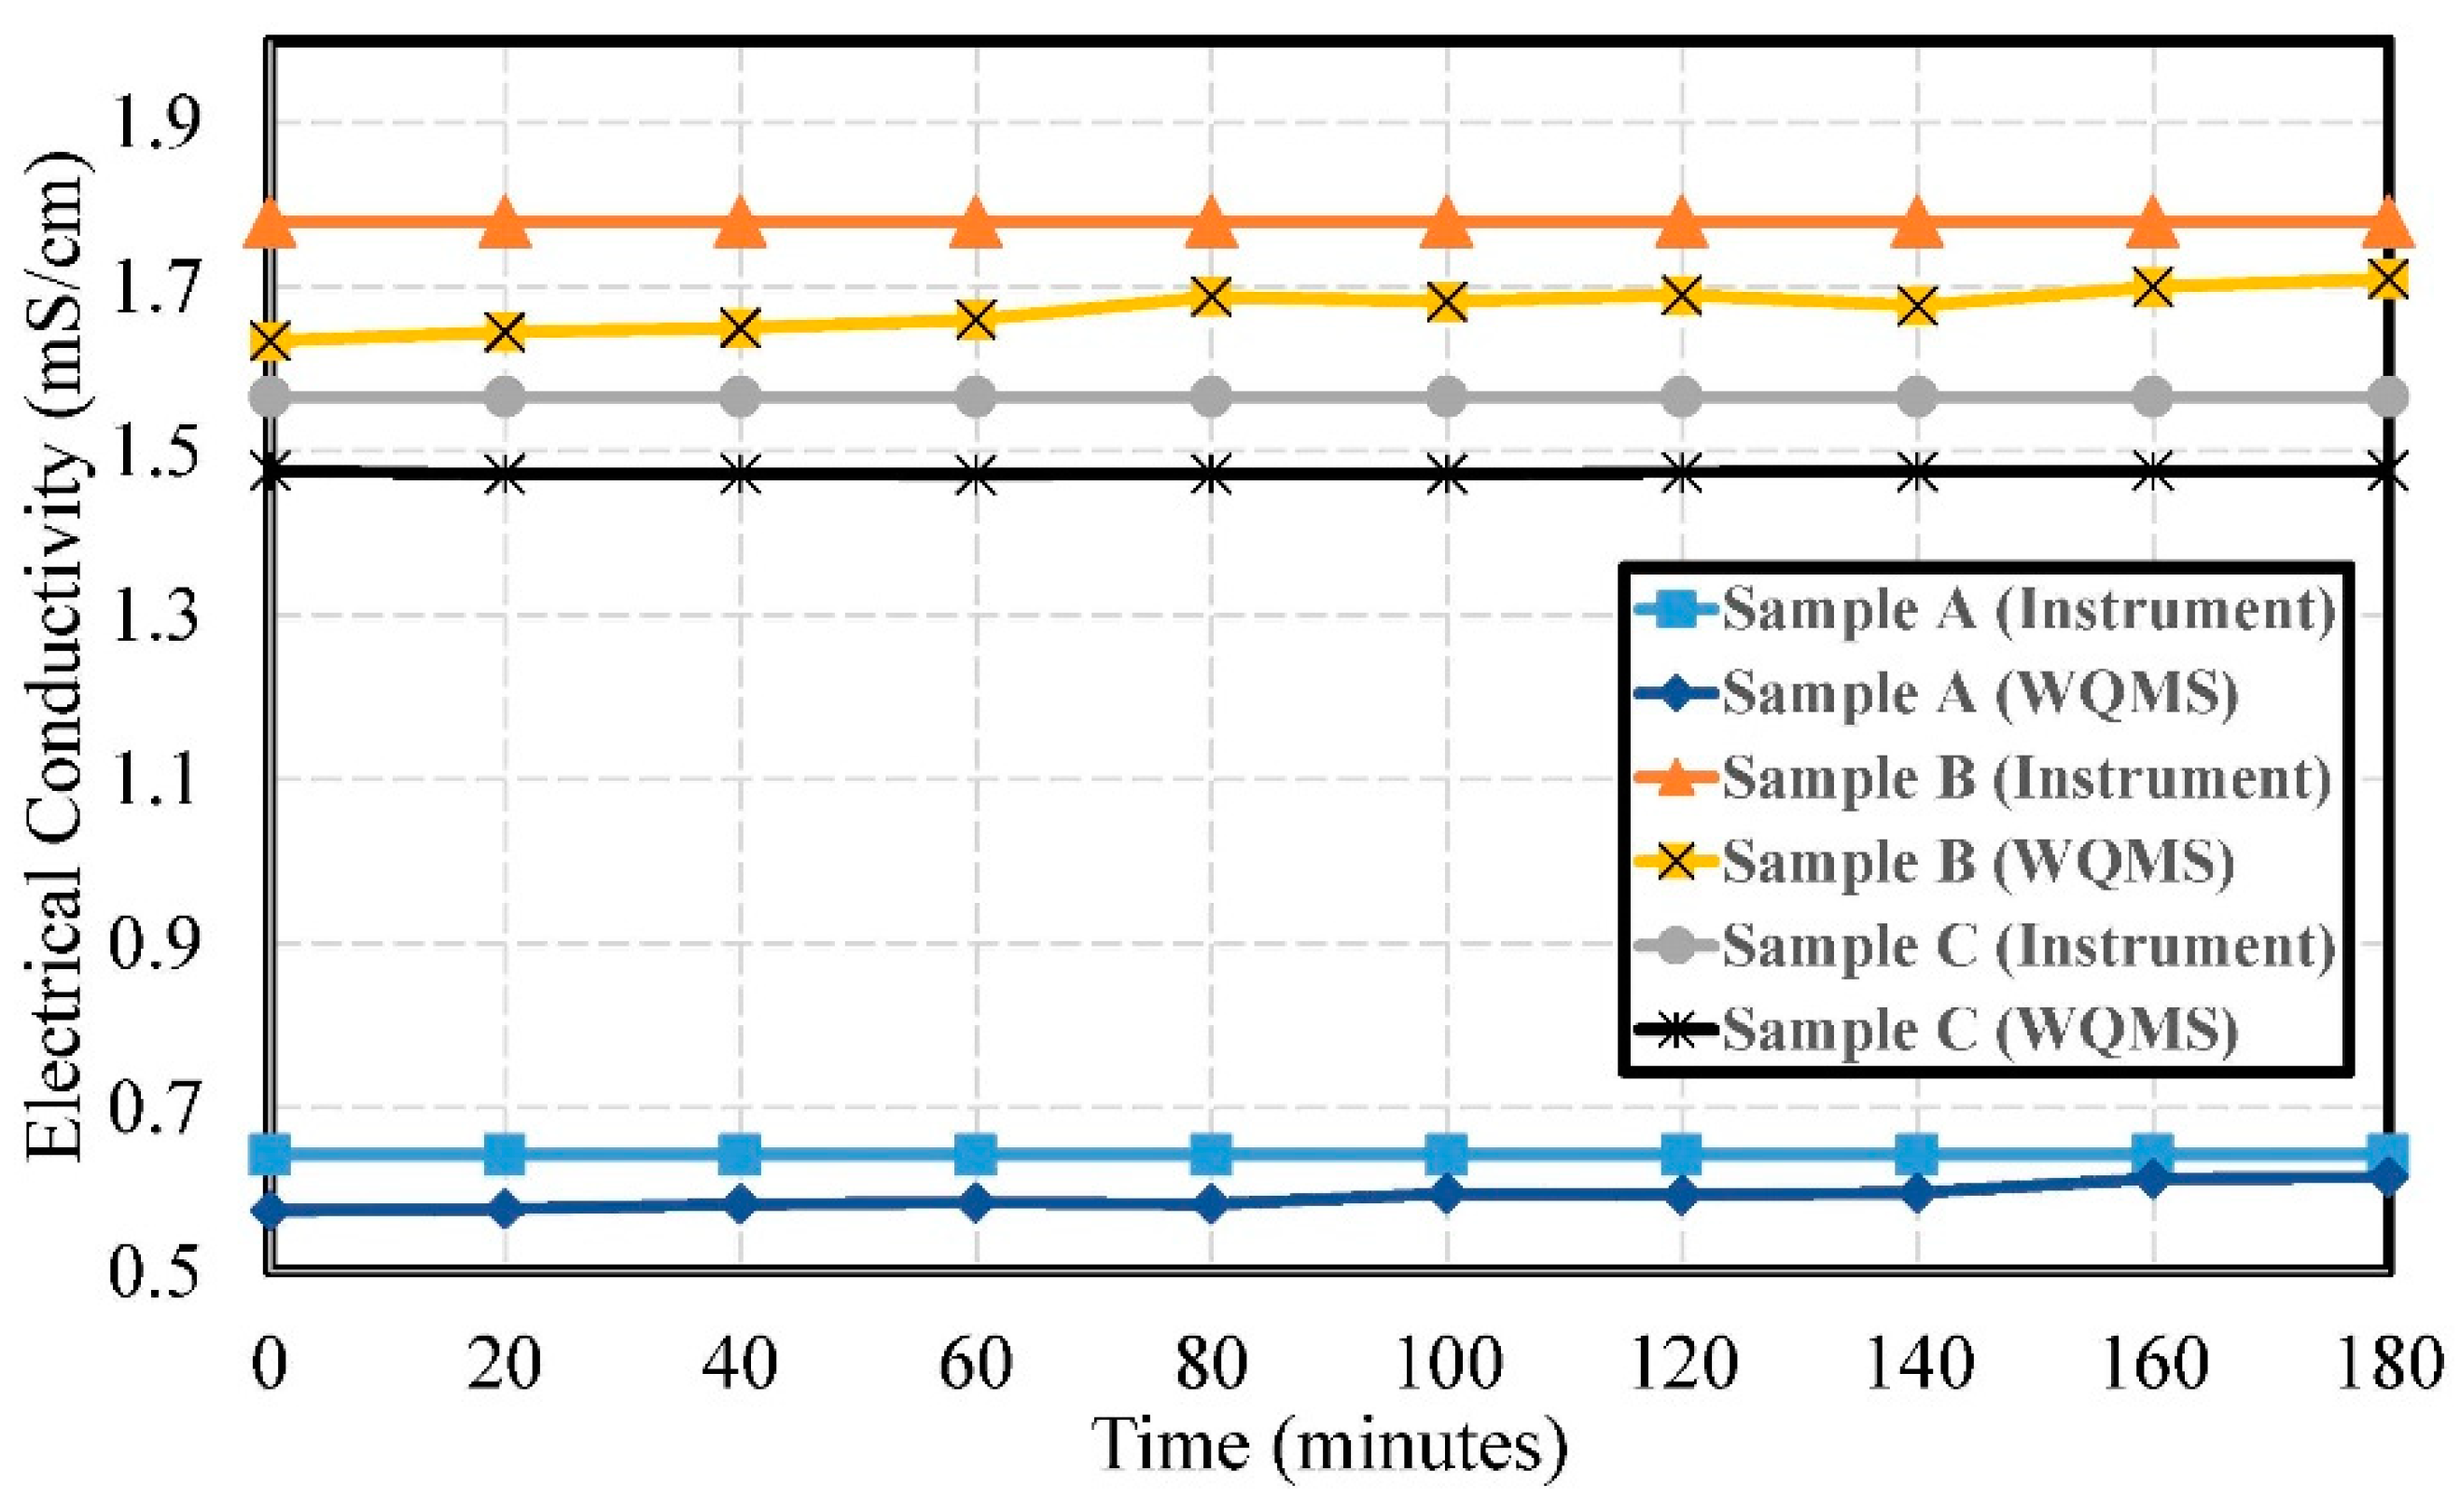
4.3. Monitoring of Electrical Conductivity
4.4. Monitoring of Copper Ion Concentration
5. Conclusions
Author Contributions
Funding
Acknowledgments
Conflicts of Interest
References
- Environmental Protection Administration, Executive Yuan, R.O.C. (Taiwan). Available online: https://wq.epa.gov.tw/Code/Business/DrinkWaterMetal.aspx (accessed on 8 May 2017).
- Taipei Water Department. Available online: https://www.water.gov.taipei/cp.aspx?n=B96B3009F7951CD4 (accessed on 26 July 2019).
- Zhou, B.; Bian, C.; Iong, J.; Xia, S. Fabrication of a Miniature Multi-Parameter Sensor Chip for Water Quality Assessment. Sensors 2017, 17, 157. [Google Scholar] [CrossRef] [PubMed]
- Moparthi, N.R.; Mukesh, C.; Sagar, P.V. Water Quality Monitoring System Using IOT. In Proceedings of the 2018 Fourth International Conference on Advances in Electrical, Electronics, Information, Communication and Bio-Informatics (AEEICB), Chennai, India, 27–28 February 2018; pp. 1–2. [Google Scholar]
- Environmental Protection Administration, Executive Yuan, R.O.C. (Taiwan). Available online: http://wq.epa.gov.tw/Code/Business/Purpose.aspx (accessed on 10 March 2017).
- Environmental Protection Administration, Executive Yuan, R.O.C. (Taiwan). Available online: https://oaout.epa.gov.tw/law/LawContent.aspx?id=GL002557#lawmenu (accessed on 2 February 2007).
- Environmental Protection Administration, Executive Yuan, R.O.C. (Taiwan). Available online: https://oaout.epa.gov.tw/law/LawContent.aspx?id=FL015489 (accessed on 29 April 2019).
- Alahi, M.E.E.; Xie, L.; Mukhopadhyay, S.; Burkitt, L. A Temperature Compensated Smart Nitrate-Sensor for Agricultural Industry. IEEE Trans. Ind. Electron. 2017, 64, 7333–7341. [Google Scholar] [CrossRef]
- Bergveld, P. Development of an Ion-Sensitive Solid-State Device for Neurophysiological Measurement. IEEE Trans. Biomed. Eng. 1970, 17, 70–71. [Google Scholar] [CrossRef] [PubMed]
- Chen, D.Y.; Chan, P.K. An Intelligent ISFET Sensory System with Temperature and Drift Compensation for Long-Term Monitoring. IEEE Sens. J. 2008, 8, 1948–1959. [Google Scholar] [CrossRef]
- Van der Spiegel, J.; Lauks, I.; Chan, P.; Babic, D. The Extended Gate Chemically Sensitive Field Effect Transistor as Multi-Species Microprobe. Sens. Actuators B Chem. 1983, 4, 291–298. [Google Scholar] [CrossRef]
- Ghusoon, M.A.; Ra’ad, H.D.; Abdullateef, A.A. pH Sensing Characteristics of EGFET Based on Pd-Doped ZnO Thin Films Synthesized by Sol-Gel Method. In Proceedings of the 2015 Third International Conference on Technological Advances in Electrical, Electronics and Computer Engineering (TAEECE), Beirut, Lebanon, 29 April–1 May 2015; pp. 234–238. [Google Scholar]
- Yuwono, T.; Pramono, W.B.; Ardi, I. Design of the Remote Sensing Circuit for Water Conductivity. In Proceedings of the 2015 International Conference on Space Science and Communication (IconSpace), Langkawi, Malaysia, 10–12 August 2015; pp. 84–88. [Google Scholar]
- Cloete, N.A.; Malekian, R.; Nair, L. Design of Smart Sensors for Real-Time Water Quality Monitoring. IEEE Access 2016, 4, 3975–3990. [Google Scholar] [CrossRef]
- Deyuan Technology, 2017, DFRobot Water Conductivity Sensor Module Circuit Diagram. Available online: http://www.dfrobot.com.cn/images/upload/File/20140504162158jqhepx.pdf (accessed on 7 January 2014).


© 2019 by the authors. Licensee MDPI, Basel, Switzerland. This article is an open access article distributed under the terms and conditions of the Creative Commons Attribution (CC BY) license (http://creativecommons.org/licenses/by/4.0/).
Share and Cite
Yu, H.-C.; Tsai, M.-Y.; Tsai, Y.-C.; You, J.-J.; Cheng, C.-L.; Wang, J.-H.; Li, S.-J. Development of Miniaturized Water Quality Monitoring System Using Wireless Communication. Sensors 2019, 19, 3758. https://doi.org/10.3390/s19173758
Yu H-C, Tsai M-Y, Tsai Y-C, You J-J, Cheng C-L, Wang J-H, Li S-J. Development of Miniaturized Water Quality Monitoring System Using Wireless Communication. Sensors. 2019; 19(17):3758. https://doi.org/10.3390/s19173758
Chicago/Turabian StyleYu, Hsing-Cheng, Ming-Yang Tsai, Yuan-Chih Tsai, Jhih-Jyun You, Chun-Lin Cheng, Jung-How Wang, and Szu-Ju Li. 2019. "Development of Miniaturized Water Quality Monitoring System Using Wireless Communication" Sensors 19, no. 17: 3758. https://doi.org/10.3390/s19173758
APA StyleYu, H.-C., Tsai, M.-Y., Tsai, Y.-C., You, J.-J., Cheng, C.-L., Wang, J.-H., & Li, S.-J. (2019). Development of Miniaturized Water Quality Monitoring System Using Wireless Communication. Sensors, 19(17), 3758. https://doi.org/10.3390/s19173758