Research on the Weld Position Detection Method for Sandwich Structures from Face-Panel Side Based on Backscattered X-ray


Abstract
1. Introduction
2. Detection Method and Characteristics of X-ray Intensity Signal
3. Experimental System for Weld Detection
4. Acquisition and Processing of the Backscattered X-ray Intensity Signal
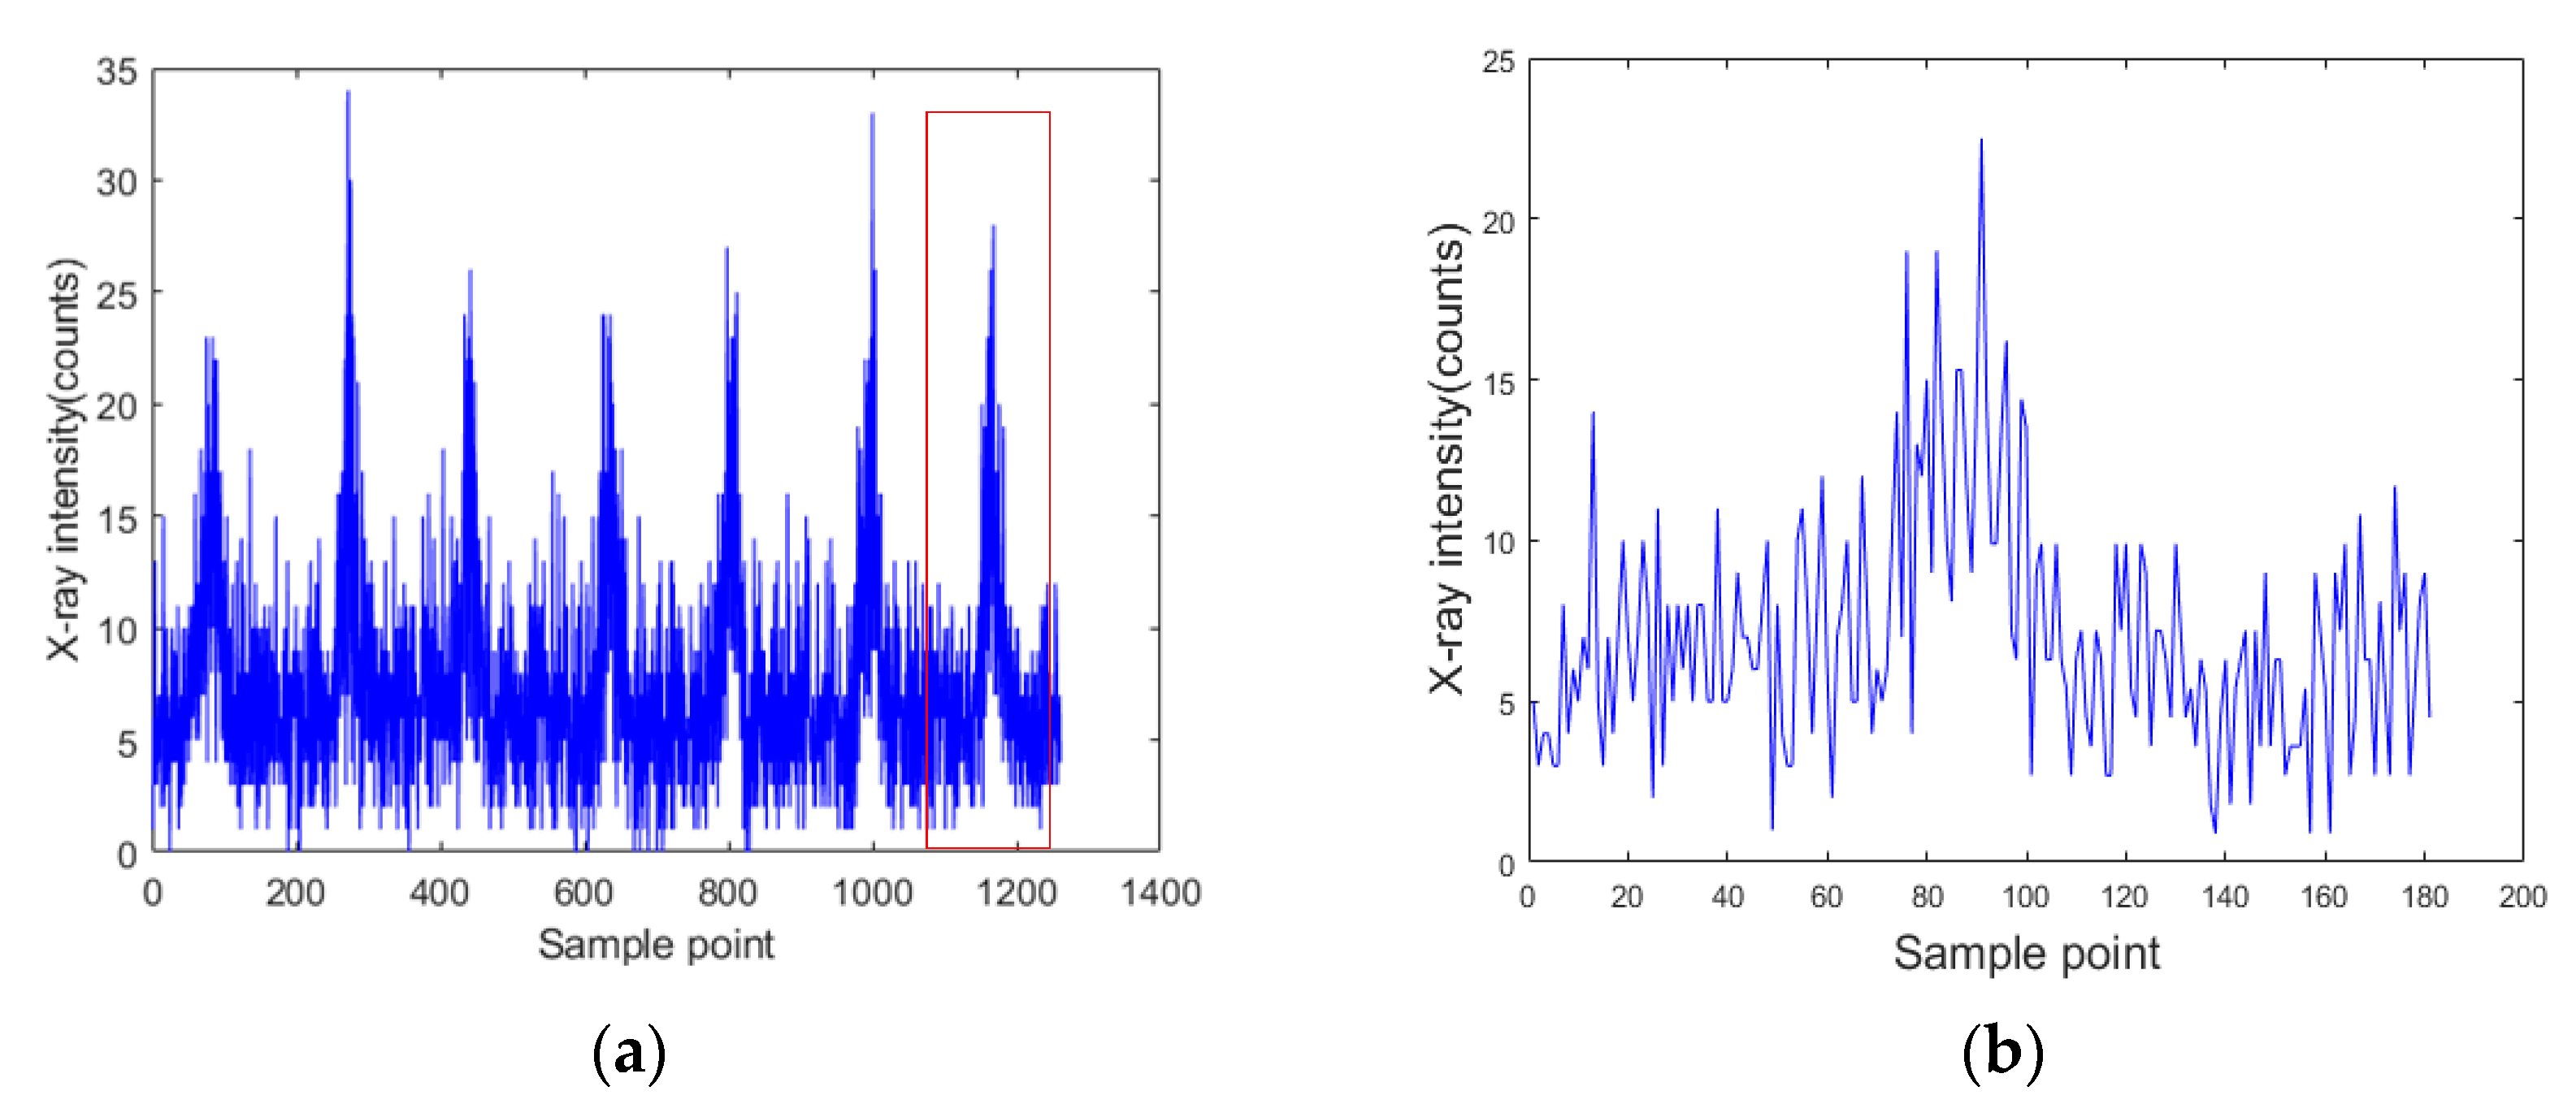
4.1. Signal Acquisition
4.2. Signal Processing
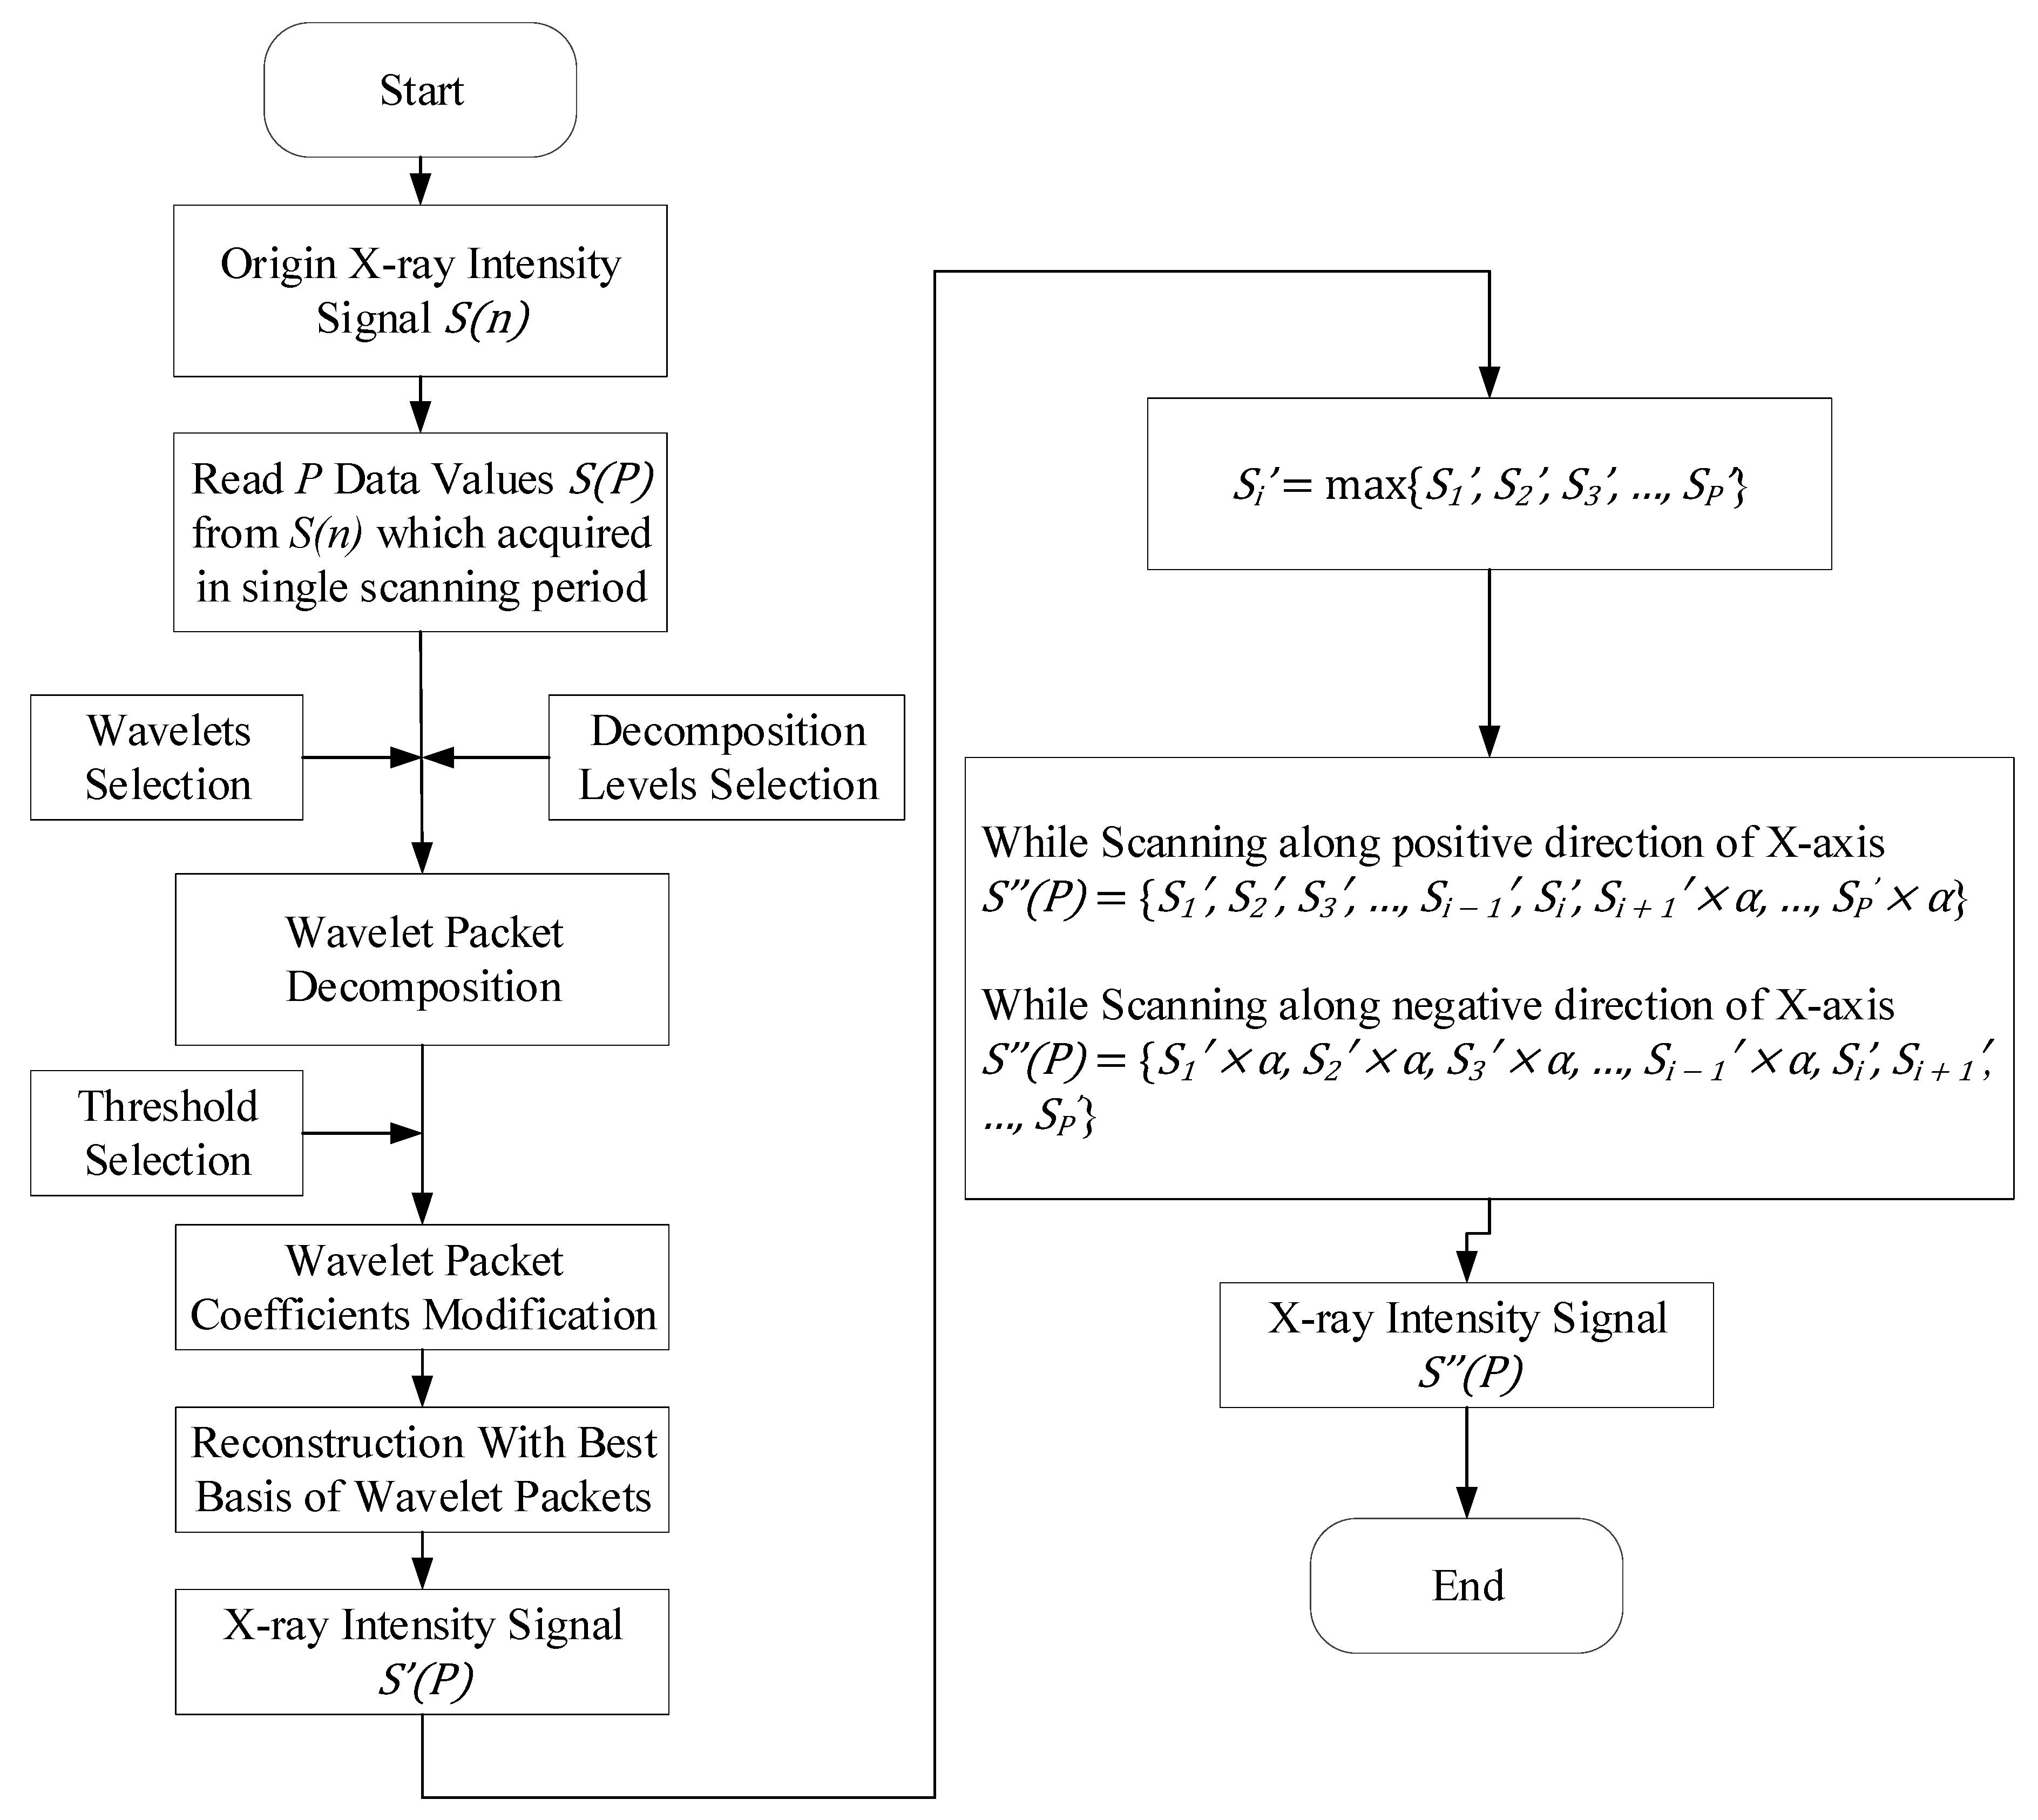
4.2.1. Denoising
- Suppose the original signal is S(n), n ∈ [1,M], select a data queue S(P) with a length of P from S(n), where P is the number of sampling points acquired in single scanning period, S(P) = {S1, S2, S3, …, SP}.
- Read into the select sampling signal S(P), then do wavelet packet decomposition for L layers.
- Look for the best threshold to quantize the coefficients of wavelet packets.
- Reconstruct the signal with the best basis of wavelet packets, and then get the denoised X-ray intensity signal S’(P).
- Compare all data of S’(P) to find the maximum Si’Si’ = max{S1’, S2’, S3’, …, SP’}.
- Correct the denoised signal S’(P).While scanning in the positive X-direction, the sample signals acquired after the maximum sampling signal (Si’) are multiplied by the correction coefficient.S”(P) = {S1’, S2’, S3’, …, Si − 1’, Si’, Si + 1’ × α, …, SP’ × α}The coefficient is obtained by minimizing the sum of the differences of symmetric signals about the maximum value.While scanning in the negative X-direction, the sample signals acquired before the maximum sampling signal (Si’) are multiplied by the correction coefficient.S”(P) = {S1’ × α, S2’ × α, S3’ × α, …, Si − 1’ × α, Si’, Si + 1’, …, SP’}
4.2.2. Curve Fitting
4.2.3. The Analysis of the Detection Errors
5. Detection Process Parameter Optimization
6. Weld Position Detection Experiments
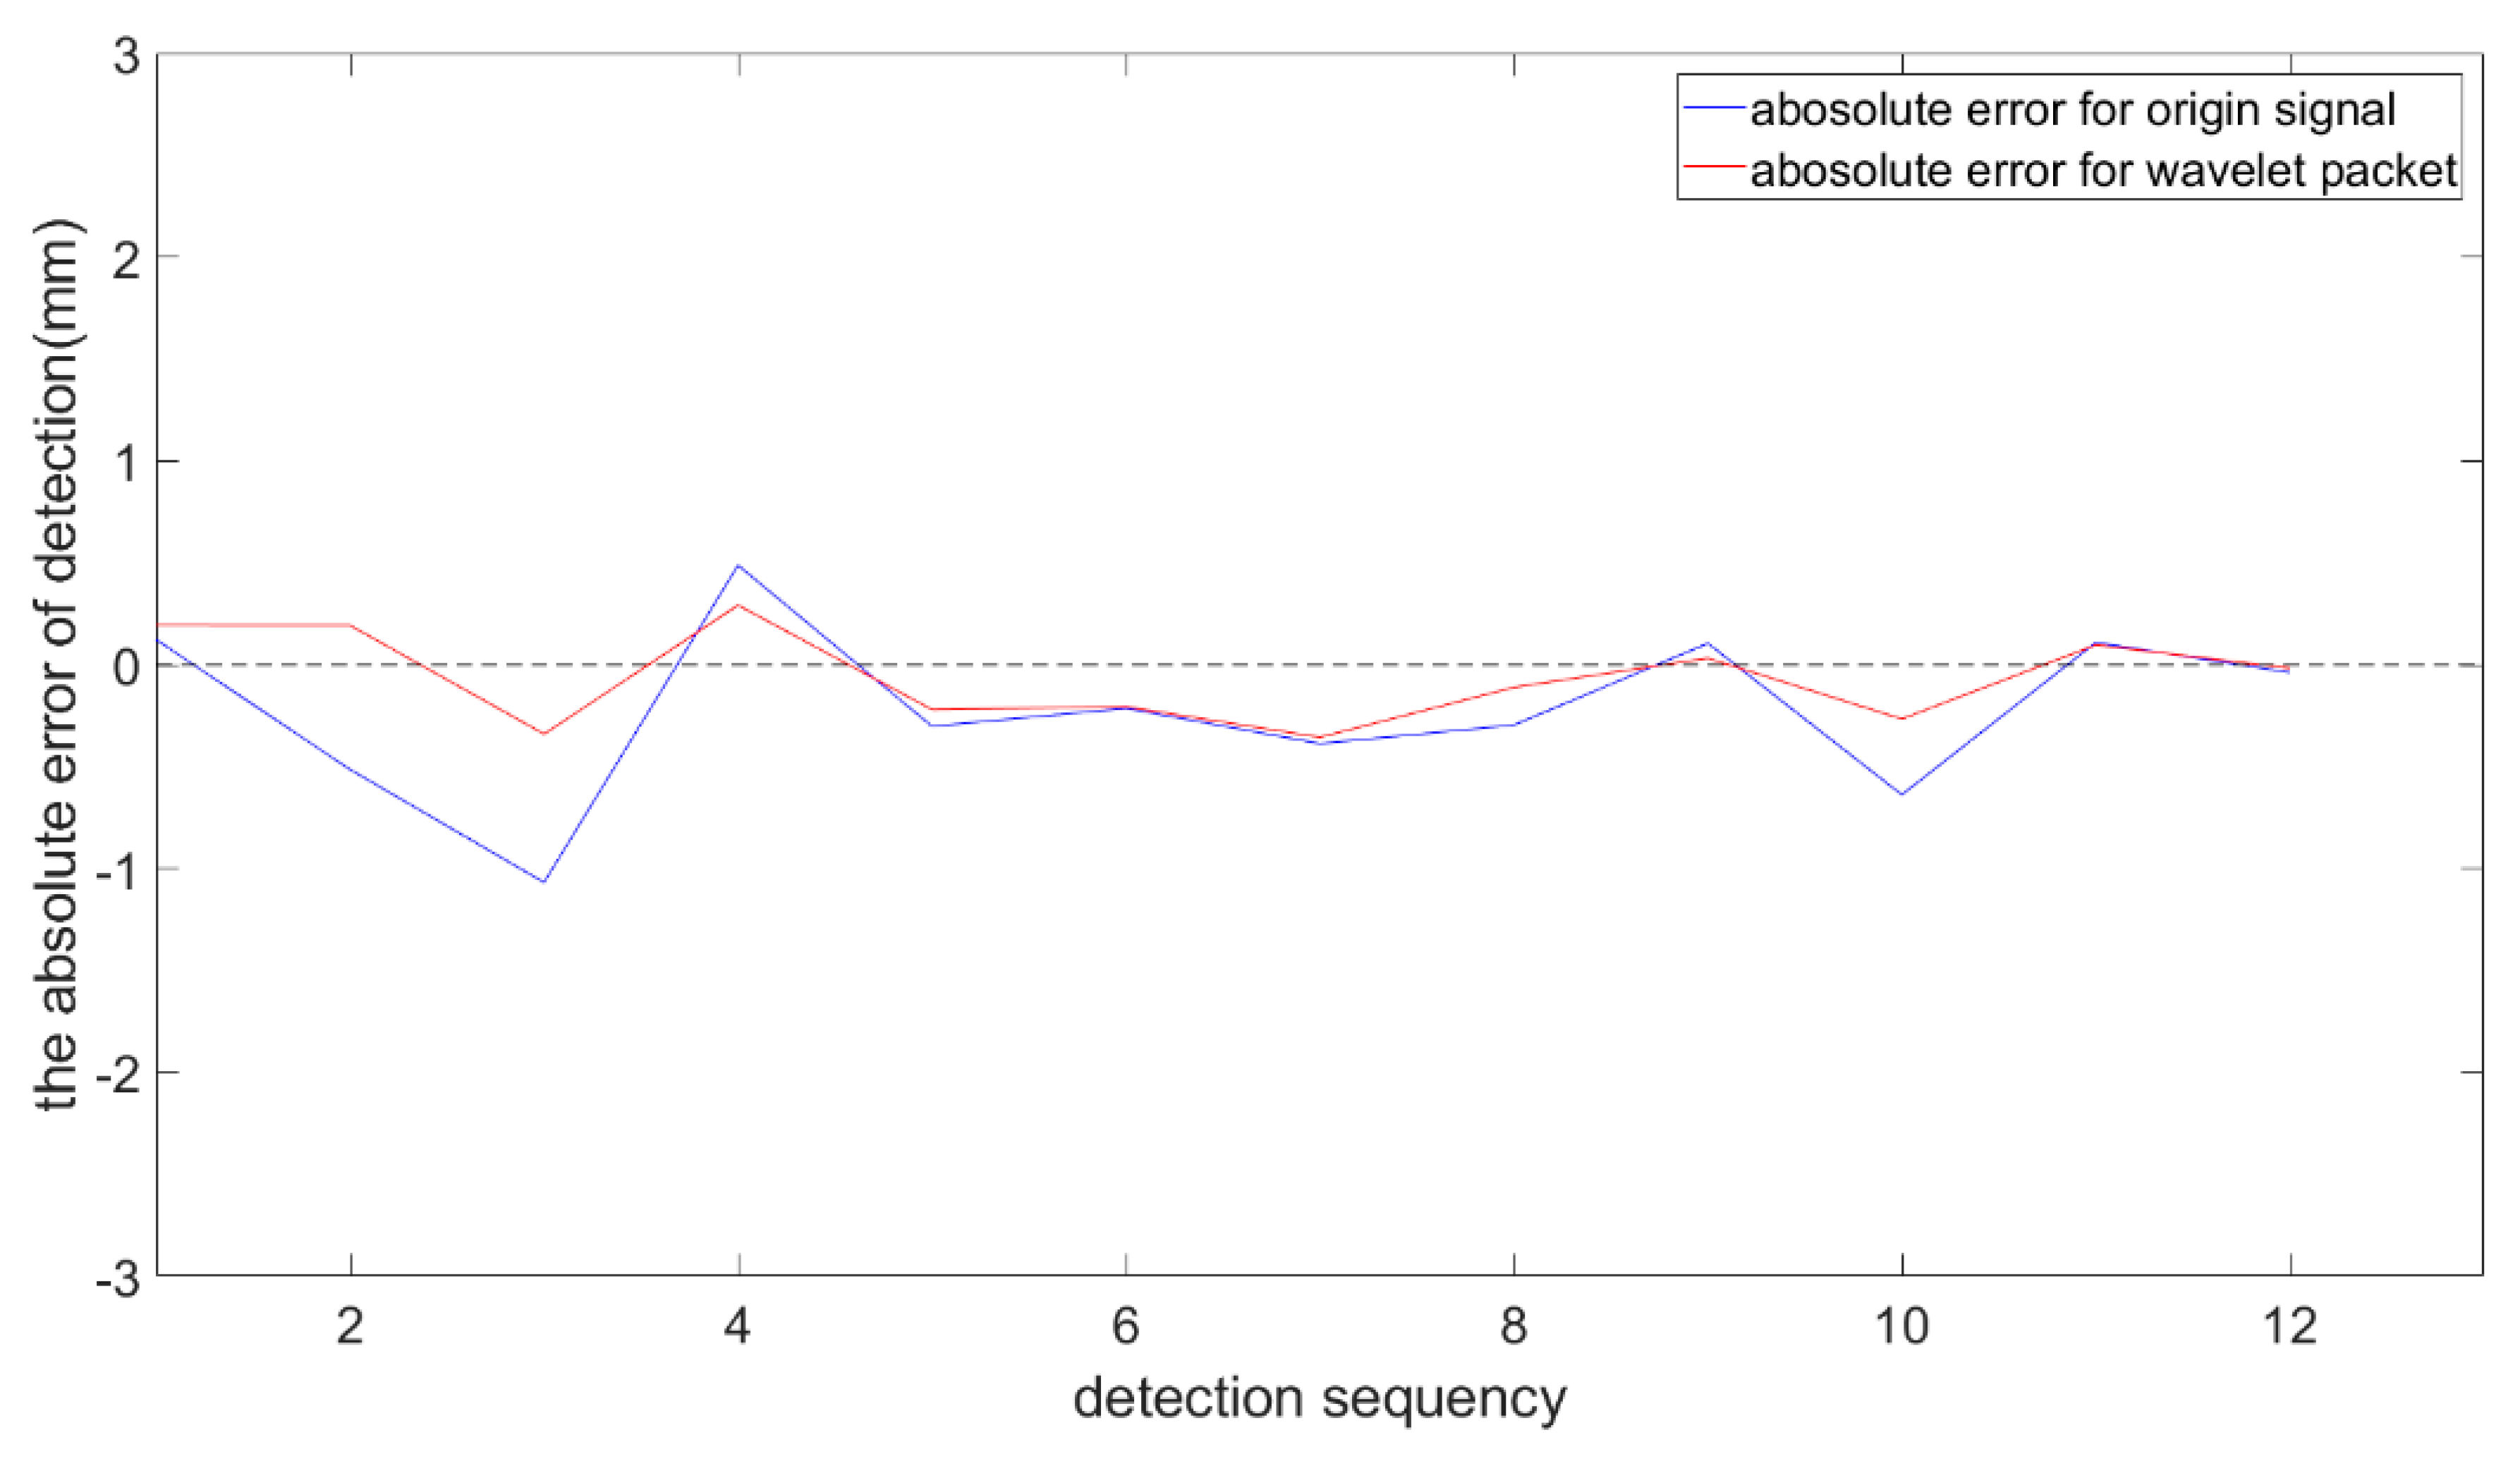
6.1. Accuracy of Detection
6.2. Dynamic Performance of Detection
7. Conclusions
Author Contributions
Funding
Conflicts of Interest
References
- Kujala, P.; Klanac, A. Steel Sandwich Panels in Marine Applications. Brodogradnja 2005, 56, 305–314. [Google Scholar]
- Rydén, R.; Hallberg, M.; Jensen, T.; Krebs, N. Industrialisation of the Volvo Aero Laser Welded Sandwich Nozzle. In Proceedings of the 41st AIAA/ASME/SAE/ASEE Joint Propulsion Conference & Exhibit, Tucson, AZ, USA, 10–13 July 2005; p. 4305. [Google Scholar]
- Roland, F.; Manzon, L.; Kujala, P.; Brede, M.; Weitzenböck, J. Advanced joining techniques in European shipbuilding. J. Ship Prod. 2004, 20, 200–210. [Google Scholar]
- Kim, J.W.; Jang, B.S.; Kim, Y.T.; Chun, K.S. A study on an efficient prediction of welding deformation for T-joint laser welding of sandwich panel PART I Proposal of a heat source model. Int. J. Nav. Arch. Ocean 2013, 5, 348–363. [Google Scholar] [CrossRef]
- Xu, K.; Cui, H.; Li, F. Connection Mechanism of Molten Pool during Laser Transmission Welding of T-Joint with Minor Gap Presence. Materials 2018, 11, 1823. [Google Scholar] [CrossRef] [PubMed]
- Zhang, X.; Li, L.; Chen, Y.; Yang, Z.; Zhu, X. Experimental Investigation on Electric Current-Aided Laser Stake Welding of Aluminum Alloy T-Joints. Metals 2017, 7, 467. [Google Scholar] [CrossRef]
- Jiang, X.X.; Zhu, L.; Qiao, J.S.; Wu, Y.X.; Li, Z.G.; Chen, J.H. The Strength of Laser Welded Web-Core Steel Sandwich Plates. Appl. Mech. Mater. 2014, 551, 42–46. [Google Scholar] [CrossRef]
- Li, X.; Lu, F.; Cui, H.; Tang, X.; Wu, Y. Numerical modeling on the formation process of keyhole-induced porosity for laser welding steel with T-joint. Int. J. Adv. Manuf. Technol. 2014, 72, 241–254. [Google Scholar] [CrossRef]
- Romanoff, J.; Varsta, P.; Remes, H. Laser-welded web-core sandwich plates under patch loading. Mar. Struct. 2007, 20, 25–48. [Google Scholar] [CrossRef]
- Kim, J.W.; Jang, B.S.; Kang, S.W. A study on an efficient prediction of welding deformation for T-joint laser welding of sandwich panel Part II: Proposal of a method to use shell element model. Int. J. Nav. Arch. Ocean 2014, 6, 245–256. [Google Scholar] [CrossRef]
- Yong, Z. Study on Technology and Interface of AZ31B-304 Stainless Steel Sandwich Plate T-Joints by Laser Welding; Taiyuan University of Technology: Taiyuan, China, 2016. [Google Scholar]
- Fleming, P.A.; Hendricks, C.E.; Wilkes, D.M.; Cook, G.E.; Strauss, A.M. Automatic seam-tracking of friction stir welded T-joints. Int. J. Adv. Manuf. Technol. 2009, 45, 490–495. [Google Scholar] [CrossRef]
- Gibson, B.T.; Cox, C.D.; Ballun, M.C.; Cook, G.E.; Strauss, A.M. Automatic Tracking of Blind Sealant Paths in Friction Stir Lap Joining. J. Aircr. 2015, 51, 824–832. [Google Scholar] [CrossRef]
- Cai, Y.; Yang, Q.; Sun, D.; Zhu, J.; Wu, Y. Monitoring of deviation status of incident laser beam during CO2 laser welding processes for I-core sandwich construction. Int. J. Adv. Manuf. Technol. 2015, 77, 305–320. [Google Scholar] [CrossRef]
- Hallberg, M.; Stenholm, T. Laser welded sandwich manufacturing technology for nozzle extensions. In Proceedings of the 37th Joint Propulsion Conference and Exhibit, Salt Lake City, UT, USA, 8–11 July 2001; p. 3255. [Google Scholar]
- Hogman, U.; Ryden, R. The Volvo aero laser welded sandwich nozzle. In Proceedings of the 40th AIAA/ASME/SAE/ASEE Joint Propulsion Conference and Exhibit, Fort Lauderdale, FL, USA, 11–14 July 2004. [Google Scholar]
- Zhang, C.; Shen, T.; Liu, F.; He, Y. Identification of Coffee Varieties Using Laser-Induced Breakdown Spectroscopy and Chemometrics. Sensors 2018, 18, 95. [Google Scholar] [CrossRef] [PubMed]
- Zhixian, C.; Zhi, Z. Nuclear Radiation Physics and Detection; Harbin Engineering University Press: Harbin, China, 2011; p. 483. [Google Scholar]
- Vaseghi, S.V. Advanced Digital Signal Processing and Noise Reduction; John Wiley & Sons: Hoboken, NJ, USA, 2008; p. 514. [Google Scholar]
- Lynch, K.; Marchuk, N.; Elwin, M. Embedded Computing and Mechatronics with the PIC32 Microcontroller; Newnes: New South Wales, Australia, 2015; p. 650. [Google Scholar]
- Brown, R.G.; Hwang, P.Y. Introduction to Random Signals and Applied Kalman Filtering; Wiley New York: Hoboken, NJ, USA, 1992; p. 512. [Google Scholar]
- Seel, A.; Davtyan, A.; Pietsch, U.; Loffeld, O. Norm-minimized scattering data from intensities. In Proceedings of the International Conference on Communications, Kuala Lumpur, Malaysia, 23–27 May 2016. [Google Scholar]
- Xu, Y.; Zhong, J.; Ding, M.; Chen, H.; Chen, S. The acquisition and processing of real-time information for height tracking of robotic GTAW process by arc sensor. Int. J. Adv. Manuf. Technol. 2013, 65, 1031–1043. [Google Scholar] [CrossRef]
- Li, Z.; Zheng, L.; Chen, C.; Long, Z.; Wang, Y. Ultrasonic Detection Method for Grouted Defects in Grouted Splice Sleeve Connector Based on Wavelet Pack Energy. Sensors 2019, 19, 1642. [Google Scholar] [CrossRef] [PubMed]
- Atto, A.M.; Pastor, D.; Isar, A. On the statistical decorrelation of the wavelet packet coefficients of a band-limited wide-sense stationary random process. Signal Process. 2007, 87, 2320–2335. [Google Scholar] [CrossRef][Green Version]
- Erwin, W.D. Physics in Nuclear Medicine. J. Nucl. Med. 2013, 54, 1168. [Google Scholar] [CrossRef][Green Version]
- Zuo, K.; Sun, T.J. Compton scattering based method of objects thickness. J. Shandong Univ. 2009, 39, 68–71. [Google Scholar]


| Processing Algorithm | Absolute Error Before Correction (mm) | Absolute Error After Correction (mm) |
|---|---|---|
| Origin | 0.916 | 0.105 |
| Average filter | 0.907 | 0.086 |
| Kalman filter | 1.029 | 0.214 |
| Wavelet packet | 0.838 | 0.032 |
| Parameter Name | Parameter Value |
|---|---|
| Material type | AA6061 Aluminum |
| Thickness of cover panel (mm) | 3 |
| Thickness of core panel (mm) | 3 |
| Parameter Name | Parameter Value |
|---|---|
| X-ray photon energy E0 (keV) | 50/60/70/80 |
| X-ray beam intensity N0 (counts) | 2 × 10⁷/5 × 107/7 × 107/108 |
| Incident beam diameter (mm) | 2 |
| Diameter of the sensitive end of the detector (mm) | 50 |
| Scattering angle (°) | 120 |
| Distance between source and face panel (mm) | 200 |
| Parameter Name | Parameter Value |
|---|---|
| X-ray photon energy (keV) | 60–70 |
| X-ray beam intensity (counts) | 108 |
| Incident beam diameter (mm) | 2 |
| Diameter of the sensitive end of the detector (mm) | 50 |
| Scattering angle (°) | 120 |
| The distance between source and face panel (mm) | 200 |
| The distance between detector and T-joint (mm) | 120 |
| Processing Algorithm | Max Absolute Error (mm) | Max Error to Thickness of Core Panel | Standard Error (mm) | Standard Error to Thickness of Core | Standard Deviation (mm) |
|---|---|---|---|---|---|
| Origin signal | −1.527 | 50.9% | 0.563 | 18.8% | 0.542 |
| Wavelet packet | −0.287 | 9.57% | 0.205 | 6.83% | 0.206 |
| Processing Algorithm | Max Absolute Error (mm) | Max Error to Thickness of Core Panel | Standard Error (mm) | Standard Error to Thickness of Core | Standard Deviation (mm) |
|---|---|---|---|---|---|
| Origin signal | −1.242 | 41.4% | 0.453 | 15.1% | 0.414 |
| Wavelet packet | −0.340 | 11.3% | 0.221 | 7.37 | 0.223 |
© 2019 by the authors. Licensee MDPI, Basel, Switzerland. This article is an open access article distributed under the terms and conditions of the Creative Commons Attribution (CC BY) license (http://creativecommons.org/licenses/by/4.0/).
Share and Cite
Wei, A.; Chang, B.; Xue, B.; Peng, G.; Du, D.; Han, Z. Research on the Weld Position Detection Method for Sandwich Structures from Face-Panel Side Based on Backscattered X-ray. Sensors 2019, 19, 3198. https://doi.org/10.3390/s19143198
Wei A, Chang B, Xue B, Peng G, Du D, Han Z. Research on the Weld Position Detection Method for Sandwich Structures from Face-Panel Side Based on Backscattered X-ray. Sensors. 2019; 19(14):3198. https://doi.org/10.3390/s19143198
Chicago/Turabian StyleWei, Angang, Baohua Chang, Boce Xue, Guodong Peng, Dong Du, and Zandong Han. 2019. "Research on the Weld Position Detection Method for Sandwich Structures from Face-Panel Side Based on Backscattered X-ray" Sensors 19, no. 14: 3198. https://doi.org/10.3390/s19143198
APA StyleWei, A., Chang, B., Xue, B., Peng, G., Du, D., & Han, Z. (2019). Research on the Weld Position Detection Method for Sandwich Structures from Face-Panel Side Based on Backscattered X-ray. Sensors, 19(14), 3198. https://doi.org/10.3390/s19143198