1. Introduction
Image matching is one of the fundamental problems in the fields of computer vision and photogrammetry. The applications of image matching are various, including camera calibration [
1], 3D reconstruction [
2], visual navigation [
3], super-resolution [
4], etc. Many image matching algorithms have been proposed to accomplish the above tasks. Among them, feature-based methods, which focus on low-level features, such as edges, corners, are the most widely applied. Although many feature-based matching algorithms have been proved to achieve robust image matching between image pairs, they largely rely on the abundance of image texture, and may fail in the cases of lack of texture or repetitive texture. The problem is that by dividing an image into several small matching windows, or image patches, the overall structural similarity has been neglected. Most feature-based methods basically rely on low-level features, ignoring higher level features.
Instead of attempting to match local image features, correlation-based methods match the total or an area of image texture [
5]. Compared to feature-based methods, correlation-based methods are able to take the overall structural similarity into consideration, so that they are proved to be more robust to a lack of texture images when limited features can be extracted in local areas. Phase correlation [
6], as one of the widely used correlation-based image matching algorithms, has proved to be able to cope with repetitive texture and appearance differences between multimodal image pairs [
7]. However, correlation-based methods can hardly cope with large image distortion, which prevents them from further application in image registration under complex geometric transformation, such as perspective, affine, polynomial, etc. They are mainly used in dense matching using small matching windows that can be considered as a simple image translation.
In this paper, we extend phase correlation to complex geometric distortions by taking the advantage of its sensitivity to geometric distortion as the indicator for optimization. This work is particularly motivated by optic lens alignment based on interference. In interferometric optical testing, interference fringes are indicators to determine whether two lens are perfectly aligned or not. In this paper, we mimic the processor of interference-based lens alignment using novel optimization-based technique. If two images are perfectly aligned, the PC cross-power spectrum of the images taken by the two cameras appear to have clear fringe pattern, and the Dirac delta function which is the IFT of the cross-power spectrum will have a distinctive peak, as shown in
Figure 1. Otherwise, the fringe patterns will become vague, and the peak value are not distinctive. The best alignment is achieved by iteratively altering the geometric parameters of the camera until the interference fringes are strongest and clear.
This paper is organized as follows: the related work is reviewed in
Section 2. In
Section 3, we present our extension of the phase correlation to perspective geometric distortion. Experiment results are then given in
Section 4 from image registration to image-based navigation using DEM simulated terrain shading images as well as true landscape images with comparison to state-of-the art image matching methods. The paper is concluded in
Section 5.
2. Related Work
Image registration methods proposed thus far are generally either feature-based or correlation-based. The foundation of feature-based image matching is under the assumption that distinctive features maintain their positions and shape geometry under different imaging conditions. Most corner and edge detection algorithms are based on the spatial domain, which detect the sharply changed patterns based on image brightness. Some commonly used edge detection algorithms include the Canny operator [
8], zero-crossing operator [
9] and Mar operator [
10], and more recently, Scale-invariant Feature Transform (SIFT) [
11], proposed by Lowe. SIFT is invariant to scale, rotation and illumination intensity change, which enables robust image matching. Several improvements have been made to the SIFT operator to enhance its robustness for matching. One of the most widely accepted improved algorithms is Speed Up Robust Features (SURF) [
12], which claims to be faster and more robust than SIFT. These hand-craft features have achieved a dominant position in computer vision for years for their flexibility to different geometric distortions.
Recently, Convolution Neural Network (CNN)-based methods have been widely used in computer vision, including object detection, image retrieval, etc. Some of the studies applied learning-based approach for feature-based image matching. Temporally Invariant Learned Detector (TILDE) [
13] uses piecewise linear convolution filters to train data to robustly detect feature points which are robust to illumination and seasonal variations. Yi, et al. [
14] proposed a Learned Invariant Feature Transform (LIFT) algorithm which is an end-end deep network including feature detection, orientation estimation and feature description. To narrowing the gap between training data and testing data, a self-supervised interest point detector has been proposed [
15] which pre-trained the feature extractor on MS-COCO generic images. By using homographic adaptation approach, this fully-convolutional model achieves superior matching performance compared to state-of-the-art feature matching algorithms. The main limitation of deep learning-based approach is the requirement of large-scale annotated training data. To generate such large-scale training data which contain most cases in real-world is non-trivial.
The majority of feature-based matching methods solve perspective image distortion problems based on the following assumption: although the transformations between image pairs are rather complex, the transformations between small matching windows can be simplified as image translation or Euclidean transformations, which include translation, scale and rotation. Then, a complex geometric transformation matrix, such as affine and projective, can be estimated by fitting all the feature points that do not contain outliers. Thus, as shown in
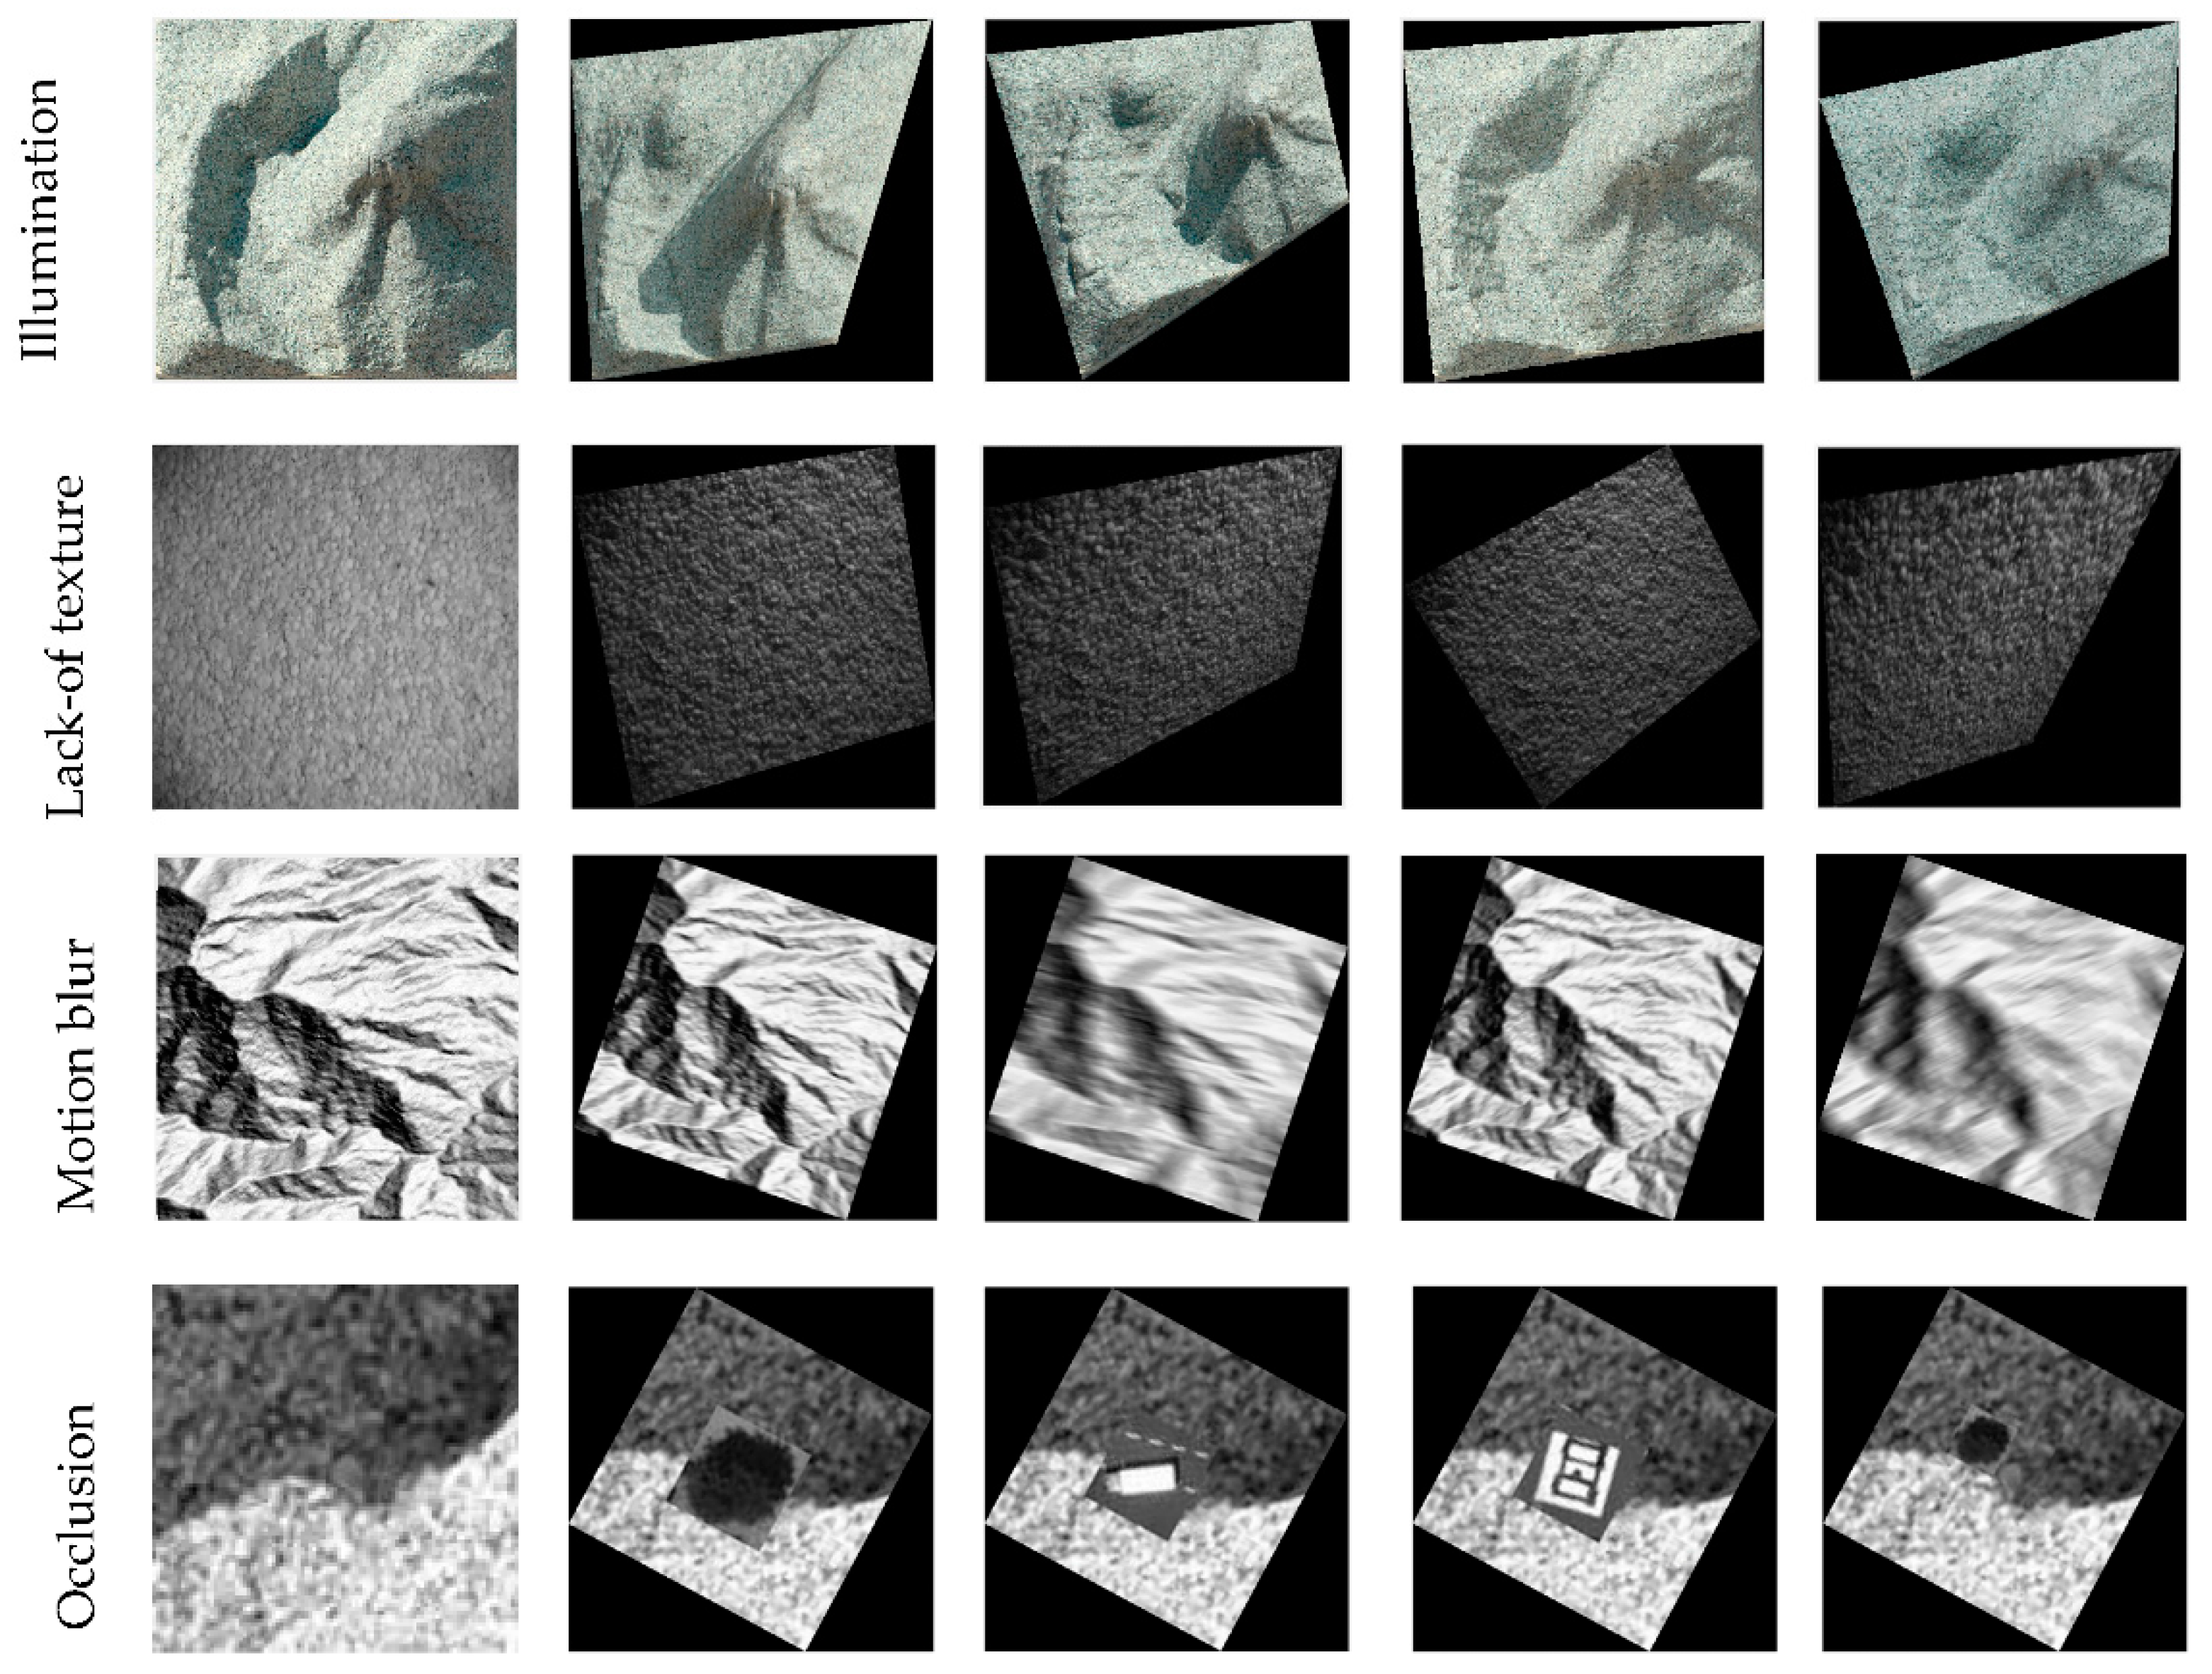
Table 1, for the image pairs lacking abundant texture or from multimodal data, few features could be extracted which may lead to incorrect transformation matrix estimations.
Correlation-based image matching approaches, known as area-based matching, are another branch of image matching approach. Area correlation based algorithms, such as Normalised Cross Correlation (NCC), Mutual Information (MI) [
16] and Phase Correlation (PC) [
6], directly match two areas in the reference and target images without feature extraction. Phase Correlation is an image matching algorithm based on Fourier shift property, which states that a translation shift between two similar images generates a linear phase difference in the Fourier frequency domain [
6]. The image shift can be resolved directly in the frequency domain with sub-pixel accuracy by unwarping and rank one fitting of the fringe patterns in the cross power spectrum [
17,
18,
19,
20]. The rotation and scale differences between matched images for matching can also be estimated by transferring the Fourier spectra to a log-polar plane after applying a high pass filter [
21]. Our previous work [
22] demonstrated that the robustness of PC to illumination change via theoretical proof and experiment results.
Compared to feature-based algorithms, area based matching algorithms are usually dependens on the global grey value distribution and thus are more robust to lack-of texture and multimodal. One disadvantage of correlation-based approaches is that they cannot tolerate complex geometric distortions, because the similarity measurement is based on windows [
23]. Thus, correlation-based approaches are not applicable to direct registration between two images which have large view angle difference, as shown in
Table 1.
For robust image matching, an algorithm needs to be robust to radiometric distortions, such as lack-of texture and multimodal, and robust to large geometric distortions as denoted in the last row of
Table 1. Studies thus far have shown that phase correlation matching can achieve sub-pixel accuracy in estimation of translation, rotation, scale and illumination changes between matched images and it is robust to random noise [
21]. However, how to enhance the robustness of PC to perspective distortions remains unsolved. Effendi and Jarvis [
24] estimated camera ego-motion using phase correlation, however, this method requires a plane, such as table plane, to be discovered in images. Other studies [
25,
26] apply phase correlation using small matching window and then estimated the geometric transformation based on corresponding result from phase correlation matching. These approaches have the similar limitation to most feature-based methods as they are based on local grey value distribution while regardless of overall structural similarity. Moreover, the approach cannot cope with large view angle difference, because if phase correlation is not robust to perspective distortions, the correspondence within small matching window cannot be found by phase correlation. In this paper, we propose a Phase Correlation-based iterative matching approach to solve large geometric distortion problem and achieve sub-pixel matching accuracy in some challenging image matching cases, such as lack of texture, occlusion, motion blur and multi-modal. Particularly, the contributions of this work are summarized as follows:
We extend the phase correlation, which only cope with translation, scale and rotation, to perspective variation by the combination of particle swarm optimization (PSO).
The Dirac delta function in Phase Correlation has been proposed as measure similarity degree for optimization to determine the rotation parameter.
The proposed method can solve different geometric distortions includes affine, perspective, etc.
3. Optimization-Based Phase Correlation
The aim of optimization based registration is to search for the optimized transformation operator
, which obtain the maximum value of similarity function
S through certain optimization approach [
27]:
where
represents the transformation operators.
Optimization algorithms can be divided into two categories: analytical methods and heuristic methods. The analytical optimization approach solves the differential in an objective function. One of the commonly used methods in optimization based on continuous variable is gradient descent (GD), that has been used in solving several image registration problems [
28,
29]. Compared to analytical optimization, heuristic optimization methods are based on Markov random field, and have the advantage of high calculation efficiency [
27]. Thus, it has been used to solve the complex large-scale optimization problems [
28,
29].
This paper proposes a discrete variable optimization approach based on a phase correlation matching algorithm, which is shown in
Figure 2. We firstly decompose geometric transformations into rotations and translations. The rotation parameters are determined by optimization using phase correlation as similarity measure and translation parameters are determined by directly by phase correlation. There are four main steps in the proposed matching algorithm:
- (1)
Determine the transformation type between the target and reference images
- (2)
Calculate the similarity between images in frequency domain using the Dirac delta function in Phase Correlation
- (3)
Find the rotation transformation parameters to reach the optimal similarity value based on Particle Swarm optimization.
- (4)
Calculate the translation parameters using phase correlation
The geometric transformation function will be detailed described in
Section 3.1. The similarity function
S is based on the frequency similarity presenting by phase correlation, which will be described in
Section 3.2, and the optimization approach is based on particle swarm which will be described in
Section 3.3. Translation parameter estimation is describe in details in
Section 3.4.
3.1. Geometric Transformation
3.1.1. Affine Transformation
In an affine transformation, the x and y dimensions can be scaled or sheared independently and there may be a translation, a reflection, and/or a rotation. Parallel lines remain parallel after affine transformation. The affine transformation can be expressed as:
Here, we simplified the affine transformation as an affine rotation matrix
A and a translation matrix
T, as:
In the work of [
30], the affine rotation matrix is determined by four affine parameters:
where
is the zoom parameter,
is the rotation angle of camera around optical axis,
t links to the tilt angle
between optical axis and normal to the image plane by
and
is the longitude angle between optical axis and a fixed vertical plane.
Thus, the aim of image registration containing affine transformation is to search for the best
which obtain the largest value of similarity through iterative optimization:
For two images taken from approximately same distance, the zooming factor can be set as 1 for quick optimization process.
3.1.2. Projective Transformation
Projective transformation enables the plane of the image to tilt, and thus parallel lines are not necessarily parallel and can converge towards a vanishing point. Affine transformation is a subset of perspective transformation. Projective transformation is a more general cases when match two images taken from different view angle, because the vanishing point creates the appearance of depth. The projective transformation can be expressed as a projective rotation matrix
P and a translation matrix
T, as:
Ideally, the projective matrix
P is 3-by-3 matrix where all nine elements can be different, however, optimization for nine parameters will be time-consuming. A simplified projective matrix
P is thus use in this paper by setting two free elements in the last column [
31]:
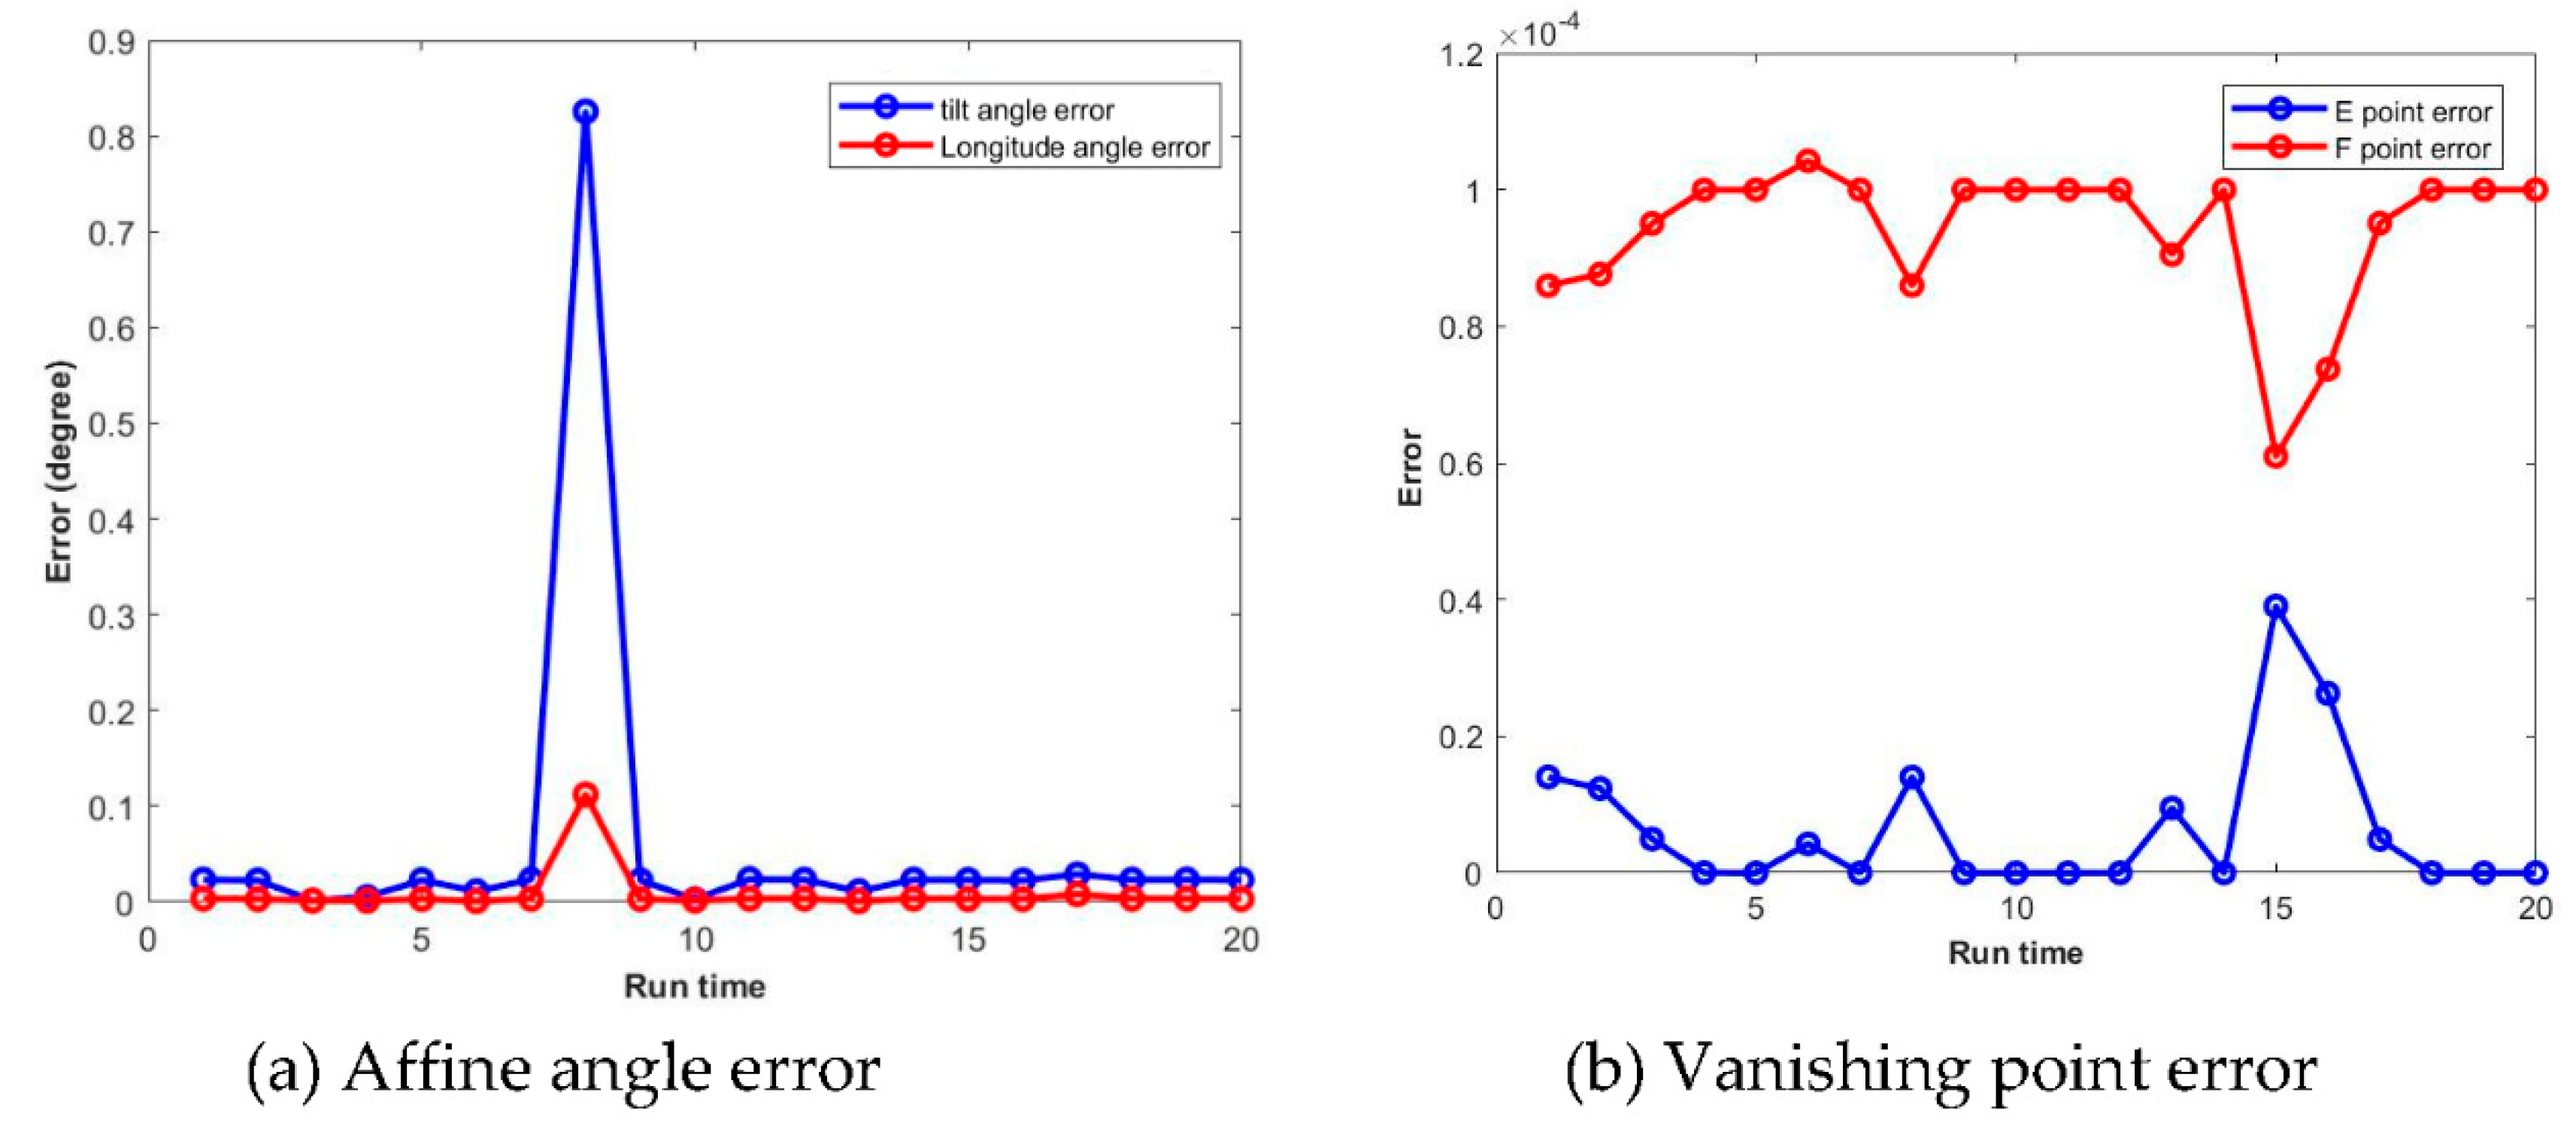
where
E and
F demotes the location of vanishing point in
x and
y direction. If
E and
F are large, the parallel lines appear to converge more quickly which means large perspective distortions.
The aim of optimization can be set as to search for the best
which obtain the largest value of similarity:
3.2. Phase Correlation Based Simiarity Measure
Phase Correlation is an image matching algorithm based on the Fourier shift property, which states that a translation shift between two similar images generates a linear phase difference in the Fourier frequency domain [
6]. In this paper, Phase Correlation has been used in two parts: (i) the similarity measure based on Dirac delta function; (ii) translation matrix estimation, which will be detailed described in
Section 3.4.
Suppose that there is a translation shift
between two identical images
and
:
then, according to the shift properties shift property of the Fourier transform:
where
and
are Fourier transforms of the two images
and
Phase correlation, defined as the phase difference between
and
, can be presented by a cross power spectrum
:
where * stands for complex conjugate.
is a complex 2D matrix which can be presented by fringe, which density and orientation are
and
respectively. The inverse Fourier transform (IFT) of
is a Dirac delta function which its peak value
ranges from 0 to 1:
Obviously, if the two images are perfectly aligned, which means that the signals from two images are strongly correlated, there will be clear interference fringe pattern shown in
as shown in
Figure 1, and the peak value
will have a high value (close to 1). However, if two images contain large geometric distortions, the quality of interference fringes are deteriorated, so the peak value
will have a relatively small value (close to 0). Thus, in this paper, the peak value of Dirac Delta function
is use as similarity measure for the energy function in optimization.
3.3. Particle Swarm Optimization
Particle Swarm Optimization (PSO) [
32], proposed by Kennedy and Eberhart, solves optimization problems by iteratively sampling candidate positions till an optimal measure of quality is achieved. It was intended for simulating social behavior, for example, foraging in a bird flock or fish school. PSO is initialized with a population of candidate solutions, called particles,
. The particles are moved in the search space according to the rate of position change velocity
:
At each time step, the position change velocity is determined towards its local best position
and global best position
according to the equation:
where
is inertial weight,
is the self confidence factor adjust the weight of each particle’s best position when adjusting velocity,
is the swarm confidence factor which adjust weight of the neighborhood’s best position when adjusting velocity,
and
are random numbers between [0,1].
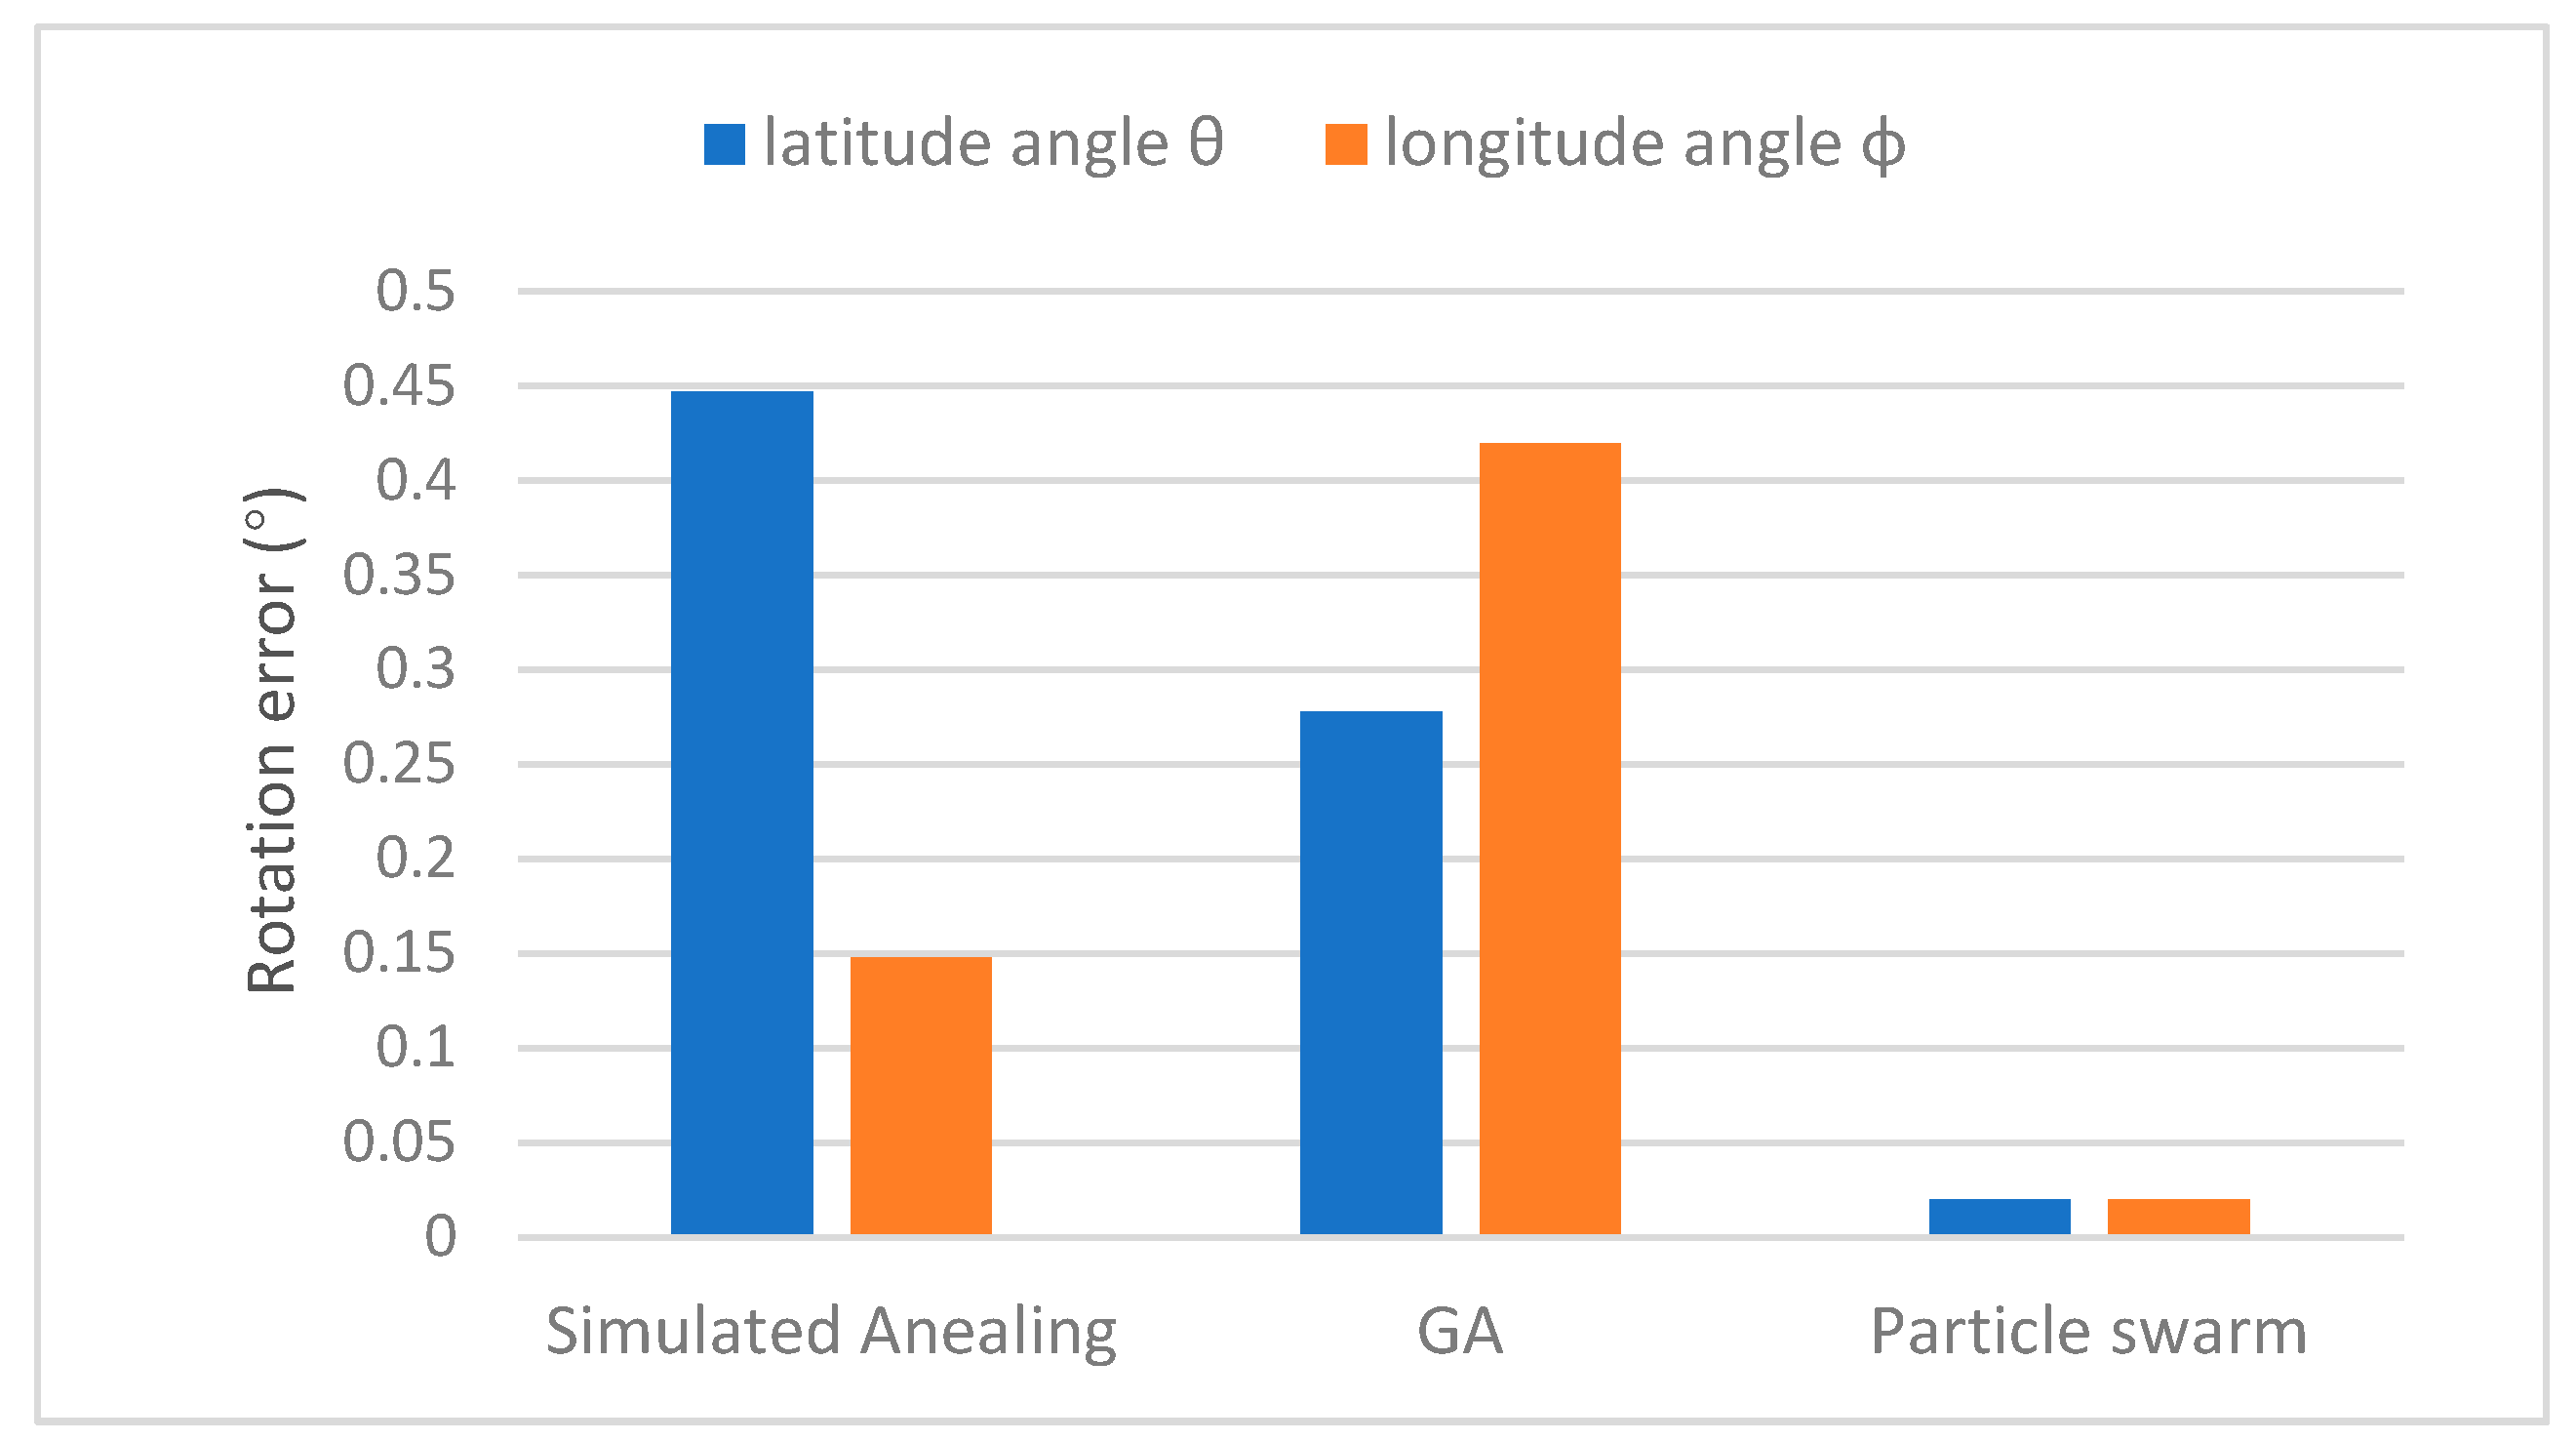
In this paper, the fitness value is set as the Dirac delta peak value , according to the Equation (2). The fitness value is with regards to geometric transformation parameters are energy function needs to be maximized. In affine transformation, the fitness value is , where are parameters from affine transformation and are Dirac delta peak values. Similarity, for projective transformation, the fitness value is , where are parameters from projective transformation. As a heuristic optimization method, particle swarm can avoid the derivation of Dirac delta function, and thus has been applied to solve the geometric parameter optimization problems in this paper. The process of PSO is carried out as follows:
- (1)
Choose a population of particles with random initial positions and velocities
- (2)
The fitness value of each particle is calculated based on given geometric parameters
- (3)
Compare particle’s fitness value to its local best position. If current fitness value is better than local best position , then set local best position equal to current value
- (4)
Compare the fitness value with the neighborhood’s overall previous best. If the current value is larger than global best position , then set global best position equal to current value
- (5)
Update the particle position Xi and velocity according to Equations (13) and (14)
- (6)
Loop to step (2) until the one of the criterions to stop the iteration is met.
3.4. Phase Correlation Based Translation Estimation
After the rotation transformation parameters
has been calculated from the PSO, the rotation between two images can be rectified. In this step, the translation matrix
T will be estimated using Phase Correlation function
by the target image
and the warped image
:
As a non-iterative method, Phase Correlation can directly calculate the image shifts without roaming search. Moreover, phase correlation is able to achieve very high sub-pixel (1/100 sub-pixel) matching accuracies [
33].
The shifts
can be estimated directly in the frequency domain or resolved in the spatial domain via IFT. The integer translation shift between two images can be estimated by the peak location of Dirac delta function
that is the IFT of the cross power spectrum:
Sub-pixel location can be determined by fitting a Gaussian function to the points which close to the peak of Dirac delta function
[
33]. The shift can also be resolved directly in the frequency domain with sub-pixel accuracy [
17,
18,
19,
20]. The cross power spectrum
, which is a rank one matrix, and can be decomposed as the product of two dominant singular vectors
and
:
The sub-pixel displacement can then be estimated directly in the frequency domain using either Singular Value Decomposition (SVD) and then Least Square Fitting (LSF) [
17], or 2D fitting technique with Quick Maximum Density Power Estimator (QMDPE) [
19,
34]. The frequency-based PC sub-pixel estimation method is able to achieve higher matching accuracy than spatial-domain based PC method, and thus, in this paper, SVD-PC is used to estimate the translation matrix
.
5. Conclusions
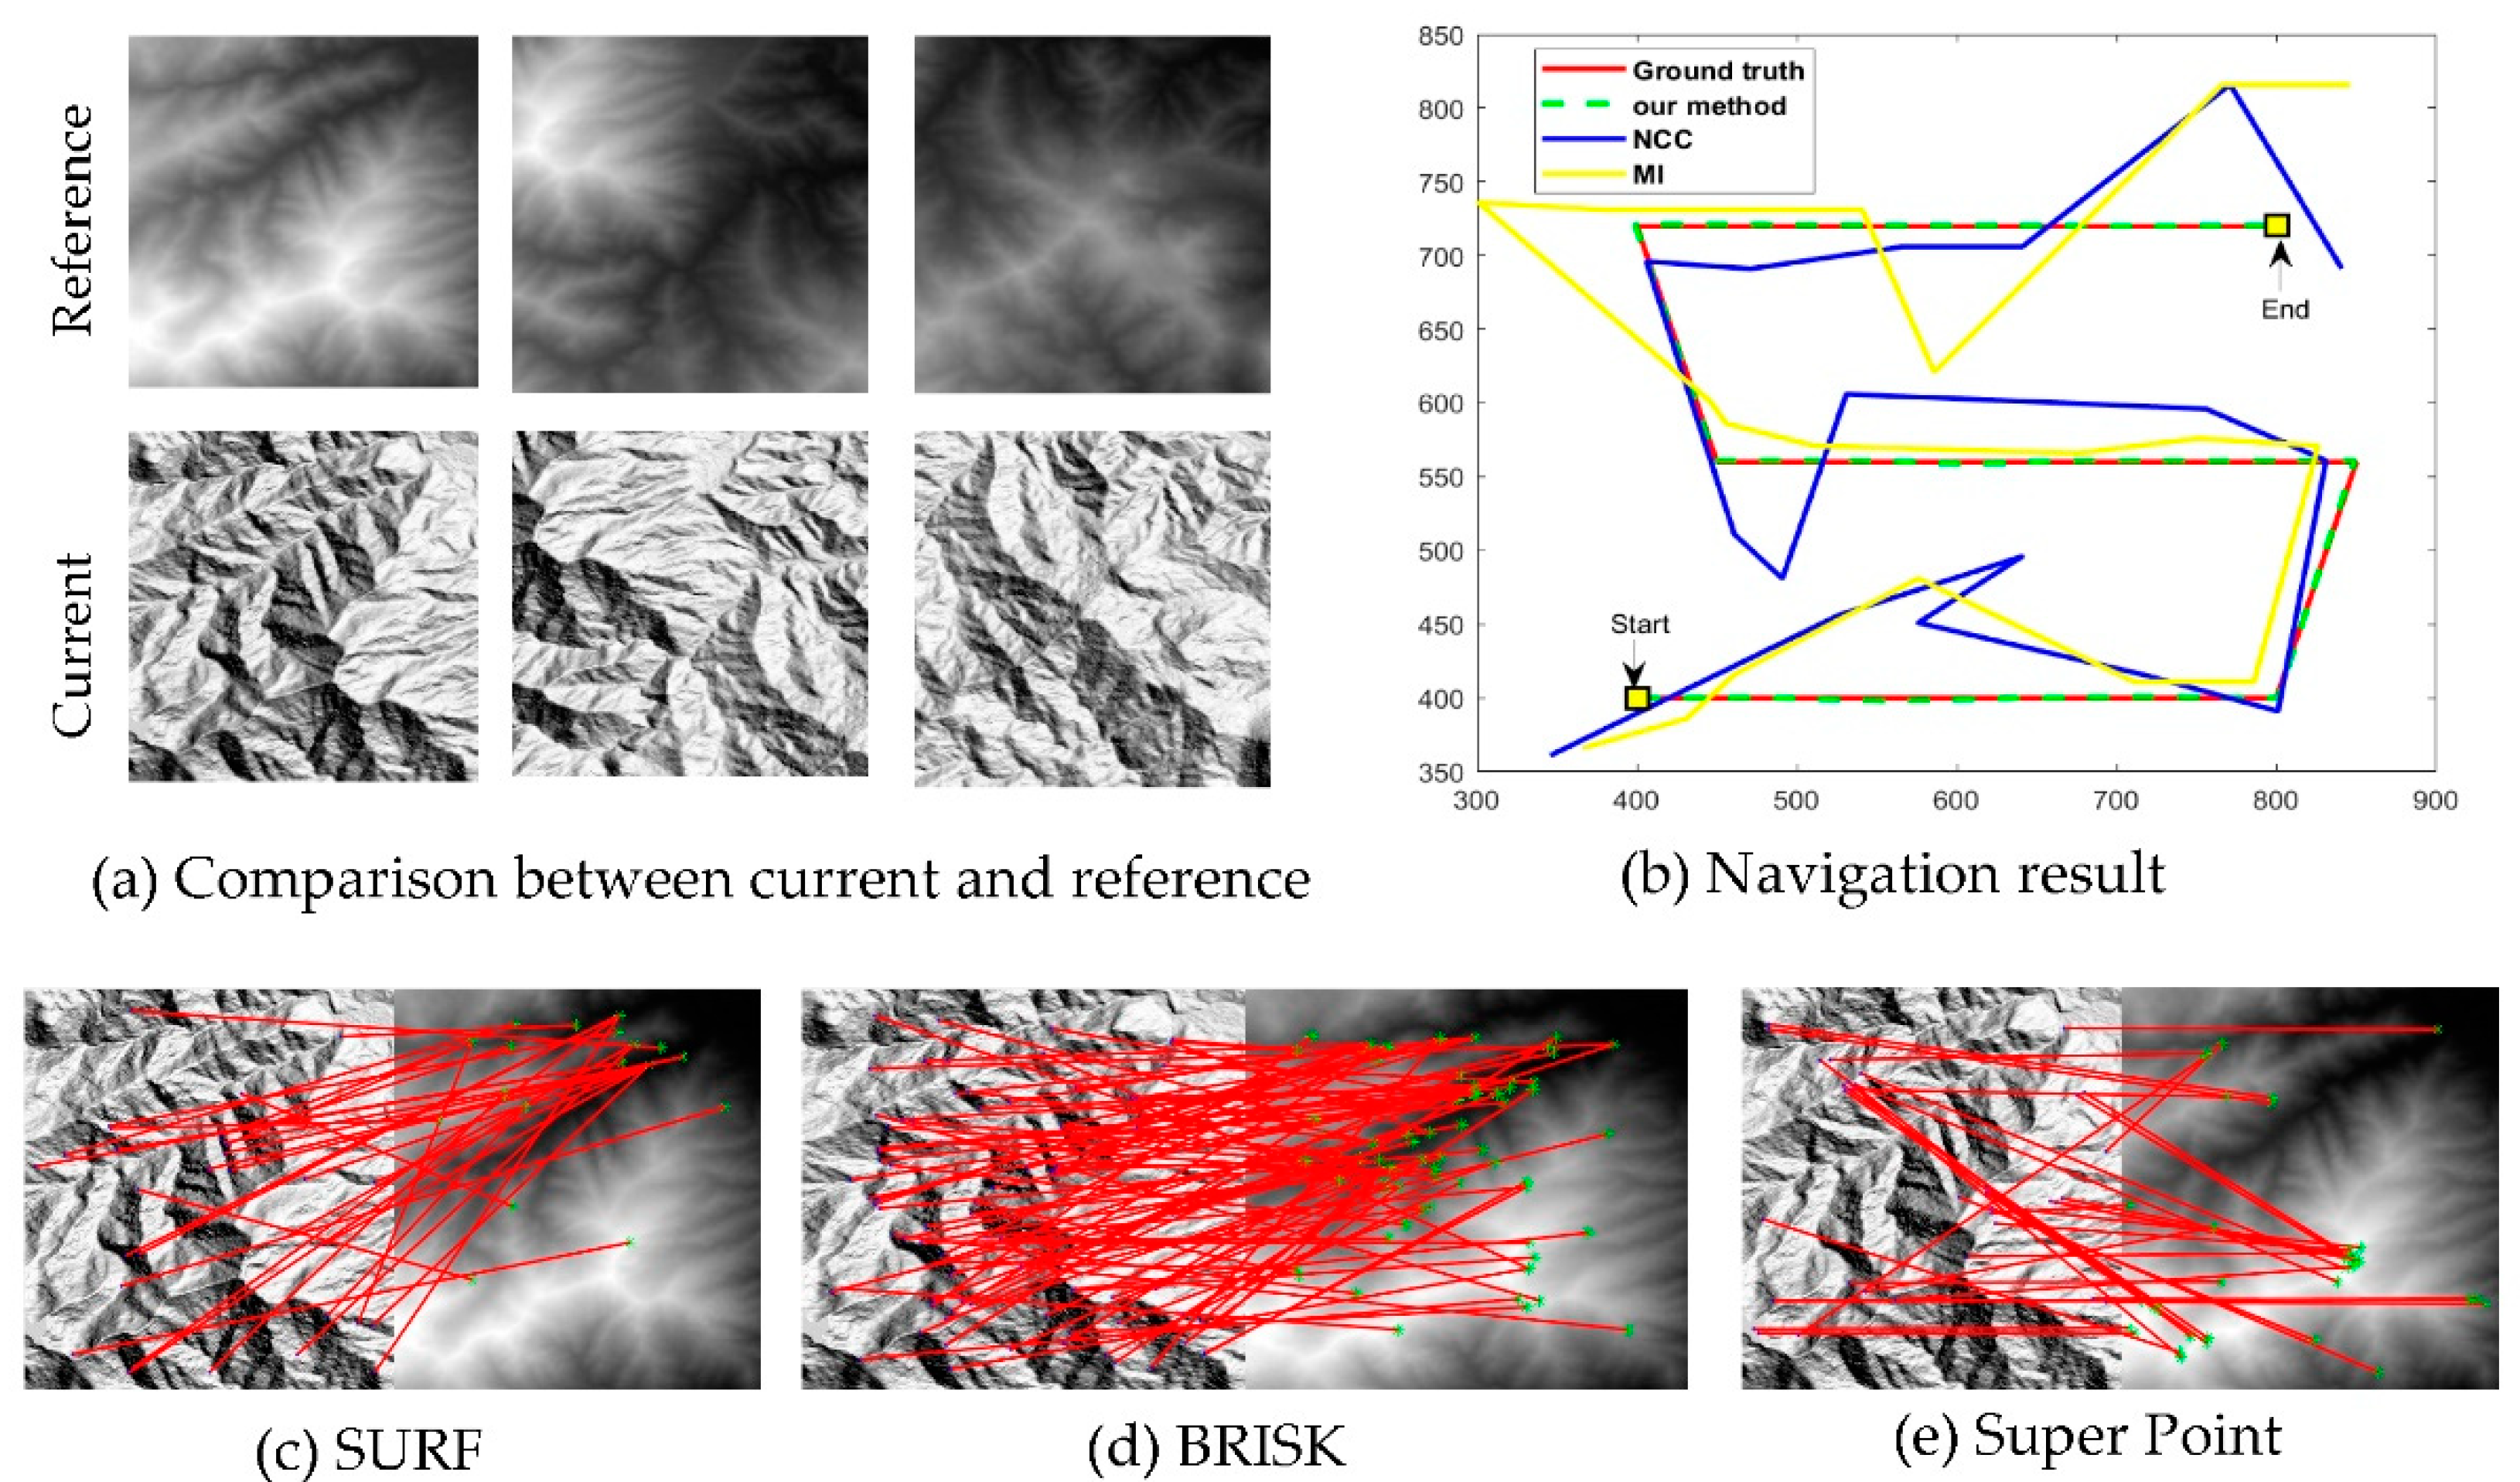
In this paper, we extended phase correlation image matching from Euclidean transformation to perspective and affine geometric transformation by combining with the particle swarm optimization method. The qualities of fringes in the phase correlation cross power spectrum are used as similarity measures, and the aim of optimization can be set as to search for the best transformation parameters which obtain the largest value of similarity. Image registration experiments demonstrated that compared to state-of-the-art image registration methods, only the proposed method can cope with all challenges, including illumination, lack-of texture, motion blur and occlusion and different geometric distortions and reach the image registration accuracies within 1 pixel. Further, image-based navigation experiments are carried out demonstrated that the proposed method is able to correctly recover the trajectory of camera using multimodal target and reference images.
In this paper, the transformation matrix is set as affine and perspective, but it could be easily further applied to other distortions, such as polynomial transformations, which are widely used in satellite image registration. Future work will be focused on the combination of reference-based navigation and visual odometry to ensure the speed and accuracy of the navigation.


