1. Introduction
Recently, UAVs, which are also known as drones, have received interest from different scholars. UAVs may be used in different situations, such as for security issues, disasters, and remote areas as well as on sport fields [
1,
2]. Nowadays, the growth and advancement of wireless mobile communication technology has a great influence on citizens’ day-to-day activities. This leads mobile users to demand more bandwidth and have greater interest in wireless communication at any time and place. Of course, to satisfy the interest of mobile users, concerned organizations have attempted to expand the coverage of long term evolution (LTE) and access points (APs) based on wireless fidelity (Wi-Fi) connections. However, their large consumption and the fixed location do not solve the problem well for remote areas [
3,
4,
5]. Thus, the use of UAVs as aerial base stations (BSs) as a communication platform is important for the assistance of territorial networks. This is a vital area of enhancement for contemporary technology as a key stage for fifth-generation (5G) networks and has been a main focus of researchers and service providers [
6,
7]. For instance, UAVs are deployed for basic wireless data collection issues for remote areas and emergency situations as well as to enhance the capacity of the wireless communication network in terrestrial hotspots [
8,
9,
10,
11,
12]. In addition, UAVs can be utilized as aerial communication BSs for ground users to deliver air-to-ground (A2G) access link services. APs in the sky are also used for information dissemination and data collection from the ground (e.g., sensors and actuators in Internet-of-Things (IoT) networks) [
12,
13]. Indeed, the use of UAVs as aerial BSs provides several advantages compared with terrestrial BSs. Due to the higher altitude and distance coverage capability, aerial BSs have a higher chance of having line-of-sight (LoS) to ground users. In addition, UAVs can have easy movement and flexible deployment, and they use antennas for further capacity enhancement. Hence, they can provide a rapid on-demand service [
5].
The main modifications of conventional terrestrial wireless communications and UAV-assisted network services can be compared. First, UAV-assisted aerial communication platforms can be quickly deployed based on user data access request/demand, and they have a cost minimization benefit as well as being preferable for emergency scenarios. However, terrestrial wireless infrastructures are highly vulnerable to natural disasters, because their deployment is from a fixed location. Second, the A2G access link between UAVs with ground users has much stronger LoS links than conventional ground-to-ground (G2G) links [
12]. As a result, the UAV-assisted aerial BSs are expected to provide better wireless coverage and higher user throughput capacity than ground BSs. Additionally, due to the fully controllable mobility of three-dimensional (3D) space, UAVs can adaptively change their locations over time to reduce the height and distance relative to the ground users; this leads to further improvement of other wireless network performances [
9]. Third, the signal distribution and delivery based on UAVs cannot be largely affected by channel impairments, such as shadowing and fading [
10]. Fourth, UAVs can be deployed more flexibly and moved more freely in the 3D space. Therefore, these identical characteristics yield both opportunities and challenges in designing UAV-enabled wireless communications, which cannot be reachable with conventional terrestrial systems or immovable BSs [
14]. Nevertheless, there is also an open challenge that needs to be solved for UAV-enabled communications, such as [
15] UAV positioning of communications for resource saving and user throughput maximization.
The study in [
16] was motivated by the issue of A2G access links between UAVs and ground user connections. The UAV-assisted aerial communication stages would be performed through random distribution and fully mobile communication. In the case of random distribution of UAV communication, previous works [
16,
17,
18,
19,
20,
21,
22] considered the optimization of deployment locations to enhance network performance. For instance, considered the two-dimensional (2D)/3D placement of UAVs to increase the network coverage (i.e., to serve users by UAVs based on the quality-of-service (QoS) requirement) and minimize the number of UAVs required to maintain wireless coverage [
23,
24]. The author in [
19] optimized the flying altitude of UAVs to maximize user throughput for multiuser communications with the consideration of adjustable directional antennas with UAVs. Furthermore, analyzed the average performance of random communication of UAV-enabled networks through the implementation of stochastic geometry theory [
16,
17]. For the fully mobile communication of UAVs, existing works, such as [
25,
26,
27], proposed the control of a dynamic location within a specified period of time for the enhancement of user communication rates. These studies assumed that the UAV-enabled mobile communication could adapt to and control the tasks of trajectory systems through wireless resource allocation for the purpose of maximizing the end-to-end communication between the transmitter (Tx) and receiver (Rx). In [
28,
29], the movability of UAVs was used to enhance the network connectivity and a field experiment was conducted with UAV-assisted communication in which the user throughput maximization problem was studied by optimizing the source of power allocations with consideration of time [
30,
31].
To the best of our knowledge, these issues are still open problems that have not been deeply investigated yet. The MLP-LSTM based approach is the first system that jointly structures or models user data and UAV-based OFDM signals in the real environment. Note that related work was conducted in [
21], where the multi-hop wireless backhauls were used to communicate between ground BSs and the main network, and the group of UAVs was designed to maximize the usefulness of the backhaul network being optimized. To fill such research gaps, we consider three UAVs connected through wireless multi-hop backhauls with the core network. Under this layout, we set an objective to obtain the positioning of UAVs to achieve user throughput performance maximization. Different from previous works, our study focuses on both A2G and air-to-air (A2A) access links as well as applying deep learning (DL) approaches for system design and prediction. In addition, we use the real environment for data collection and reduce the dataset dimensionality based on linear discriminant analysis (LDA) approaches. The integration of LDA and long short term memory (LSTM)-multi-layer perceptron (MLP) reduces the size of large datasets and generates a more accurate positioning system. It also improves computational times by reducing space usage from the complex into simpler features [
32]. This motivated us to explore the problem based on DL approaches, because it is an efficient approach with the smallest number of training and testing errors. Thus, it is a better way to assess a large number of datasets as well as measure the accuracy of larger data collection environments than traditional machine learning (ML) approaches.
As compared to traditional ML approaches, DL approaches improve the accuracy of regression and classification tasks in different fields, such as image recognition, signal processing, and speech recognition [
33]. In addition, they allow features to be extracted automatically from a given dataset and outperform ML techniques, especially if the dataset size is large and applied for compound issues [
32]. Therefore, the results show that the proposed algorithms for UAV positioning and user throughput maximization can easily enhance the network performance for each location of users. Regarding the reliability of the distribution of orthogonal frequency-division multiplexing (OFDM) signal for a large number of users, it reduces the time complexity and improves the signal transmission to ground users. We propose an iterative weighted interpolation positioning (IWIP) method for measuring the distance between ground users and the UAV location scheme based on OFDM signal transmission for the A2G access link. This method can be applied for the purpose of multi-user localization. It performs effectively, generates high positioning accuracy [
32], and it contains both the merits and demerits of centralized and decentralized positioning systems.
LSTM Learning Architecture for Our System
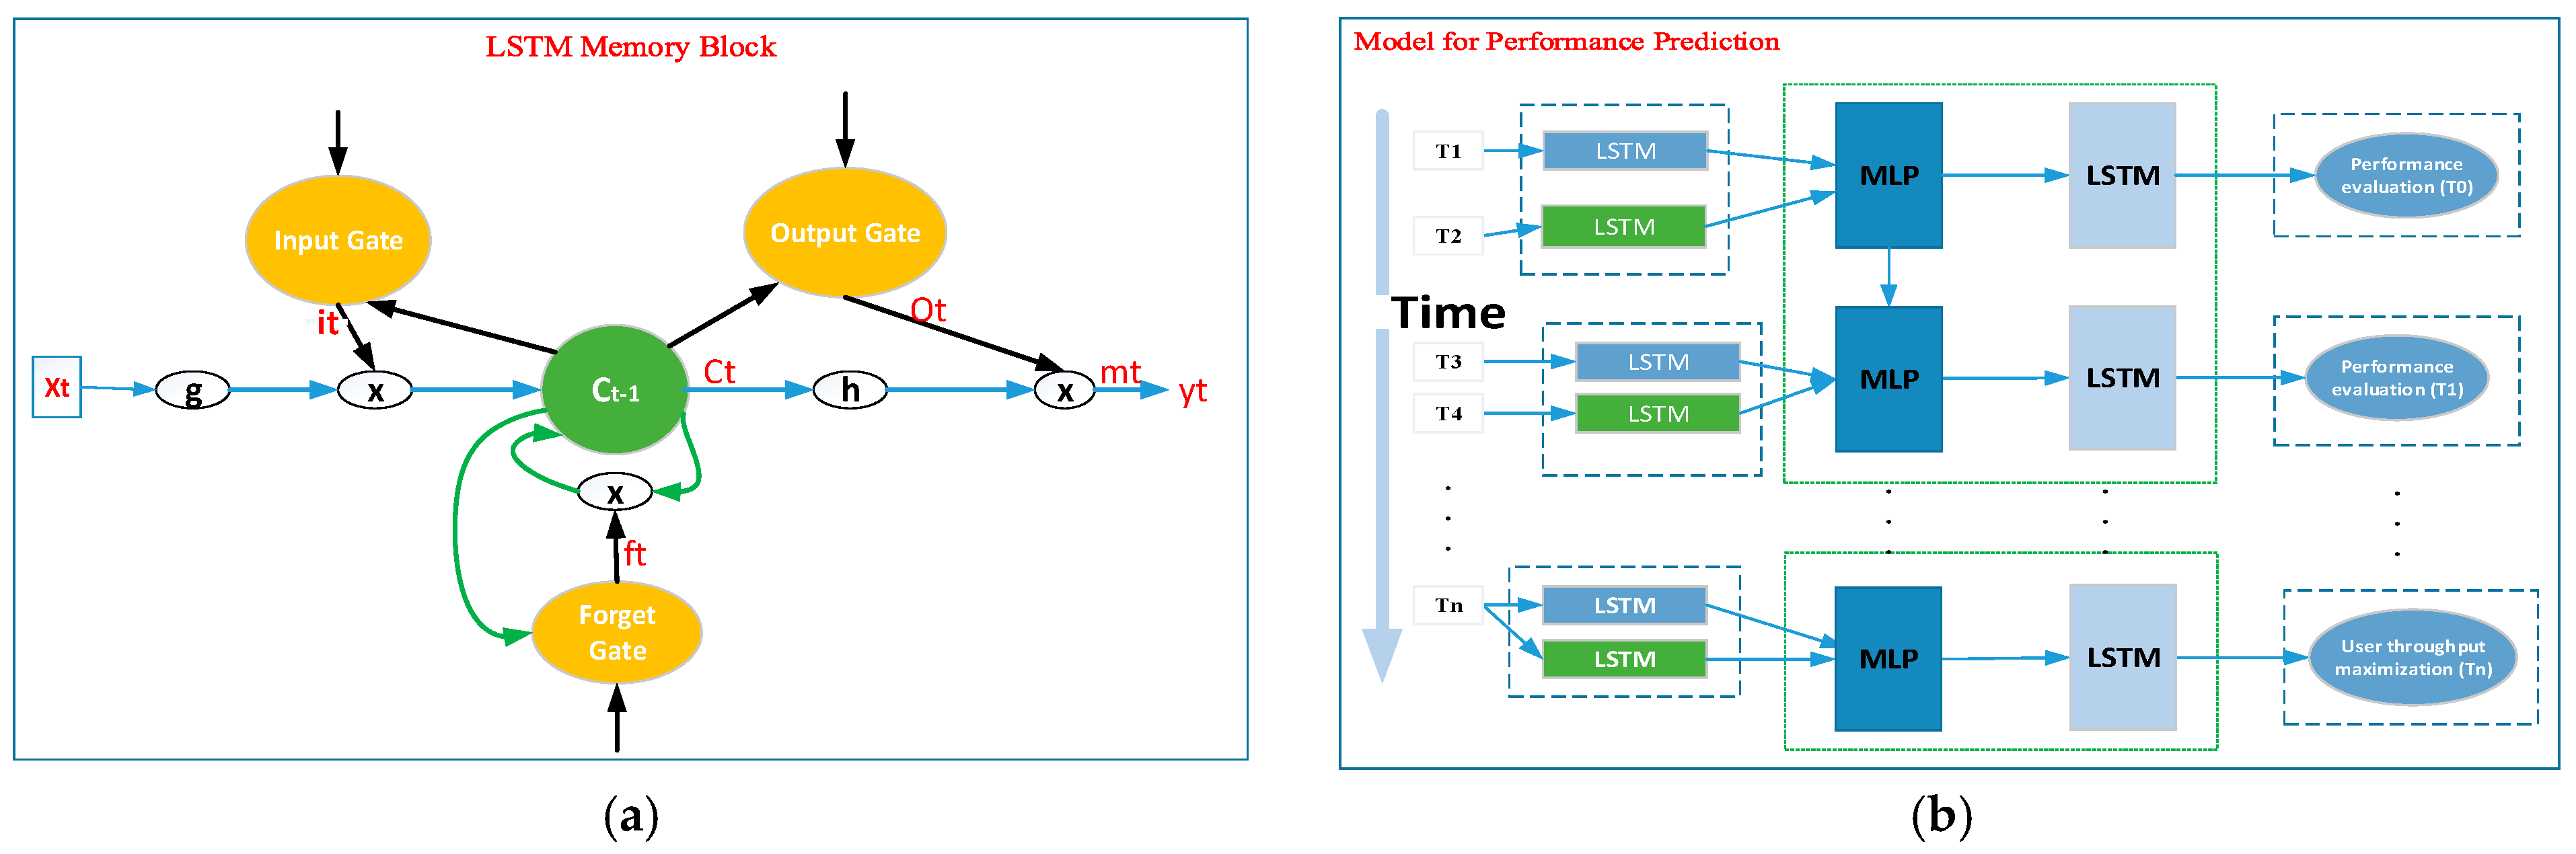
According to [
33], the LSTM, or memory network, is composed of memory blocks. The memory cells contain self-connections for storing and remembering. The temporal state of the network and gates control the flow of information, and an input gate controls the flow of input activity into the memory cell. An output gate controls the output flow of cell activity into the rest of the network and a forget gate to be forgotten from the previous cell state. Based on these special structures, the LSTM approach has the capacity to learn and forecast dynamic systems [
34,
35], and to learn long-term dependencies, which cannot be done using other ML or DL approaches. Based on these advantages, we are interested in applying LSTM as the main algorithm for training, model construction, and predictions of our proposed methods to the analysis and maximization of throughput of UAV-based aerial networks. Different scholars have proposed ML approaches, such as the artificial neural network (ANN) and K-nearest neural network (KNN), but they have shown poor learning capacity [
32], compared with the LSTM algorithm. This poor learning capacity does not enable a system, which can adopt a real and dynamic environment, to be created. Therefore, to improve the learning performance, we propose the use of the MLP-LSTM hybrid, and we compare it to other algorithms. As the advanced version of the recurrent neural network (RNN) [
33], LSTM has been demonstrated to be an efficient approach for modeling sequential data, like text [
34]. In order to improve the performance of user throughput based on UAV positioning, we collected a large number of real datasets. As shown in
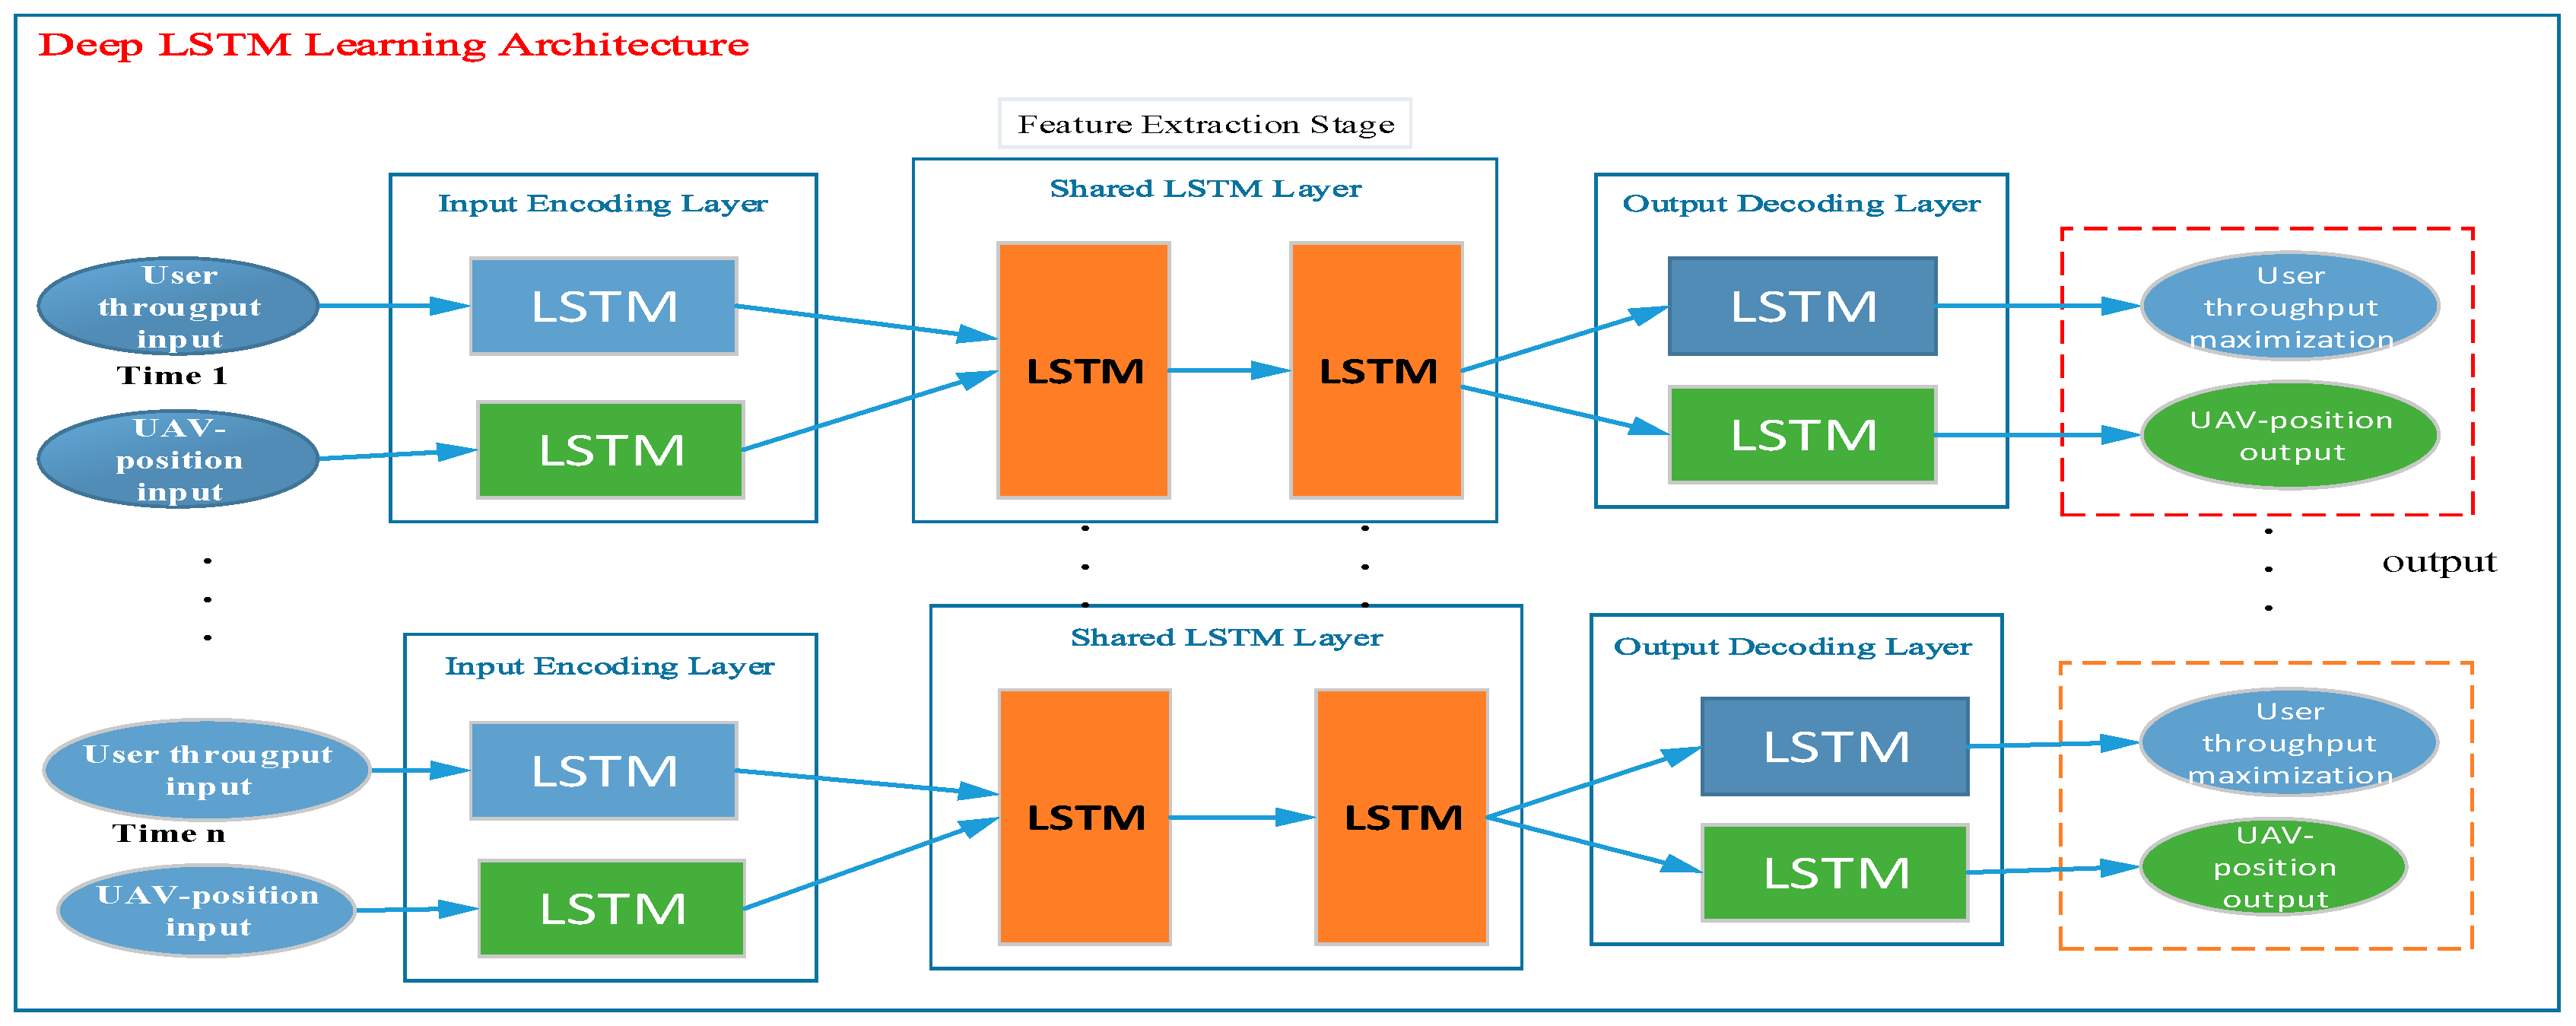
Figure 1, we structured the general layout of the LSTM algorithm for applying prediction tasks to our system design. The deep LSTM learning architecture contains time variance (the user throughput value and the location of UAV) as the input layer, a shared LSTM layer (feature extraction stage), and user throughput maximization, which is delivered through the output layer.
In this study, we built a DL-based system for prediction and regression tasks of the UAV-based communication network to maximize user throughput (as shown in
Figure 1). The learning components of our system were designed through the LSTM learning architecture that contains the following components: (1) A time series (which contains the user throughput and UAV positioning dataset values), (2) an encoding layer which is applied for the input of encoding layer sequences, (3) the hidden layer or shared layer part (mostly performs feature extraction tasks), and (4) a decoding layer that allows the output sequences to generate the final results for user throughput maximization and UAV positioning. The proposed learning architecture is able to jointly learn the user data from the grid points and UAV altitudes as well as determine the distance from the data source and permits to learn the input sequences with different time scales. Regardless of the locations, the number of users, time periods, distance of users and UAVs, and the impact of LoS/non-line-of-sight (NLoS) characteristics, the proposed LSTM learning architecture can automatically learn and predict a large number of user locations and their A2G access links with the UAV location.
The main contribution of our work is the estimation of the UAV position in order to maximize the A2G link access coverage performance with the use of a minimum transmitting power and the maximization of user throughput. This led us to apply the method to different environment types, such as sub-urban, urban, and rural areas, because the future 5G network will contain a heterogeneous wireless network and highly loaded user interest to get a highly accessible bandwidth in wireless networks. With this consideration, we collected our datasets from the real environment, which has urban and sub-urban environment characteristics. We selected a real data collection area with ground mobile users and UAVs that use non-directional antennas. To perform and design the proposed system, we proposed DL approaches (i.e., MLP and LSTM) to train and predict the improvement of user throughput based on the efficient estimation of UAV positioning. First, we derived the A2G link access coverage probability considering the UAV altitude, Los/NLoS, elevation angle, received signal strength (RSS), signal-noise-ratio(SNR), and user-to-user distances. Next, we applied a K-means algorithm to cluster the data collection environment into three classes based on their signal variation and LoS/NLoS (as classes 1, 2, and 3). Our results show that considering the size of the desired area, the number of available UAVs, the distance between the UAV to the users, and the altitude or location of the UAVs have great impacts on the maximization of user throughput, a benefit that is shared by all users. Generally, after analyzing the above facts and related works, our contributions can be summarized as follows:
- (1)
DL (i.e., MLP and LSTM) approaches are proposed to better predict the positions of UAVs and for user throughput maximization. The optimal positioning of UAVs was evaluated based on the A2G access link, the power usage, and the data flows.
- (2)
We proposed a K-means algorithm for the classification of our data collection environment into classes based on their signal strengths, and we used LDA for dataset dimensionality reduction and iterative weighted interpolation positioning (IWIP) for computing each user’s distance. Furthermore, to maximize user throughput, we considered the positioning of a UAV based on the data rate request and positions of its connected users.
- (3)
Finally, our work introduces a simple and computationally efficient method for keeping several mobile users within the transmission range of the UAVs in the dynamic environment while determining a UAV position that maximizes throughput; previous researches did not pay much attention to these factors. The rest of the paper is structured as follows.
Section 2, contains related works,
Section 3, discusses data collection and the proposed system.
Section 4, reports the experimental results and discussions. The last section summarizes the major conclusions and references.
2. Related Works
Currently, UAVs have been adopted in several sectors, such as weather monitoring and traffic control [
35], and the application of UAVs in wireless communication systems has been given excessive consideration [
2,
3,
4,
5,
6,
7,
8,
9,
10,
11]. In contrast, conventional networks are deployed in a fixed manner, APs are immovable from their given locations, but deployed UAV-assisted wireless networks are flexible and advantageous in terms of cost. In [
35], the concept of user throughput maximization issues was introduced for the purpose of optimizing time resource allocation through wireless-powered communication networks (WPCNs). The authors of [
36] used an algorithm to improve the minimum user throughput performance based on several antennas and time allocation algorithms, and an analysis of user throughput maximization with a full-duplex hybrid access point (HAP) was conducted [
37]. The studies described in [
38,
39] analyzed the application of software-defined network (SDN) issues for the aerial communication network (consisting of airplanes, balloons, and airships) for user-to-user communication with a focus on backhaul connectivity. The implementation of the architecture in a software-defined UAV network that uses multiple radio technologies was proposed. The study stated that UAVs are used in different organizations and for academic issues for the purpose of increasing wireless network performance for mobile users [
39].
The authors in [
40] focused on the improvement of dense network capacity performance and proposed a caching-based mechanism using UAVs to use together with other BSs. Mainly, the study considered the storage of content and the delivery to users following increased demand. The main concern was that the positioning of UAVs would affect network performance metrics, such as throughput, coverage, and connectivity. The objective was to address the mismatch between the wireless communication capacity and the network traffic caused by user requests by focusing on multiple UAV-assisted networks to improve the performance by using terrestrial heterogeneous networks [
41]. The study was planned to evaluate and analyze the positioning of UAV-BSs to improve user coverage and throughput. The study described in [
42] used a methodology to optimize the trajectory of a UAV to offload traffic at the edge regions of three adjacent BSs. The proposed iterative algorithm alternatively optimizes user scheduling. The study described in [
43] focused on the wireless network system using a UAV-assisted network or BSs as an access link between ground users. The study proposed an algorithm for network performance optimization of A2G with consideration of the location angle of the UAV. In [
44], a proposed gradient-based chaining controller algorithm was applied as the mobility control algorithm to achieve optimal positioning of multiple UAV communication. The purpose of this method was to estimate the performance of near-to-near UAV communication links. The studies described in [
45] carried out 3D positioning of UAV-BSs for future 5G wireless networks. These studies were initiated to maximize user coverage and network performance [
46]. In the study described in [
35], an approximation algorithm was proposed for positioning UAVs to maximize user throughput. The approximation algorithm was applied to compute the position of each UAV to the overall system user throughput; this maximized the data rate demand and path of each flow. The paper contributed to the formulation of the UAV positioning problem for the optimization of user throughput based on traffic demand. The SDN controller, which maintains the traffic demand information for all links and flows, has been used to predict the current UAV positions and associated users [
3]. However, the previous literature has rarely studied the capacity of UAV support for data collection networks. As
Table 1 shows, we compared some previous works with our study based on their objectives, methodologies, and algorithms used, as well as their results.
Thus, we focused on the evaluation of different performance measures that are suitable to quickly [
30] predict class and grid-based UAV positioning through a large number of real datasets. In this study, we focused on class and grid-based data collection with several mobile users and different numbers of UAVs. We based this work on unique features from other previous works, such as using a real data collection environment rather than simulations and applying ML-DL approaches, which are preferable for real and complex environments. DL approaches have the advantage of representing and extracting the most representative features from multi-sourced datasets.
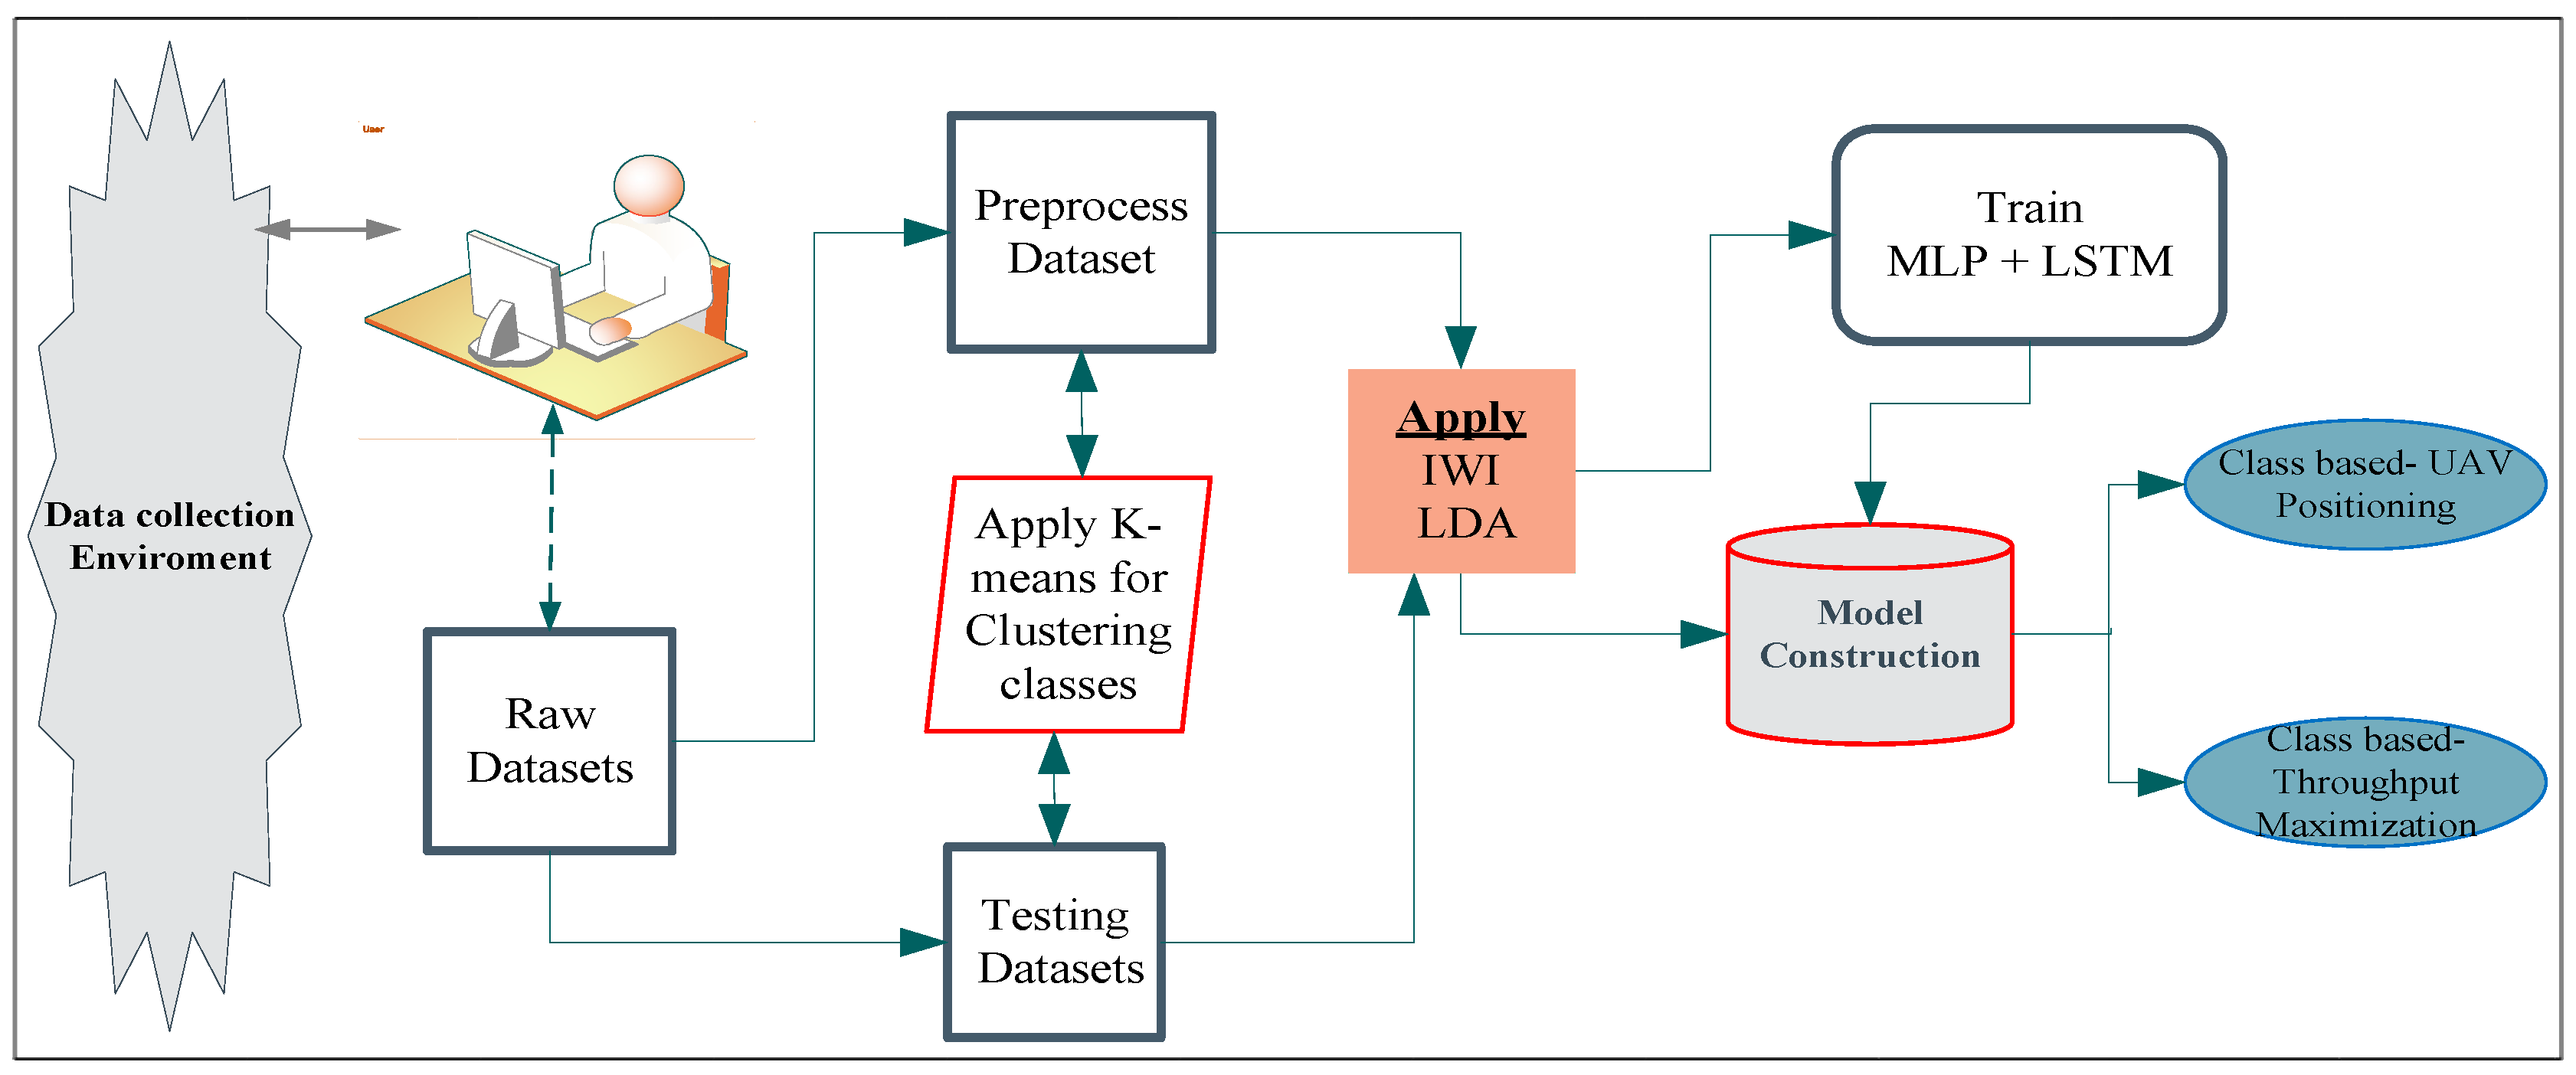
4. Proposed System Description
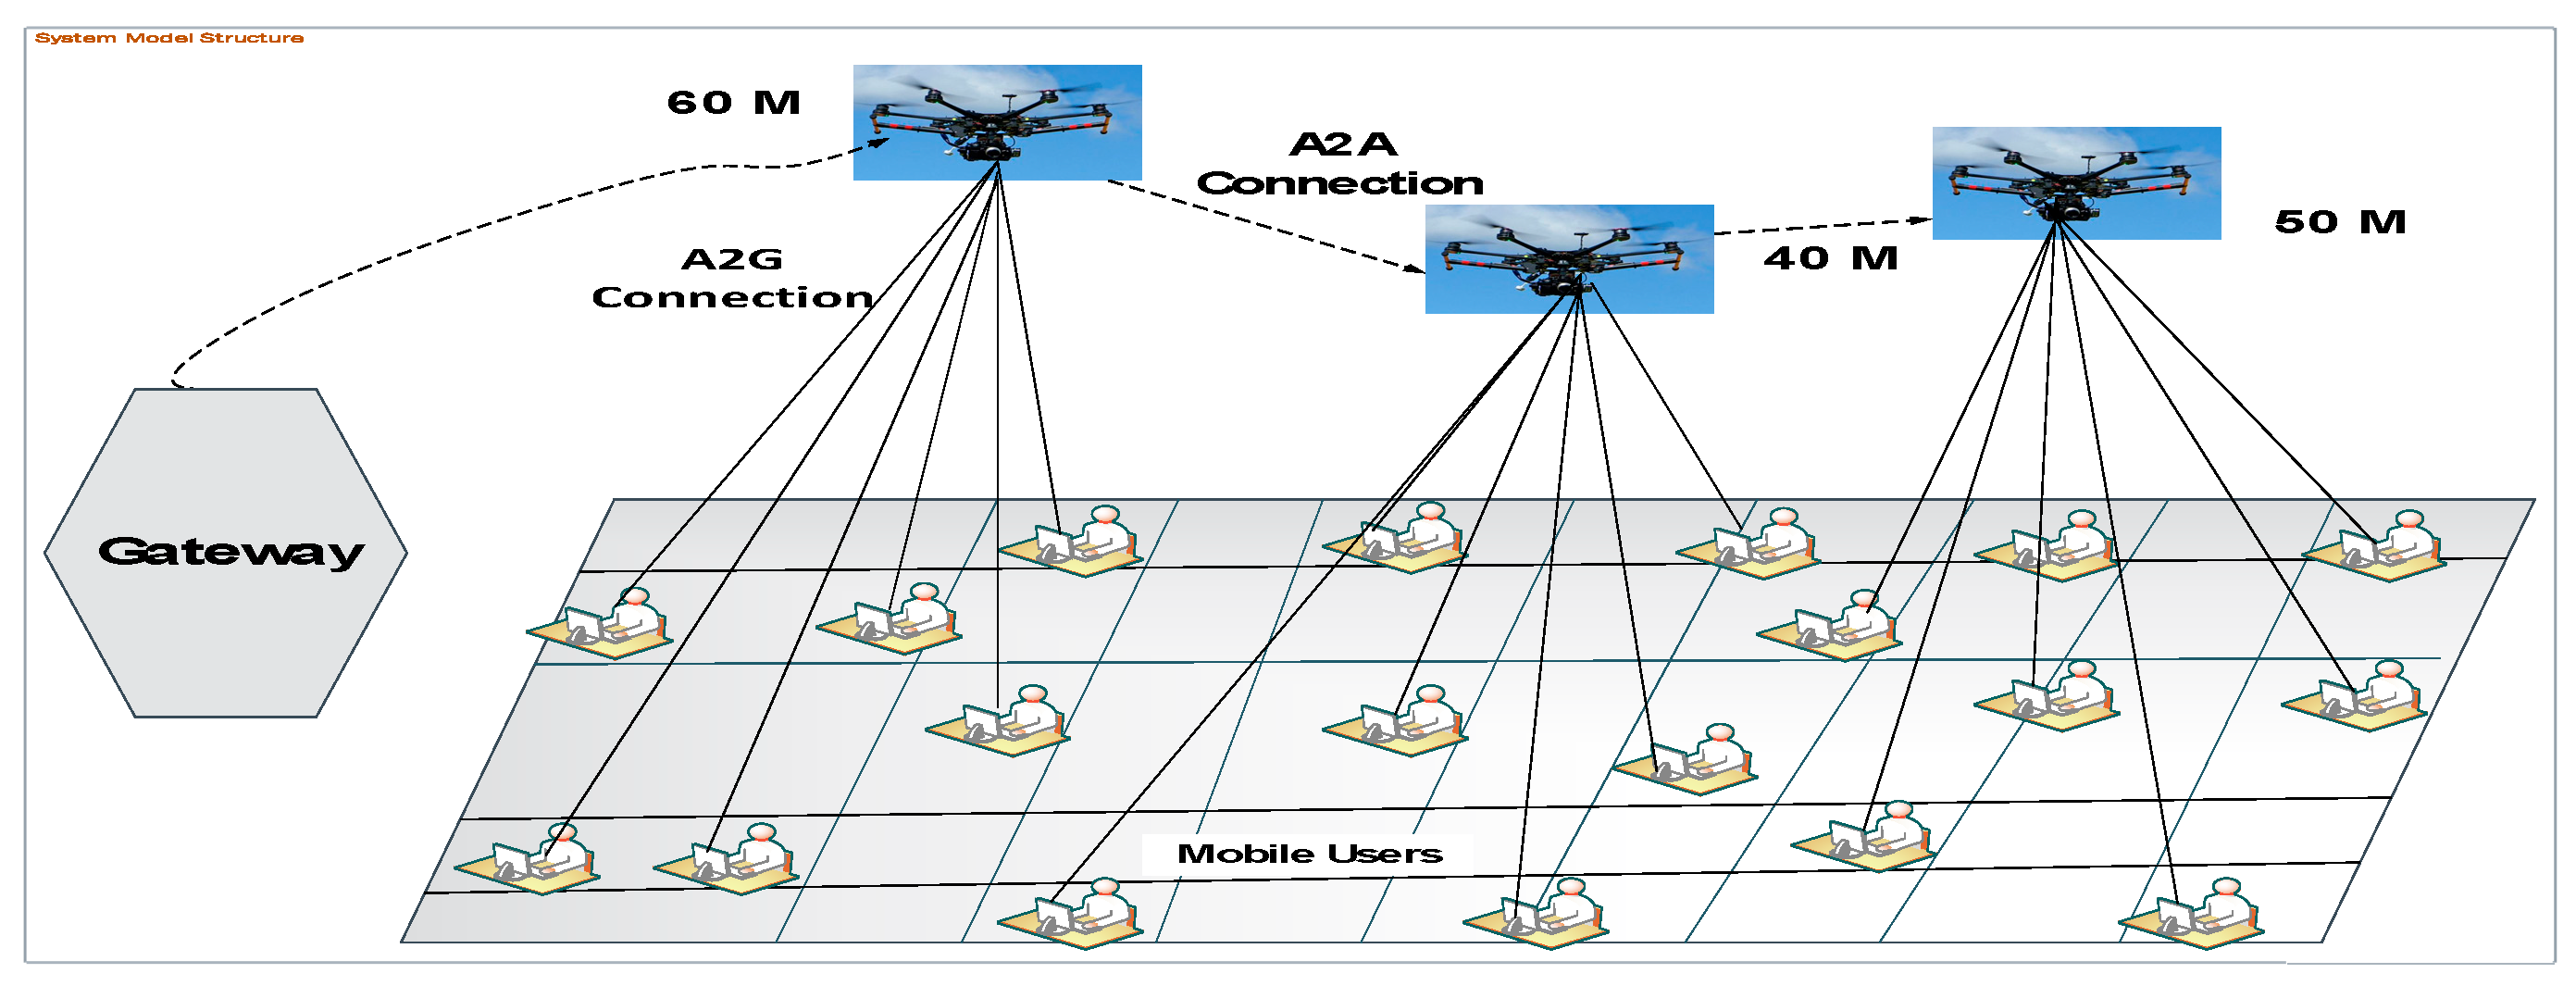
Figure 6 is a detailed diagram of our proposed system. The proposed system architecture contained a data collection environment (which is classified with grid points). After the identification of our data collection areas and grid points, the mobile user gathered their required OFDM signals, which contained parameters, such as the index number, RSS, received power strength, and SNR. Then, the data preprocessing task was conducted. After the dataset had been cleaned and arranged with an appropriate format (i.e., Excel or CSV), the training phase was performed. Initially, users were randomly distributed on the ground and received OFDM signals from the three UAVs located on the tops of the three buildings. The data collection environment contained the real characteristics of trees, buildings, and flow of users. Users were located at zero altitude, and the collected dataset was delivered to the next phases of preprocessing and online dataset for the training and testing tasks. After the required dataset had been collected, preprocessing was conducted to avoid unwanted and misfiled datasets. To preprocess the dataset, we focused on important values or parameters, such as the RSS, distance, throughput and elevation angle, and the grid number for user locations. To perform these phases, an interpolation method was used to calculate or approximate user-to-user distances. Iterative weighted interpolation (IWI) methods and LDA were used for the execution of dimensionality reduction, because this enabled the structure and size of the raw datasets to be reduced to improve the time and space complexity.
In the training phase, the training (offline) datasets were used based on the inserted parameters and their values. Simultaneously with the preprocessing phase, the K-means algorithm is useful for clustering to obtain the groups of objects that have common characteristics in large datasets based on the dividing technique formed on the centroid. The K-means algorithm produces better results for clustering than other algorithms [
33]. Consequently, in our system, the K-means algorithm was used for the automatic clustering of classes from the data collection environment through their signal similarities and power value estimations. We also used the geographical layout, the location of the environment, and the signal strength differences to classify data into three classes. To construct the appropriate model, we attentively trained the MLP and LSTM for classification and regression tasks to achieve user throughput maximization and evaluation on the classes and grid point.
In terms of testing phases, the online dataset also contributes to the model construction phase. So, the model was constructed through a combination of training and testing phases. As depicted in the figure, based on the constructed model, the final expected outcome of our work was to estimate, predict, and analyze the values of user throughput separately as common user throughput maximization values and to use them for UAV positioning based on the better-identified user locations. After the design of our proposed system, the following sections describe scenarios’ where UAV positioning can be applied for user throughput maximization, such as original datasets, reduced features, and the estimated values of user throughput at each grid point, and the reduced feature datasets collected on different days and grid points achieved maximum throughput.
The proposed algorithms were implemented through the Python 3.7 programming tool, which is a powerful multi-purpose programming language with a TensorFlow framework in conjunction with multiple python packages and libraries, like keras and sklearn [
47], because of their advanced and helper functions that make it much easier and faster to write DL algorithms, due to the familiarity of the researchers with the tool. The simulation was run on a PC with Intel Core i7-4790 3.60 GHz CPU and 20.0 GB RAM.
Case 1: Ensuring all Associated Users Remain Inside the Transmission Range
If the exact UAV position estimated by the DL approaches is inside the working areas, then it is guaranteed that all users will be within the transmission range of the UAV. However, if it (the wanted user location) is outside the coverage of UAVs, then some users might be outside the transmission range. After collecting the required datasets, we applied the data cleaning technique [
32] to control unfilled and out of range datasets, as indicated in Equation (2). This technique helps to remove abnormal data, which causes the machine to learn wrongly. Hence, this technique helps to ensure that the proposed approach easily learns from the collected datasets. Therefore, we used
D to represent the outside range of the datasets, where
is given as:
where (
,
, …,
) represent the RSS of mobile users, and AvgRSS is the average of the total users’ RSS values.
For simplicity, we applied a clustering approach based on the K-means algorithm to generate classes easily. The PL model of LoS and NLoS, as shown in Equation (3), was used, where
d is the distance between the UAV and the user,
α is the path loss exponent,
β is the average channel gain at a reference point,
f is the carrier frequency,
models the shadowing effect, which is a Gaussian random variable,
N(0,
), in the states as
S = LoS or
S = NLoS, and the mean PL is computed as:
The RSS values collected from the three different UAV heights and the distance estimation from UAVs to mobile users were assessed for each LoS and NLoS using Equation (3) through the interpolation method, i.e., using sample points to estimate values at other unknown points to predict unknown values [
35]. The parameters were estimated using least-square errors, as shown in Equation (4). The estimated parameters contain
. The least-square method was used for parameter estimation, since the technique is simpler and less complex:
To analyze and predict the 3D wireless user throughput, we effectively provided UAV-BSs to accurately evaluate the A2G links of mobile users, including the user’s current communication status as LoS/NLoS, the distance, the user’s signal strength, and the path loss in the same scenario. To determine the vertical distance between UAV and mobile users, Equation (5) was used, where U is user {U…U
35}, and each UAV is represented by
M located at the given heights of 40, 50, and 60 m. To compute the horizontal distance Equation (6) and elevation angle, θ, using Equation (7), the angle variation and user in the area were computed:
where
h is the altitude of the UAV,
is the horizontal distance between
M and
U, and (
,
) represents the locations of
U and
M in the horizontal dimension. These helped to determine the number of users being served by a UAV in given class. The A2A distance was computed as:
Next, we considered the wireless transmission over the A2G access links from the UAVs to the ground users as well as over the A2A backhaul links among the UAVs. For both A2G and A2A links, we supposed that the wireless channels were dominated by the LoS communication link. Therefore, we used the free space path loss model (Equation (9)), as commonly used for the UAV communication links in previous works [
8,
20,
21]. Therefore, the channel power gain from UAV
1 M
1 to user U
n was expressed as:
However, due to the high LoS channels over both A2A and A2G links, the co-channel transmission may lead to severe interference among different users and UAVs. To solve this issue, we considered orthogonal transmission among different A2A and A2G links to avoid any co-channel interference, in which each link was allocated a dedicated frequency band.
Case 2: Estimate the Values of User Throughput for Each User at a GridPoints
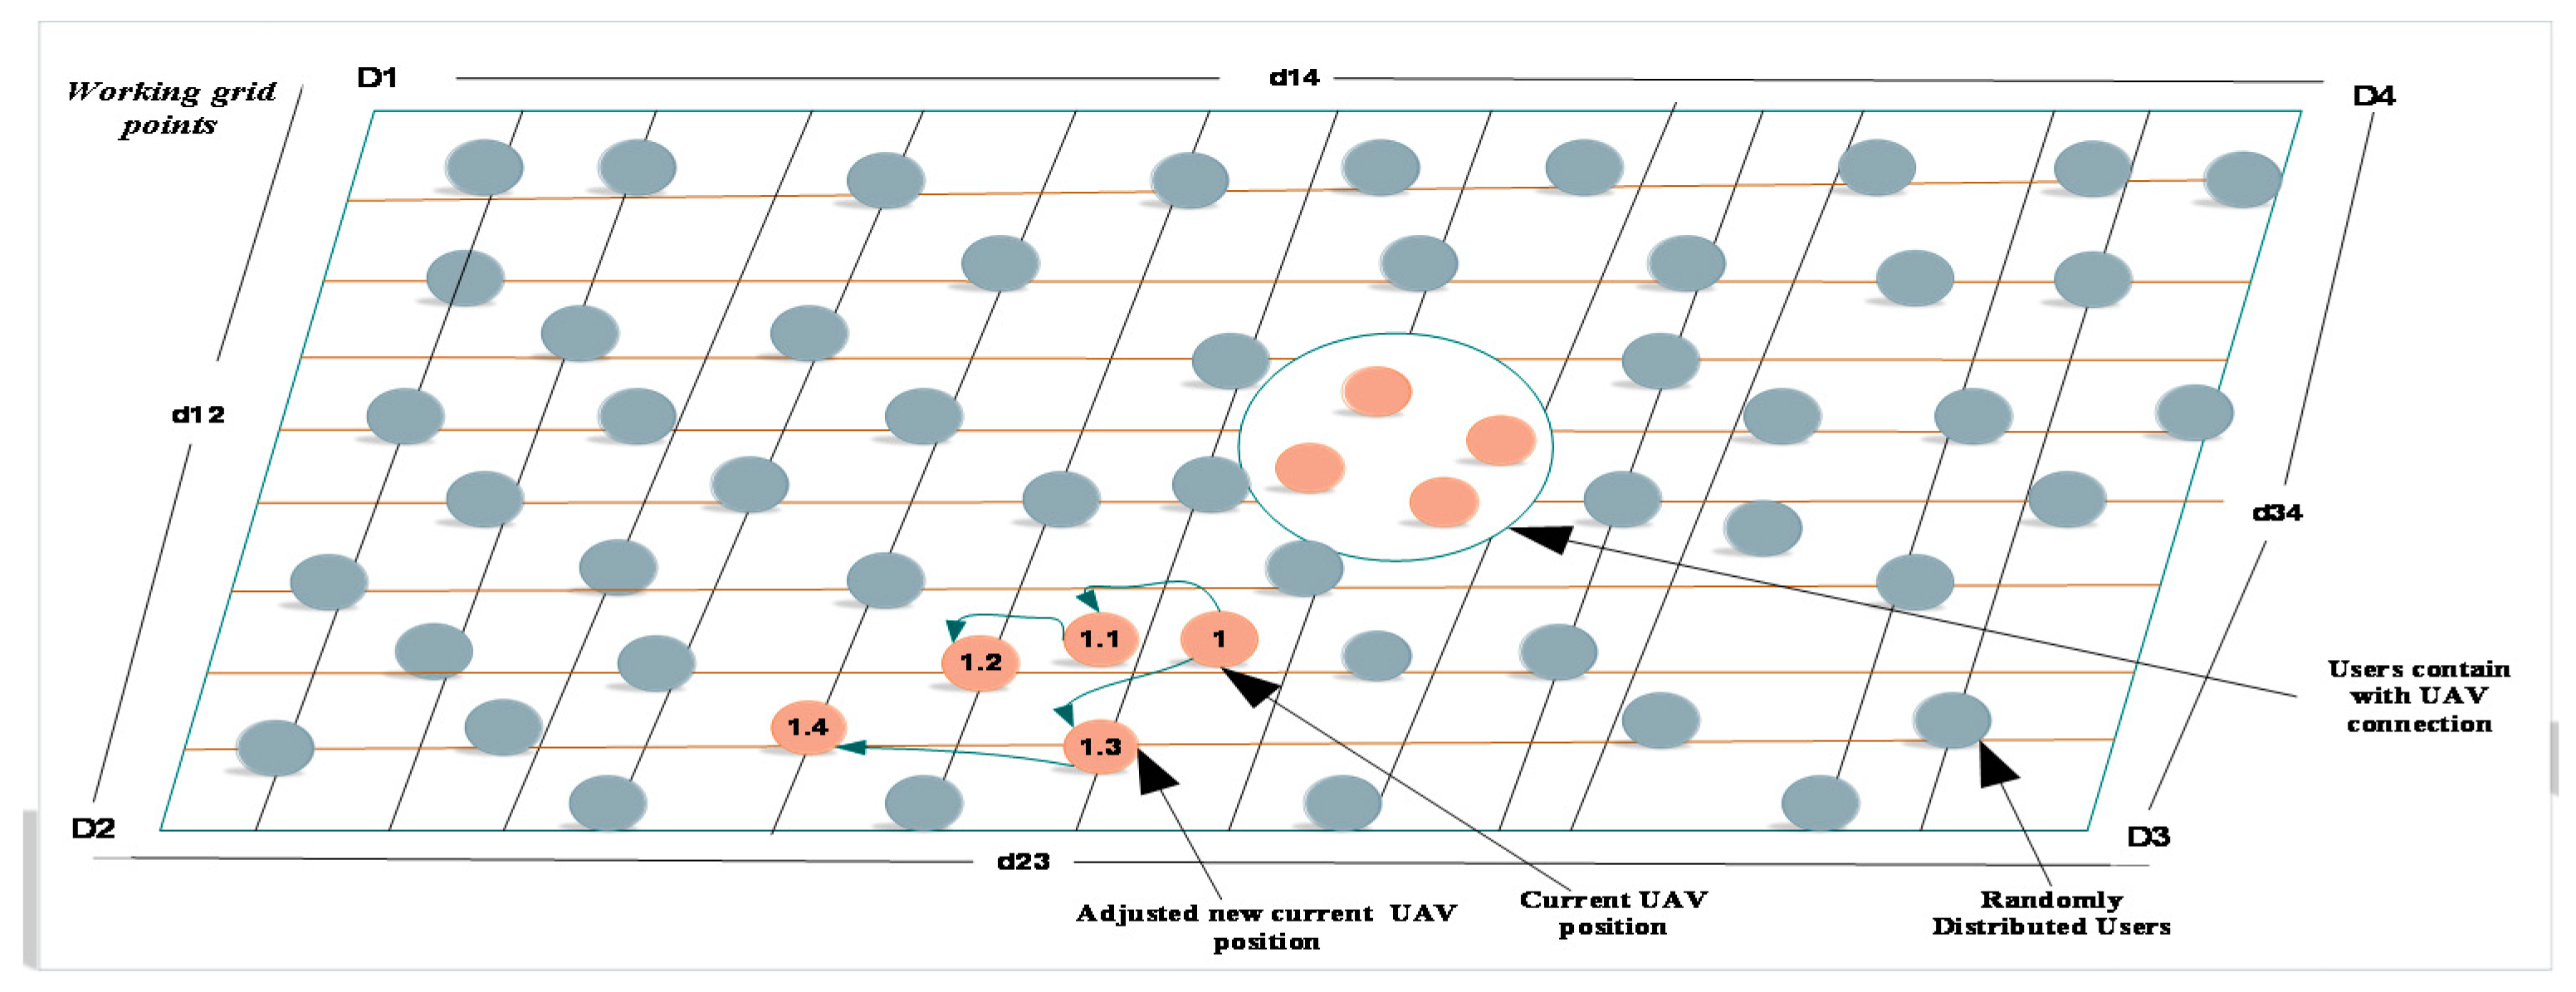
For the purpose of serving all users within the transmission range, UAVs should contain all the users in the working grid points. To satisfy this issue, the user throughput values should be estimated at the specified grid points within the working environment. Therefore, we proposed a positioning algorithm, iterative weighted interpolation positioning (IWIP), to evaluate and balance user throughput values to establish a fair distribution of signals to all the users. Then, the evaluation was done to select the grid point that contains the maximum estimated user throughput values. Based on the generated results of the estimated values, all users were served in the Tx and Rx of the UAV until the throughput was maximized using the UAV position, user location, and distance. In short, the tasks of positioning can be expressed as follows:
- (1)
After determining the data collection area, identify a grid of points (user location points given service by UAV) in the working area.
- (2)
Compute the desired UAV positions that are required to serve all users based on the number of users and their positions.
- (3)
Adjust the desired positions of UAVs so that all Rx are inside the Tx range.
- (4)
The newly adjusted UAV positions should be contained within the whole working line of grid points and outside the working area.
- (5)
Estimate or sum up the total values of the user throughput at each grid point.
- (6)
Move the UAV to the newly adjusted locations to handle all users within the Tx range.
Finally, the grid points were re-evaluated, and the grid points with the maximum estimated user throughput were selected as the newly positioning area. According to [
47], in order to estimate the user throughput for users at a specified grid point, estimate the transmission rate for each user needs to be estimated.
Figure 7, depicts the methods of IWIP and the whole structure of grid points inside our working area. All the circles and ash grey colored lines illustrate the probable locations of mobile users, coverage, and the remaining grid points. For instance, the atomic tangerine colored grid points inside the circle show better estimated user throughput values than the other points. The remaining or separate atomic tangerine colored grid points show the estimations of user throughput values. For example, 1 is the current location of a UAV, and the next points, 1.1, 1.2, 1.3, and 1.4, are considered the newly adjusted UAV positions. At these points, the UAV compares the user throughput values and decides to allocate the next points based on their data rate demand, because the principle of our proposed algorithm tries to fairly assign the user throughput values for all users. The symbols represented as D1, D2, D3, and D4 indicate the whole area and user-to-user distance measurement for all grid points in each class.
Case 3: Finding the Grid Points Achieved Maximum and Total Throughput Maximization
The points with the total and maximum estimated user throughput were determined to compute the user throughput capacity for each user at a grid point, where the user throughput value at the current grid point was greater than the current maximum value. Then, the point with the estimated maximum throughput, Pmax, was determined. After identifying the highest sum values of user throughput for all users, they were estimated as Rsum (T) = , which is a combination of the time allocation, t, for A2G. Therefore, it guaranteed an equal throughput allocation to all users and maximizes their sum-throughput. This can be described as follows:
- ▪
The algorithm iterates over all the grid points inside the working area until it gets the Tmax (maximum throughput value) and Pmax (maximum user throughput position).
- ▪
The optimal UAV position is considered, i.e., dum (Pu, Ccont) ≤ Rcont, which enforces that the UAV should remain inside the wanted area while the optimal position is found.
- ▪
To maximize (UAV position) ct T: du = distance (Pu, Pn), ∀n ∈S, the distance between each user and the UAV is computed; Cu = f(Pt, du, Iu), ∀j ∈S shows that the throughput capacity is a function of the transmit power, the distance between the user and UAV, and the interference experienced by the user. Where Ct denotes the common user throughput and d is a feasible set of T, and I and P are the interference and power transmission, respectively.
Principle of Iterative Weighted Interpolation Positioning (IWIP)
In order to measure the U2U distance, we proposed an IWIP scheme based on signal differences or variations. This method can easily achieve multi-user localization with higher positioning accuracy, because it combines the advantages of the centralized positioning scheme and decentralized positioning scheme [
32]. In accordance with [
52], we applied the IWIP because mobile users can use it to search and collect several OFDM-RSS values at a time and it is a better way to estimate the positions of UAVs. In addition, it is important to reduce the power consumption compared with the centralized positioning method. As shown in
Figure 7, we assumed there were mobile users at positions of {U
1...U
n} with the position of
Pu in between U
1 and U
n, and we set the ratio,
. Therefore, we computed P
u as:
where
is a vector from
. After computing all the positions of users, and to compute the locations of users and UAVs, the IWIP was applied after taking the weighted interpolation of the positions of {U
1…U
35}. Then, the two weighting factors that represent the weighted location were computed:
where E
pu, is the estimated position for mobile users. In general, our proposed algorithm was applied to identify and cluster the classes in the working area and to estimate the values of grid points to compute and predict the total user throughput at each class, based on the preferred UAV height and distance, and to assess the overall performance of our MLP-LSTM model in terms of class and grid point based analysis of user throughput values. Finally, to test our model for positioning and user throughput maximization accuracy, we used the root mean square error (RMSE), mean square error (MSE), and mean absolute percentage error (MAPE) performance evaluation methods and system performance metrics with different scenarios. They were computed as follows:
where n is the total number of predicted values, y
i is the actual value, and y is the predicted value. The MSE of the distance estimate was proportional to the user-to-user distance.
5. Discussion of the Experiment and Results
In this section, we describe simulations using both classification and regression schemes to analyze the performance of the proposed algorithm. The simulation was done using real data collected from an outdoor environment. Different parameters, such as the number of epochs, hidden layers, hidden units, types of optimization, and the activation function, were adjusted and used as part of the experimentation to train the MLP and LSTM models. In the classification scheme, we compared MLP-LSTM performances with SVM, LSTM, and MLP algorithms in different scenarios; more specifically, we used original datasets (scenario 1), used reduced features only and estimated the values of user throughput for each user at each grid point (scenario 2), and used reduced data collected on different days/times and found the grid points in which users achieved maximum and total throughput (scenario 3). In the regression scheme, testing was performed in similar scenarios to prove the effectiveness of the proposed approach. In all scenarios, we considered the total user throughput analysis based on the positions of UAV with altitudes of 40, 50, and 60 m within three classes.
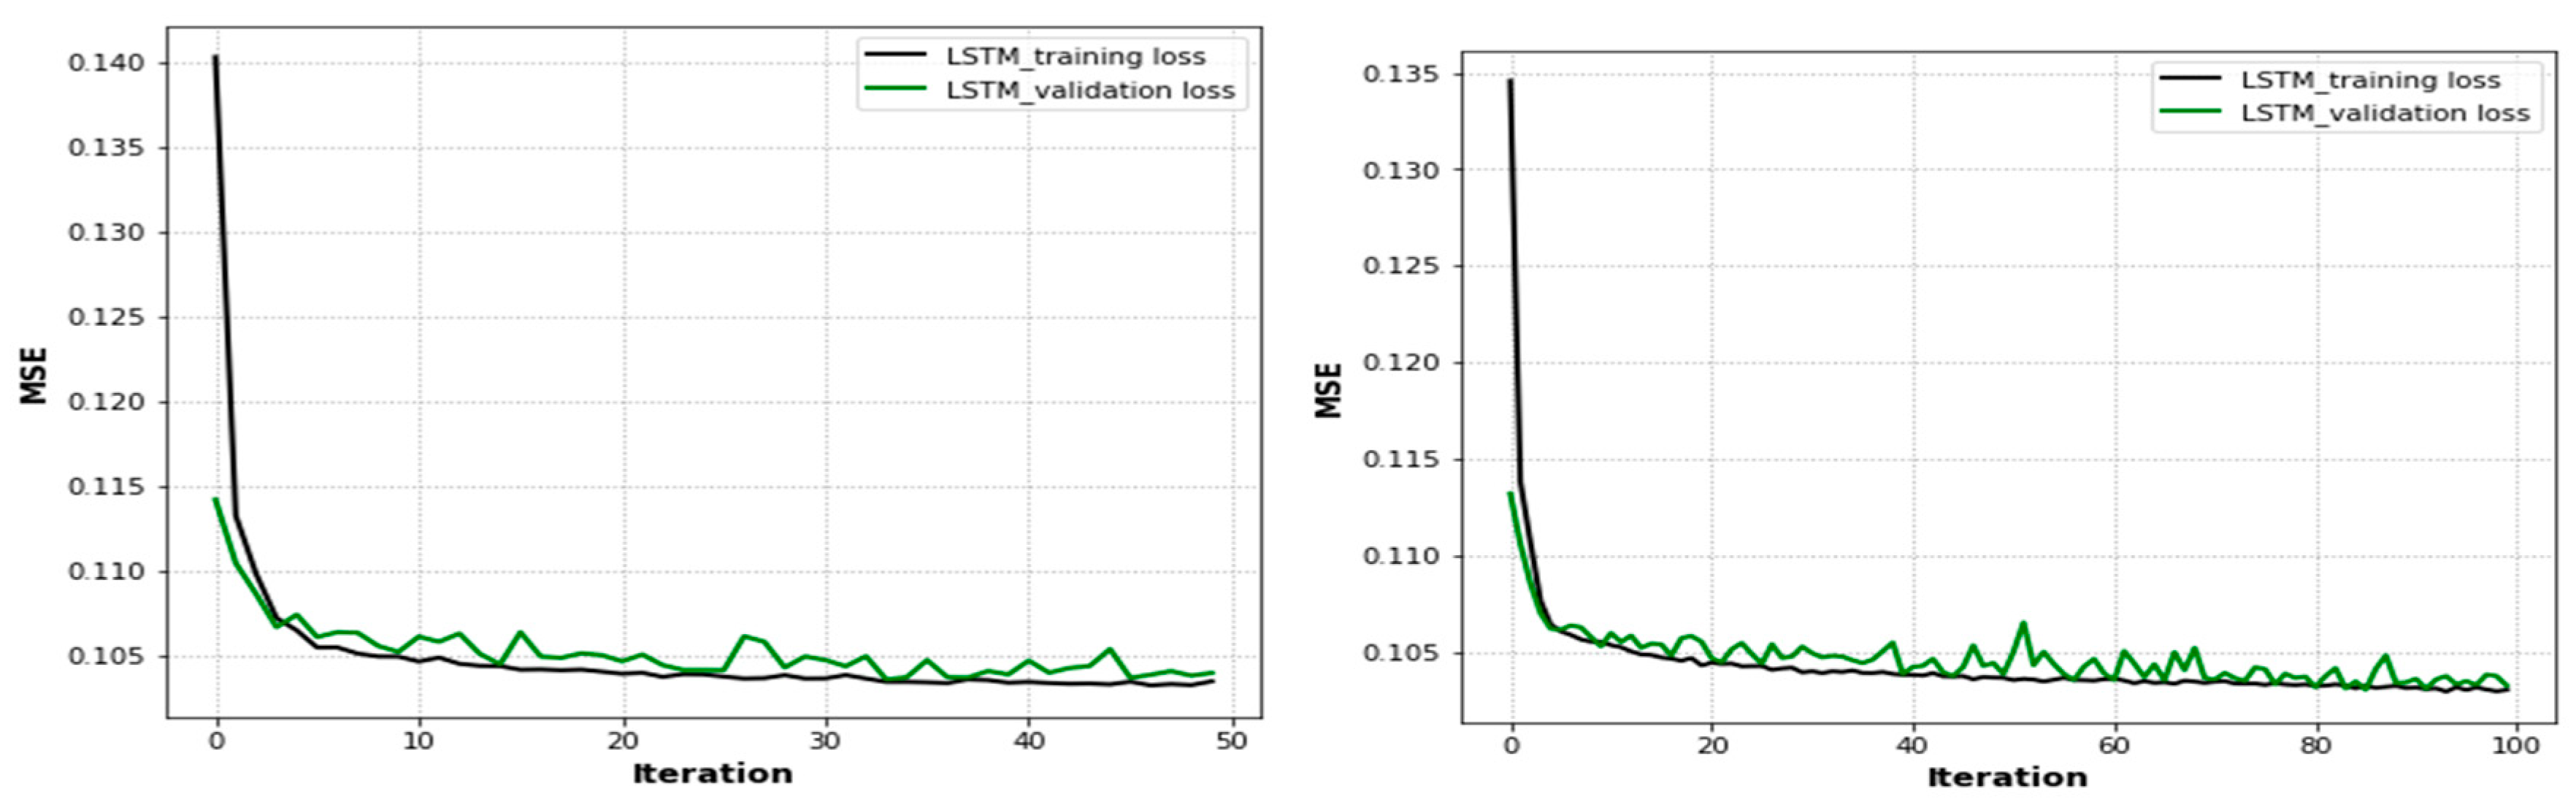
When the UAVs were positioned at their optimal locations, the time passed and the number of epochs increased the user throughput in the training and testing phases, as shown in
Figure 8,
Figure 9 and
Figure 10. Therefore, in
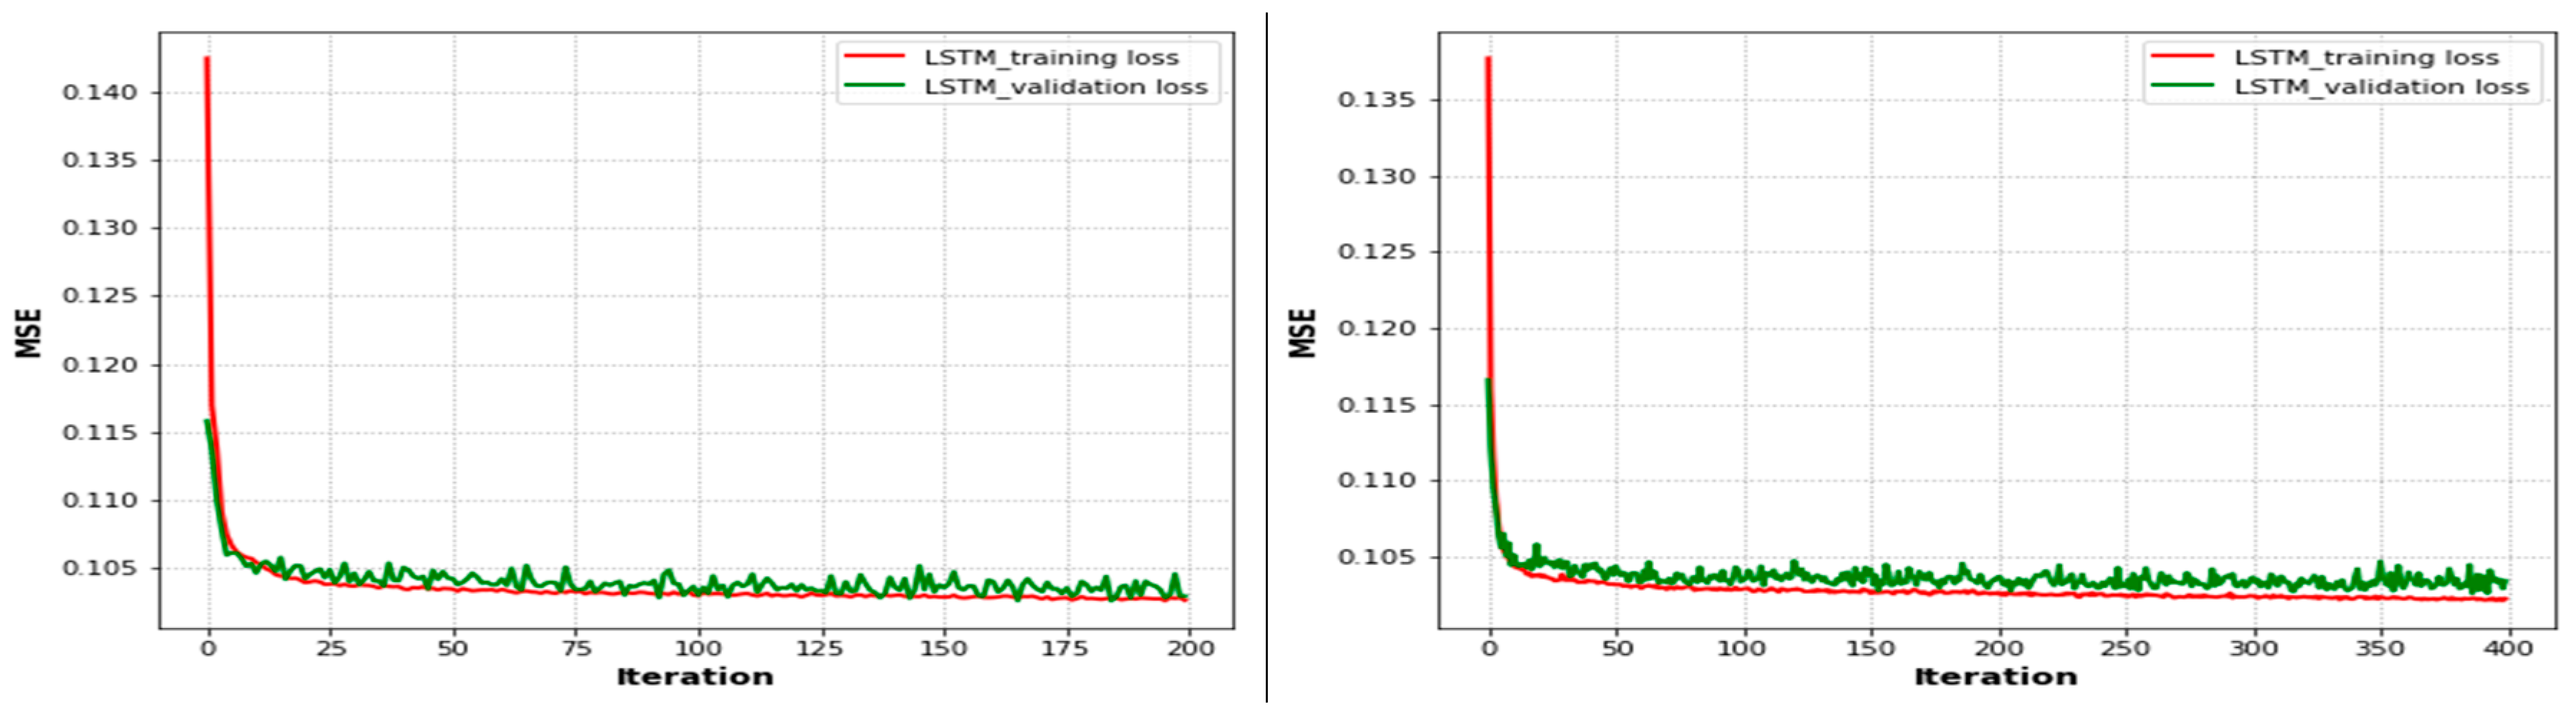
Figure 8, we compare epoch 50 (training and testing losses overlapped after 0.114 to epoch 8 and were then parallel until the end of the iterations) and epoch 100 (the training and testing losses overlapped after 0.113 to epoch 6 and were then parallel until the end of the iterations) based on the LSTM approach. After the performance degradation exceeded some threshold, the process of optimal UAV positioning had to be repeated. In both scenarios, as the user throughput dropped, the optimal positions for UAVs were recomputed again based on the existing conditions, and the UAVs were moved to them. For user mobility, as one would expect with higher user speeds, the throughput dropped quickly. In these results, the time it takes for a UAV to move from its current position to the optimal position was ignored. Finally, as shown in both figures, the training loss decreased as the number of epochs increased. The training loss converged quickly to a low value, since the error on the testing set closely matches the training set. The network did not over-fit the training data.
Figure 9 compares epochs 200 and 400. The training loss converged quickly to low values of 0.115 and 0.116, respectively, after approximately 15 epochs based on the performance of the LSTM approach with training and testing phases. As shown in the figure, the training loss decreased when the number of epochs increased. After the performance degradation exceeded some threshold, the process of optimal UAV positioning had to be repeated. Since the error on the testing set closely matches that of the training set, the network did not over-fit the training data. Moreover, we used different activation functions, such as sigmoid, rectified linear unit (ReLU), softmax, and tanh, in order to squash the output of the neural network to be within certain bounds. Then, we performed many experiments to find the optimal values of parameters to obtain less MSE and a short training time. Therefore, after some experimentation, we selected the parameters and trained the LSTM model using a batch size of 1500, with varied iterations of 50, 100, 200, and 400 epochs, and 512 hidden units. We compiled the network using the Adam optimization algorithm and the tanh activation function. The loss metrics used for evaluating the prediction performance of the model and optimizing the weights were chosen to be the preferable MSE.
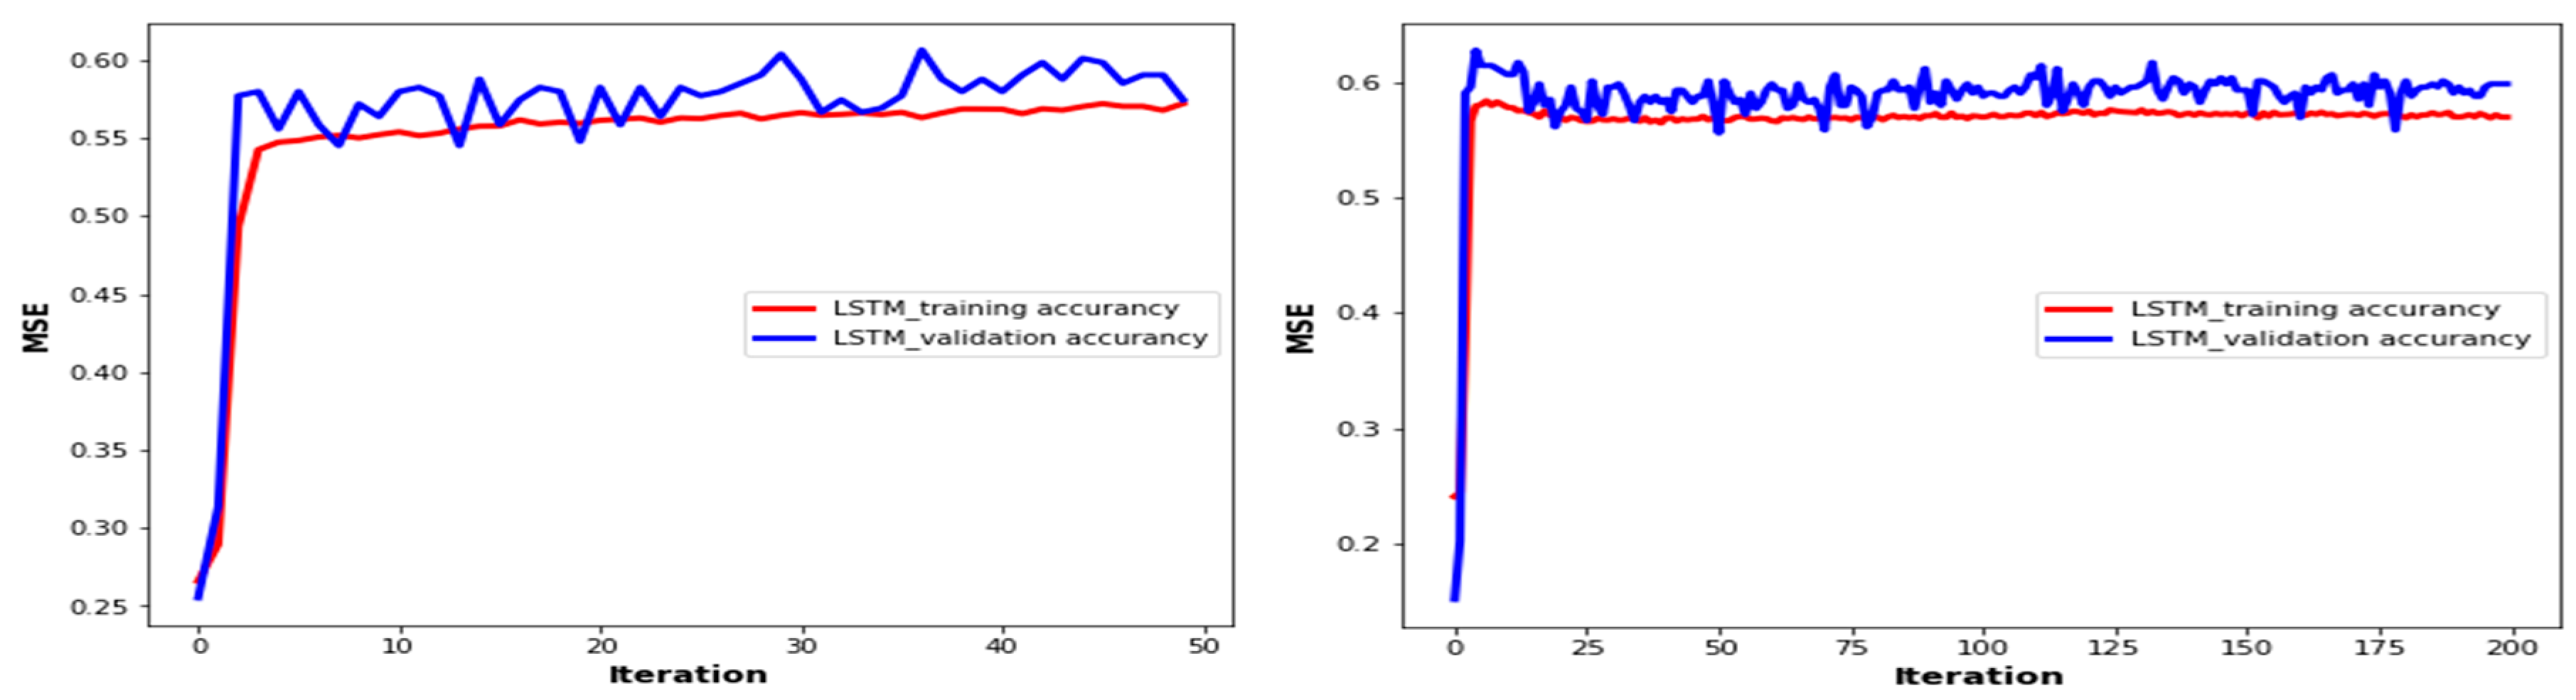
Figure 10 shows the accuracy of the training and validation phases with the number of epochs based on the LSTM approach. As shown in the figure, the training loss decreased with an increasing number of epochs. The training accuracy converged quickly to low values of 0.55 and 0.60 for 50 and 200 epochs, respectively. However, the validation accuracy also converged at around 0.53 and 0.57 for 50 and 200 epochs, respectively. As a result, the error on the validation set closely matches the training set and loss plots, and the effect of input parameters on the number of iterations during the training of the LSTM decreased when the number of iterations increased. However, the model indicates it is capable of accurately measuring the user throughput values because the training accuracy and validation accuracy sets are closely matched based on their iterations and the model did not have an overfitting problem.
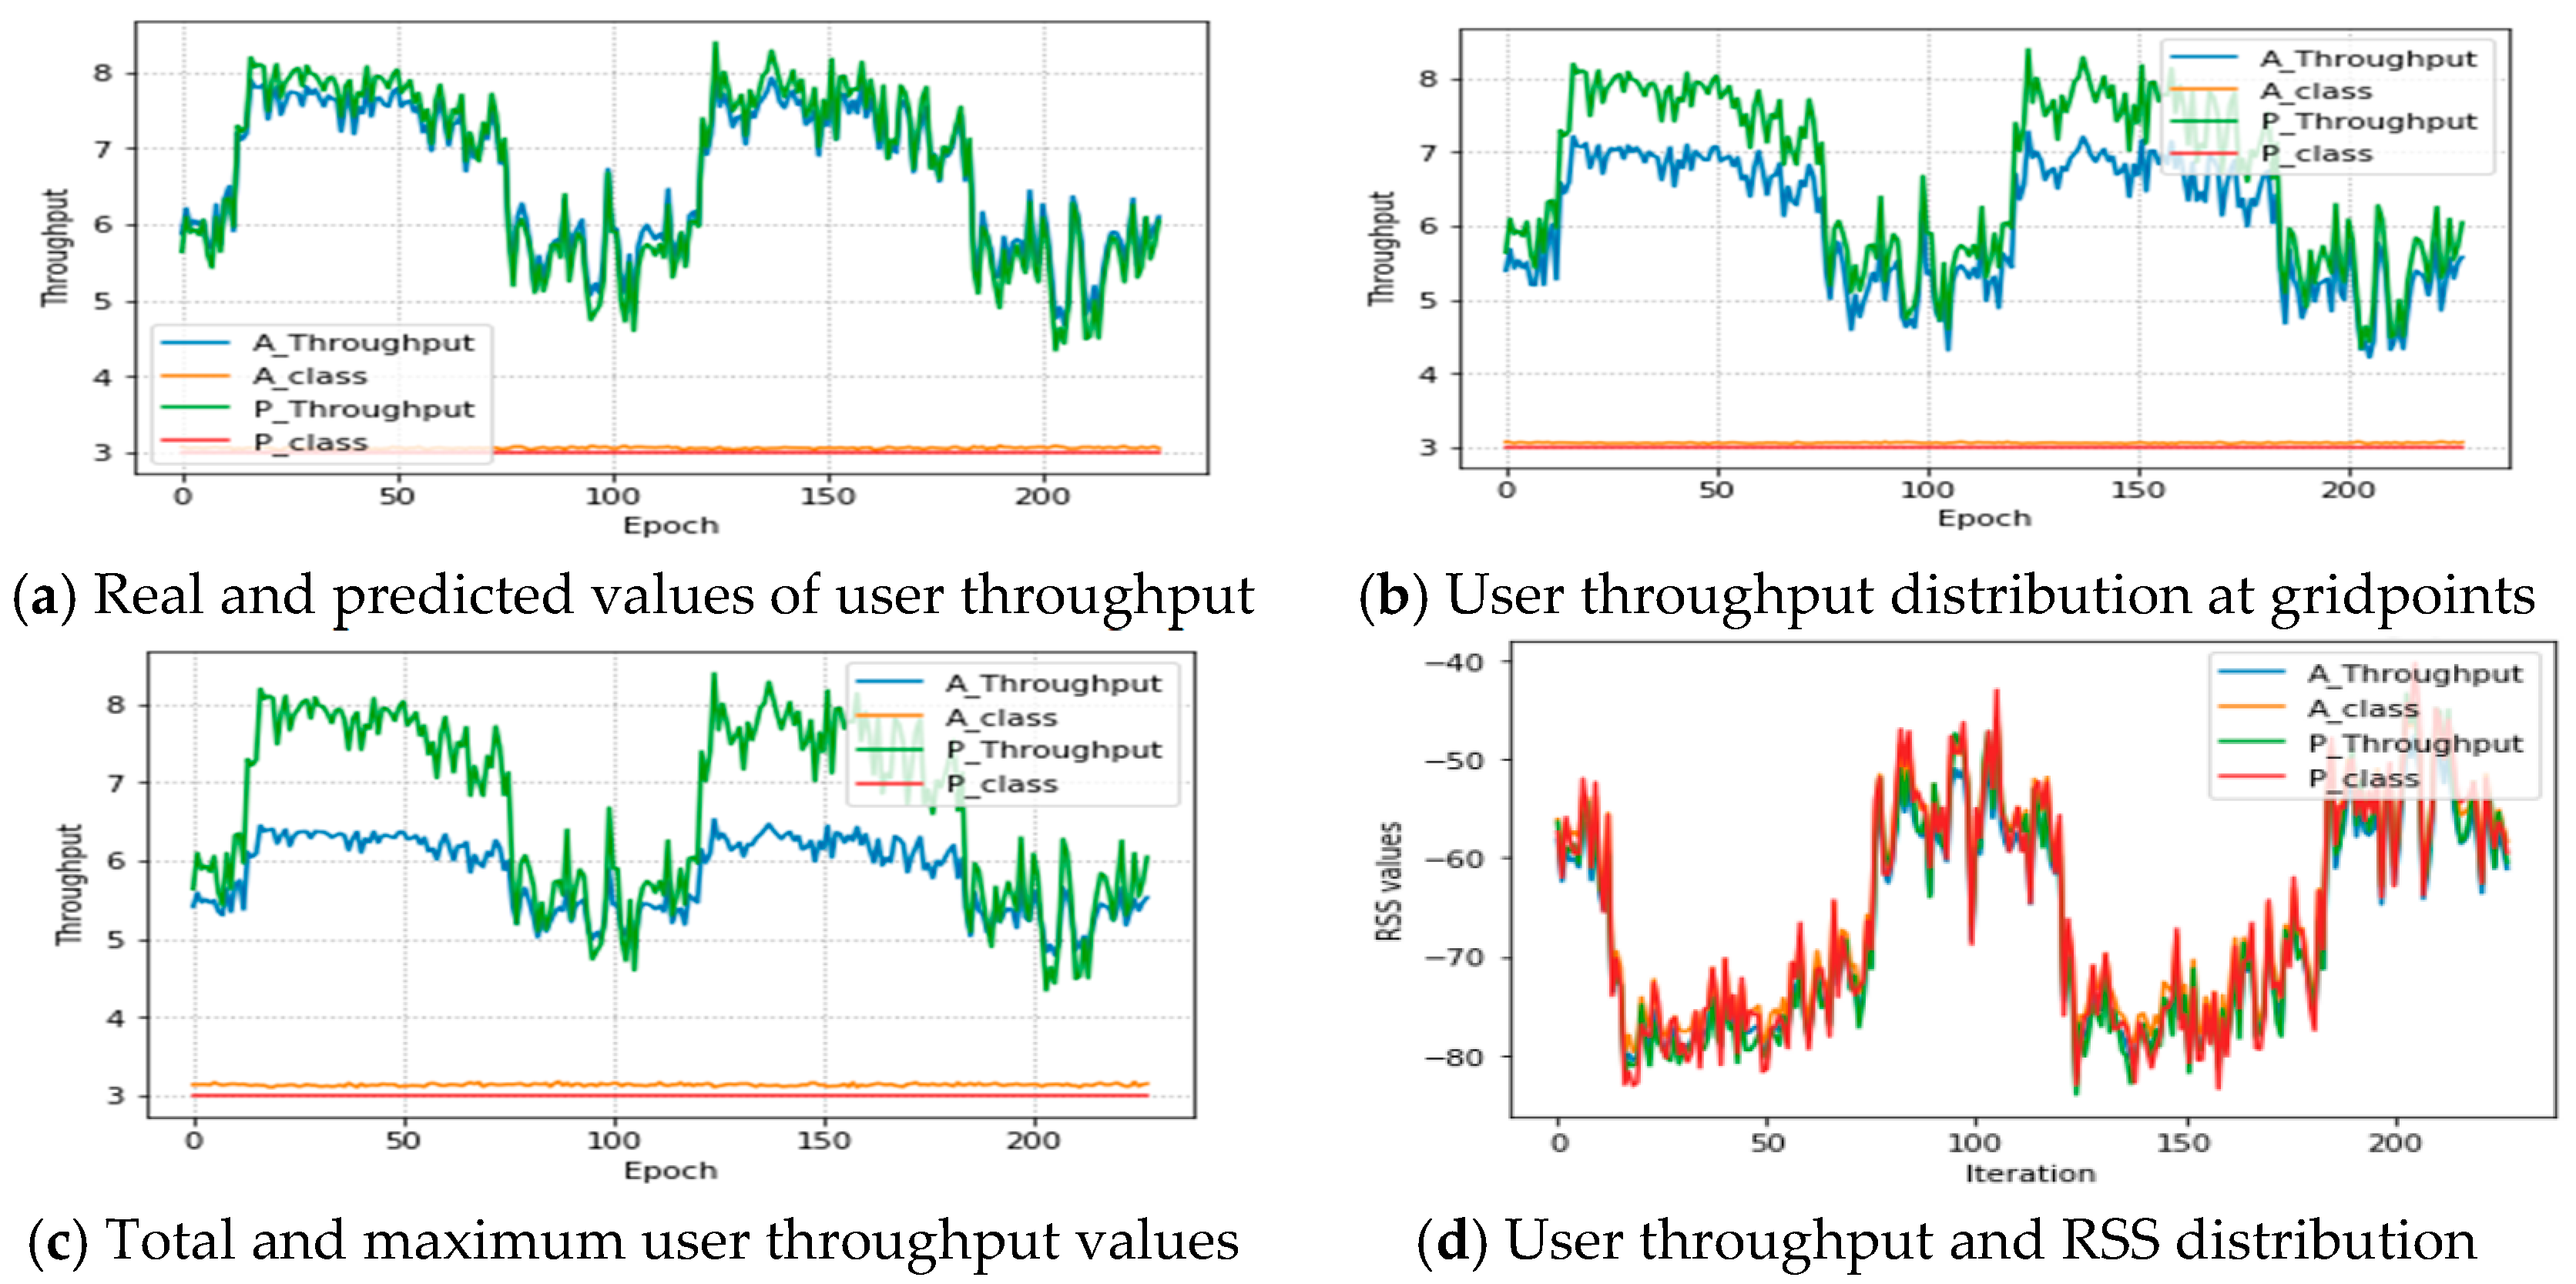
Figure 11 shows the actual and predicted user throughput values as well as the predicted and actual class values with the number of epochs and different conditions. As illustrated in the figure, both the actual and predicted values for the user throughput and class values are approaching or are plotted similarly to the increment of epoch values. This indicates that the proposed algorithm can easily adapt and make efficient predictions with the actual values. For instance,
Figure 11a shows the original dataset (scenario 1), in which the actual and predicted throughput values are plotted similarly;
Figure 11b indicates the performance of scenario 2, in which the actual and predicted values are compared after using LDA, and the predicted values have excellent better estimation; and
Figure 11c indicates the performance of scenario 3 in which the actual and predicted values are compared. A promising result is shown for the prediction task for all grid points. Finally,
Figure 11d shows the comparison of RSS and the user throughput values. The proposed algorithm estimated user throughput distribution for all the classes and grid points with a similar distribution of signals.
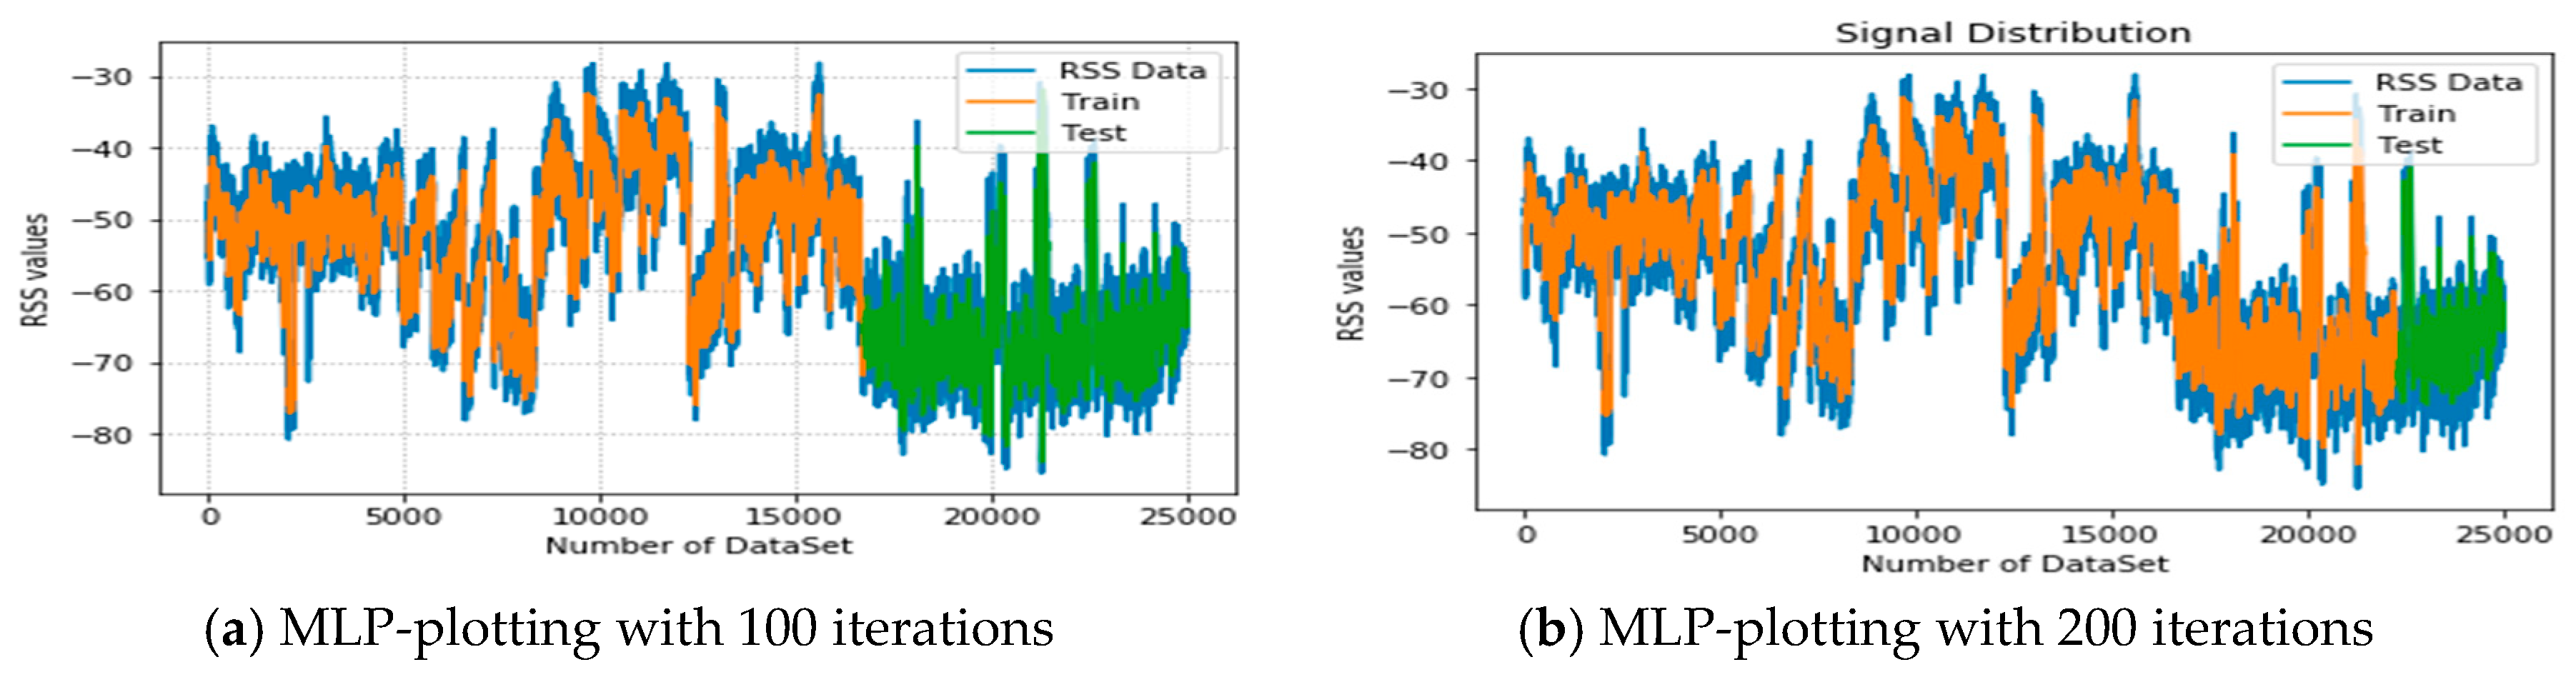
In
Figure 12a,b, the estimation of RSS signal distribution with the incremental number of dataset values is shown based on the MLP approach. In the figure, blue shows the distribution of the OFDM signal, and yellow with blue and green with blue show the datasets classified for training and testing (validation), respectively. Figure a has 100 iterations and the second figure has 200 iterations. In both figures, the maximum result reached RSS values of −30 to −90. Finally, the result indicates that the real signal distribution and the predicted values are plotted similarly. This indicates that the MLP algorithm also showed a better performance, which can classify the distribution of RSS signals over different iterations based on the elevation angle, UAV altitudes, and distance.
Table 4 shows the user throughput performance in the classification scheme under different scenarios. The UAV positioning accuracies for scenario 1, scenario 2, and scenario 3 were 80.20%, 87.23%, 94.11%, and 96.73%; 87.00%, 92.03%, 95.14%, and 98.33%; and 89.1%, 96.12%, 96.21%, and 99.53%, respectively, using the SVM, MLP, LSTM, and MLP-LSTM based classifiers. The performance accuracy of all classifiers was greatest in scenario 3 since the LDA resolved outliers and removed noise to allow accurate positioning. In scenario 3, the accuracy levels of MLP and LSTM were highly improved, and the values approached each other. The hybrid of MLP-LSTM gave accuracies of 96.73%, 98.33%, and 99.53%, respectively, in each scenario. Thus, the UAV positioning and user location improved based on their user throughput values in each class and grid points. The performance of LSTM was also better than the others, while it was lower than that of MLP-LSTM. The reason for this is due to the higher learning capabilities in a real and dynamic environment. Moreover, MLP-LSTM has better UAV positioning accuracy than MLP and SVM, because MLP-LSTM combines the highest hidden and memory capacities in a large dataset structure.
Therefore, the proposed approach has better positioning accuracy, as it integrates MLP with LSTM, and the selected grid points have maximum user throughput, so the model is more flexible with respect to complex and dynamic environments. In
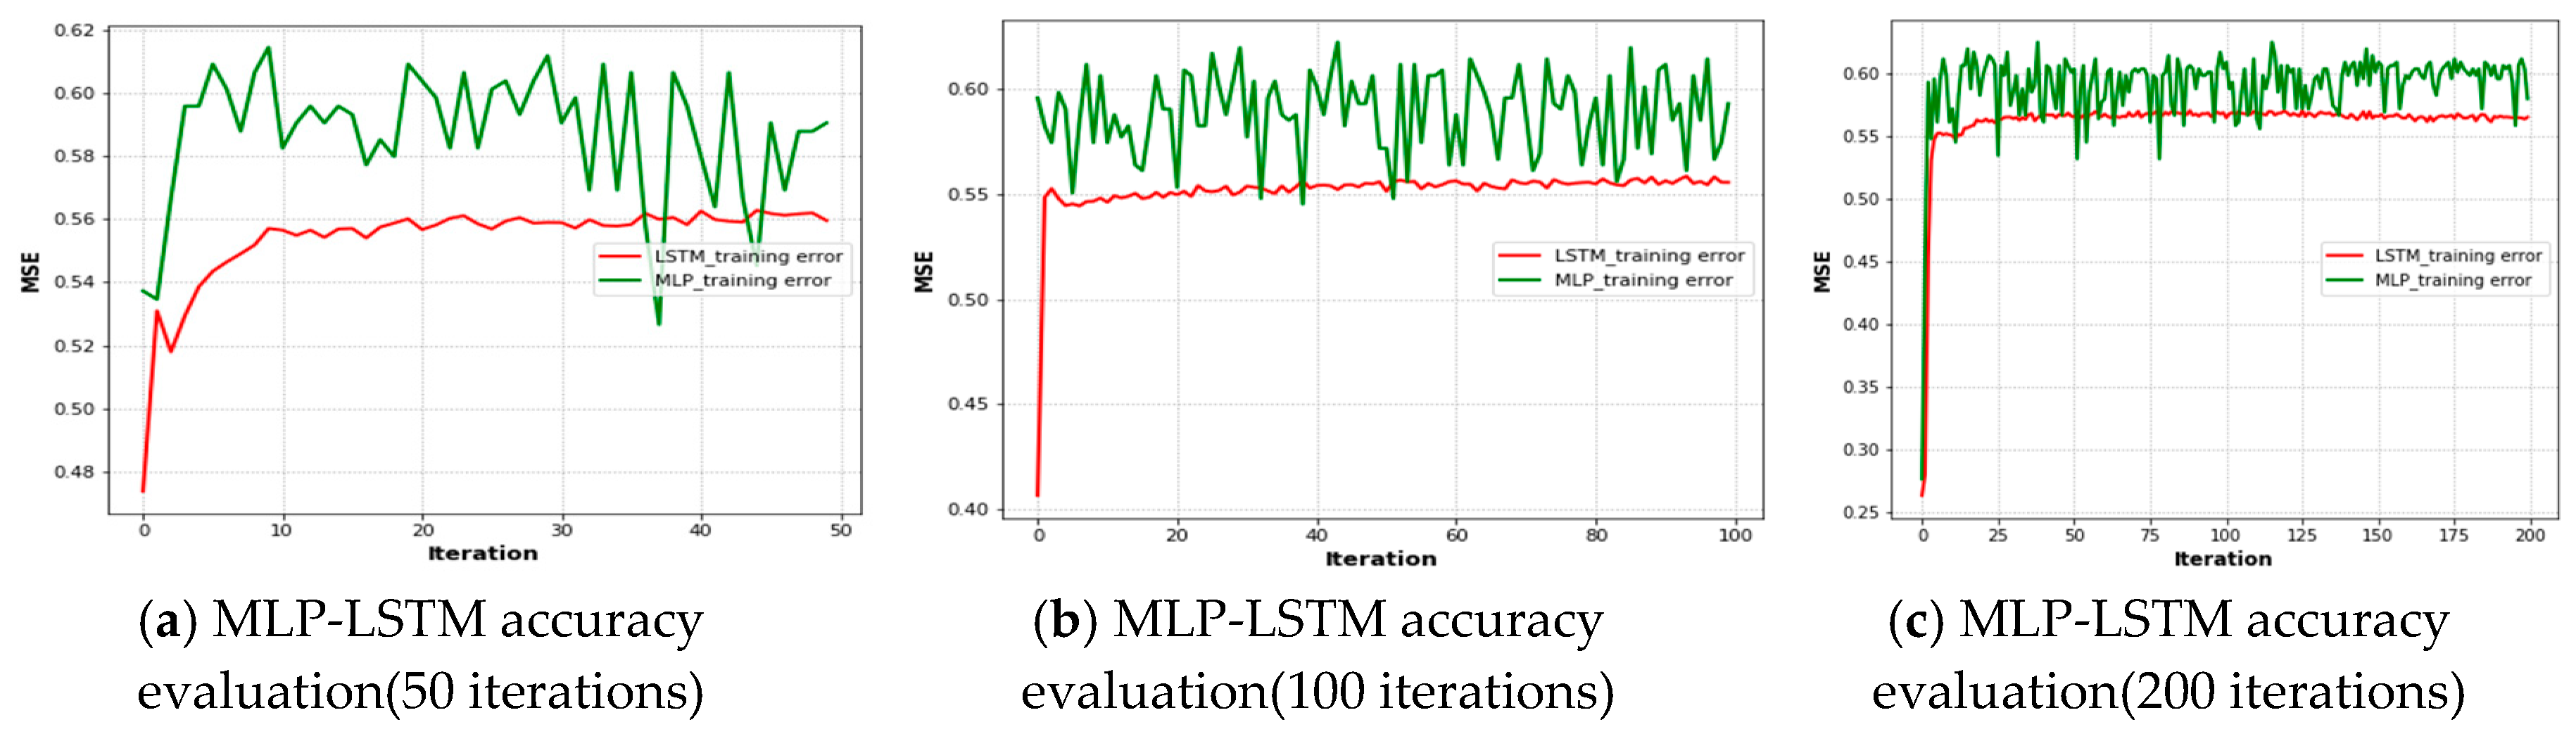
Figure 13a–c illustrates measurements at UAV heights of 40, 50, and 60 m and their impacts on user throughput distribution for the real measured signal distribution collected and error distribution values. The accuracy of LSTM starts at 0.46 and inclines at around 0.55 MSE with constant variation. The accuracy of MLP starts at around 0.54 and inclines with the LSTM approach at around 0.60 with great variation until the end of the evaluation. However, in
Figure 13b, the LSTM accuracy evaluation starts at 0.42 and inclines at around 0.55 before decreasing until the end of the evaluation process, and the MLP accuracy starts at around 0.58 MSE, and its accuracy has the highest variation until the end of the iterations. In
Figure 13c, the MSE training error for both LSTM and MLP starts at 0.27 and inclines at around 0.55 and 0.60 with constant variation, but MLP has greater variation than the other iterations until the end of the evaluation. Therefore, the results indicate that the training accuracy of LSTM is better than that of MLP, with an increased number of iterations to manage their great variation and generate a better result. Further, the results indicate that their integration is crucial.
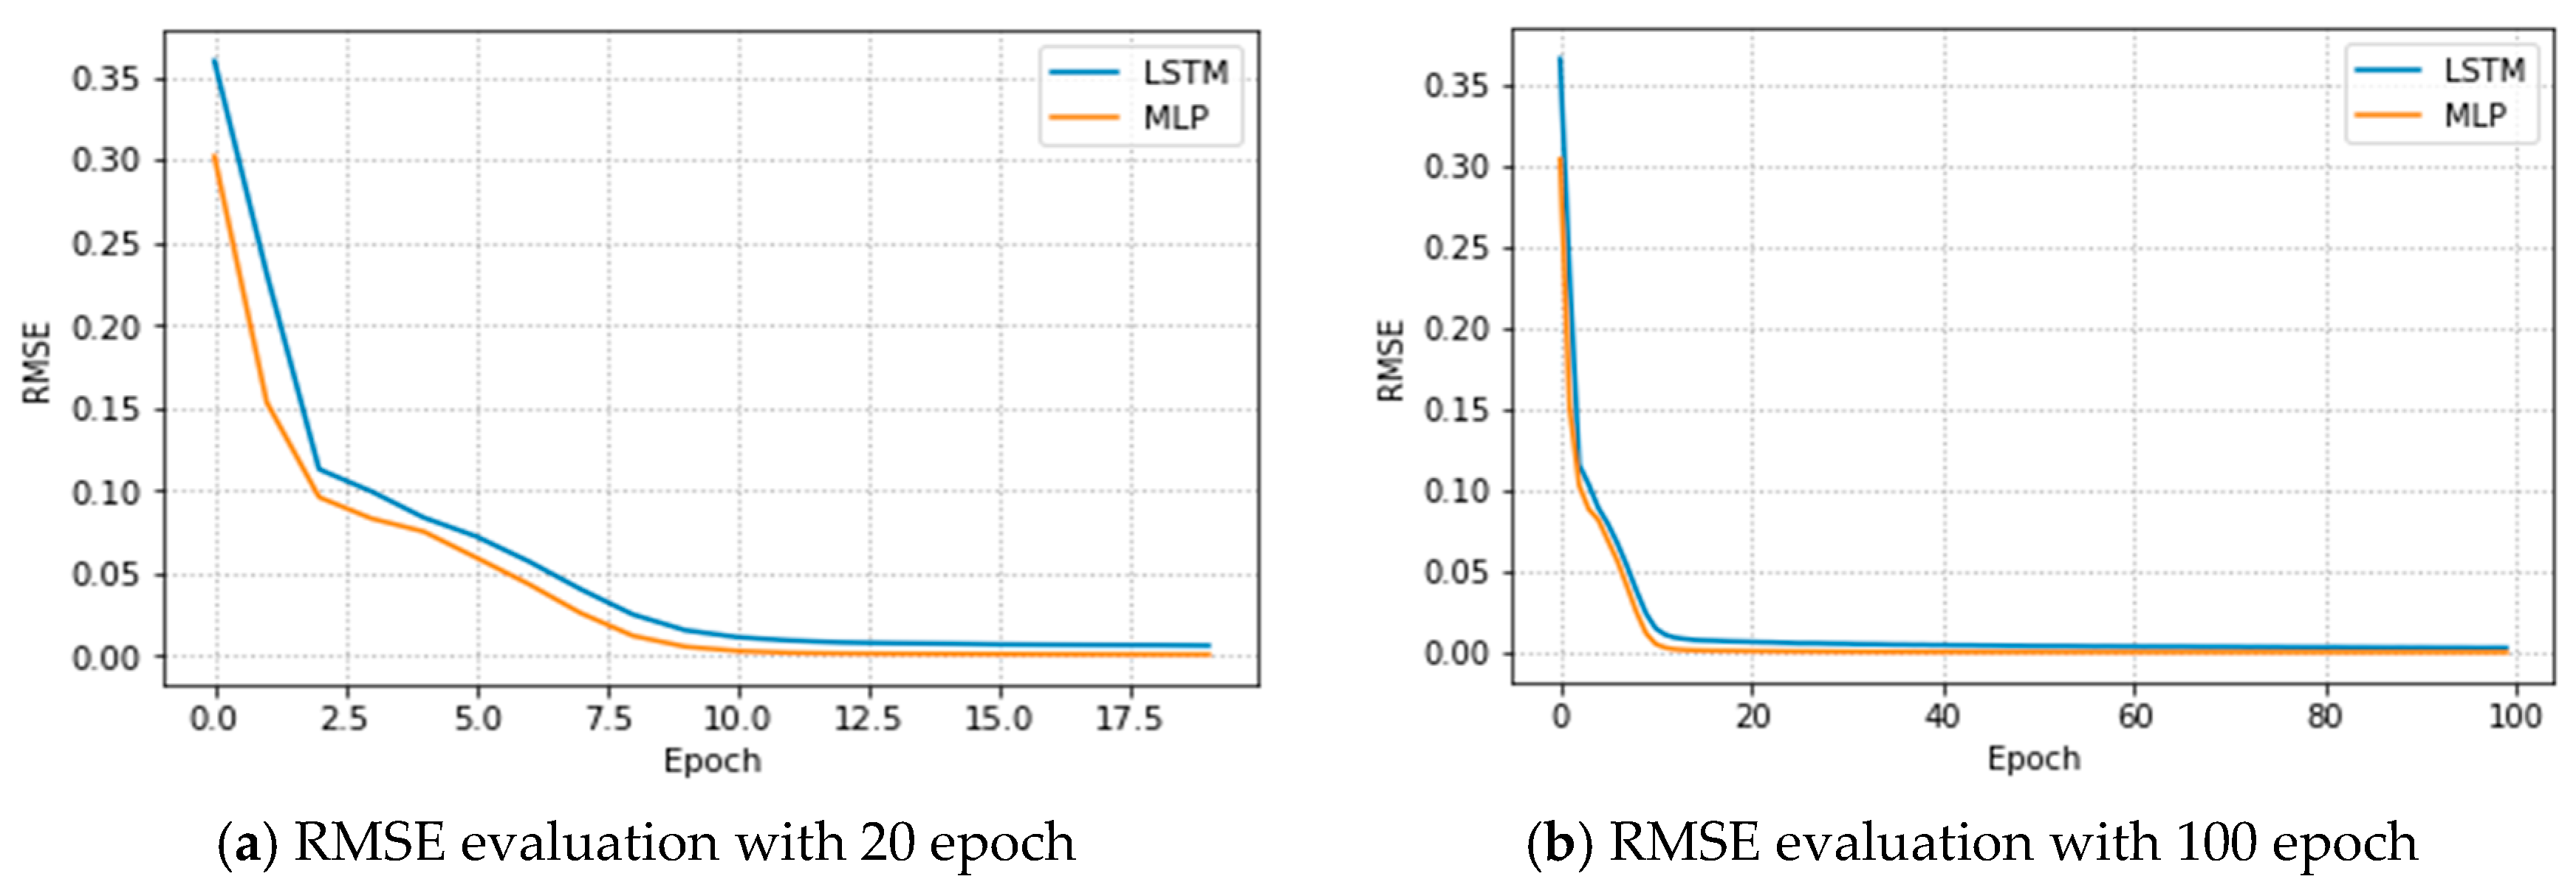
Table 5, shows a comparison of system performances for user throughput maximization using MLP, LSTM, and a hybrid of the MLP-LSTM algorithms within the three classes and UAV heights. When the MLP algorithm was used in class I, the average throughput, MSE, MAPE, and RMSEs at heights of 40, 50, and 60 m were 94.00%, 95.03%, and 93%; 0.004, 0.003, and 0.005; 0.028, 0.027, and 0.031; and 0.5, 0.47, and 0.49, respectively. In the case of LSTM, the average throughput, MSE, MAPE, and RMSEs at heights of 40, 50, and 60 m were 94.00%, 96.33%, and 95.30%; 0.023, 0.033, and 0.031; 0.022, 0.033, and 0.31; and 0.4, 0.36, and 0.37, respectively. For MLP-LSTM, the average throughput, MSE, MAPE, and RMSEs at heights of 40, 50, and 60 m were 96.00%, 98.33%, and 97.30%; 0.01, 0.01, and 0.02; 0.012, 0.013, and 0.011; and 0.29, 0.27, and 0.28, respectively. In class I, the minimum RMSE values were obtained for both MLP and LSTM algorithms, while the hybrid of MLP-LSTM performed better. When the MLP algorithm was used in class II, the average throughput, MSE, MAPE, and RMSEs at heights of 40, 50, and 60 m were 92.00%, 95.51%, and 92%; 0.003, 0.002, and 0.021; 0.020, 0.021, and 0.210; and 0.47, 0.43, and 0.51, respectively. In the case of LSTM, the average throughput, MSE, MAPE, and RMSEs at heights of 40, 50, and 60 m were 95.01%, 97.21%, and 94.08%; 0.022, 0.021, and 0.012; 0.030, 0.029, and 0.028; and 0.32, 0.31, and 0.31, respectively. For the case of MLP-LSTM, the average throughput, MSE, MAPE, and RMSEs at heights of 40, 50, and 60 m were 96.01%, 98.01%, and 95.00%; 0.12, 0.11, and 0.14; 0.011, 0.012, and 0.010; and 0.28, 0.16, and 0.30, respectively. In class-II, the minimum RMSE was obtained for both the MLP and LSTM algorithms, but the MLP-LSTM performance was better for the 50 m height. Using the MLP algorithm in class-III, the average throughput, MSE, MAPE and RMSEs at heights of 40, 50, and 60 m were 92.33%, 95.01%, and 92.15%; 0.034, 0.022, and 0.023; 0.050, 0.041, and 0.030; and 0.45, 0.48, and 0.53, respectively. In the case of LSTM, the average throughput, MSE, MAPE, and RMSEs at heights of 40, 50, and 60 m were 95.53%, 96.75%, and 94.87%; 0.04, 0.03, and 0.02; 0.080, 0.095, and 0.091; and 0.35, 0.38, and 0.33, respectively. For MLP-LSTM, the average throughput, MSE, MAPE, and RMSEs at heights of 40, 50, and 60 m were 96.01%, 97.05%, and 95.97%; 0.03, 0.03, and 0.02; 0.017, 0.018, and 0.019; and 0.28, 0.28, and 0.31, respectively. In class-III, the minimum RMSE values were obtained for both the MLP and LSTM algorithms, but the MLP-LSTM performance was better for the 40 and 50 m heights.
Regarding the throughput maximization of each class distribution, the increment in UAV height from 40 to 50 m led to better user coverage and user throughput distribution in each class. In class I, for example, at UAV heights of 40, 50, and 60 m, RMSE values of 0.29, 0.27, and 0.28 were achieved for throughput, respectively. This indicates that an average distance of 50 m achieves a better result than the other UAV heights. In the case of class II, UAV heights of 40, 50, and 60 m achieved 0.28%, 0.28% and 0.16% throughput, respectively. This shows that an average UAV height of 60 m is better than the other UAV heights.
Regarding class III, UAV heights of 40, 50, and 60 m achieved RMSE values of 0.28, 0.28, and 0.21 throughput, respectively. This shows that the averaged results of both the 40 and 50 m UAV heights were better than those of other UAV heights. Therefore, the MLP-LSTM performs better in both throughput maximization and error distribution for each class and UAV heights. This implies the hybrid of the MLP-LSTM algorithm performs better than using the MLP and LSTM algorithms separately. We also compared the use of the MLP and LSTM algorithms alone with the MLP-LSTM algorithm hybrid and found better results, especially in terms of computing times. The increment in UAV heights does not always have good coverage. For example, at a UAV height of 60 m, the throughput and the error distributions were not as good as those at 50 m. Hence, the placement of the UAV is highly dependent upon the environment that serves as the BS. As a result, the UAV placing at a height of 50 m in sub-urban or urban areas, like our university complex, and elevated buildings is better than others.
Figure 14a,b, shows the RMSE estimation values versus the number of iterations for our proposed model. Variation was identified in the UAV signal and throughput measurement error when different numbers of epochs were used. The figure shows the measured results of the MLP and LSTM models and can be used to accurately measure the signal of each grid point and user to show the number of users contained in the UAV coverage. As a result, the proposed system can maximize user throughput with UAV heights and user distances and enhance the coverage capacity and reliability of UAVs. Furthermore, the proposed MLP-LSTM model can accurately measure the user throughput, even when the users are moved.
Table 6 compares the performance of the MLP-LSTM algorithm with the MLP and LSTM algorithms separately in terms of the values of user throughput maximization based on specified scenarios. The training and testing times were used as parameters for comparison. The results illustrate that in terms of the running time, the MLP-LSTM model has shorter training and testing times than the other two models. The training and testing times of MLP, LSTM, and MLP-LSTM in scenarios 1, 2, and 3 were 1.87, 1.47, and 1.52; 1.33, 1.45, and 1.49; 1.11, 1.31, and 1.40; 0.5, 0.47, and 0.49; 0.41, 0.4, and 0.37; and 0.36, 0.31, and 0.34, respectively.
The performance evaluation showed better training and testing times for user throughput maximization with the MLP-LSTM algorithm. The MLP-LSTM prediction performance values were 1.11, 1.31, and 1.40 for training and 0.36, 0.31, and 0.34 for testing for each scenario, respectively. Therefore, the proposed MLP-LSTM based methods can provide efficient and scalable maximization of UAV positioning based on user throughput in real environments.


