ACF Based Region Proposal Extraction for YOLOv3 Network Towards High-Performance Cyclist Detection in High Resolution Images


Abstract
:1. Introduction
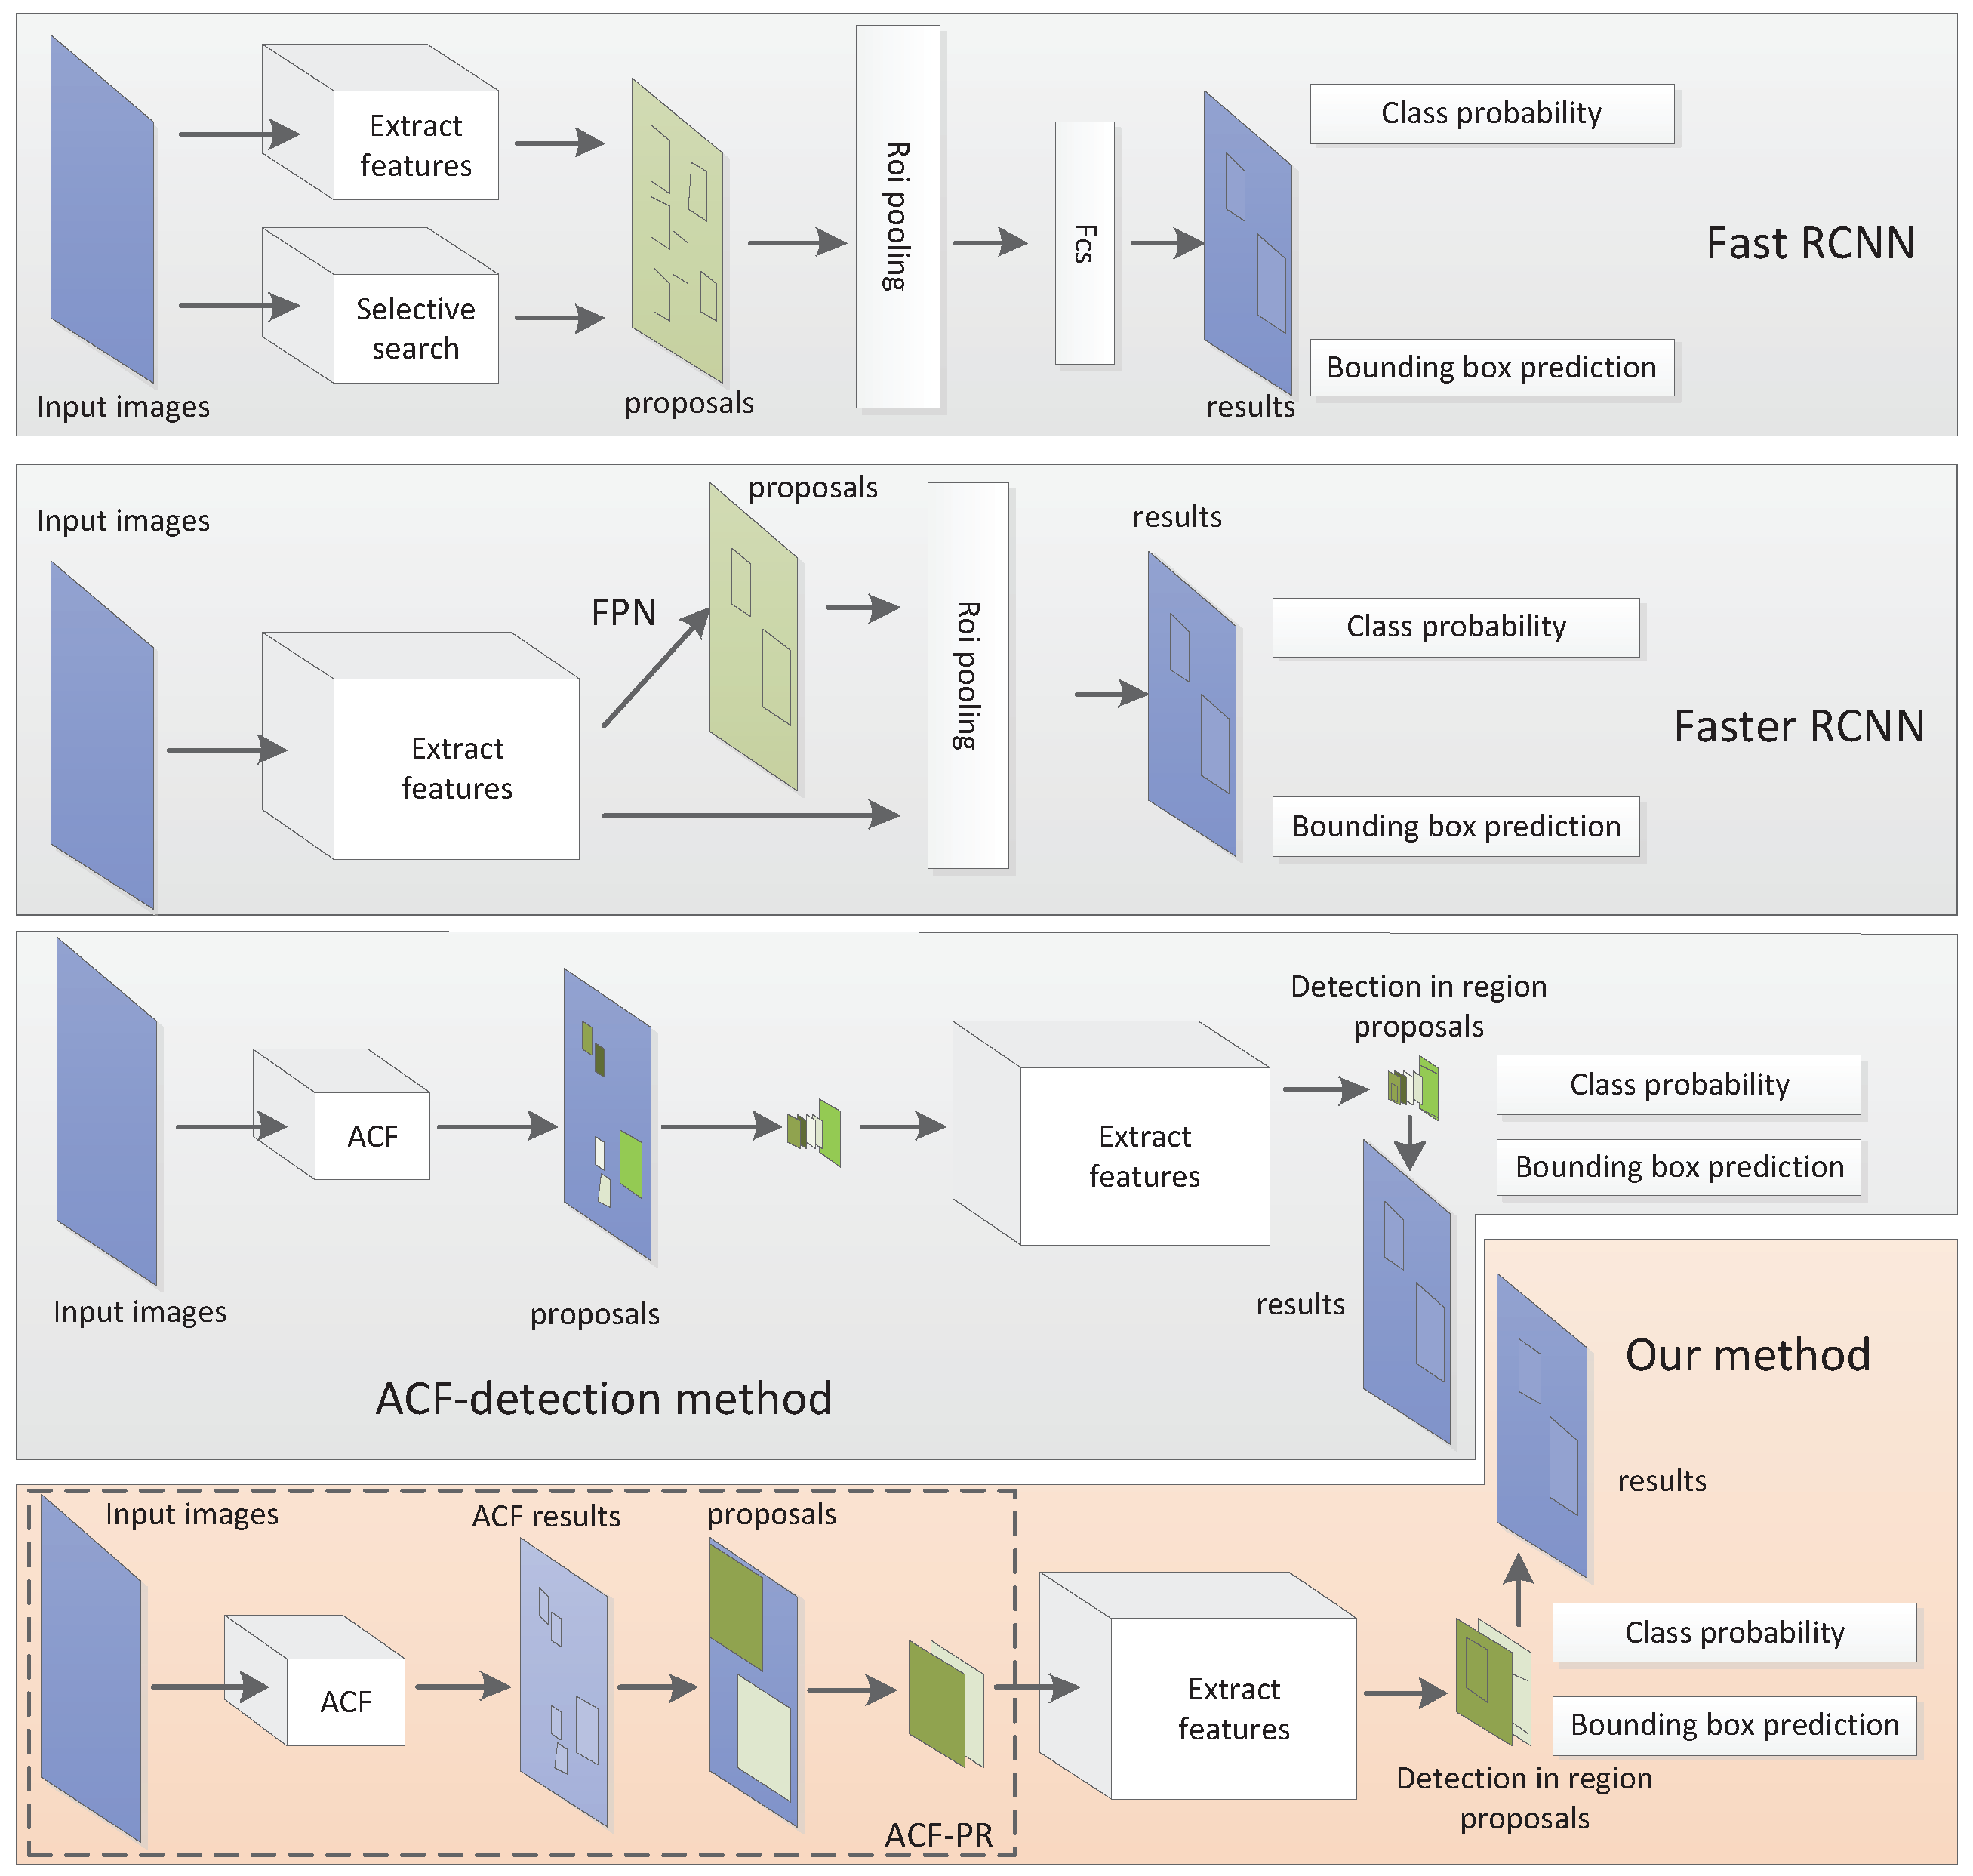
2. Proposed Methods
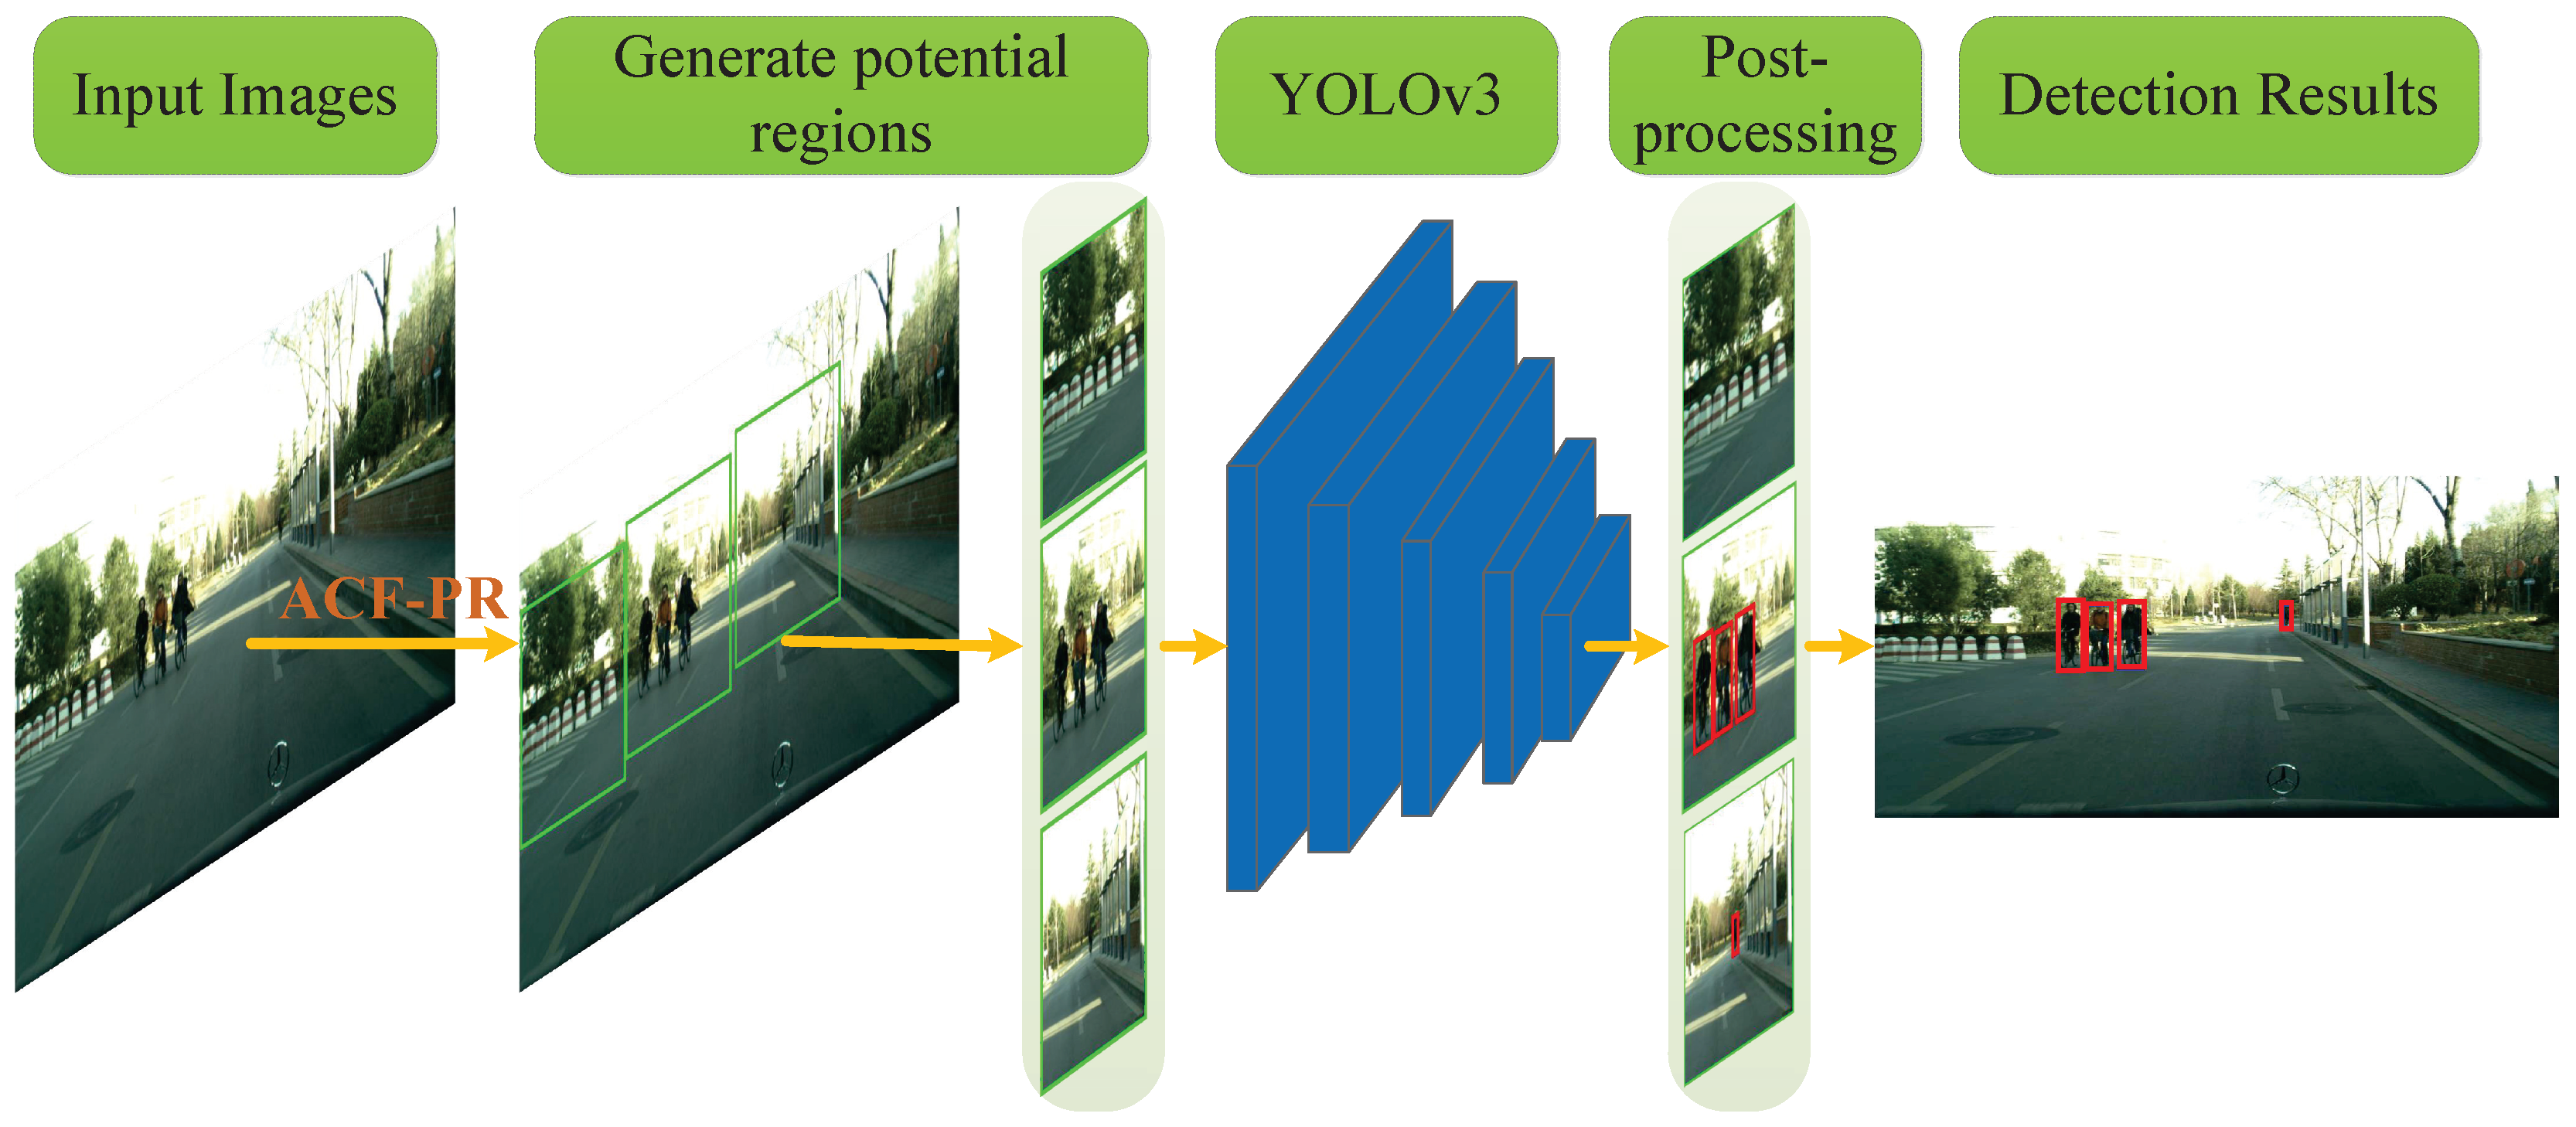
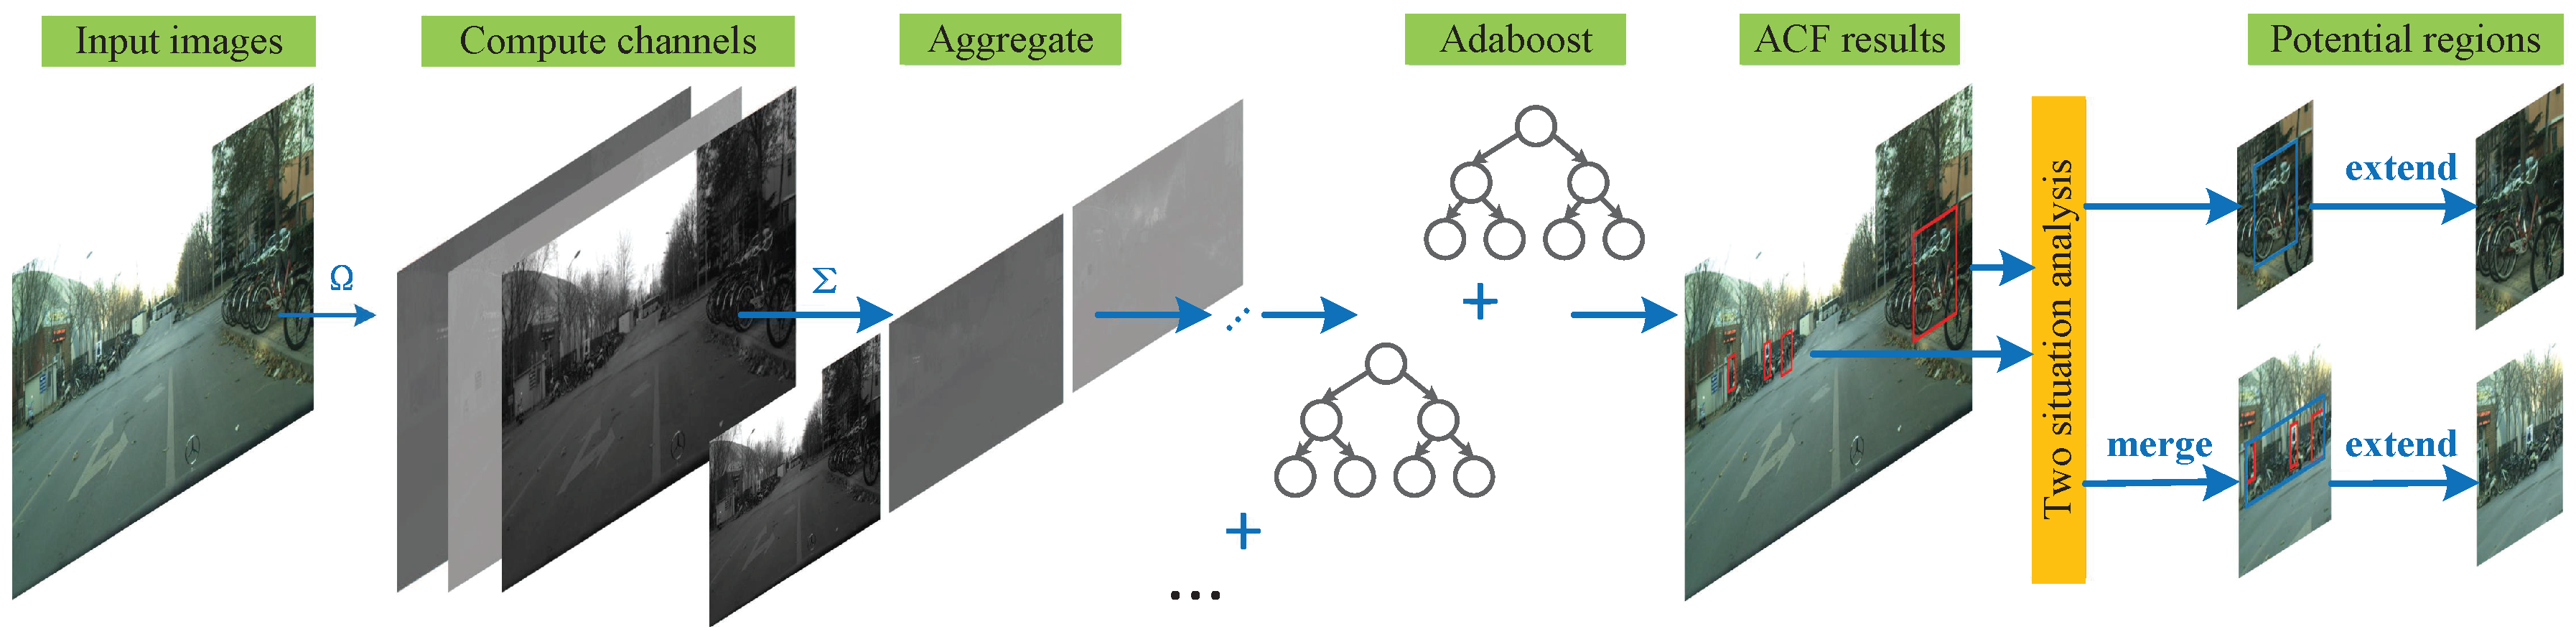
2.1. ACF-PR Region Proposal Generating Method
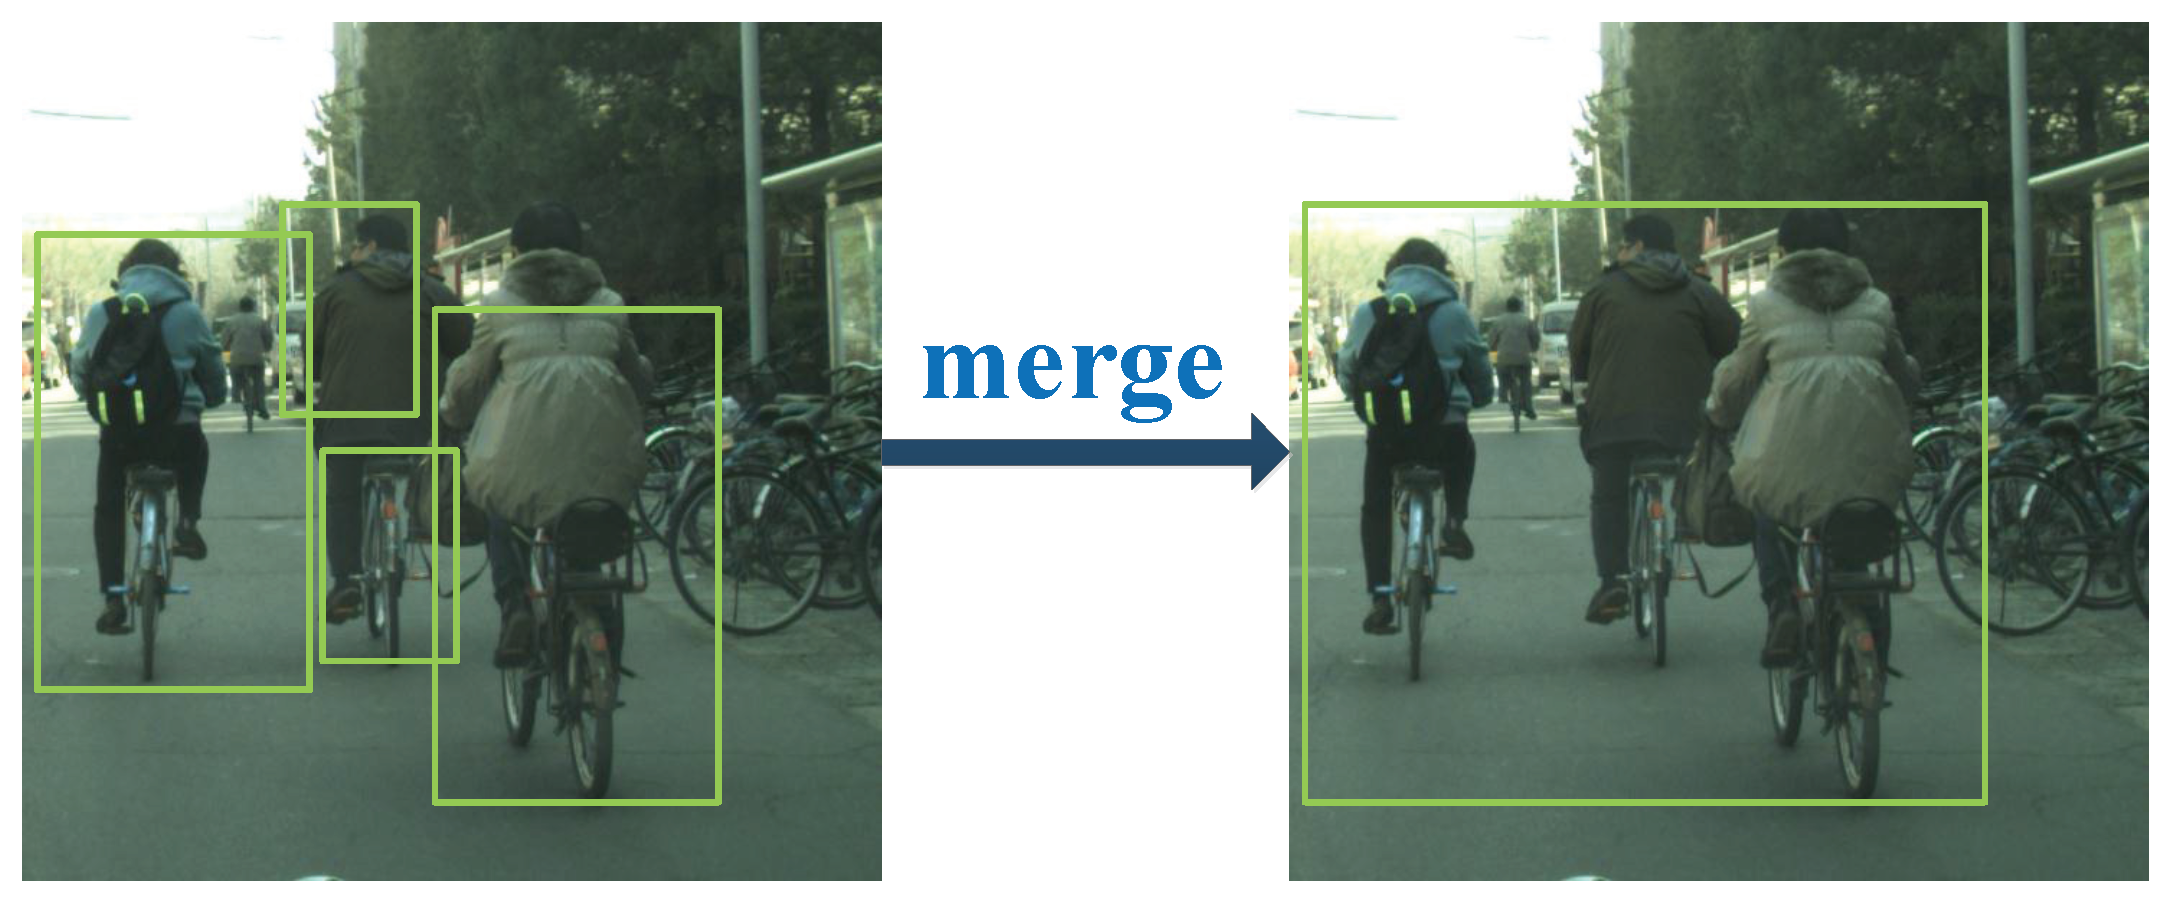
- In one case, each detected cyclist instance is marked with several different bounding boxes. In order to merge bounding boxes into a correct one and get the entire cyclist instance, two small boxes are merged into one when the distance between them is within a certain range. To show the merging process intuitively, an example for merging is provided in Figure 3. We use , to represent the minimum value of the x, y coordinate on two boxes. Then,where, and are the coordinates of the top-left point of two bounding boxes. We use and to represent the maximum distance threshold of two bounding boxes which can be merged on x, y coordinates. The value of and should ensure that the potential regions eliminate the situation where only half of the object is contained. The values of and are fixed to ensure that the potential regions contain the whole objects; hence, both and are set to 832 that is the maximum size of the cyclist instances. and represent the width and height of two bounding boxes. If and satisfy the condition,then, we can get one large bounding box by merging two bounding boxes. Comparing and to get the maximum x coordinate of two bounding boxes. Based on this maximum value, we can calculate the width of merged bounding box. Similarly, and are discriminated and used to calculate the height of merged bounding box.where, represents the top-left point of the merged bounding box and represents the width and height of the merged bounding boxes. After merging two bounding boxes into one large bounding box that may contain one object or several objects. These merged bounding boxes are extended as potential regions and as inputs for the following network.
- In the other case, two bounding boxes are far apart from each other, which means that these boxes are for different instances and do not need to merge. In this case, the bounding box may contain the entire object instance, and sometimes also may contain part of the object instance or just background. For fine detection and localization, these bounding boxes also need to be sent into the following deep network for further detection. If the distance between two bounding boxes is not within a certain range, these boxes are regarded as two separate objects. In order to contain as many entire object instances as possible, these bounding boxes are extended as potential regions and as inputs for the following network.
2.2. YOLO Network for Cyclist Detection
2.3. Post-Processing
3. Experiments
3.1. Dataset and Evaluation Protocol
3.2. Evaluation of the ACF-PR Method
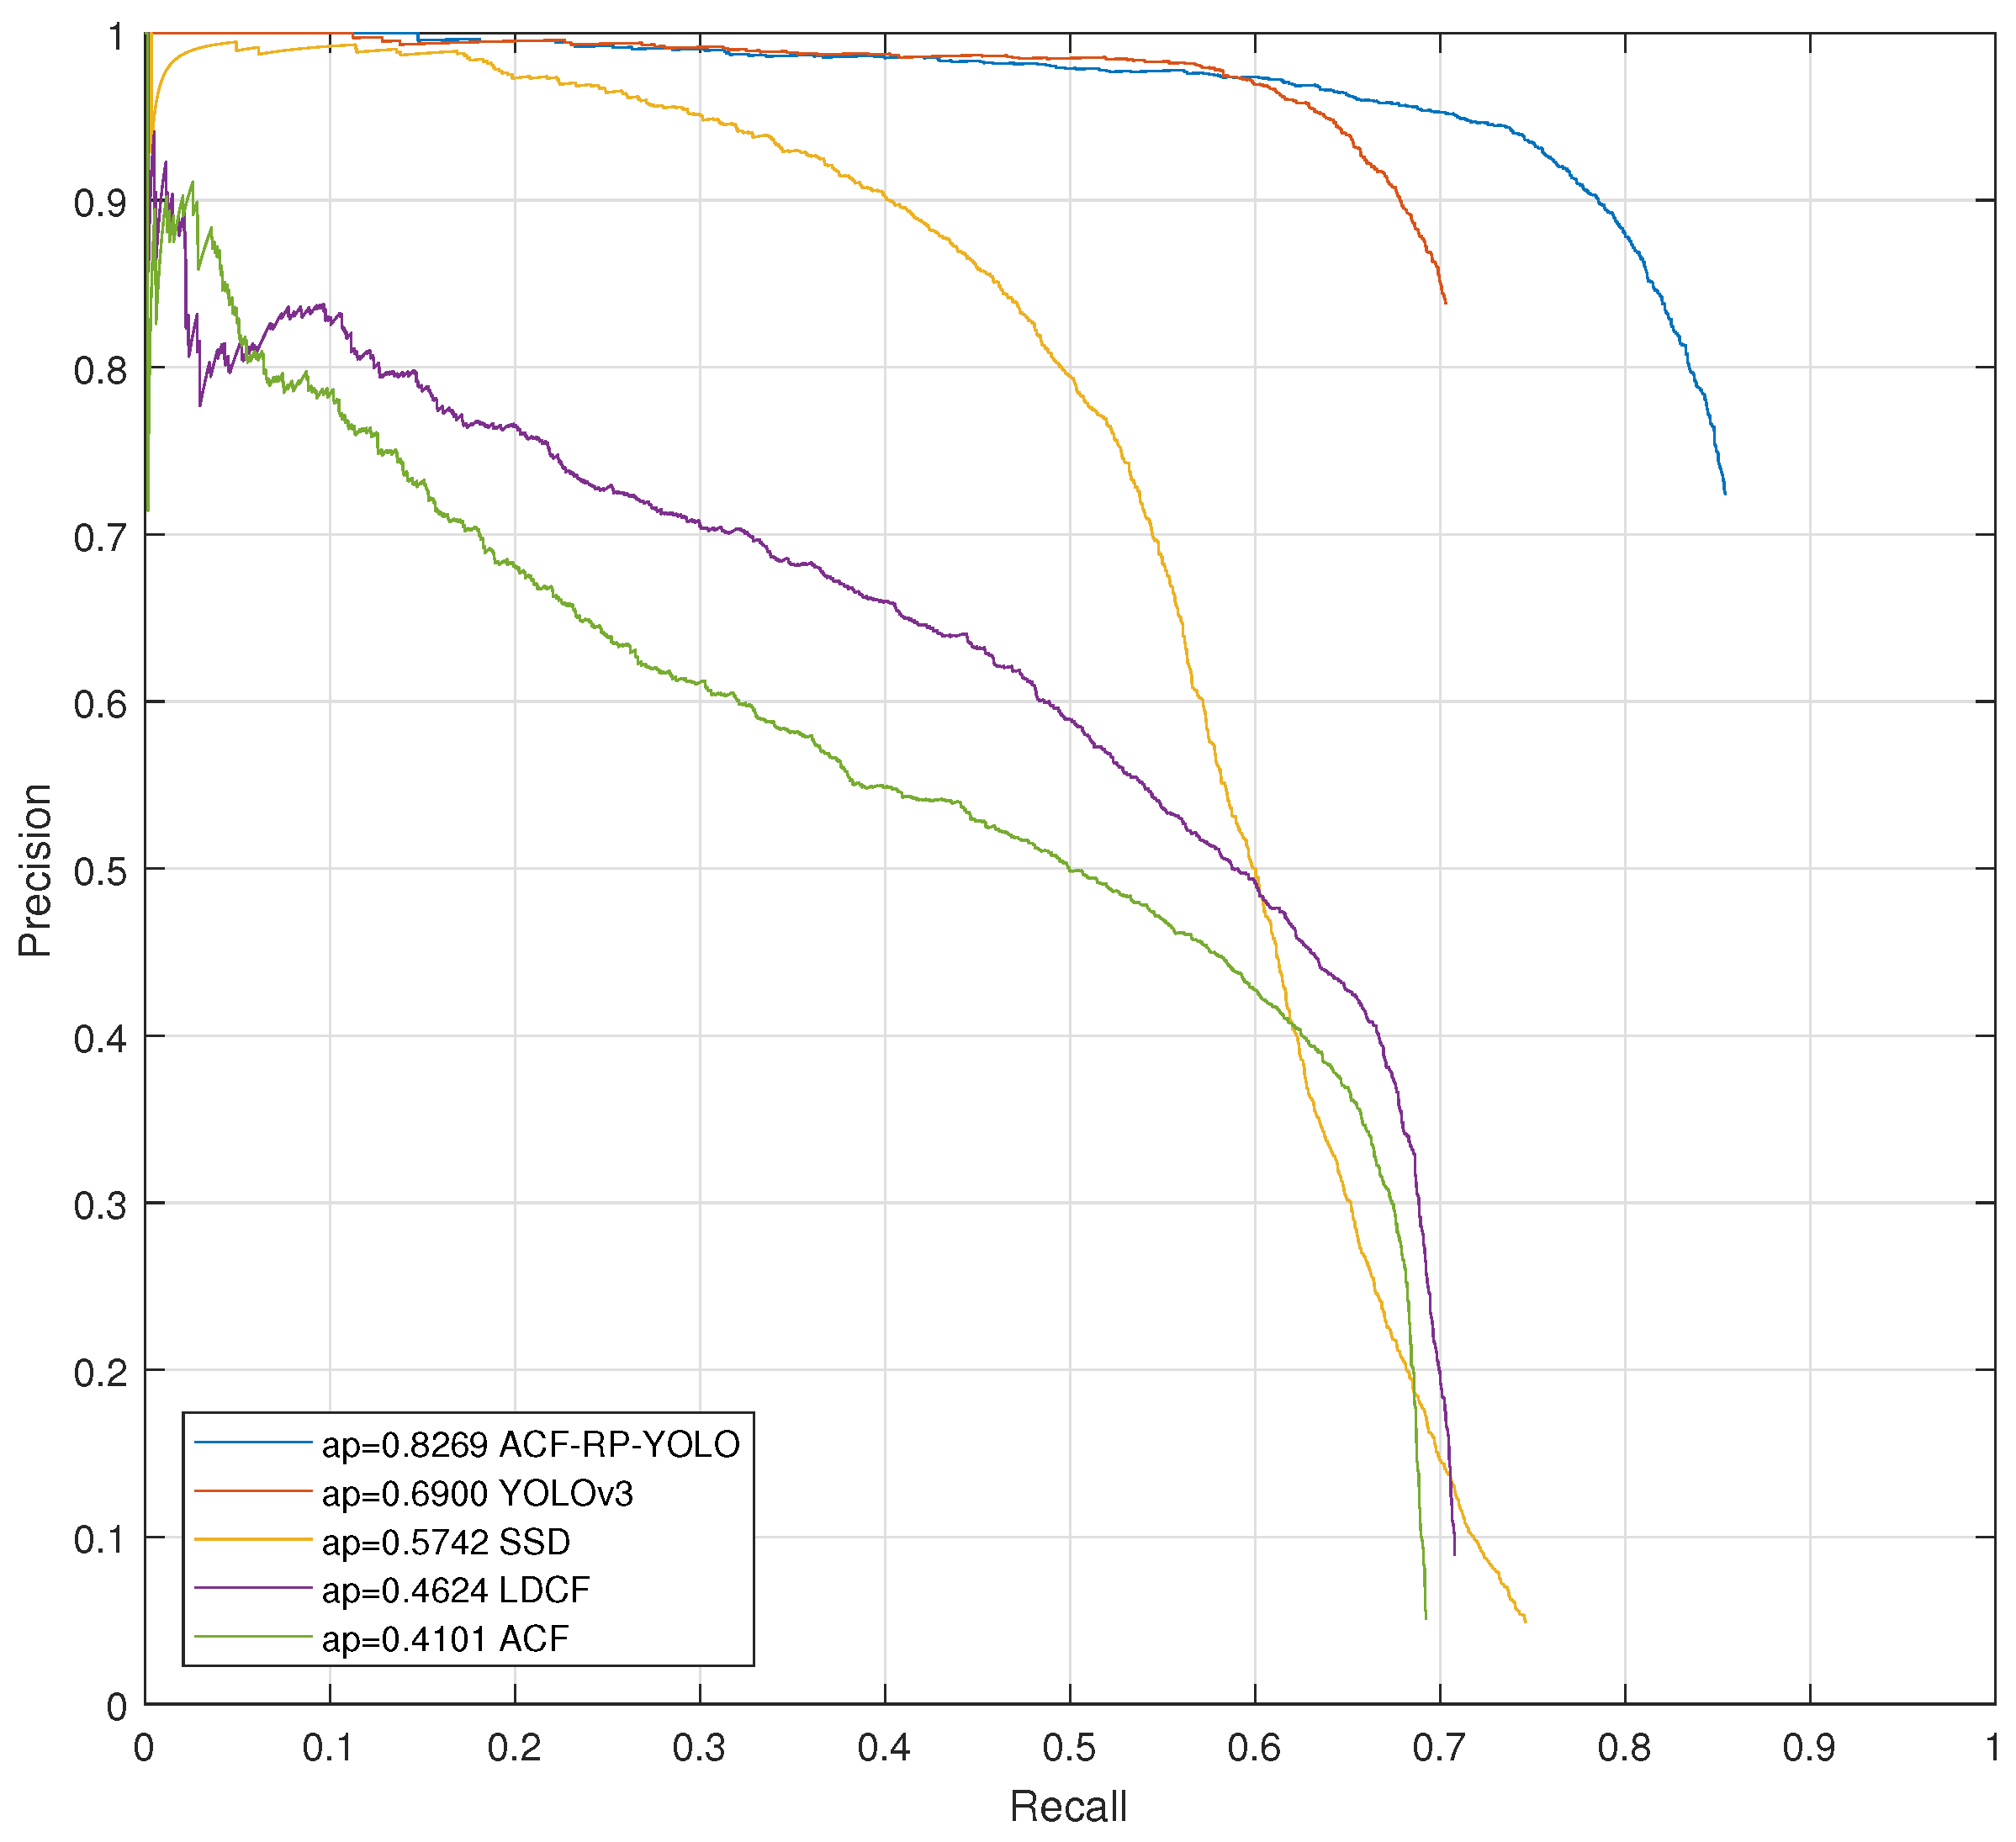
3.3. Comparisons with Other Detection Methods
4. Conclusions
Author Contributions
Funding
Conflicts of Interest
Abbreviations
| ACF | Aggregated channel feature |
| ACF-PR | Aggregated channel feature based region proposal method |
| YOLO | You only look once |
| TDCB | Tsinghua-Daimler cyclist benchmark |
| ADAS | Advanced driver assistance systems |
| VRU | Vulnerable road users |
| HOG | Histogram of oriented gradients |
| SVM | Support vector machine |
| DPM | Deformable part model |
| LDCF | Locally decorrelated channel feature |
| ROI | Region of interest |
| R-CNN | Region based convolutional network |
| Fast R-CNN | Fast region based convolutional network |
| Faster R-CNN | Faster region based convolutional network |
| Fused DNN | fused deep neural network |
| SSD | Single shot multibox detector |
| LUV | CIELUV color space |
| modelDs | Model height and width without padding |
| modelDsPad | Model height and width with padding |
| nNeg | max number of negative windows to sample |
| nAccNeg | max number of negative windows to accumulate |
| NMS | Nom-maximum suppression |
| VGG16 | Visual geometry group network with 16 layers |
| AP | Average precision |
| GPU | Graphics processing unit |
| CPU | Central processing unit |
References
- Kuo, Y.C.; Fu, C.M.; Tsai, C.T.; Lin, C.C.; Chang, G.H. Pedestrian Collision Warning of Advanced Driver Assistance Systems. In Proceedings of the IEEE International Symposium on Computer, Xi’an, China, 4–6 July 2016. [Google Scholar]
- Song, W.; Yang, Y.; Fu, M.; Li, Y.; Wang, M. Lane detection and classification for forward collision warning system based on stereo vision. IEEE Sens. J. 2018, 99, 1. [Google Scholar] [CrossRef]
- Qin, H.; Yan, J.; Li, X.; Hu, X. Joint Training of Cascaded CNN for Face Detection. In Proceedings of the IEEE Conference on Computer Vision and Pattern Recognition, Las Vegas, NV, USA, 27–30 June 2016; pp. 1–10. [Google Scholar]
- Luo, H.; Yang, Y.; Tong, B.; Wu, F.; Fan, B. Traffic sign recognition using a multi-task convolutional neural network. IEEE Trans. Intell. Transp. Syst. 2017, 19, 1100–1111. [Google Scholar] [CrossRef]
- Nam, W.; Dollár, P.; Han, J.H. Local decorrelation for improved pedestrian detection. In Proceedings of the 27th International Conference on Neural Information Processing Systems, Montreal, QC, Canada, 8–13 December 2014; pp. 1–9. [Google Scholar]
- Benenson, R.; Omran, M.; Hosang, J.; Schiele, B. Ten Years of Pedestrian Detection, What Have We Learned? In Proceedings of the European Conference on Computer Vision, Zurich, Switzerland, 6–7 September 2014; pp. 613–627. [Google Scholar]
- Viola, P.; Jones, M.J.; Snow, D. Detecting pedestrians using patterns of motion and appearance. In Proceedings of the Ninth IEEE International Conference on Computer Vision, Nice, France, 13–16 October 2003; pp. 153–161. [Google Scholar]
- Dalal, N.; Triggs, B. Histograms of Oriented Gradients for Human Detection. In Proceedings of the 2005 IEEE Computer Society Conference on Computer Vision and Pattern Recognition (CVPR’05), San Diego, CA, USA, 20–25 June 2005; pp. 886–893. [Google Scholar]
- Felzenszwalb, P.; Mcallester, D.; Ramanan, D. A discriminatively trained, multiscale, deformable part model. IEEE CVPR 2008, 8, 1–8. [Google Scholar]
- Dollár, P.; Tu, Z.; Perona, P.; Belongie, S. Integral Channel Features. Br. Mach. Vis. Conf. 2009, 1, 1–11. [Google Scholar]
- Cao, J.; Pang, Y.; Li, X. Pedestrian detection inspired by appearance constancy and shape symmetry. IEEE Trans. Image Process. 2016, 25, 5538–5551. [Google Scholar] [CrossRef] [PubMed]
- Du, X.; El-Khamy, M.; Lee, J.; Davis, L.S. Fused dnn: A deep neural network fusion approach to fast and robust pedestrian detection. In Proceedings of the 2017 IEEE Winter Conference on Applications of Computer Vision (WACV), Santa Rosa, CA, USA, 24–31 March 2017; pp. 953–961. [Google Scholar]
- Zhang, L.; Lin, L.; Liang, X.; He, K. Is Faster R-CNN Doing Well for Pedestrian Detection? Springer: Cham, Switzerland, 2016. [Google Scholar]
- Paisitkriangkrai, S.; Shen, C.; van den Hengel, A. Pedestrian detection with spatially pooled features and structured ensemble learning. IEEE Trans. Pattern Anal. Mach. Intell. 2016, 38, 1243–1257. [Google Scholar] [CrossRef]
- Tian, Y.; Luo, P.; Wang, X.; Tang, X. Deep learning strong parts for pedestrian detection. In Proceedings of the 2015 IEEE International Conference on Computer Vision (ICCV), Santiago, Chile, 7–13 December 2015; pp. 1904–1912. [Google Scholar]
- Zhang, S.; Benenson, R.; Omran, M.; Hosang, J.; Schiele, B. How far are we from solving pedestrian detection? In Proceedings of the 2016 IEEE Conference on Computer Vision and Pattern Recognition (CVPR), Las Vegas, NV, USA, 27–30 June 2016; pp. 1259–1267. [Google Scholar]
- Li, T.; Cao, X.; Xu, Y. An effective crossing cyclist detection on a moving vehicle. In Proceedings of the IEEE World Congress on Intelligent Control and Automation, Jinan, China, 7–9 July 2010; pp. 368–372. [Google Scholar]
- Yang, K.; Liu, C.; Zheng, J.Y.; Christopher, L.; Chen, Y. Bicyclist detection in large scale naturalistic driving video. In Proceedings of the 17th International IEEE Conference on Intelligent Transportation Systems (ITSC), Qingdao, China, 8–11 October 2014; pp. 1638–1643. [Google Scholar]
- Tian, W.; Lauer, M. Fast Cyclist Detection by Cascaded Detector and Geometric Constraint. In Proceedings of the 2015 IEEE 18th International Conference on Intelligent Transportation Systems, Las Palmas, Spain, 15–18 September 2015; pp. 1286–1291. [Google Scholar]
- Cho, H.; Rybski, P.E.; Zhang, W. Vision-based bicyclist detection and tracking for intelligent vehicles. In Proceedings of the 2010 IEEE Intelligent Vehicles Symposium, San Diego, CA, USA, 21–24 June 2010; pp. 454–461. [Google Scholar]
- Li, X.; Xu, Q.; Xiong, H.; Wang, J.; Li, K.Q. Cyclist detection based on detection proposals and deep convolutional neural networks. J. Tsinghua Univ. 2017, 57, 491–496. [Google Scholar]
- Li, X.; Li, L.; Flohr, F.; Wang, J.; Xiong, H.; Bernhard, M. A Unified Framework for Concurrent Pedestrian and Cyclist Detction. IEEE Trans. Intell. Trans. Syst. 2017, 99, 1–13. [Google Scholar]
- Viola, P.; Jones, M. Robust Real-Time Face Detection. Int. J. Comput. Vis. 2004, 57, 137–154. [Google Scholar] [CrossRef]
- Liu, C.; Chang, F.; Chen, Z.; Liu, D. Fast Traffic Sign Recognition via High-Contrast Region Extraction and Extended Sparse Representation. IEEE Trans. Intell. Trans. Syst. 2016, 17, 79–92. [Google Scholar] [CrossRef]
- Ross, G.; Jeff, D.; Trevor, D.; Jitendra, M. Rich Feature Hierarchies for Accurate Object Detection and Semantic Segmentation. In Proceedings of the IEEE Conference on Computer Vision and Pattern Recognition (CVPR), Columbus, OH, USA, 24–27 June 2014; pp. 580–587. [Google Scholar]
- Ross, G. Fast R-CNN. In Proceedings of the 2015 IEEE International Conference on Computer Vision (ICCV), Santiago, Chile, 7–13 December 2015; pp. 1440–1448. [Google Scholar]
- Ren, S.; He, K.; Girshick, R.; Sun, J. Faster R-CNN: Towards Real-Time Object Detection with Region Proposal Networks. IEEE Trans Patt. Anal. Mach. Intell. 2017, 39, 1137–1149. [Google Scholar] [CrossRef] [PubMed] [Green Version]
- Liu, W.; Anguelov, D.; Erhan, D.; Szegedy, C.; Reed, S.; Fu, C.Y.; Berg, A.C. SSD: Single Shot MultiBox Detector. In Proceedings of the 14th European Conference ECCV 2016, Amsterdam, The Netherlands, 11–14 October 2016; pp. 21–37. [Google Scholar]
- Redmon, J.; Divvala, S.; Girshick, R.; Farhadi, A. You Only Look Once: Unified, Real-Time Object Detection. arXiv 2015, arXiv:1506.02640. [Google Scholar]
- Redmon, J.; Farhadi, A. YOLO9000: Better, faster, stronger. arXiv 2016, arXiv:1612.08242. [Google Scholar]
- Redmon, J.; Farhadi, A. YOLOv3: An Incremental Improvement. arXiv 2018, arXiv:1804.02767. [Google Scholar]
- Everingham, M.; Van Gool, L.; Williams, C.K.I.; Winn, J.; Zisserman, A. The Pascal Visual Object Classes (VOC) challenge. Int. J. Comput. Vis. 2010, 88, 303–338. [Google Scholar] [CrossRef]
- Geiger, A.; Lenz, P.; Urtasun, R. Are we ready for autonomous driving? The kitti vision benchmark suite. In Proceedings of the 2012 IEEE Conference on Computer Vision and Pattern Recognition, Providence, RI, USA, 16–21 June 2012; pp. 3354–3361. [Google Scholar]
- Lin, T.Y.; Maire, M.; Belongie, S.; Hays, J.; Perona, P.; Ramanan, D.; Dollár, P.; Zitnick, C.L. Microsoft Coco: Common Objects in Context; Springer: Cham, Switzerland, 2014; pp. 740–755. [Google Scholar]
- Deng, J.; Dong, W.; Socher, R.; Li, L.J.; Li, K.; Li, F.-F. Imagenet: A large-scale hierarchical image database. In Proceedings of the 2009 IEEE Conference on Computer Vision and Pattern Recognition, Miami, FL, USA, 20–25 June 2009; pp. 248–255. [Google Scholar]
- Gao, Z.; Li, S.; Chen, J.; Li, Z. Pedestrian Detection Method Based on YOLO Network. Comput. Eng. 2018, 44, 215–219. [Google Scholar]
- Laroca, R.; Severo, E.; Zanlorensi, L.A.; Oliverira, L.S.; Goncalves, G.R.; Schwartz, W.R.; Menotti, D. A Robust Real-Time Automatic License Plate Recognition based on the YOLO Detector. arXiv 2018, arXiv:1802.09568. [Google Scholar]
- Chen, H.C.; Cheng, Y.; Zhang, C.Y. Concolutional Neural Network Applied on Fast Vehicle Objects Detection. J. Softw. 2017, 28 (Suppl. 1), 107–114. [Google Scholar]
- Arcos-García, Á.; Álvarez-García, J.A.; Soria-Morillo, L.M. Evalution of Deep Neural Networks for traffic sign detection systems. Neurocomputing 2018, 316, 332–344. [Google Scholar] [CrossRef]
- Dollár, P.; Appel, R.; Belongie, S.; Perona, P. Fast feature pyramids for object detection. IEEE Trans. Pattern Anal. Mach. Intell. 2014, 36, 1532–1545. [Google Scholar] [CrossRef]
- Li, X.; Flohr, F.; Yang, Y.; Xiong, H.; Braun, M.; Pan, S.; Li, K.; Gavrila, D. A new benchmark for vision-based cyclist detection. In Proceedings of the 2016 IEEE Intelligent Vehicels Symposium (IV), Gothenburg, Sweden, 19–22 June 2016; pp. 1028–1033. [Google Scholar]
- He, K.; Zhang, X.; Ren, S.; Sun, J. Deep residual learning for image recognition. In Proceedings of the 2016 IEEE Conference on Computer Vision and Pattern Recognition (CVPR), Las Vegas, NV, USA, 27–30 June 2016; pp. 770–778. [Google Scholar]
- Ioffe, S.; Szegedy, C. Batch normalization: Accelerating deep network training by reducing internal covariate shift. arXiv 2015, arXiv:1502.03167. [Google Scholar]
- Lin, T.; Dollár, P.; Girshick, R.; He, K.; Hariharan, B.; Belongie, S. Feature pyramid networks for object detection. arXiv 2016, arXiv:1612.03144v2. [Google Scholar]


| Type | Filters | Size | Output | |
|---|---|---|---|---|
| conv | 32 | |||
| conv | 64 | |||
| conv | 32 | |||
| conv | 64 | |||
| shortcut | ||||
| conv | 128 | |||
| conv | 64 | |||
| conv | 128 | |||
| shortcut | ||||
| conv | 256 | |||
| conv | 128 | |||
| conv | 256 | |||
| shortcut | ||||
| conv | 512 | |||
| conv | 256 | |||
| conv | 512 | |||
| shortcut | ||||
| conv | 1024 | |||
| conv | 512 | |||
| conv | 1024 | |||
| shortcut | ||||
| conv | 512 | |||
| conv | 1024 | |||
| conv | 18 | |||
| detection | ||||
| route | ||||
| conv | 256 | |||
| upsample | ||||
| route | ||||
| conv | 256 | |||
| conv | 512 | |||
| conv | 18 | |||
| detection | ||||
| route | ||||
| conv | 128 | |||
| upsample | ||||
| route | ||||
| conv | 128 | |||
| conv | 256 | |||
| conv | 18 | |||
| detection |
| Region Proposal Method | Detection Rate (%) |
|---|---|
| ACF-PR | |
| ACF |
| Method | Code Type | AP (%) | Time (s) |
|---|---|---|---|
| ACF-RP-YOLO | MATLAB+C | 82.69% | 0.35 |
| YOLOv3 [31] | C | 69.00% | 0.03 |
| SSD [28] | PYTHON | 57.42% | 0.15 |
| LDCF [5] | MATLAB | 46.24% | 1.5 |
| ACF [40] | MATLAB | 41.01% | 0.18 |
| Parts of ACF-PR-YOLO | Time (s) | Code Type |
|---|---|---|
| ACF-RP | 0.18 | MATLAB |
| YOLOv3 | 0.164 | C |
| post-processing | 0.003 | MATLAB |
© 2019 by the authors. Licensee MDPI, Basel, Switzerland. This article is an open access article distributed under the terms and conditions of the Creative Commons Attribution (CC BY) license (http://creativecommons.org/licenses/by/4.0/).
Share and Cite
Liu, C.; Guo, Y.; Li, S.; Chang, F. ACF Based Region Proposal Extraction for YOLOv3 Network Towards High-Performance Cyclist Detection in High Resolution Images. Sensors 2019, 19, 2671. https://doi.org/10.3390/s19122671
Liu C, Guo Y, Li S, Chang F. ACF Based Region Proposal Extraction for YOLOv3 Network Towards High-Performance Cyclist Detection in High Resolution Images. Sensors. 2019; 19(12):2671. https://doi.org/10.3390/s19122671
Chicago/Turabian StyleLiu, Chunsheng, Yu Guo, Shuang Li, and Faliang Chang. 2019. "ACF Based Region Proposal Extraction for YOLOv3 Network Towards High-Performance Cyclist Detection in High Resolution Images" Sensors 19, no. 12: 2671. https://doi.org/10.3390/s19122671
APA StyleLiu, C., Guo, Y., Li, S., & Chang, F. (2019). ACF Based Region Proposal Extraction for YOLOv3 Network Towards High-Performance Cyclist Detection in High Resolution Images. Sensors, 19(12), 2671. https://doi.org/10.3390/s19122671