Smart Petri Nets Temperature Control Framework for Reducing Building Energy Consumption


Abstract
:1. Introduction
2. Petri Nets
3. Pid Controller
- The P term () is proportional to the current value of the error e(t). For example, if the error is large and positive, the control output will be proportionately large and positive, taking into account the gain factor “”. Using proportional control alone will result in an error between r(t) signal and y(t) because it requires an error to generate the proportional response. If there is no error, there is no corrective response.
- The I term () accounts for past values of the error and integrates them over time. For example, if there is a residual error after the application of proportional control, the integral term seeks to eliminate the residual error by adding a control effect due to the cumulative historical value of the error. When the error is eliminated, the integral term will cease to grow. This will result in the proportional effect diminishing as the error decreases, but this is compensated for by the growing integral effect.
- The D term () predicts system behavior and thus improves settling time and stability of the system. It is also the best estimate of the future trend of the error, based on its current rate of change. It is sometimes called “anticipatory control”, as it is effectively seeking to reduce the effect of the error by exerting a control influence generated by the rate of error change. The more rapid the change, the greater the controlling or dampening effect.
4. User Identification
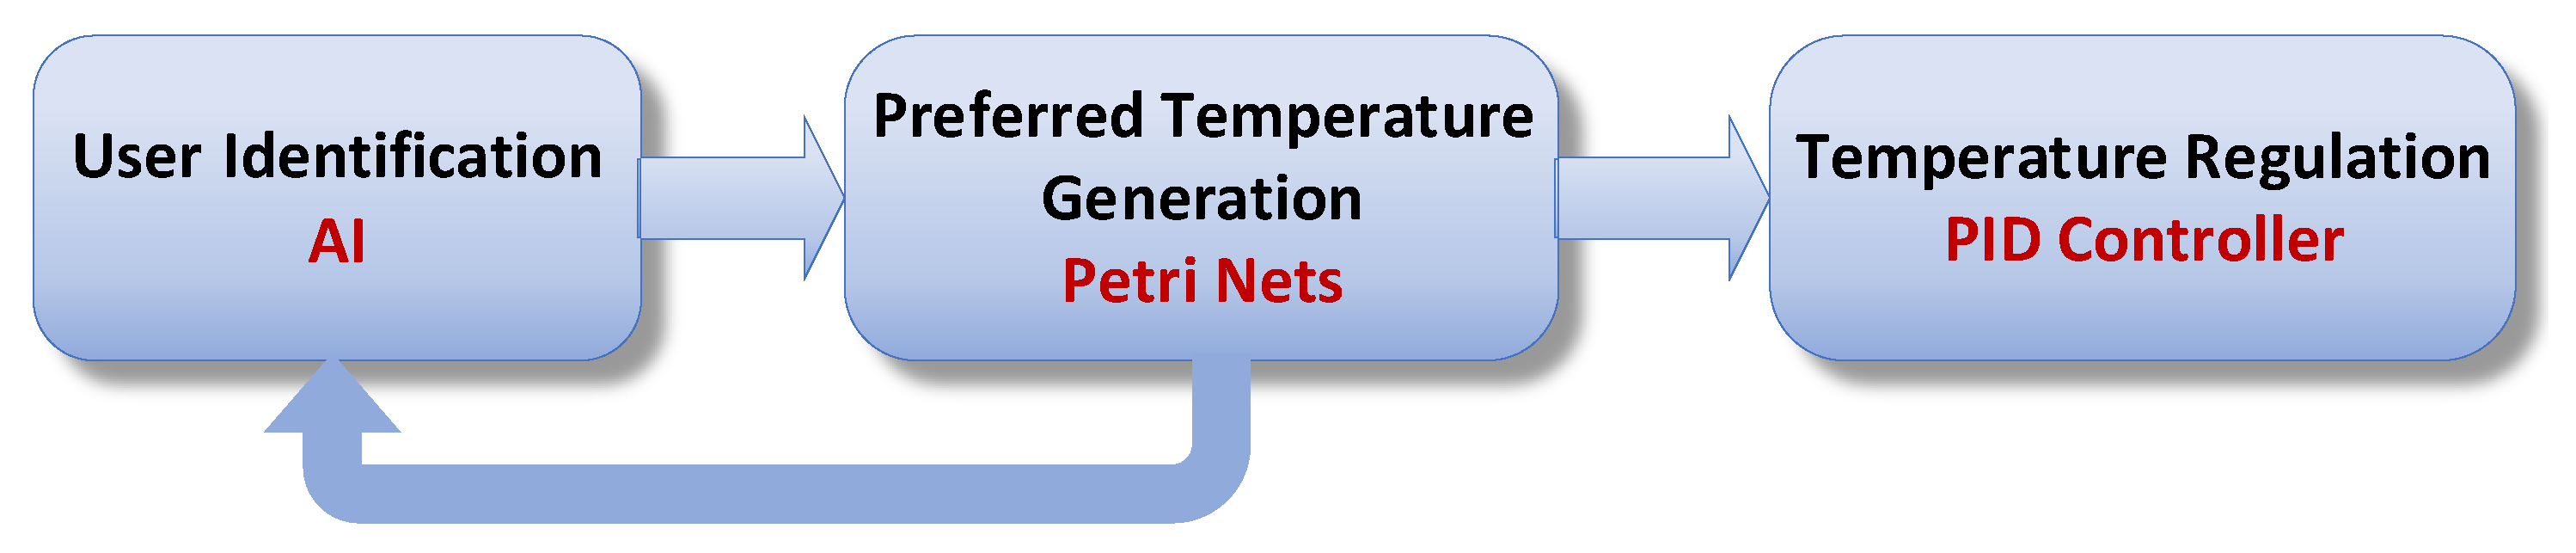
5. Smart Temperature Control Framework
- monitor the presence at the office,
- detect a new presence,
- identify the detected person,
- generate his preferred temperature,
- send this temperature as a reference signal for temperature regulation,
- guarantee that the ambient temperature in the room reaches this reference temperature,
- finally, goes into standby state or in the off state in the absence of anyone.
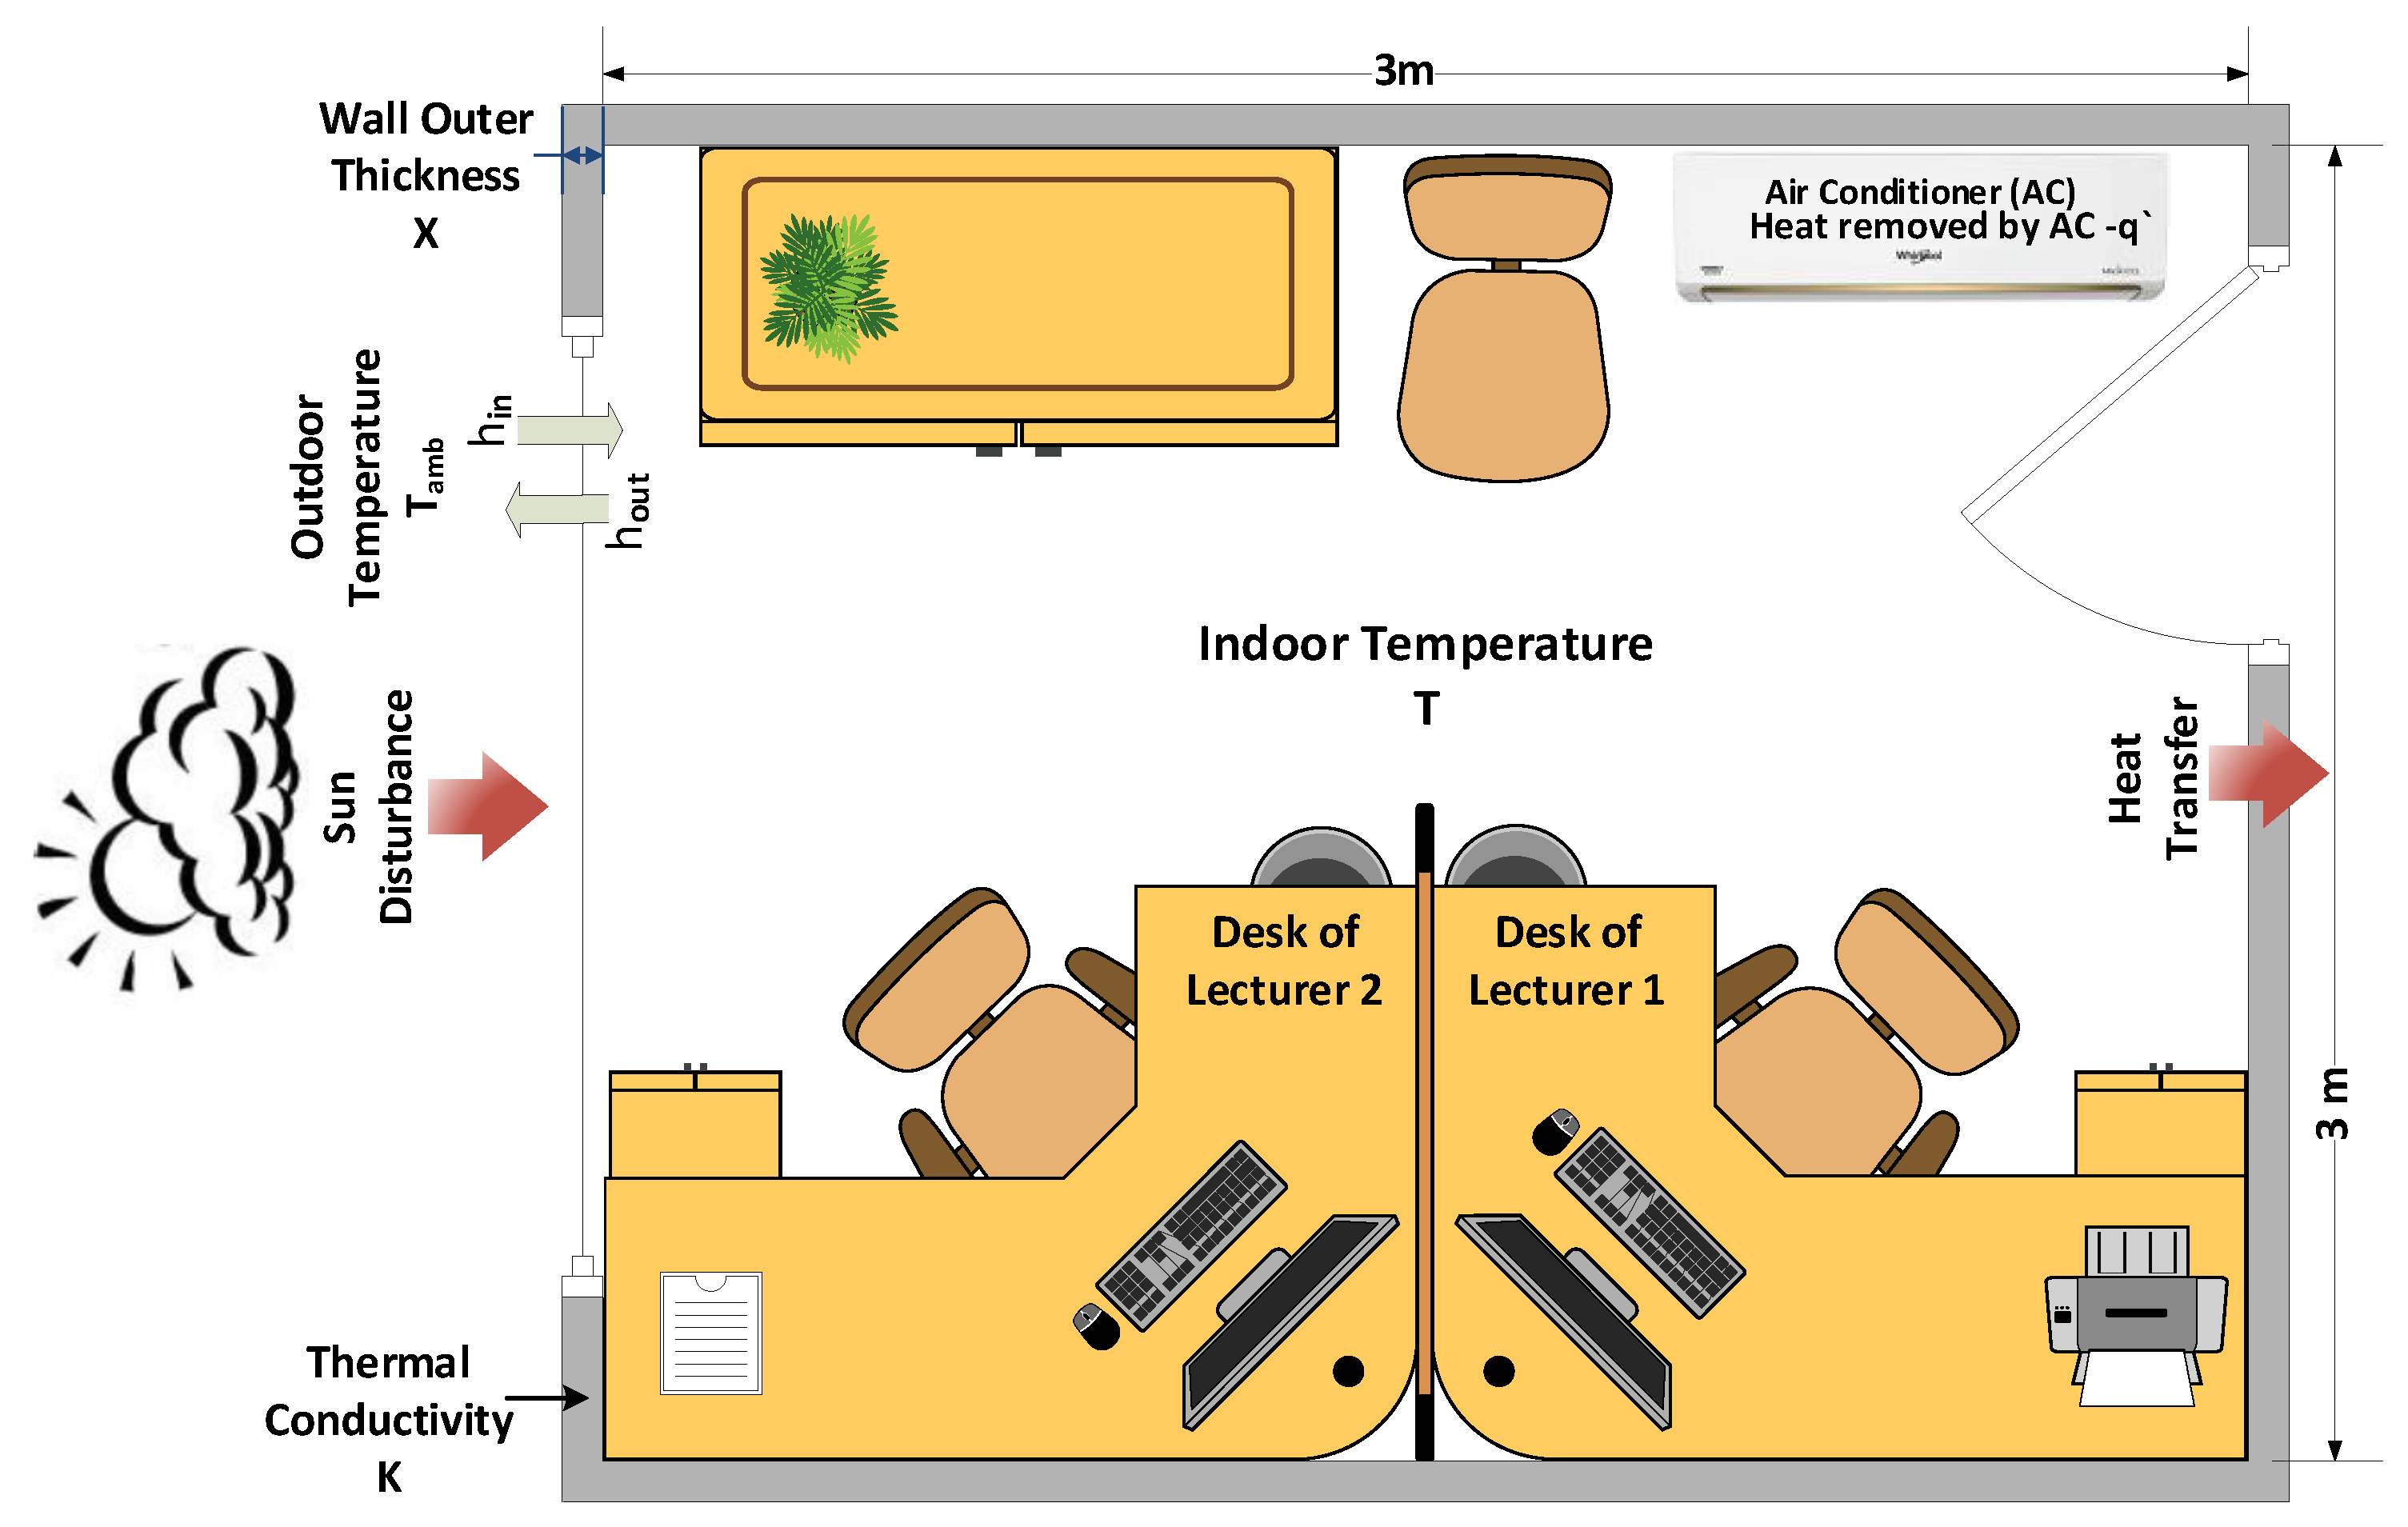
6. Case Study
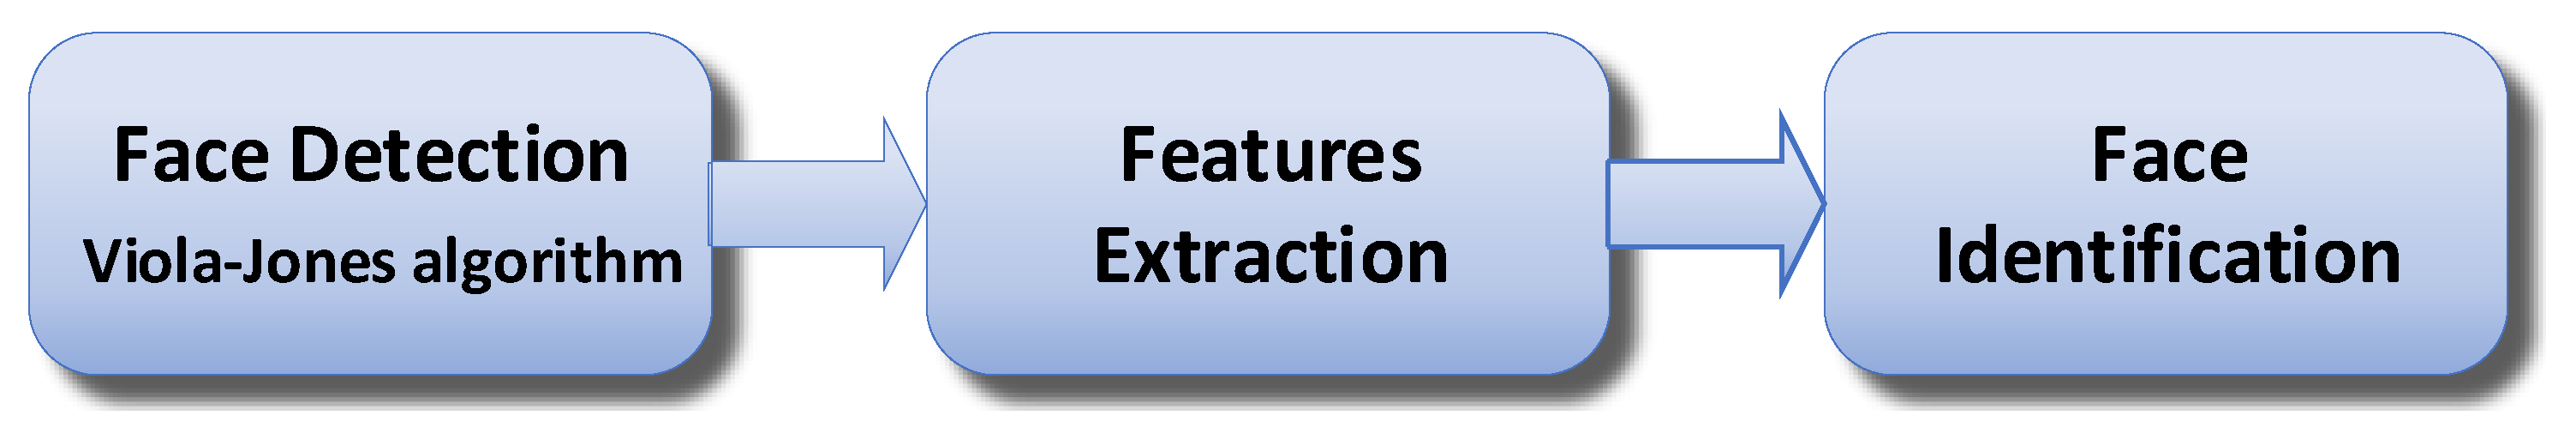
6.1. Stage 1: User Identification
- Step 1:
- Face detection (using Viola-Jones algorithm)
- Step 2:
- Feature extraction
- Step 3:
- Face identification
6.2. Stage 2: Desired Temperature Generation Using a Supervisor PN
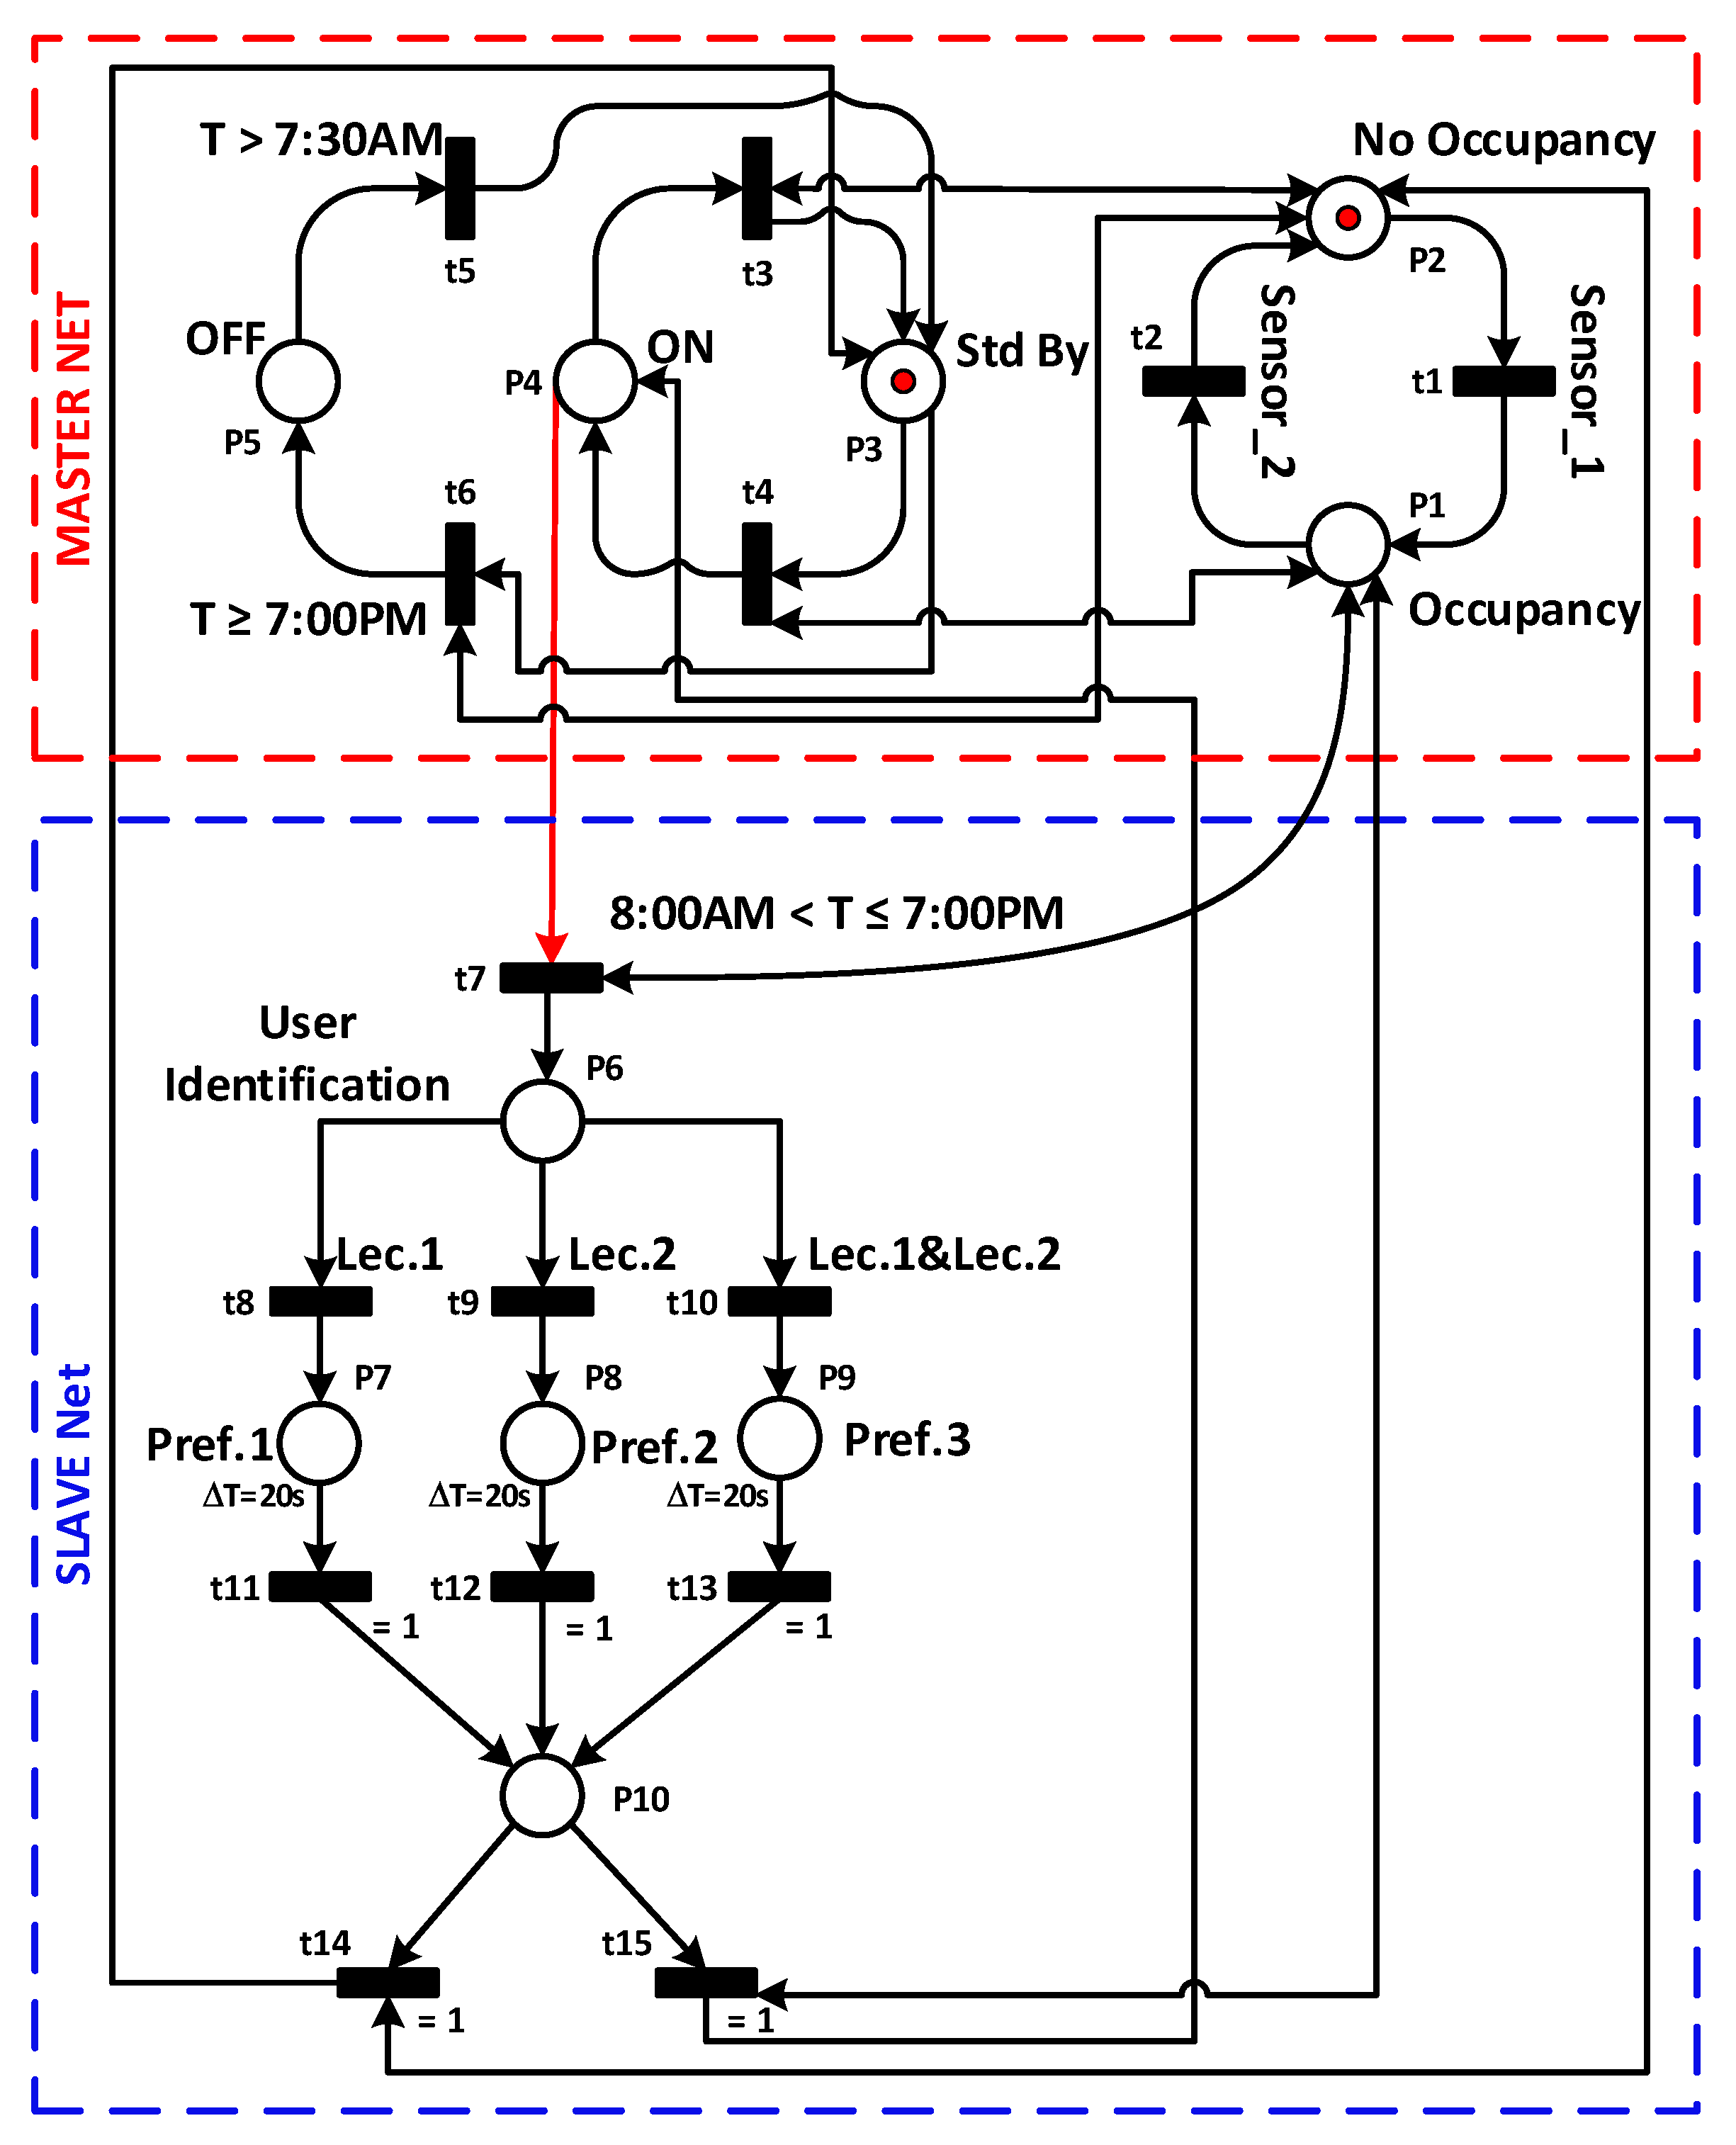
6.2.1. Master PN
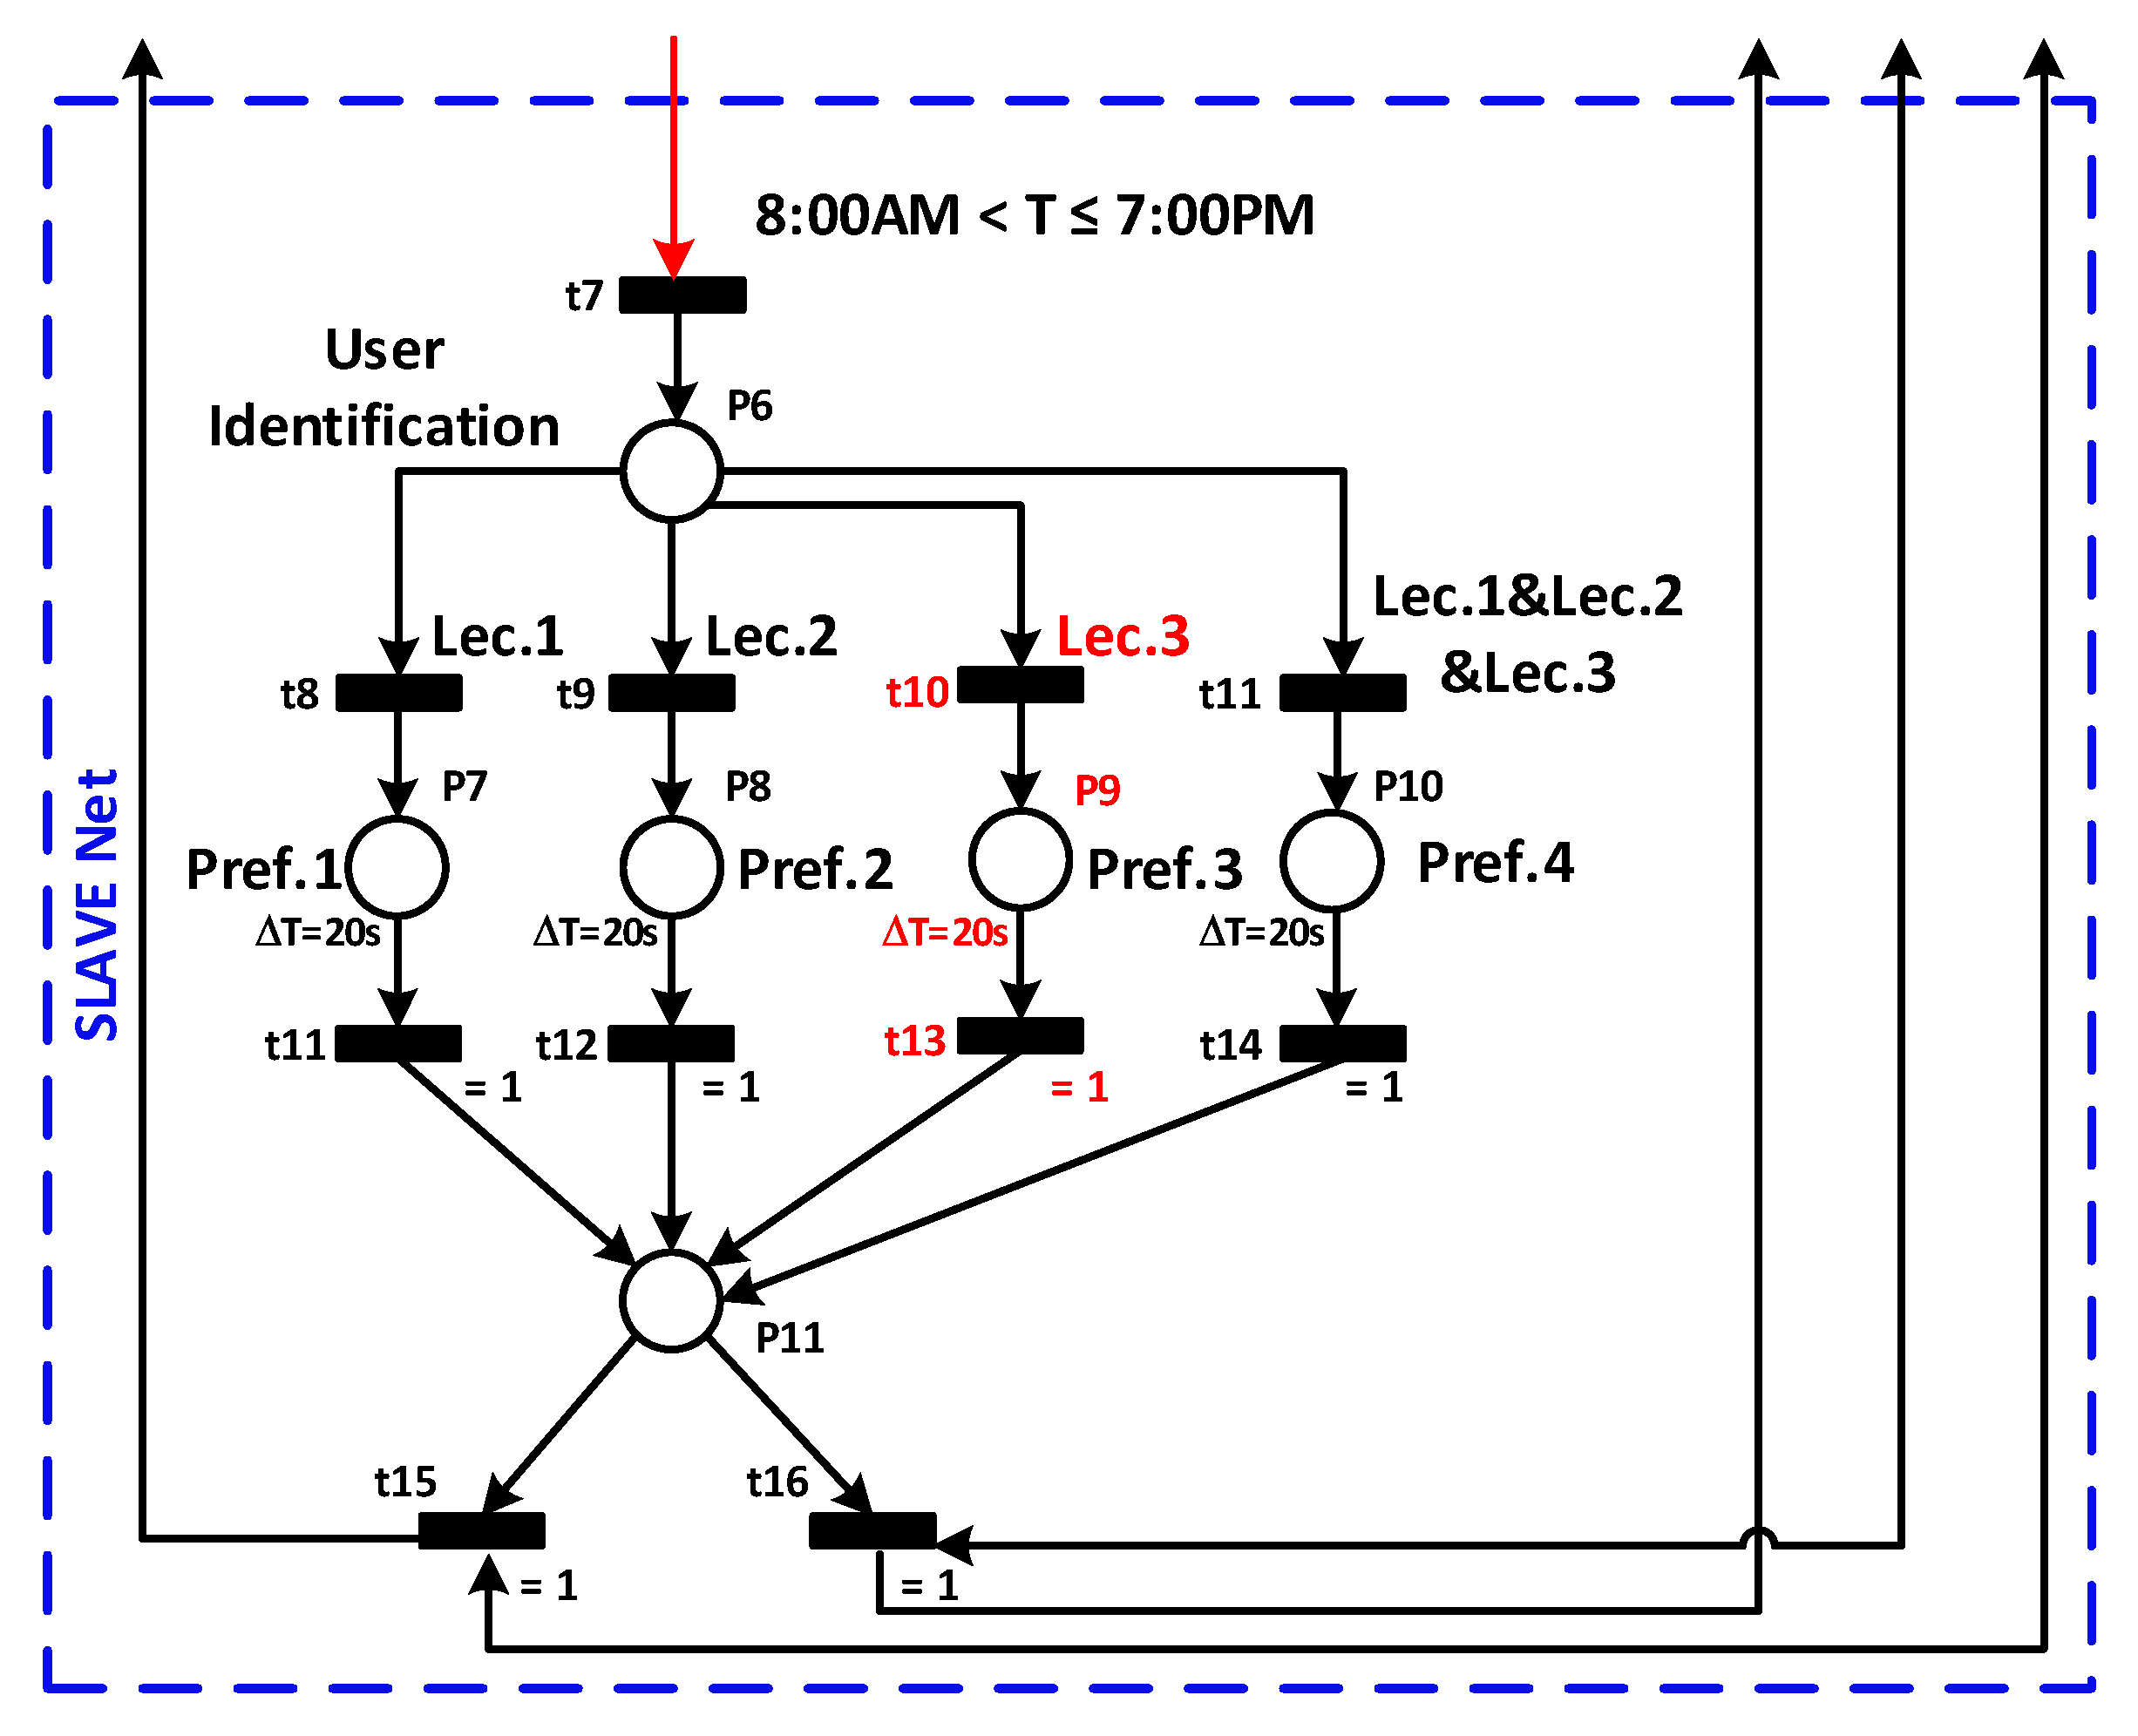
6.2.2. Slave PN
- The first case is that the identified lecturer is , then his preferred reference temperature will be sent to the third stage (PID controller).
- The second case when is identified in the office. In this case, the preferred reference temperature sent to the third stage will be .
- In the last case the and will be present in the office simultaneously, then the reference temperature , on which and have agreed, will be sent to the third stage.
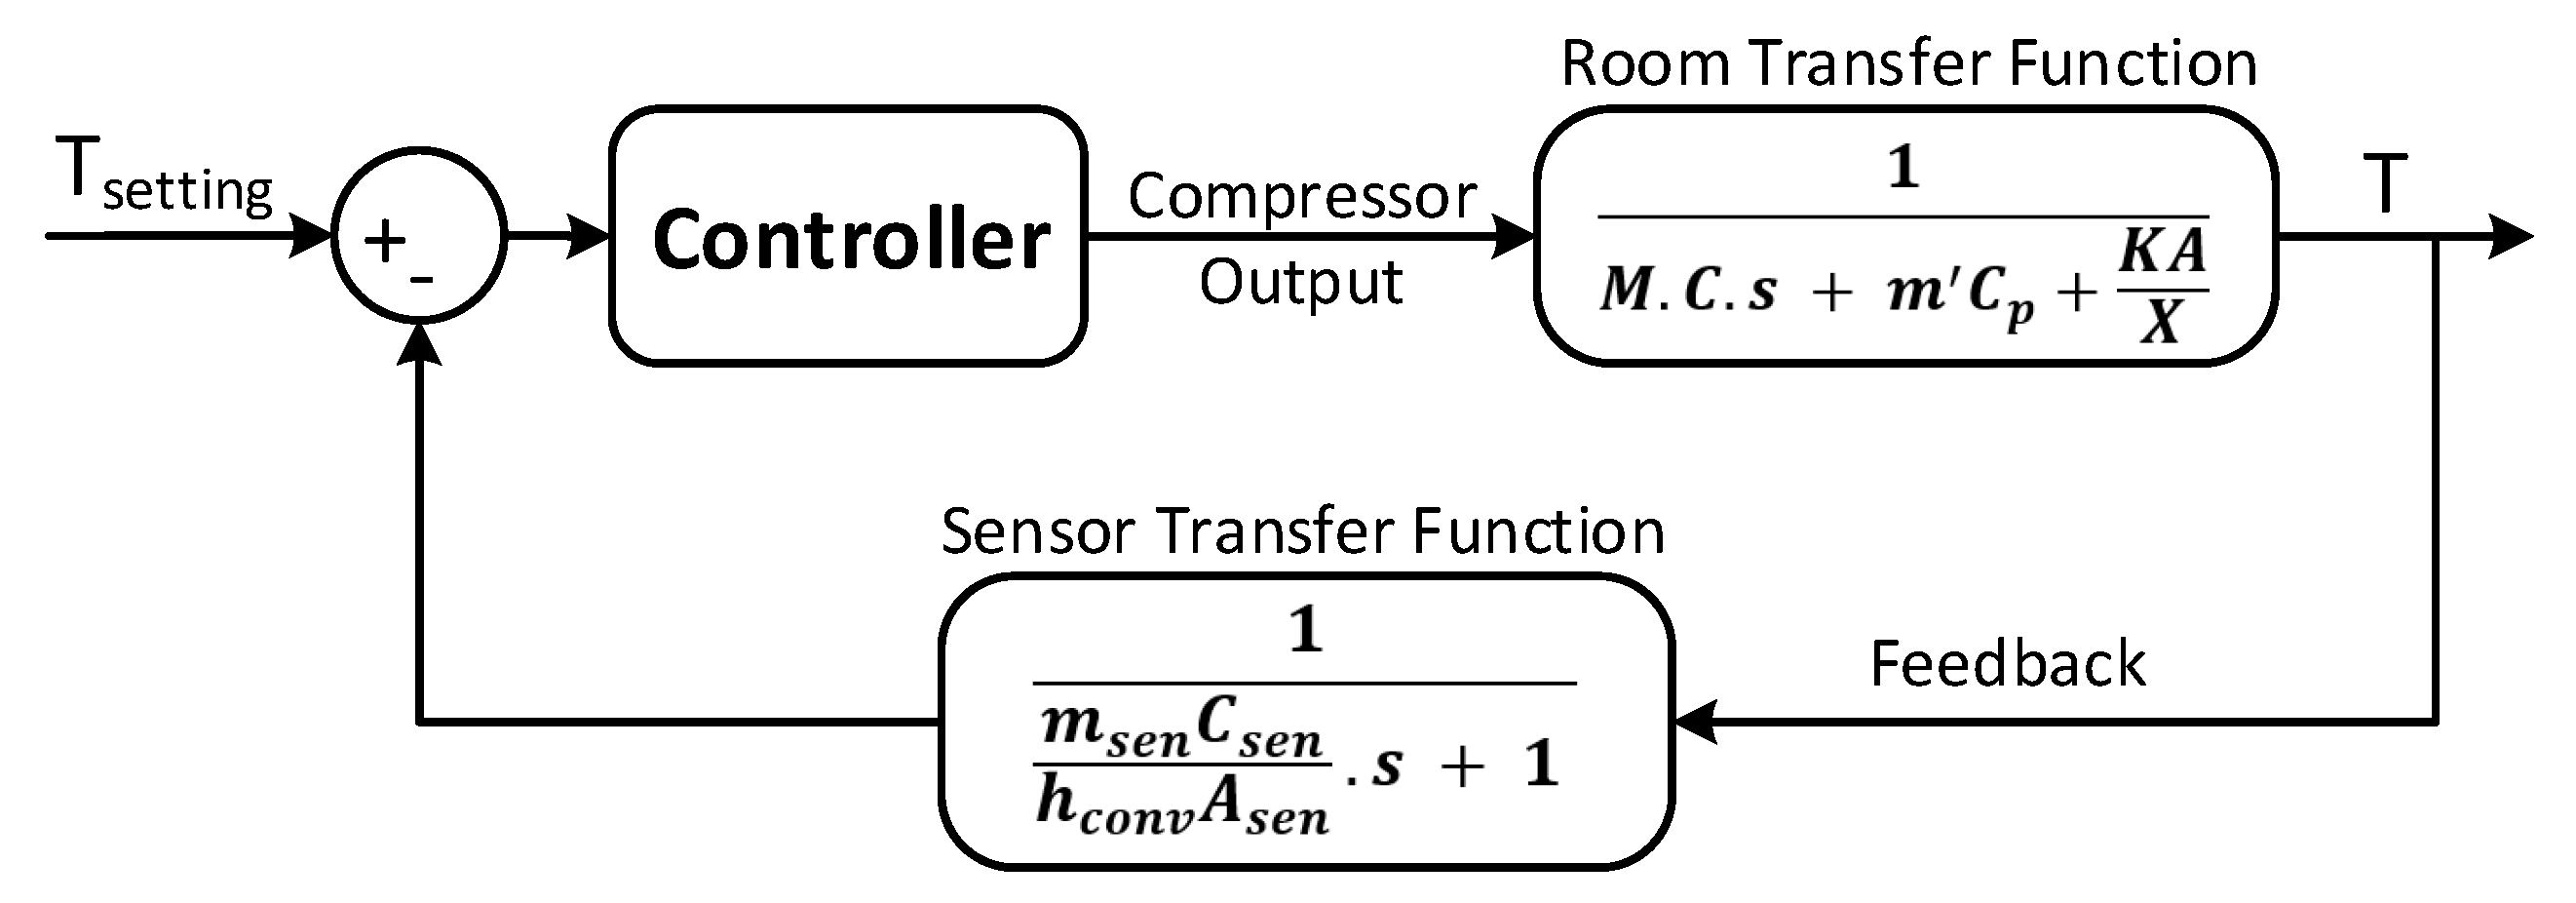
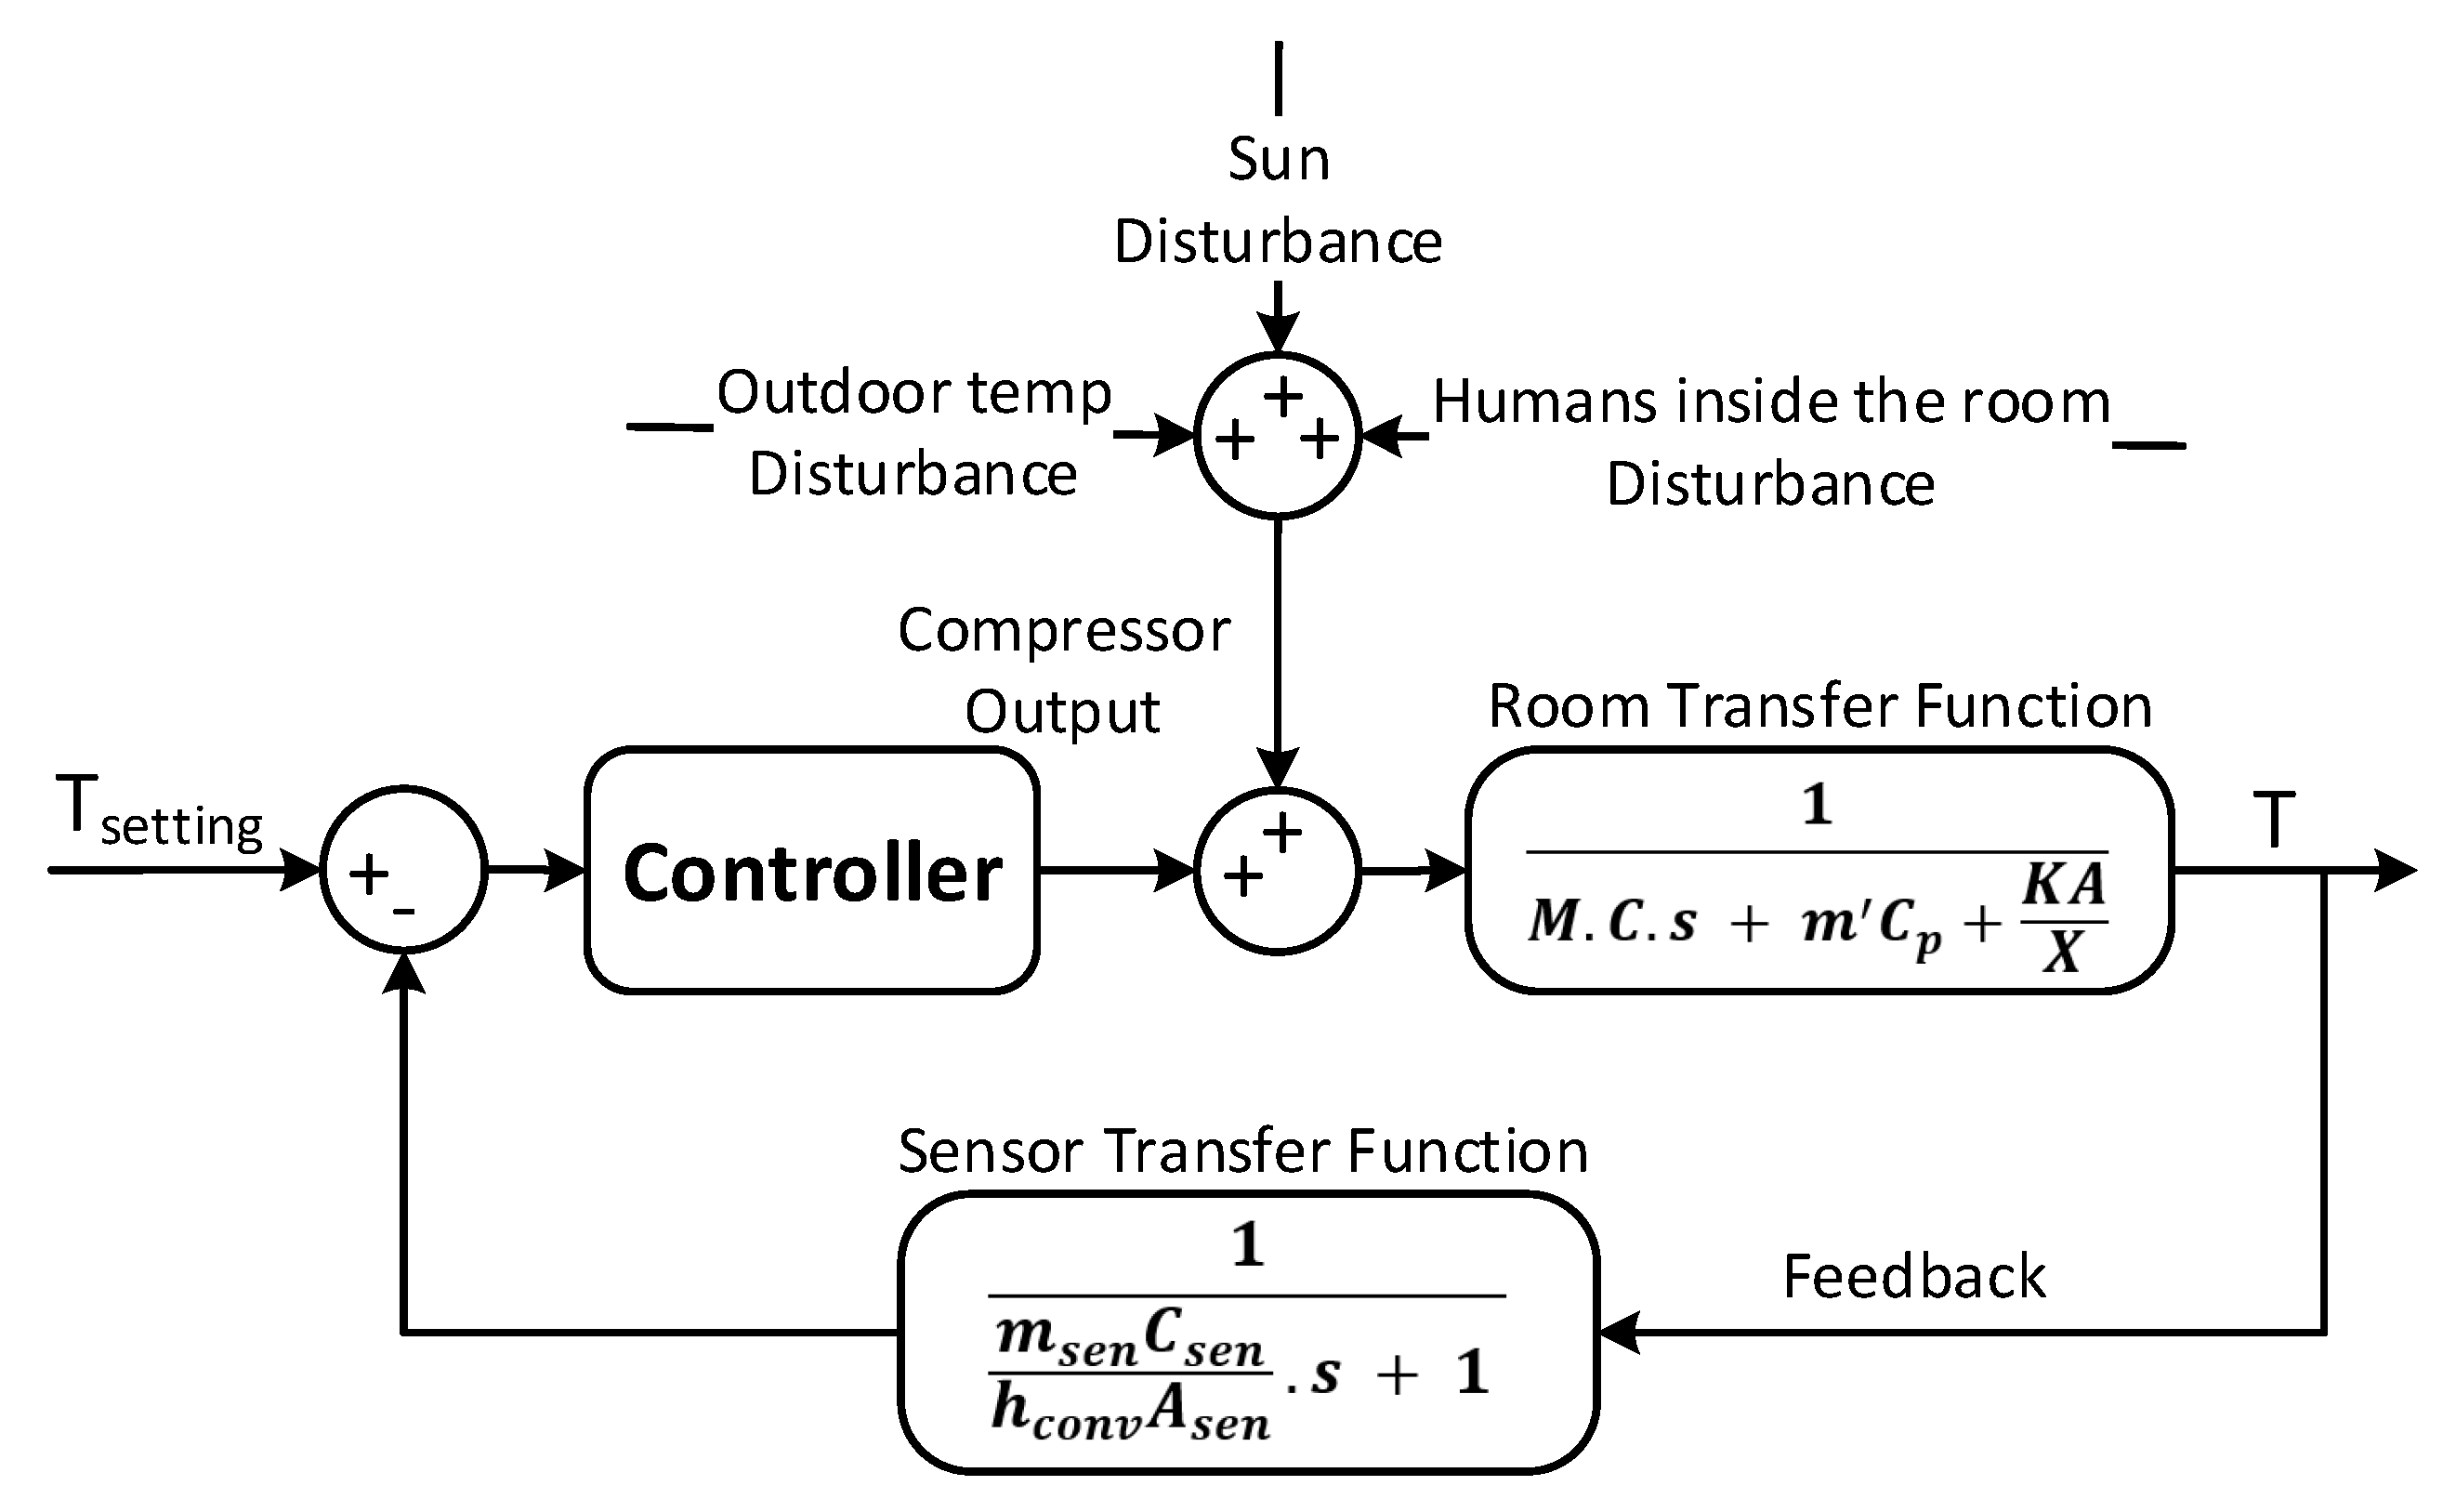
6.3. Stage 3: Temperature Regulation Based on a PID Controller
7. Simulation Results
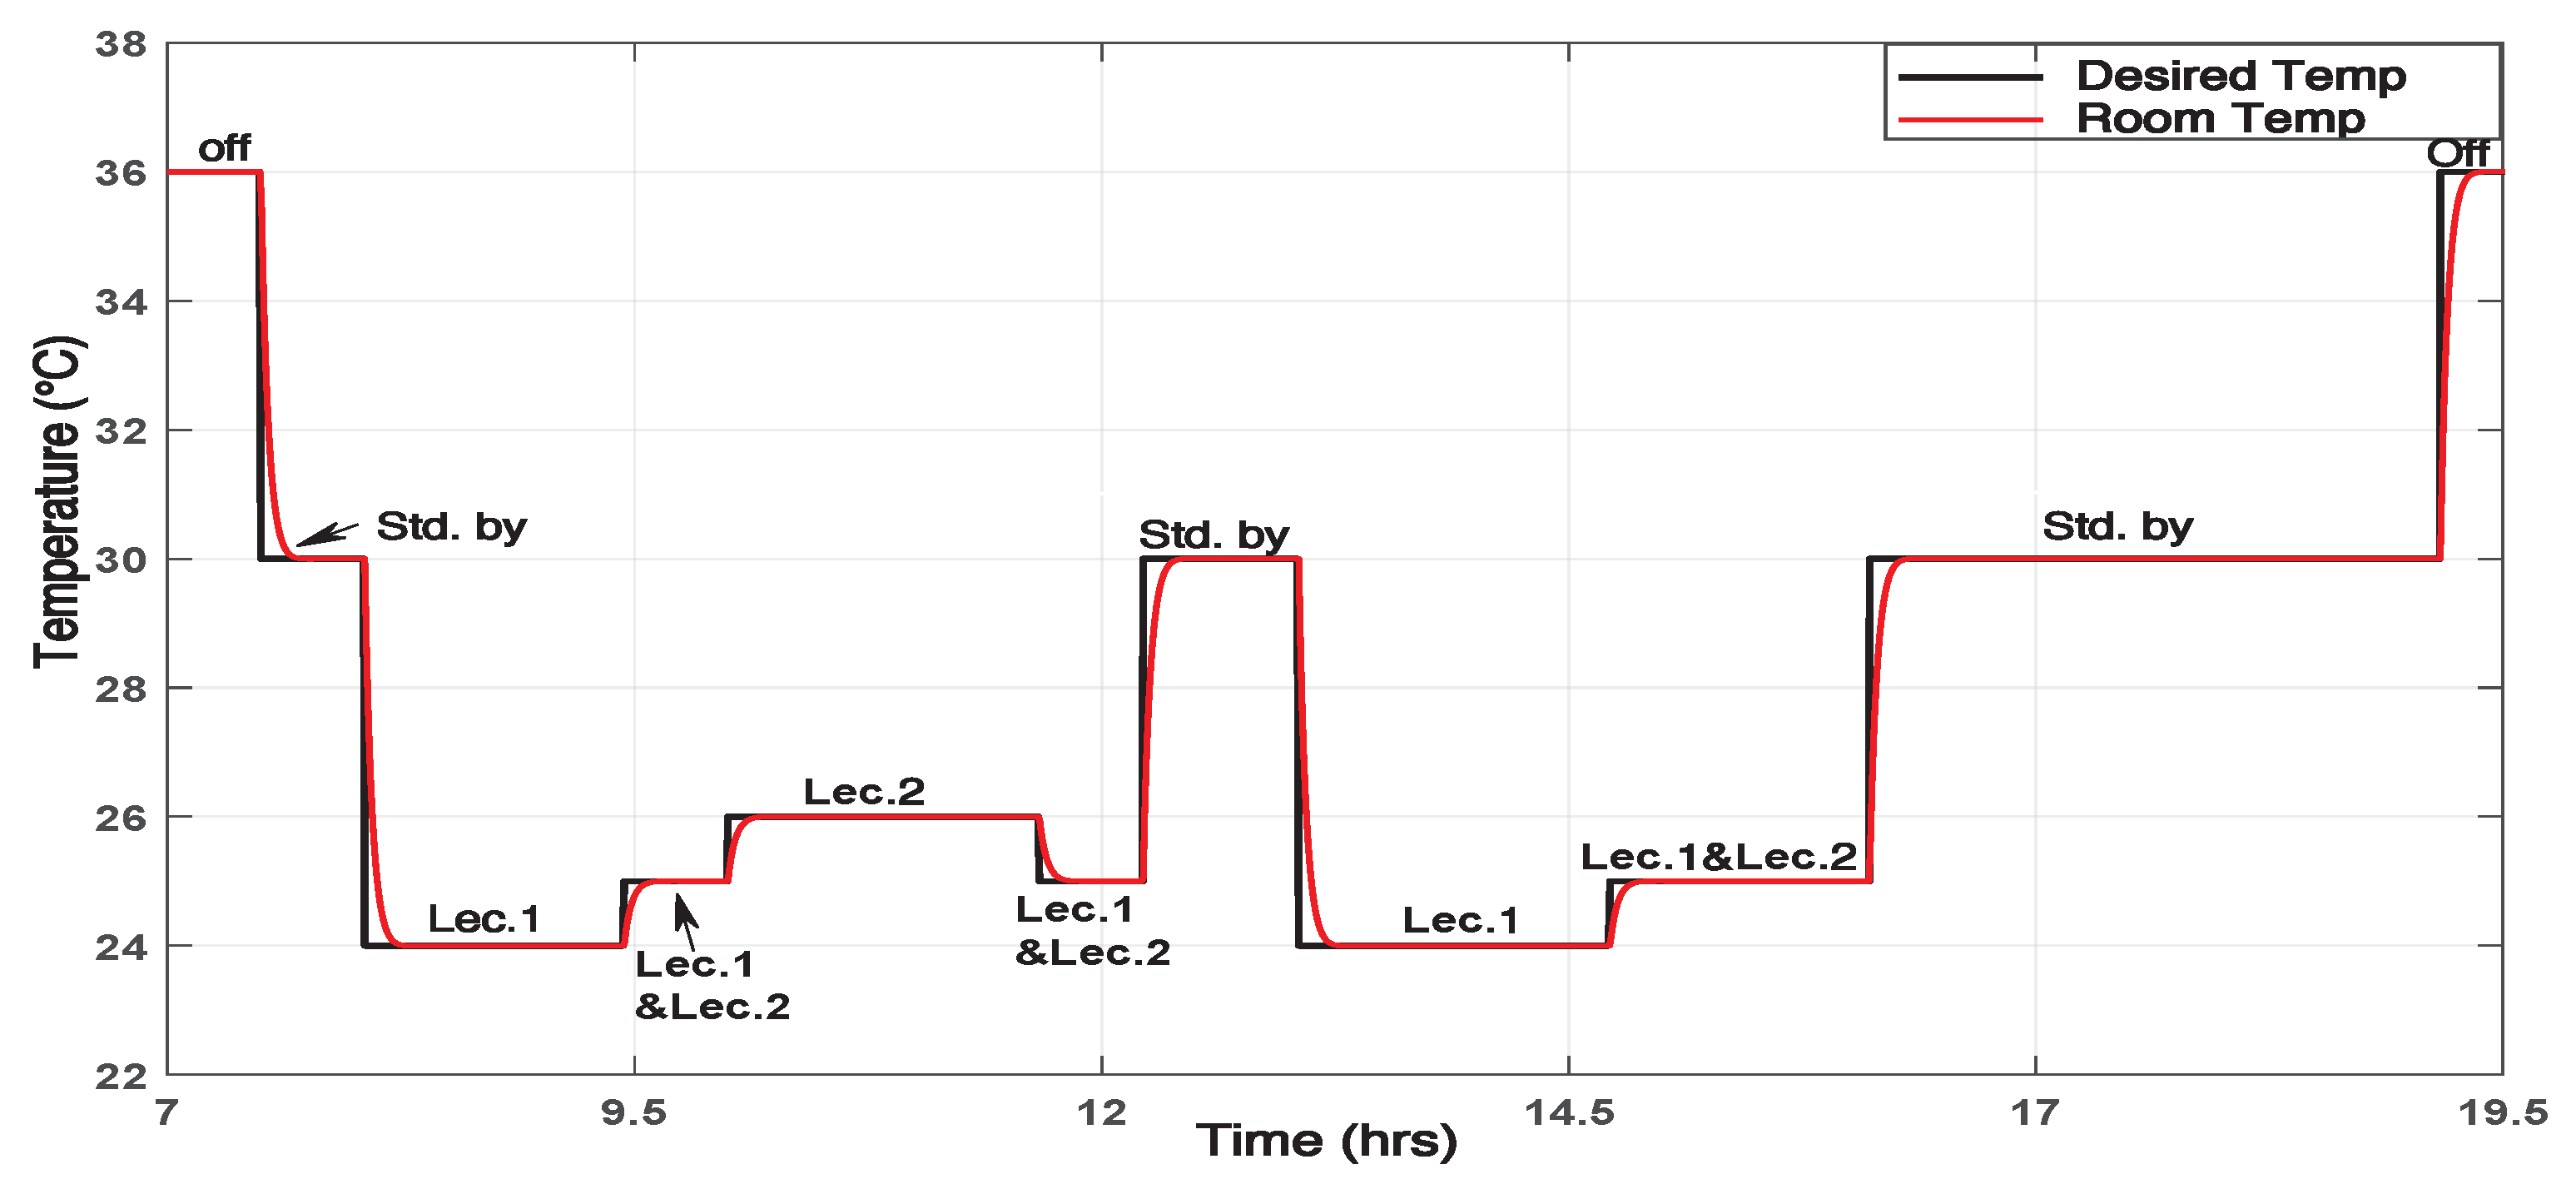
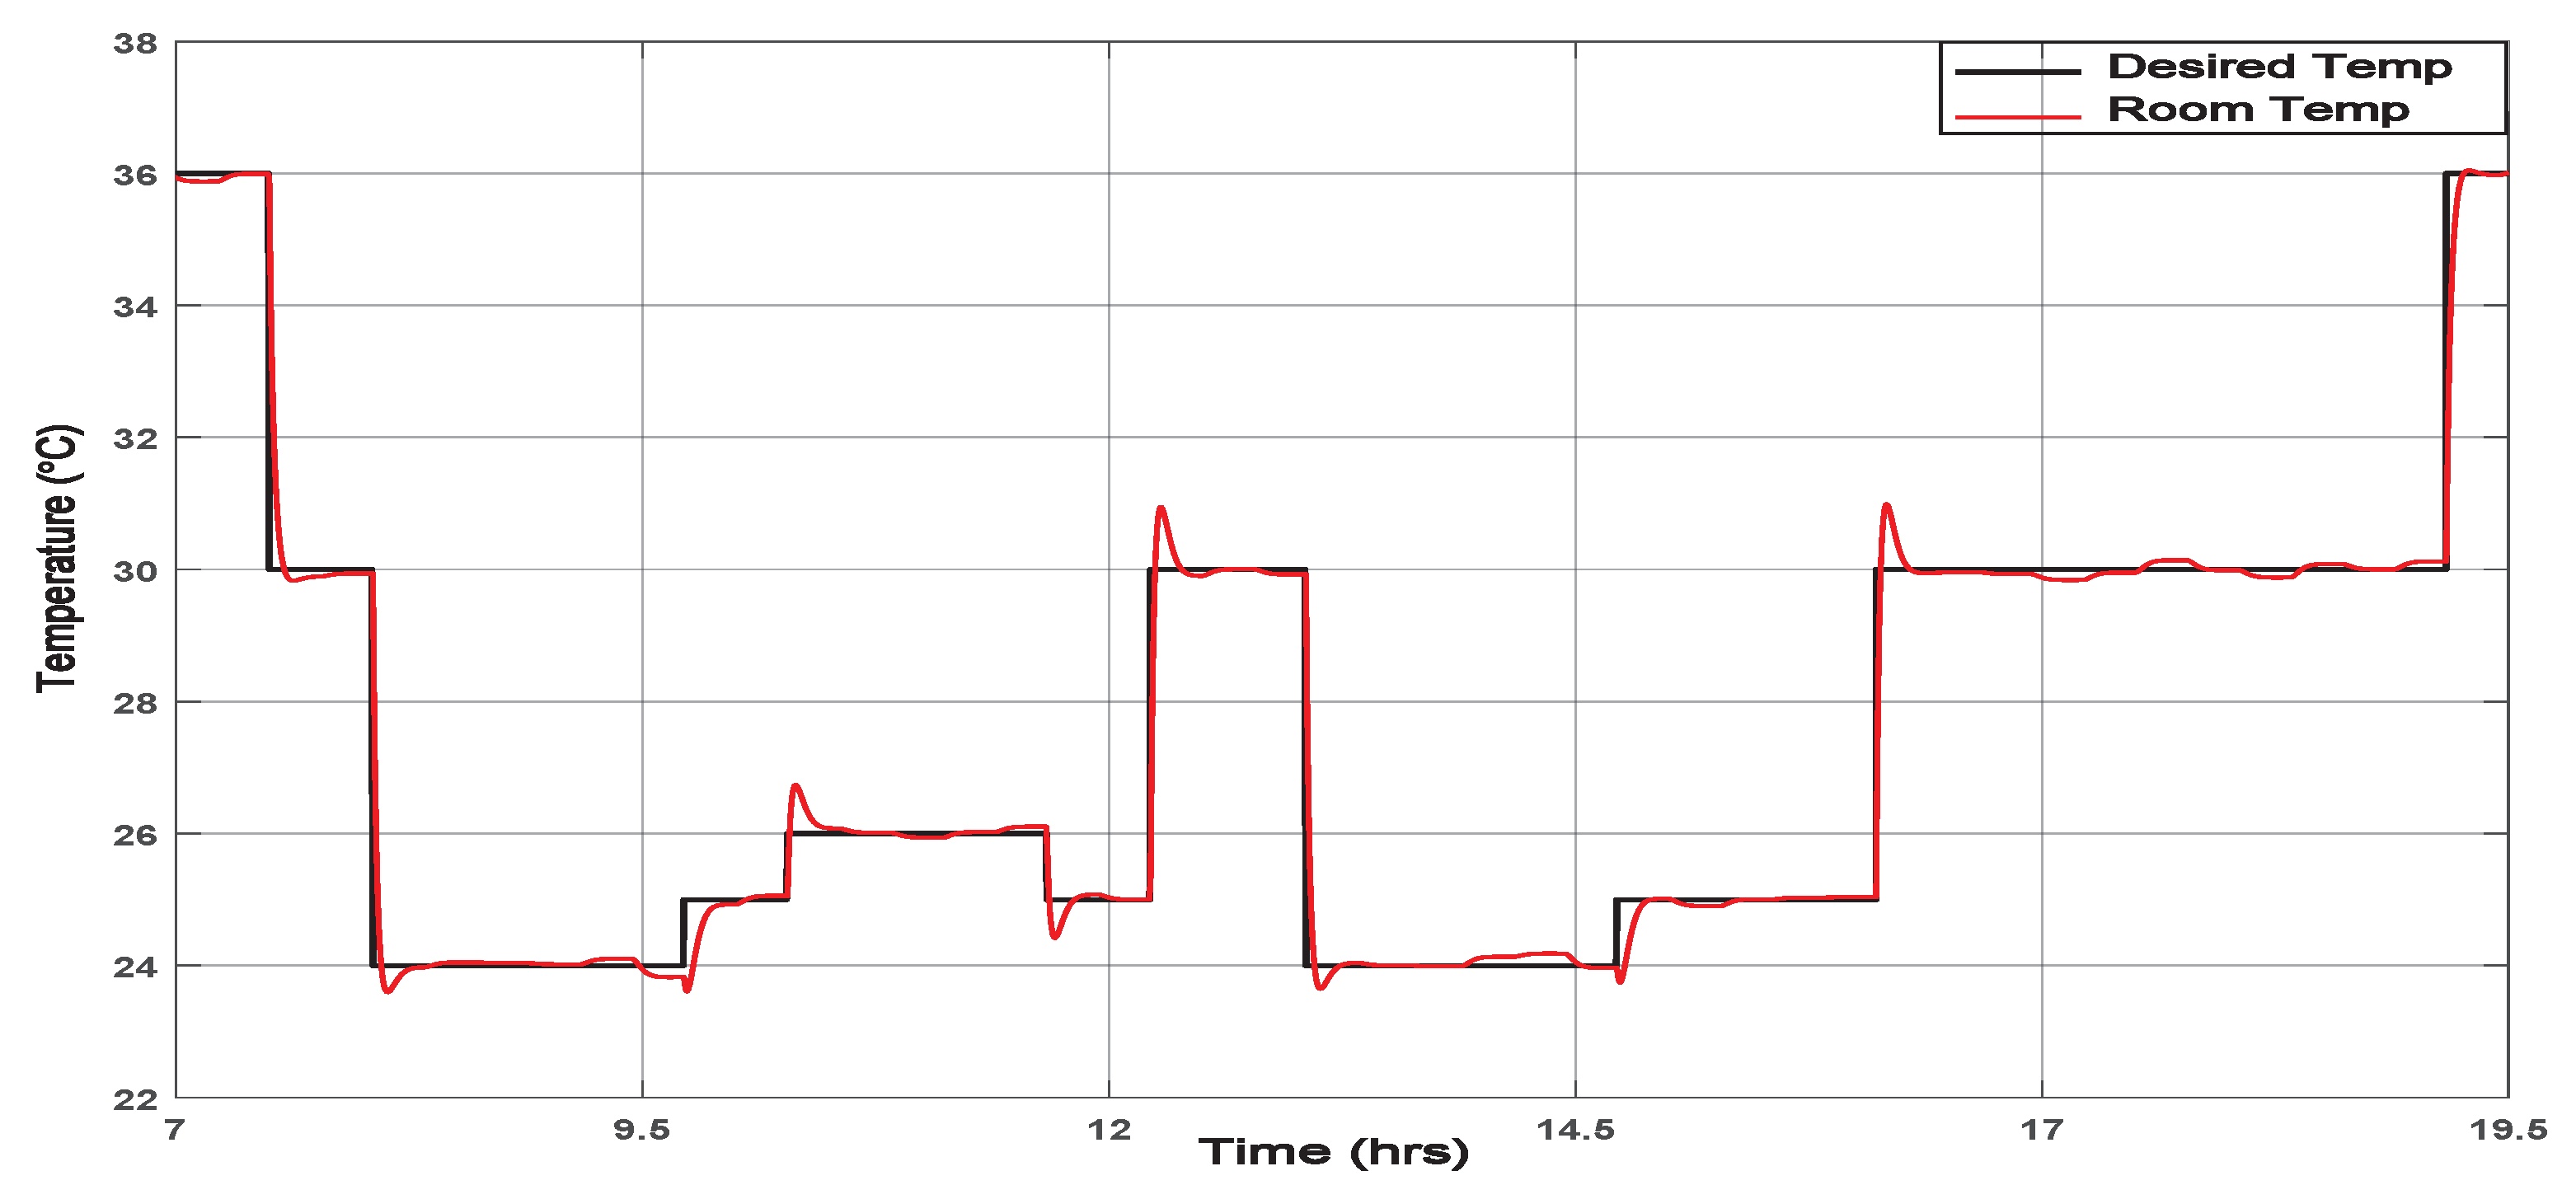
- The user’s comfort can be observed in Figure 11 through the short response time in the temperature signal. Indeed, it can be seen that, at each change of lecturer presence in the office, the framework generates the new user’s desired temperature, and the PID controller acts on the office ambient temperature to reach the desired one quickly. Choosing a room temperature equal to 30 C in the absence of both lecturers (Stdby mode), participates in reaching the preferred user’s temperature quickly, since it is well known that the outside temperature in KSA can easily exceed 50 C during summer. This reasonable ambient temperature consumes more energy, but it is necessary to maintain an acceptable user comfort level.
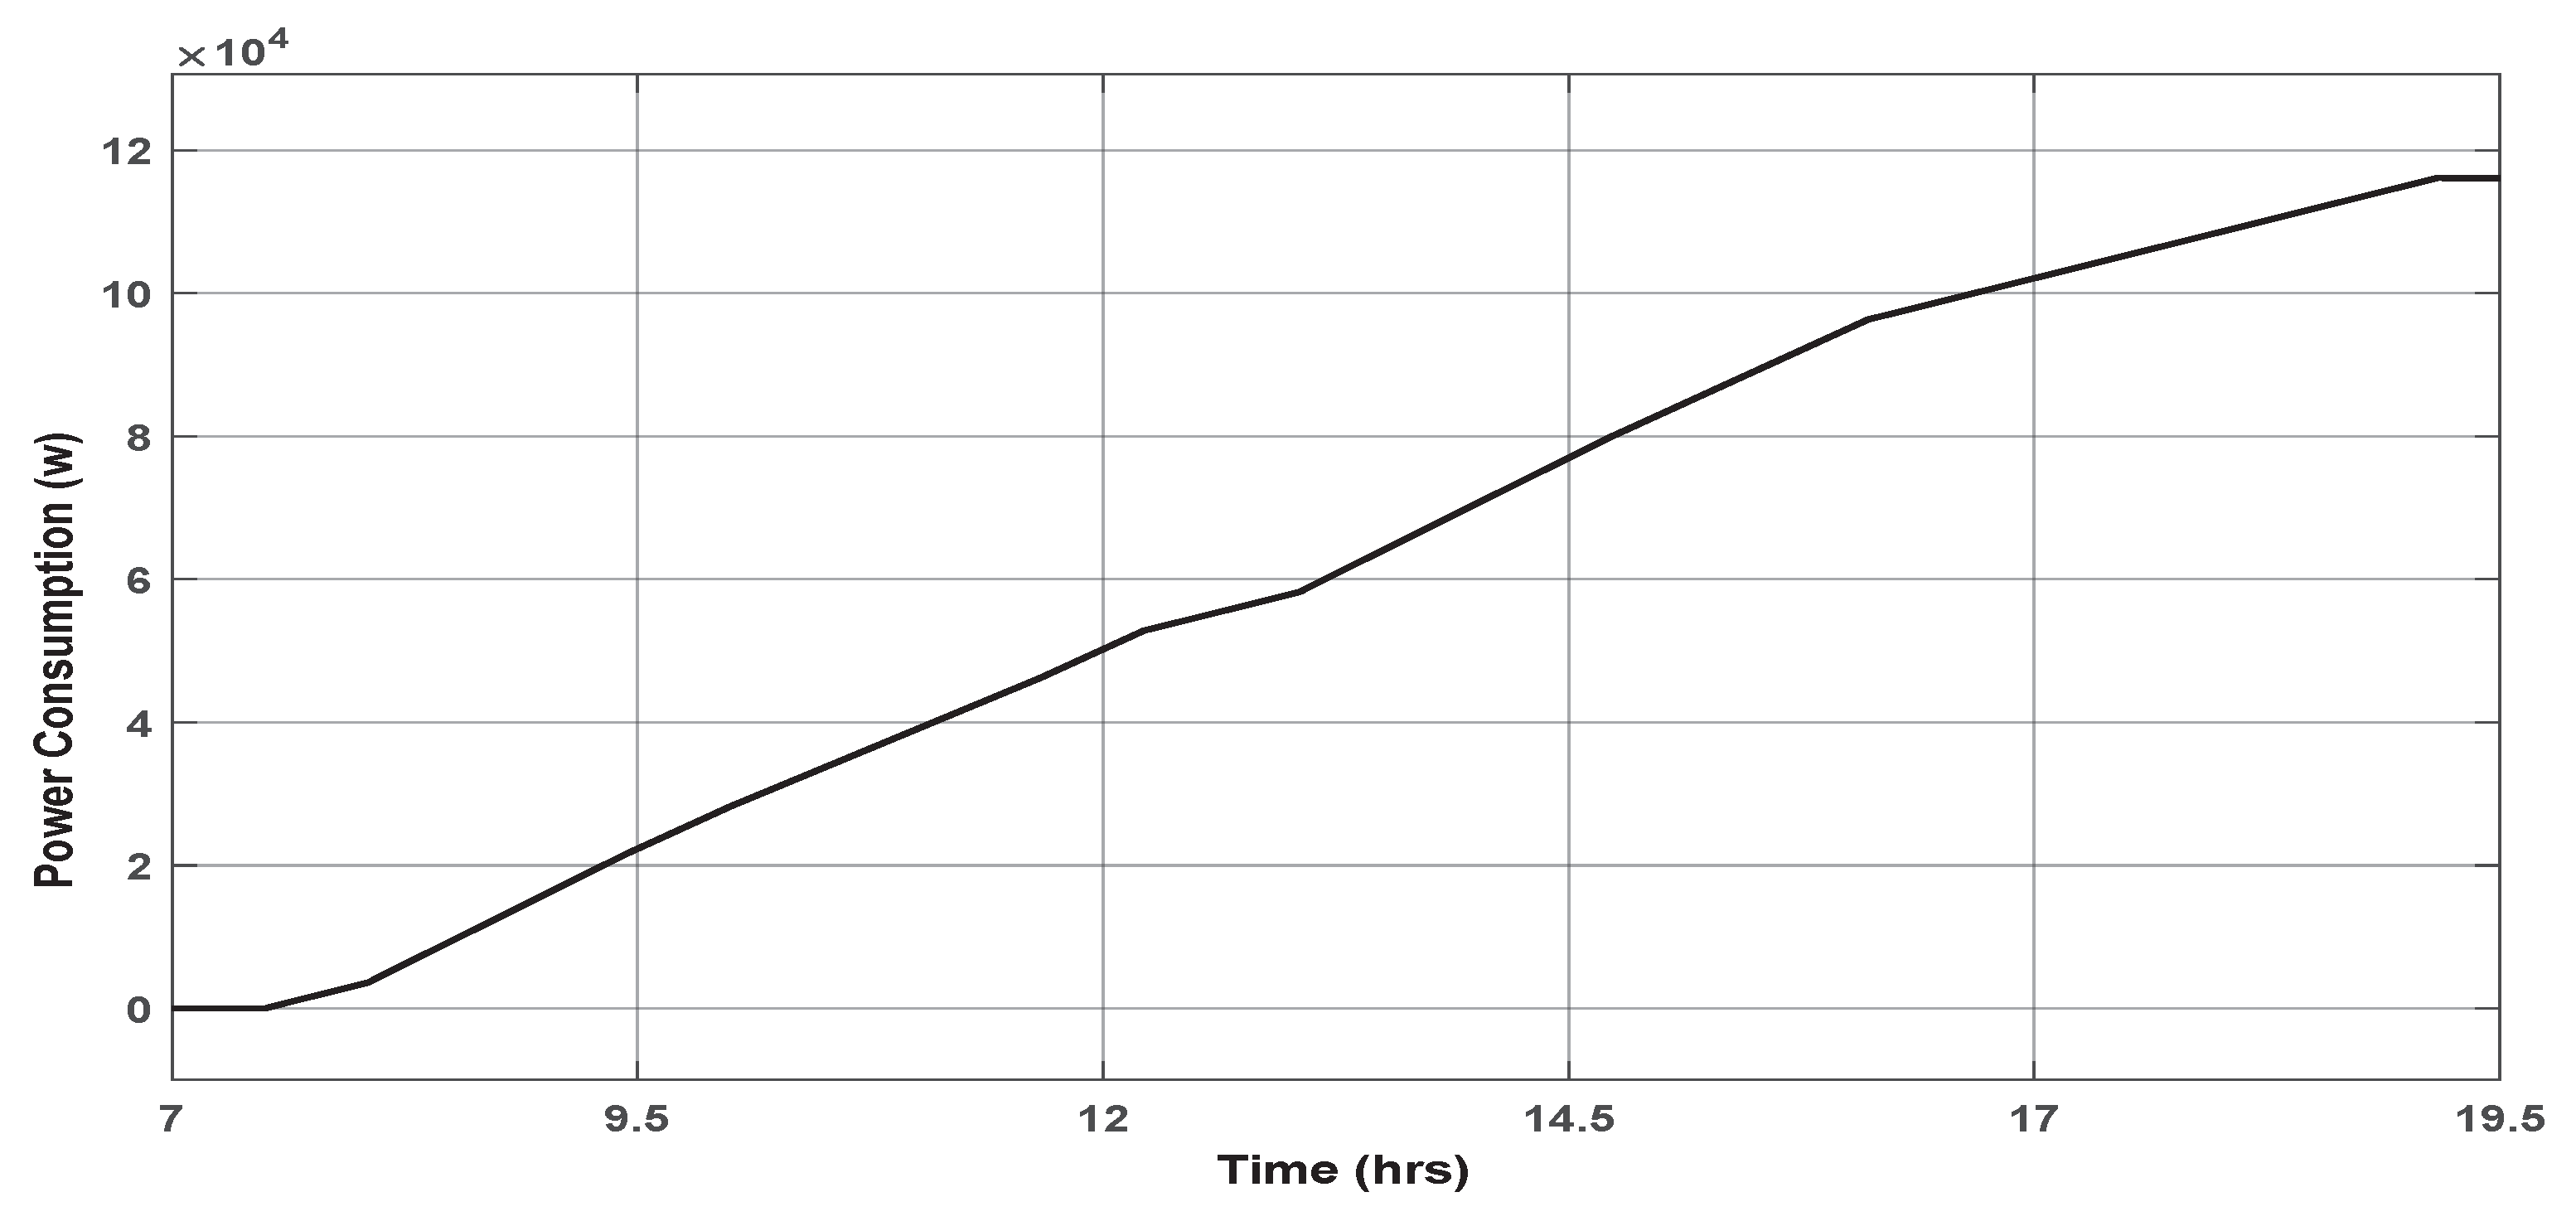
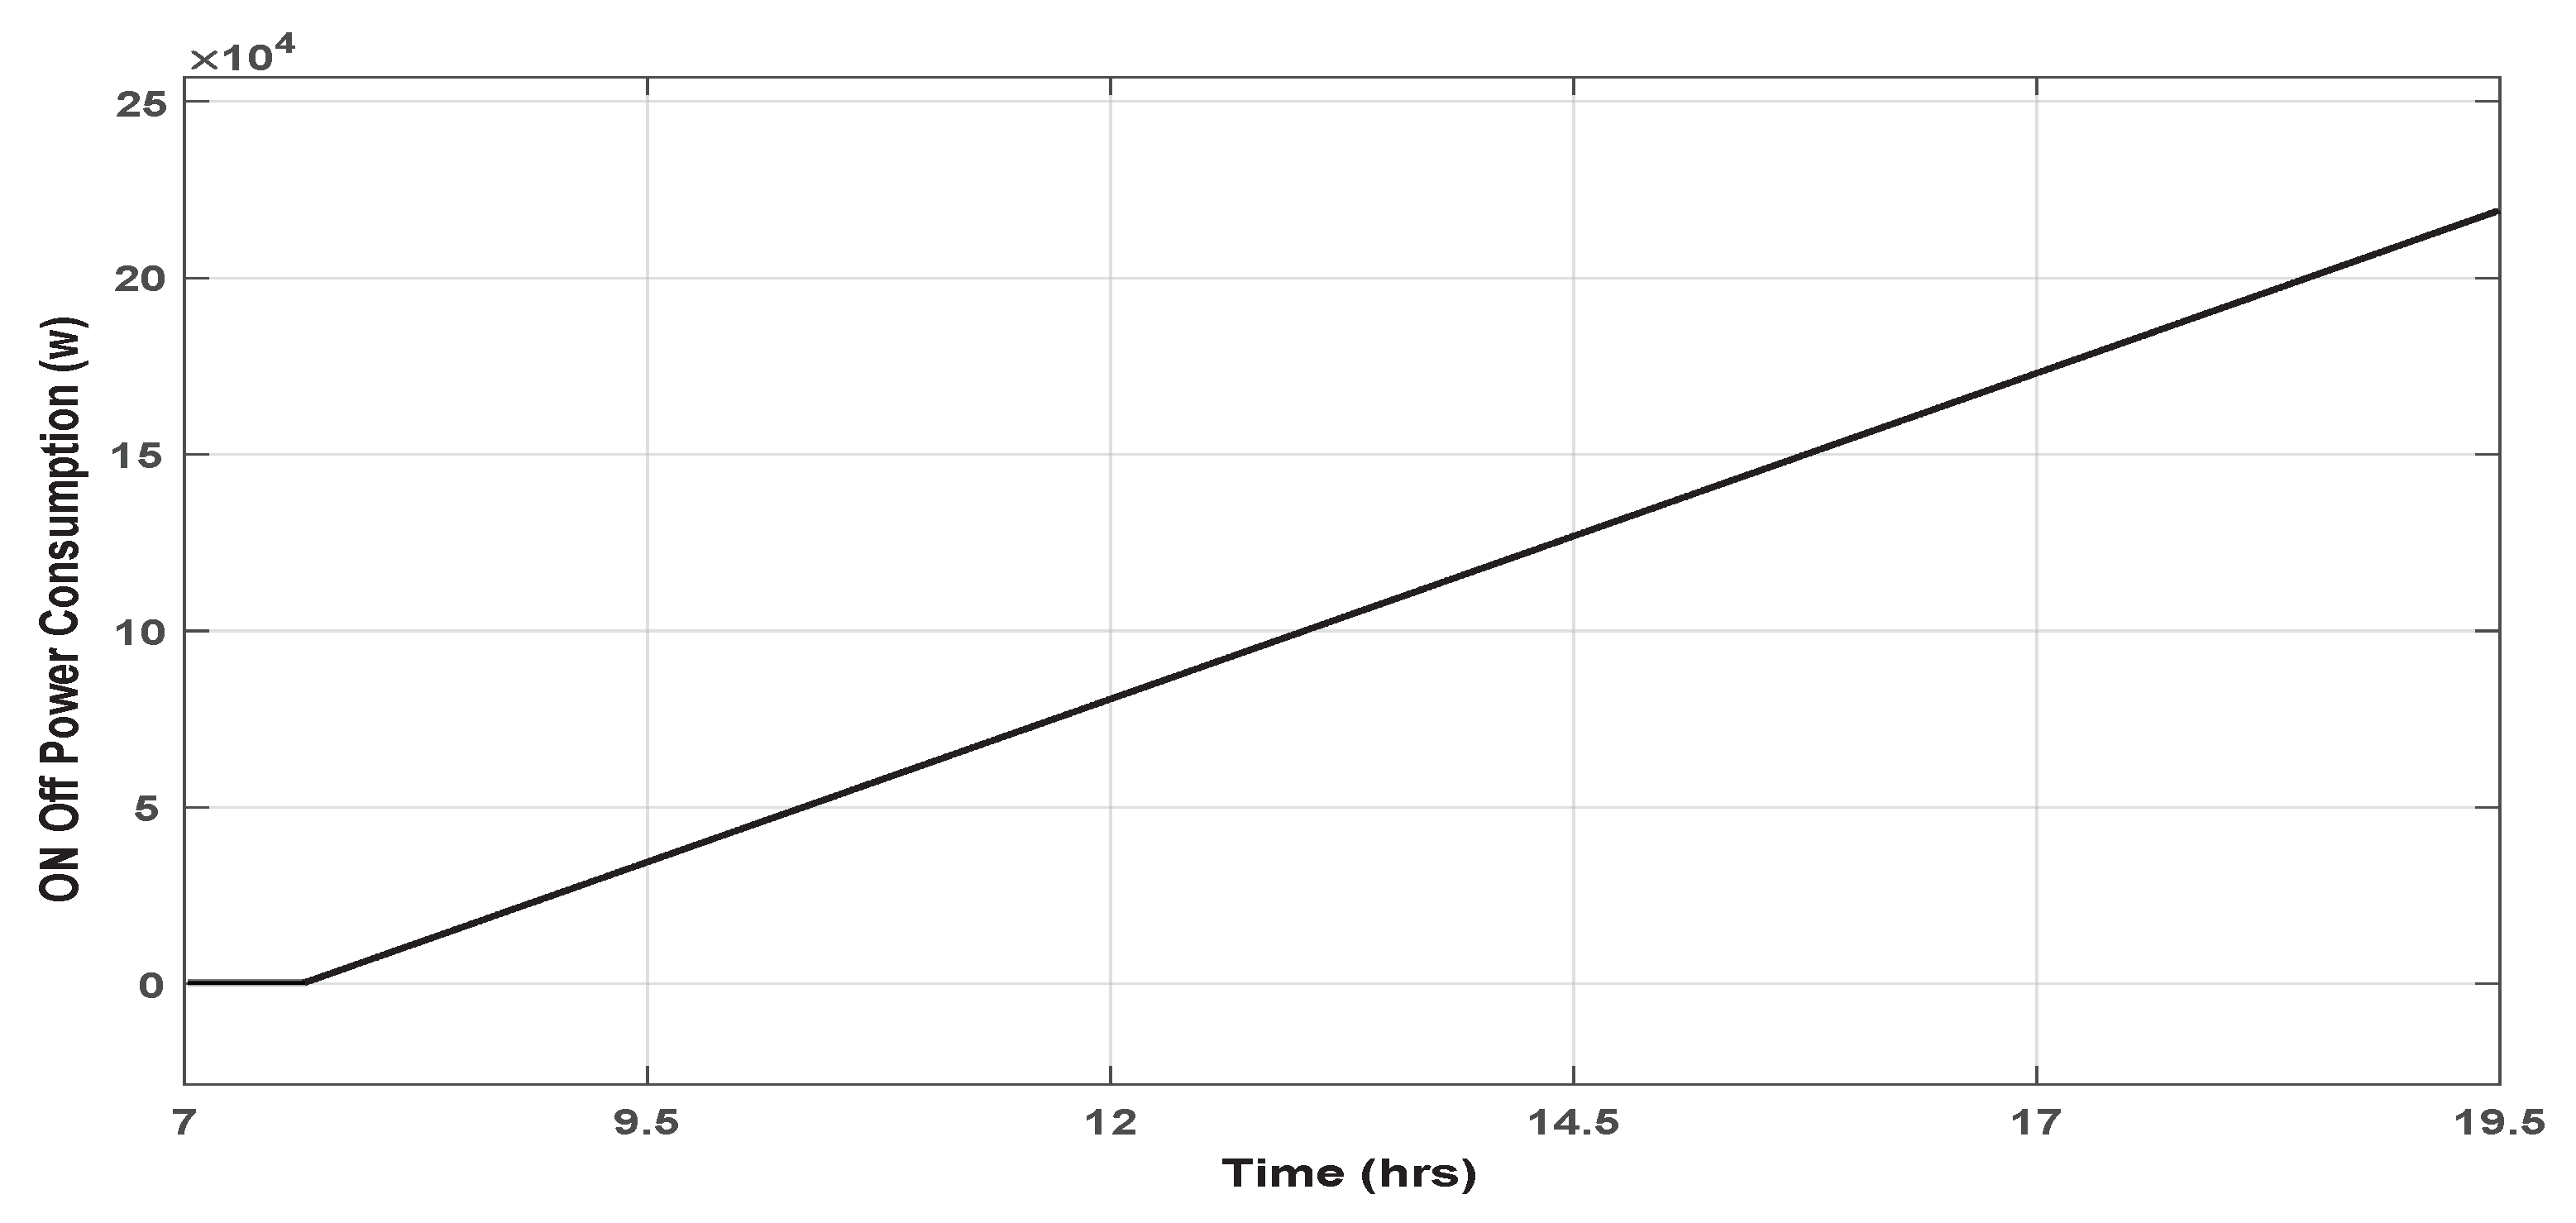
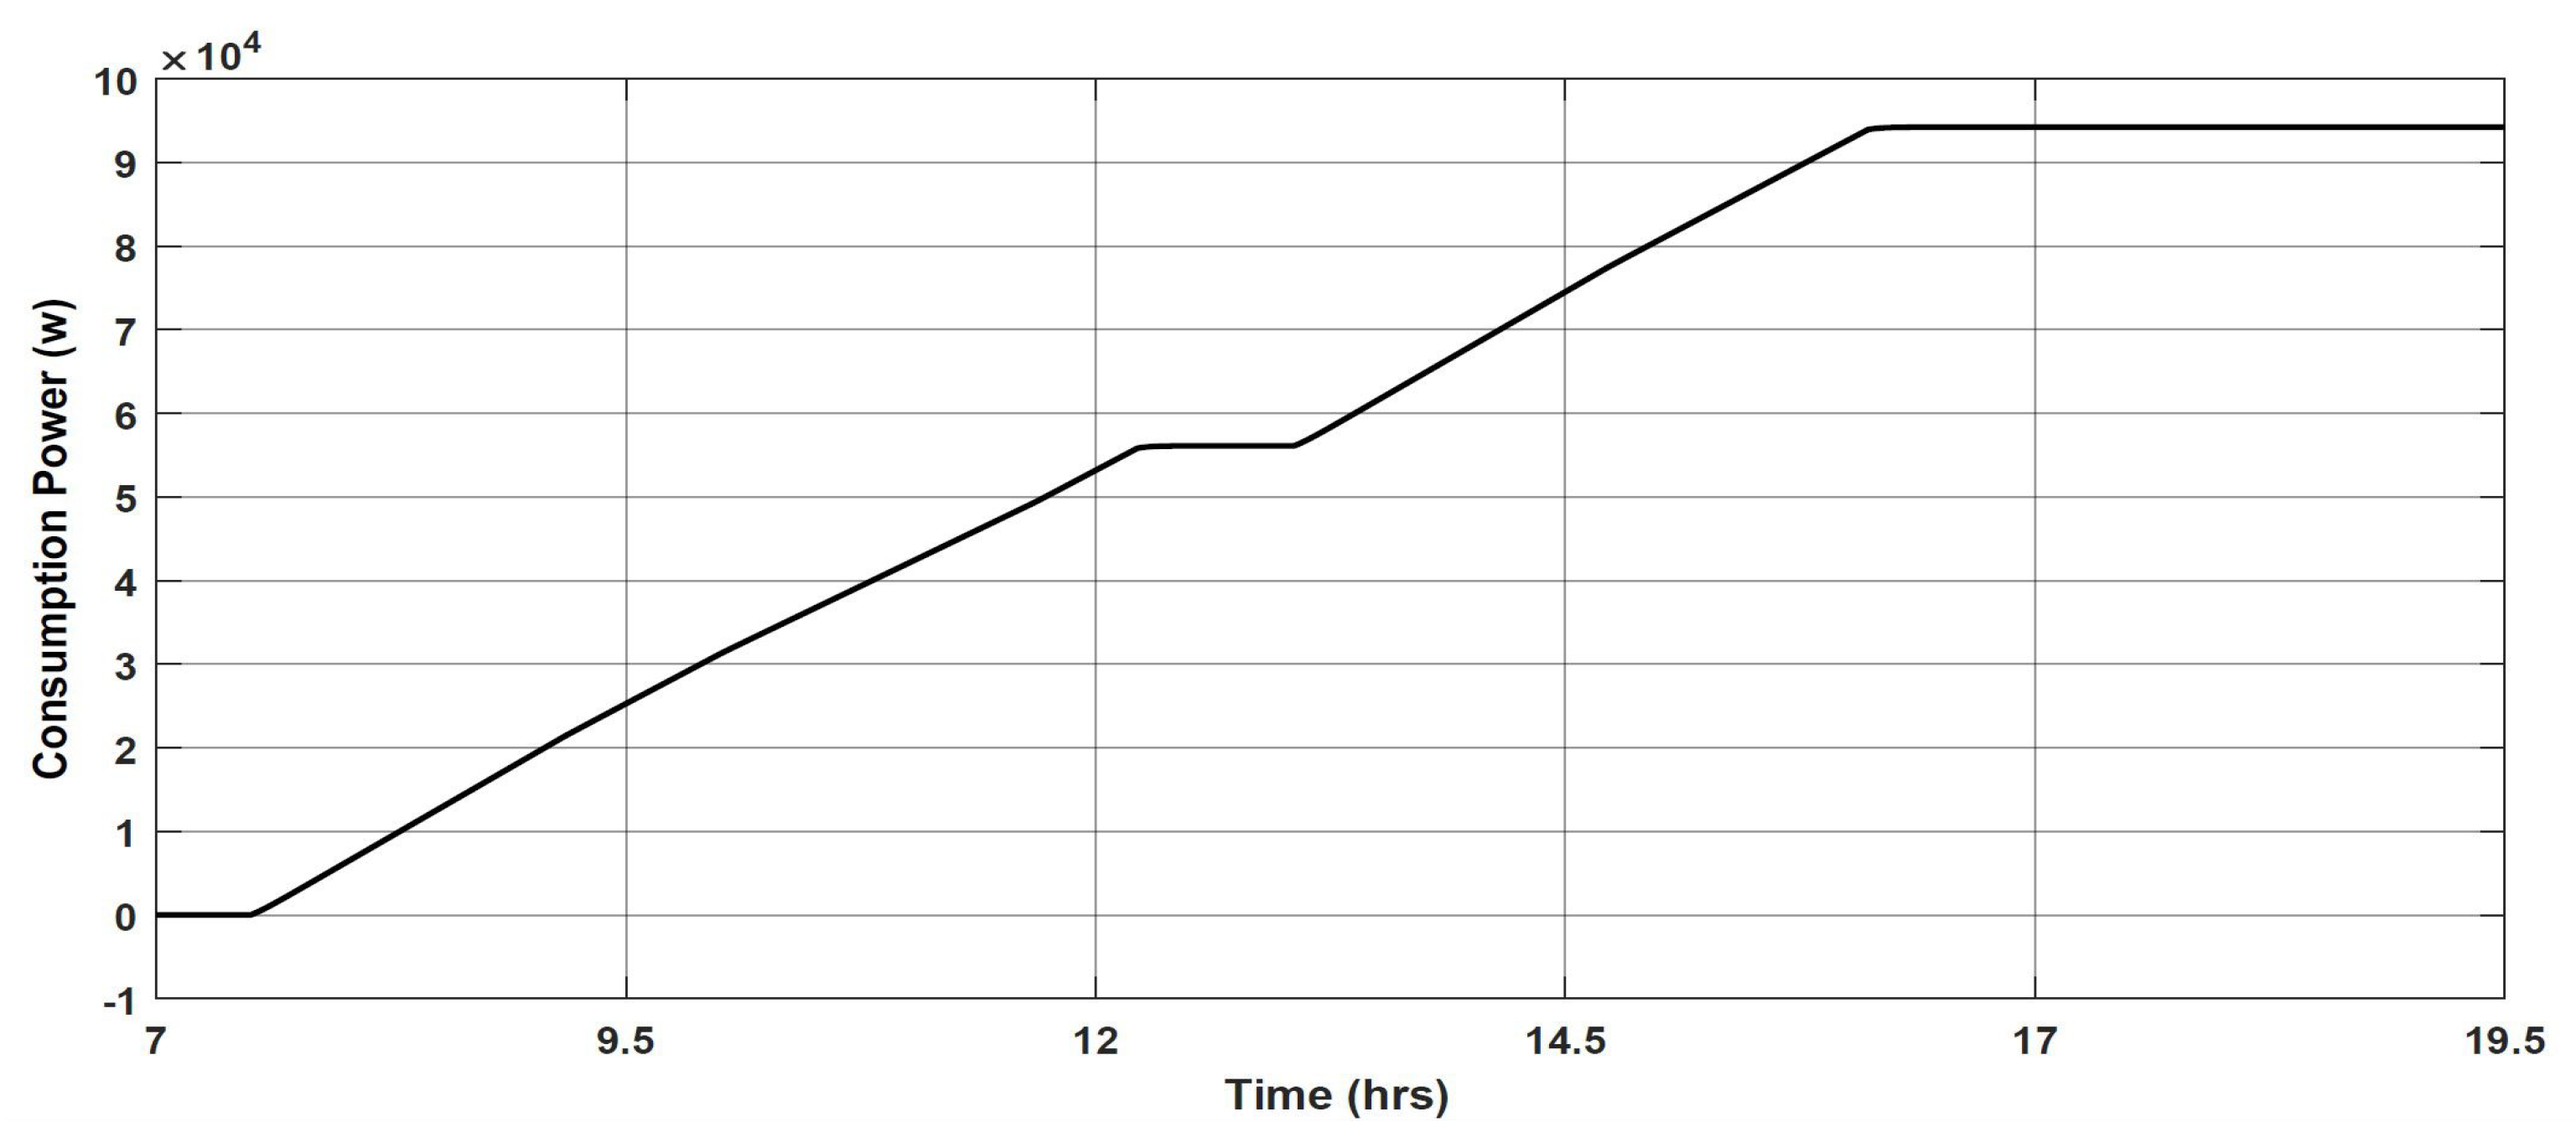
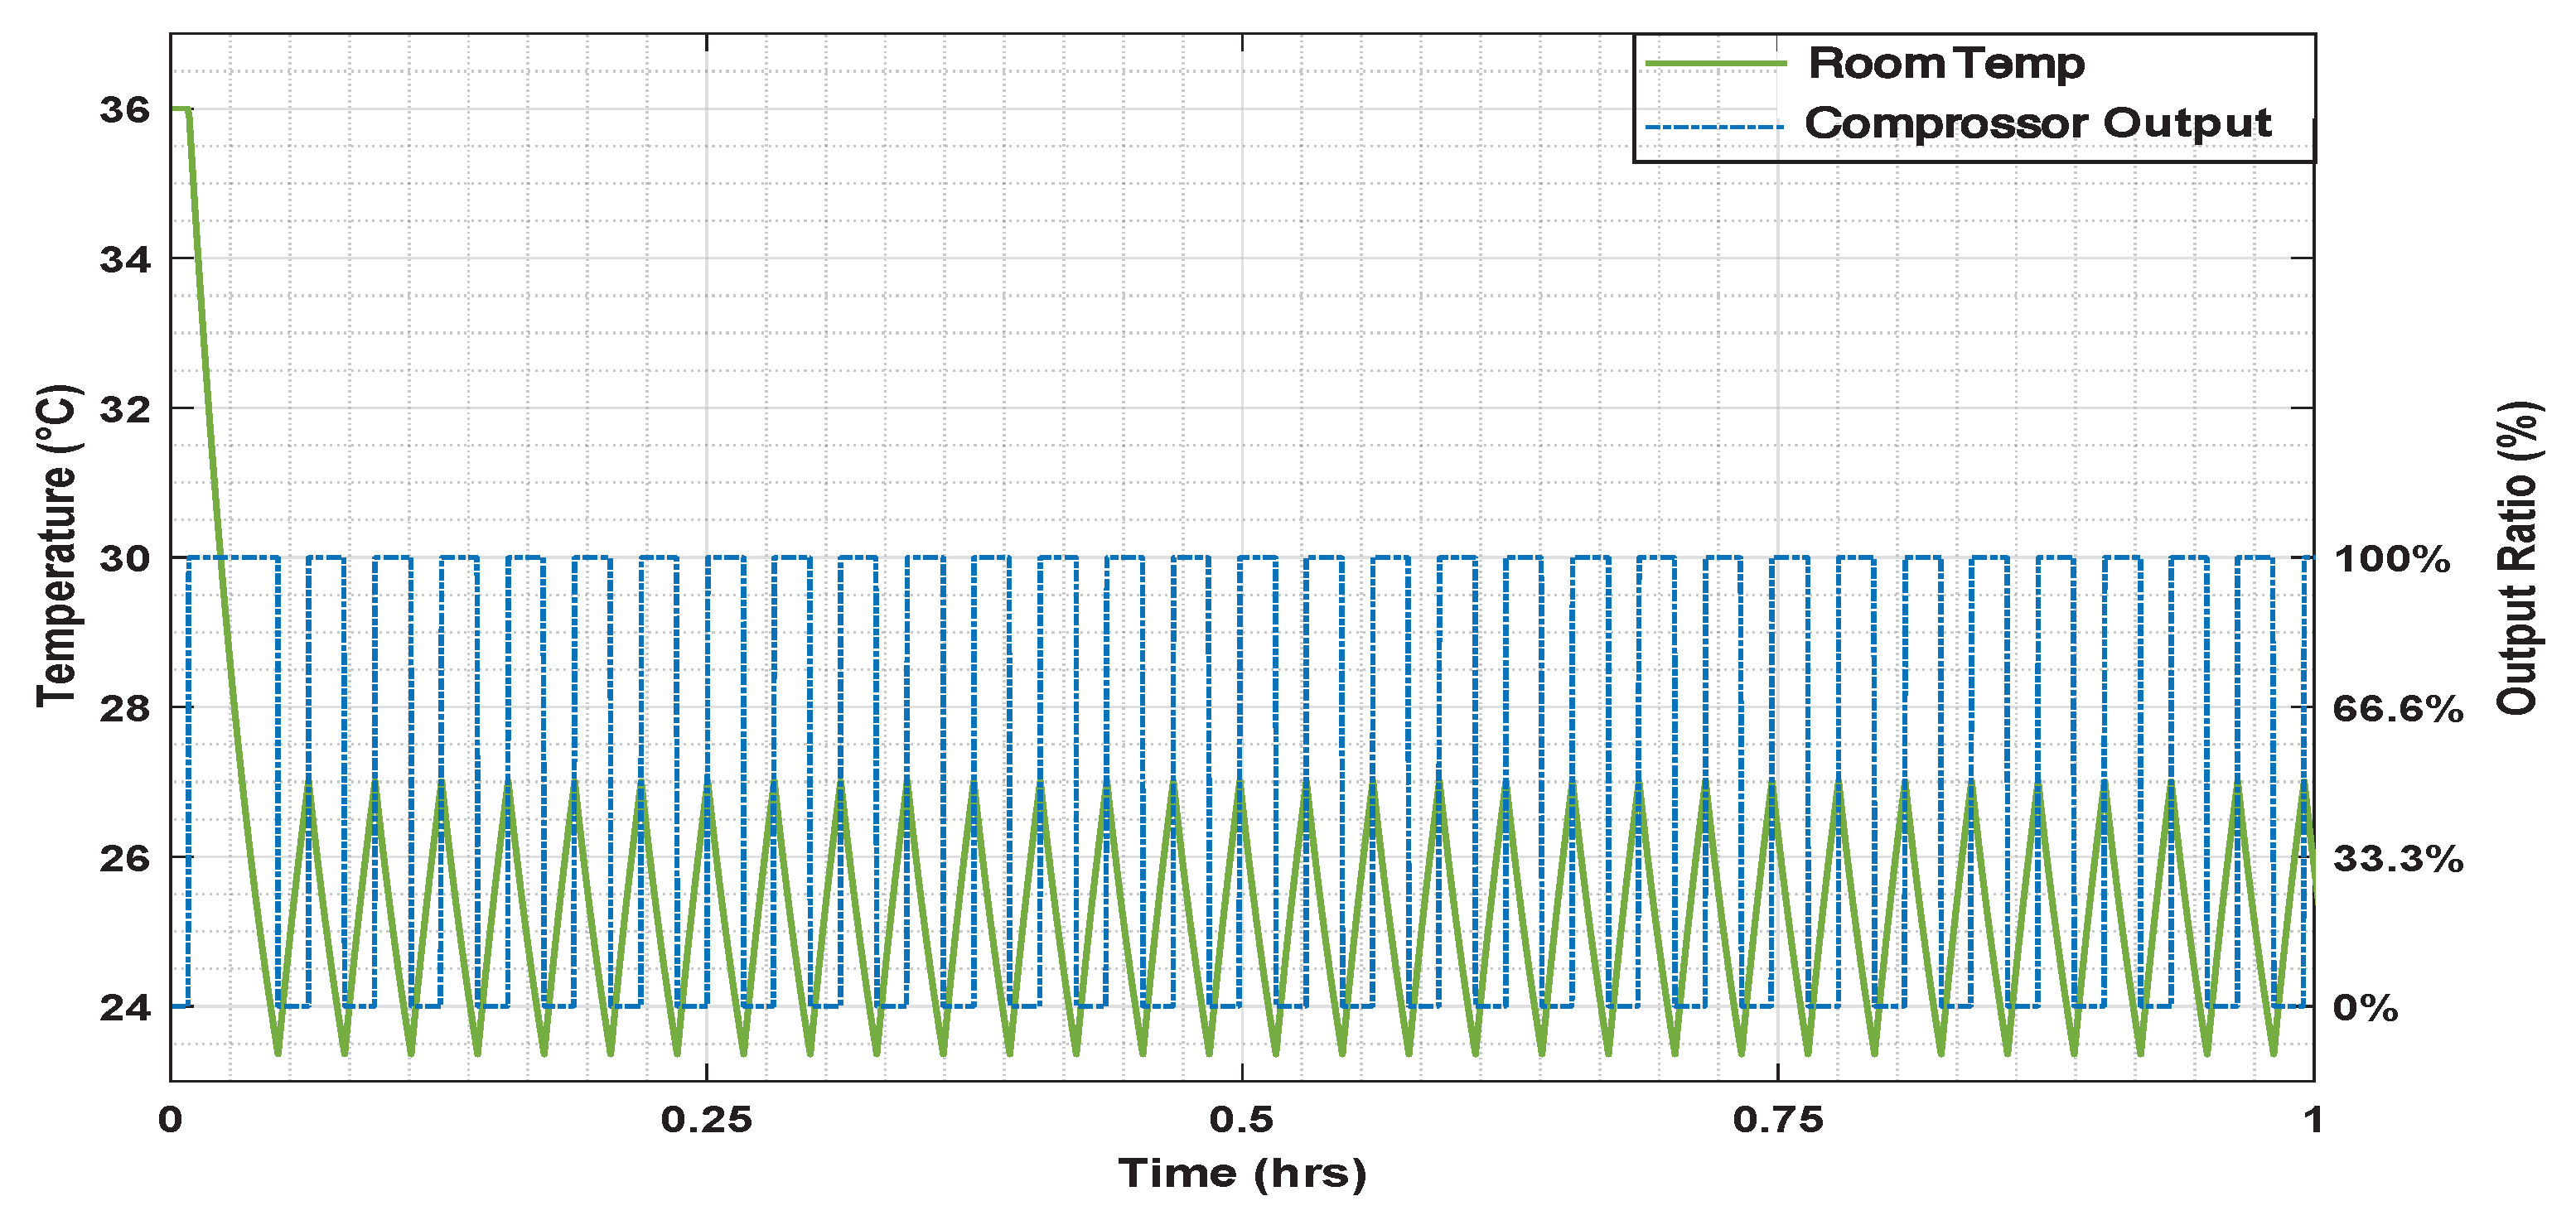
- Energy saving: The comparison between the traditional system based on an On/Off signal shown in Figure 15 and the proposed smart framework illustrated in Figure 14 shows a considerable reduction in the energy consumed by the latter compared to the first one. In fact, the simulations show that using the smart framework, the reduction in energy consumption is about compared to the current On/Off controller. Indeed, using the On/Off controller, to keep the temperature around a predefined temperature of 25 C during 12 h, from 7:30 a.m. to 19:30 p.m., the total consumed energy was of kW as shown in Figure 15, while it is only of kW using the smart framework, as shown in Figure 14.
8. Framework Advantages
- Energy consumption reduction: Indeed, compared to the On/Off method used currently in the department building based on a predefined constant reference temperature throughout the day, the proposed framework allows sending each user preferred temperature. As a result, very significant energy savings are made, as shown in Figure 14. Beyond these savings, the most important is the idea that at any time of the day, the proposed smart framework consumes the exact required energy, neither more nor less.
- User’s comfort: The proposed approach responds precisely to the users’ needs. Indeed, the role of the second stage, the PN based supervisor, is to detect any presence in the office, identify the user, then send the corresponding reference temperature expressed by the identified user. This dramatically improves user comfort.
- Reactivity: One of the critical features of the proposed approach is its reactivity. Indeed, this approach has a great ability to react, very quickly, to changes in its environment. This is because through the use of a PN and a closed control loop, can simultaneously perform several functions of observation, monitoring, and correction of the system. Any changes in the presence or absence of people in the controlled space are immediately reflected in the reference temperature sent to the third stage as well as in the control signal sent to the controlled system.
- System Supervision: The fact that PN and closed-loop control are implemented in this framework gives the ability to supervise the global system in real time to ensure that the issued command is in perfect harmony with the state of the system. This avoids the propagation of component failure to other components, which provides an entirely reliable control system.
- Flexibility: The great interest of the proposed framework is its flexibility. Indeed, any necessary modification of conditions or variables used in the framework can be easily implemented in the PN and taken into account in office temperature regulation. Such modification could be for example the increasing or decreasing of the number of people using the office, or changing the preferred temperature of one or all users. In the case study discussed in this paper, if we decide to increase the number of people using the office to three, then we have to make the following changes. First, adding an additional state, with its input and output transitions, corresponding to the sending of the new user’s preferred temperature as a reference temperature (in a case he is alone in the office). Second, changing the preferred temperature on which the three users have agreed. We get, as a result, the following PN shown in Figure 17.
9. Conclusions
Author Contributions
Funding
Acknowledgments
Conflicts of Interest
Abbreviations
| AC | Air Conditioner |
| HVAC | Heating, Ventilation and Air Conditioning |
| RNN | Random Neural Network |
| IoT | Internet of Things |
| PN | Petri Nets |
| CPN | Colored Petri Nets |
| SPN | Stochastic Petri Nets |
| TPN | Temporal Petri Nets |
| MPC | Predictive Control Model |
| Lec1 | Lecturer #1 |
| Lec2 | Lecturer #2 |
| HVAC | Heating, Ventilation and Air Conditioning |
| PID | Proportional, Integral, and Differential Control |
| Stdby | Stand By mode |
| P | Set of places in Petri Net |
| T (in PN) | Set of transitions in PN |
| t | is the time or instantaneous time (the present) (s) |
| is the variable of integration (takes on values from time 0 to the present t) (s) | |
| Control error | |
| Reference signal | |
| System measurement variable | |
| PID proportional constant | |
| PID integral constant | |
| PID derivative constant | |
| Transfer #1 | |
| Transfer #2 | |
| M | Mass (kg) |
| C | Total specific heat capacity (J·kg·C) |
| Heat capacity at constant pressure J/C) | |
| T (in TF) | Temperature (C) |
| Exchanging air flow (m/s) | |
| A | Indoor surface area (m) |
| X | Outdoor wall thickness (m) |
| K | Thermal conductivity coefficient (W·m·C) |
| Sensor mass (kg) | |
| Sensor heat capacity (J/C) | |
| Convection coefficient (W/(m C)) | |
| Sensor area (m) |
References
- Alshahrani, J.; Boait, P. Reducing High Energy Demand Associated with Air-Conditioning Needs in Saudi Arabia. Energies 2019, 12, 87. [Google Scholar] [CrossRef]
- Saudi Arabia Ministry of Water and Electricity. 2013. Available online: https://www.mep.gov.sa/en/AdditionalDocuments/PlansEN/9th/Ninth%20Development%20Plan%20-%20Chapter%2030%20-%20Electricity.pdf (accessed on 27 May 2019).
- U.S. Energy Information Administration—EIA—Independent Statistics and Analysis. 2013. Available online: https://www.eia.gov/consumption/residential/ (accessed on 3 February 2019).
- Augusto, J.C.; Nakashima, H.; Aghajan, H. Ambient Intelligence and Smart Environments: A State of the Art. In Handbook of Ambient Intelligence and Smart Environments; Springer US: Boston, MA, USA, 2010; pp. 3–31. [Google Scholar] [CrossRef] [Green Version]
- Talari, S.; Shafie-Khah, M.; Siano, P.; Loia, V.; Tommasetti, A.; Catalão, J. A review of smart cities based on the internet of things concept. Energies 2017, 10, 421. [Google Scholar] [CrossRef]
- Chan, M.; Estève, D.; Escriba, C.; Campo, C. A review of smart homes—Present state and future challenges. Comput. Methods Prog. Biomed. 2008, 91, 55–81. [Google Scholar] [CrossRef]
- Javed, A.; Larijani, H.; Ahmadinia, A.; Emmanuel, R.; Mannion, M.; Gibson, D. Design and implementation of a cloud enabled random neural network-based decentralized smart controller with intelligent sensor nodes for HVAC. IEEE Internet Things J. 2017, 4, 393–403. [Google Scholar] [CrossRef]
- Gonçalves, I.; Gomes, Á.; Antunes, C.H. Optimizing the management of smart home energy resources under different power cost scenarios. Appl. Energy 2019, 242, 351–363. [Google Scholar] [CrossRef]
- Khalid, R.; Javaid, N.; Rahim, M.H.; Aslam, S.; Sher, A. Fuzzy energy management controller and scheduler for smart homes. Sustain. Comput. Inform. Syst. 2019, 21, 103–118. [Google Scholar] [CrossRef]
- Marikyan, D.; Papagiannidis, S.; Alamanos, E. A systematic review of the smart home literature: A user perspective. Technol. Forecast. Soc. Chang. 2019, 138, 139–154. [Google Scholar] [CrossRef]
- Peng, S.S.; Zhou, M.C. Ladder Diagram and Petri-Net-Based Discrete-Event Control Design Methods. IEEE Trans. Syst. Man Cybern. Part C Appl. Rev. 2004, 34, 523–531. [Google Scholar] [CrossRef]
- Bogdan, S.; Lewis, F.; Kovacic, Z.; Gurel, A.; Stajdohar, M. An Implementation of the Matrix-Based Spervisory Controller of Flexible Manufacturing Systems. IEEE Trans. Control Syst. Technol. 2002, 10, 709–716. [Google Scholar] [CrossRef]
- Feldmann, K.; Colombo, A.; Schnur, C.; Stockel, T. Specification, design, and implementation of logic controllers based on colored Petri net models and the standard IEC 1131. II. Design and implementation. IEEE Trans. Control Syst. Technol. 1999, 7, 666–674. [Google Scholar] [CrossRef]
- Ramamoorthy, C.V.; Ho, G.S. Performance Evaluation of Asynchronous Concurrent Systems Using Petri Nets. IEEE Trans. Softw. Eng. 1980, SE-6, 440–449. [Google Scholar] [CrossRef]
- Magott, J. Performance evaluation of concurrent systems using Petri nets. Inf. Process. Lett. 1984, 18, 7–13. [Google Scholar] [CrossRef]
- Molloy, M.K. Performance Analysis Using Stochastic Petri Nets. IEEE Trans. Comput. 1982, 31, 913–917. [Google Scholar] [CrossRef]
- Jensen, K. Coloured petri nets and the invariant-method. Theor. Comput. Sci. 1981, 14, 317–336. [Google Scholar] [CrossRef] [Green Version]
- Ramchandani, C. Analysis of Asynchronous Concurrent Systems by Timed Petri Nets; Technical Report; Massachusetts Institute of Technology: Cambridge, MA, USA, 1974. [Google Scholar]
- Ozkan, H.A. Petri net modelling of smart home appliances. In Proceedings of the 2017 International Conference on Smart Systems and Technologies (SST), Osijek, Croatia, 18–20 October 2017; pp. 23–29. [Google Scholar]
- Ozkan, H.A. A new real time home power management system. Energy Build. 2015, 97, 56–64. [Google Scholar] [CrossRef]
- Ozkan, H.A. Appliance based control for Home Power Management Systems. Energy 2016, 114, 693–707. [Google Scholar] [CrossRef]
- Nabih, A.K.; Gomaa, M.M.; Osman, H.S.; Aly, G.M. Modeling, Simulation, and Control of Smart Homes Using Petri Nets. Int. J. Smart Home 2011, 5, 1–14. [Google Scholar]
- Reignier, P.; Brdiczka, O.; Vaufreydaz, D.; Crowley, J.L.; Maisonnasse, J. Context-aware environments: From specification to implementation. Expert Syst. 2007, 24, 305–320. [Google Scholar] [CrossRef]
- Abraham, J.; Neela, D. Modeling and performance analysis of hybrid inverter HVAC system using colored hybrid petri nets. Glob. J. Pure Appl. Math. 2016, 12, 2355–2366. [Google Scholar]
- Almeida, A.G.S.; Villani, E.; Junqueira, F.; Miyagi, P. Hybrid approach to air conditioning systems modeling using Petri net. ABCM Symp. Ser. Mechatron. 2010, 4, 345–354. [Google Scholar]
- Barwig, F.E.; House, J.M.; Klaassen, C.J.; Ardehali, M.M.; Smith, T.F. National Building Controls Information Program. In Proceedings of the 2002 ACEEE Summer Study on Energy-Efficiency in Buildings, Pacific Grove, CA, USA, 18–23 August 2002. [Google Scholar]
- Belic, F.; Hocenski, Z.; Sliskovic, D. HVAC control methods—A review. In Proceedings of the 19th International Conference on System Theory, Control and Computing (ICSTCC), Cheile Gradistei, Romania, 14–16 October 2015. [Google Scholar]
- Ma, Y.; Matuško, J.; Borrelli, F. Stochastic Model Predictive Control for Building HVAC Systems: Complexity and Conservatism. IEEE Trans. Control Syst. Technol. 2015, 23, 101–116. [Google Scholar] [CrossRef]
- Qin, X.; Lysecky, S.; Jonathan, S. A Data-Driven Linear Approximation of HVAC Utilization for Predictive Control and Optimization. IEEE Trans. Control Syst. Technol. 2015, 23, 778–786. [Google Scholar]
- Kwadzogah, R.; Zhou, M.; Li, S. Model predictive control for HVAC systems—A review. In Proceedings of the IEEE International Conference on Automation Science and Engineering (CASE), Madison, WI, USA, 17–20 August 2013; pp. 442–447. [Google Scholar]
- Ma, Y.; Kelman, A.; Daly, A.; Borrelli, F. Predictive Control for Energy Efficient Buildings with Thermal Storage. IEEE Control Syst. 2012, 32, 44–64. [Google Scholar]
- Liao, Z.; Dexter, A.L. An Inferential Model-Based Predictive Control Scheme for Optimizing the Operation of Boilers in Building Space-Heating Systems. IEEE Trans. Control Syst. Technol. 2010, 18, 1092–1102. [Google Scholar] [CrossRef]
- Astrom, K.J.; Hagglund, T. New Tuning Methods For PID Controllers. In Proceedings of the 3rd ECC, Roma, Italy, 5–8 September 1995; pp. 2456–2462. [Google Scholar]
- Itävuo, P.; Vilkko, M.; Jaatinen, A.; Viilo, K. Dynamic modeling and simulation of cone crushing circuits. Miner. Eng. 2013, 43–44, 29–35. [Google Scholar] [CrossRef]
- Larsson, P.; Hagglund, T. Control Signal Constraints and Filter Order Selection for PI and PID Controllers. In Proceedings of the American Control Conference 2011, San Francisco, CA, USA, 29 June–1 July 2011. [Google Scholar]
- Vladova, Y.R.; Yu, V. Control Signals of a Predictive Industrial PID Controller Article. Russi Eng. Res. 2018, 38, 399–402. [Google Scholar] [CrossRef]
- Woo, Z.W.; Chung, H.Y.; Lin, J.J. A PID Type Fuzzy Controller With Self-Tuning Scaling Factors. Fuzzy Sets Syst. 2000, 115, 321–326. [Google Scholar] [CrossRef]
- Aggarwal, V.; Mao, M.; O’Reilly, U.M. A Self-Tuning Analog Proportional-Integral-Derivative (PID) Controller. In Proceedings of the IEEE Conference on Adaptive Hardware and Systems, Istanbul, Turkey, 15–18 June 2006. [Google Scholar]
- Kokate, R.D.; Waghmare, L.M.; Deshmukh, S.D. Review of Tuning Methods of DMC and Performance Evaluation with PID Algorithms on a FOPDT Model. In Proceedings of the IEEE International Conference on Advances in Recent Technologies in Communication and Computing, Kottayam, India, 16–17 October 2010. [Google Scholar]
- Irshad, M.; Ali, A. A Review on PID tuning rules for SOPTD inverse response processes. In Proceedings of the International Conference on Intelligent Computing, Instrumentation and Control Technologies (ICICICT), Kannur, India, 6–7 July 2017. [Google Scholar]
- Sbarbaro, D. Control of crushing circuits with variable speed drives. IFAC Proc. Vol. 2005, 38, 80–84. [Google Scholar] [CrossRef]
- Astrom, K.; Hägglund, T. PID Controllers: Theory, Design, and Tuning, 2nd ed.; Instrument Society of America: Triangle Park, NC, USA, 1995. [Google Scholar]
- Jain, A.; Hong, L.; Pankanti, S. Biometric identification. Commun. ACM 2000, 43, 90–98. [Google Scholar] [CrossRef]
- Abdel-Hakim, A.E.; El-Saban, M. Face authentication using graph-based low-rank representation of facial local structures for mobile vision applications. In Proceedings of the 2011 IEEE International Conference on Computer Vision Workshops (ICCV Workshops), Barcelona, Spain, 6–13 November 2011; pp. 40–47. [Google Scholar]
- Brunelli, R.; Falavigna, D. Person identification using multiple cues. IEEE Trans. Pattern Anal. Mach. Intell. 1995, 17, 955–966. [Google Scholar] [CrossRef]
- Kanade, T. Picture Processing System by Computer Complex and Recognition of Human Faces. Ph.D. Thesis, Kyoto University, Kyoto, Japan, 1973. [Google Scholar]
- Arandjelovic, O. Gradient edge map features for frontal face recognition under extreme illumination changes. In Proceedings of the BMVC 2012: Proceedings of the British Machine Vision Association Conference, Surrey, UK, 3–7 September 2012. [Google Scholar]
- Arandjelovic, O. Making the most of the self-quotient image in face recognition. In Proceedings of the 10th IEEE International Conference and Workshops on Automatic Face and Gesture Recognition, Shanghai, China, 22–26 April 2013. [Google Scholar]
- Cheng, C.C.; Lee, D. Smart Sensors Enable Smart Air Conditioning Control. Sensors 2014, 14, 11179–11203. [Google Scholar] [CrossRef]


| Places | Transitions | ||
|---|---|---|---|
| An occupancy in the office | User detection | ||
| No occupancy in the office | No user detection | ||
| Stand-by mode | Working status changes from ON to Standby | ||
| ON mode | Working status changes from Standby to ON | ||
| OFF mode | Working status changes from OFF to Standby | ||
| User identif. process | Working status changes from Standby to OFF | ||
| Sending user1 desired temp. to stage3 during t = 10 min | Beginning of the identification | ||
| Sending user2 desired temp. to stage 3 t = 10 min | Lecturer 1 detected | ||
| Sending users 1 and 2 desired temp. to stage 3 t = 10 min | Lecturer 2 detected | ||
| Intermediary state | Lecturer 1 and 2 detected simultaneously | ||
| , and | |||
| and | |||
© 2019 by the authors. Licensee MDPI, Basel, Switzerland. This article is an open access article distributed under the terms and conditions of the Creative Commons Attribution (CC BY) license (http://creativecommons.org/licenses/by/4.0/).
Share and Cite
Bouazza, K.E.; Deabes, W. Smart Petri Nets Temperature Control Framework for Reducing Building Energy Consumption. Sensors 2019, 19, 2441. https://doi.org/10.3390/s19112441
Bouazza KE, Deabes W. Smart Petri Nets Temperature Control Framework for Reducing Building Energy Consumption. Sensors. 2019; 19(11):2441. https://doi.org/10.3390/s19112441
Chicago/Turabian StyleBouazza, Kheir Eddine, and Wael Deabes. 2019. "Smart Petri Nets Temperature Control Framework for Reducing Building Energy Consumption" Sensors 19, no. 11: 2441. https://doi.org/10.3390/s19112441
APA StyleBouazza, K. E., & Deabes, W. (2019). Smart Petri Nets Temperature Control Framework for Reducing Building Energy Consumption. Sensors, 19(11), 2441. https://doi.org/10.3390/s19112441