A Device-Independent Efficient Actigraphy Signal-Encoding System for Applications in Monitoring Daily Human Activities and Health


Abstract
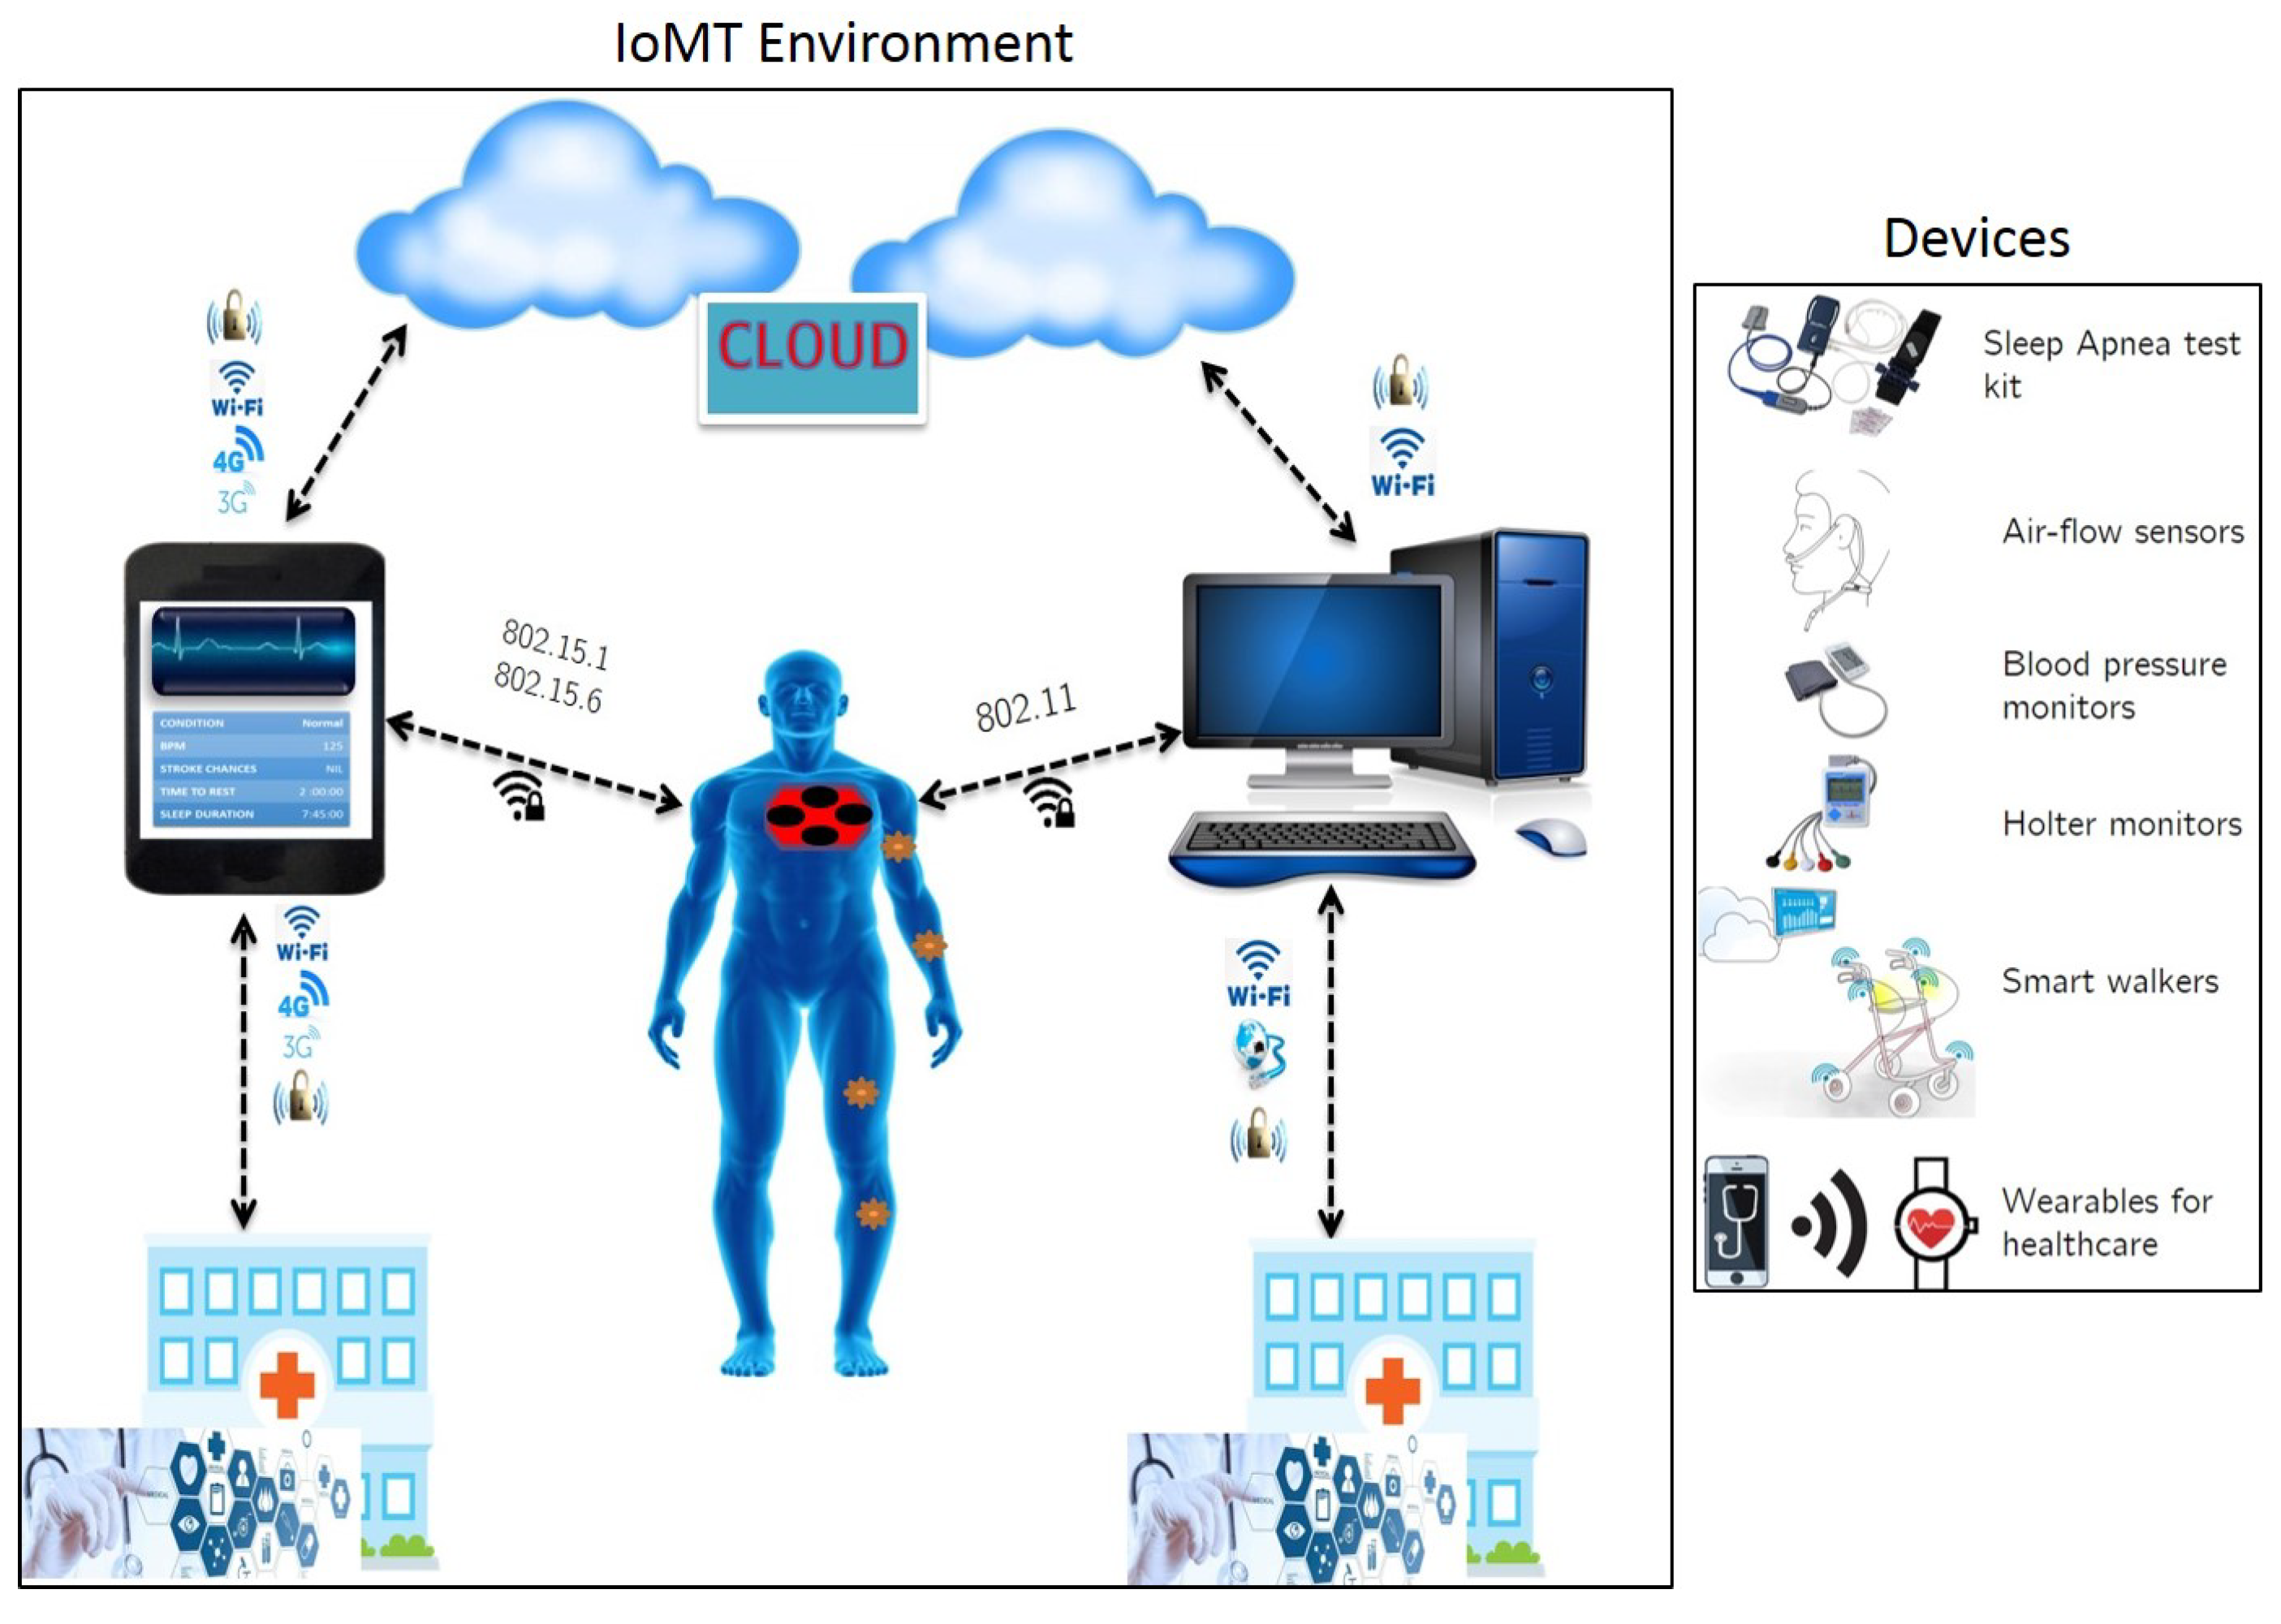
1. Introduction
- Remote health monitoring via telecommunication network.
- Use of mobile health monitoring equipment and applications.
- Doctor-patient consultation via interactive technology.
- Continuous monitoring using smart devices for elderly and critical care individuals.
- Focusing on developing physiological signal analysis algorithms which promote edge computing approaches [4,5,6,9]. That is, the data acquisition, compression and analysis must be done at the device level without having the need to transmit long, streaming data to cloud services. This would lead to optimization of cloud resources by minimizing usage for data storage and analysis. The idea of edge computing is to help in optimizing on-device memory and power usage, thereby increasing operating efficiency and throughput [5,9].
- Ensuring seamless Internet connectivity across users, devices, infrastructure and services.
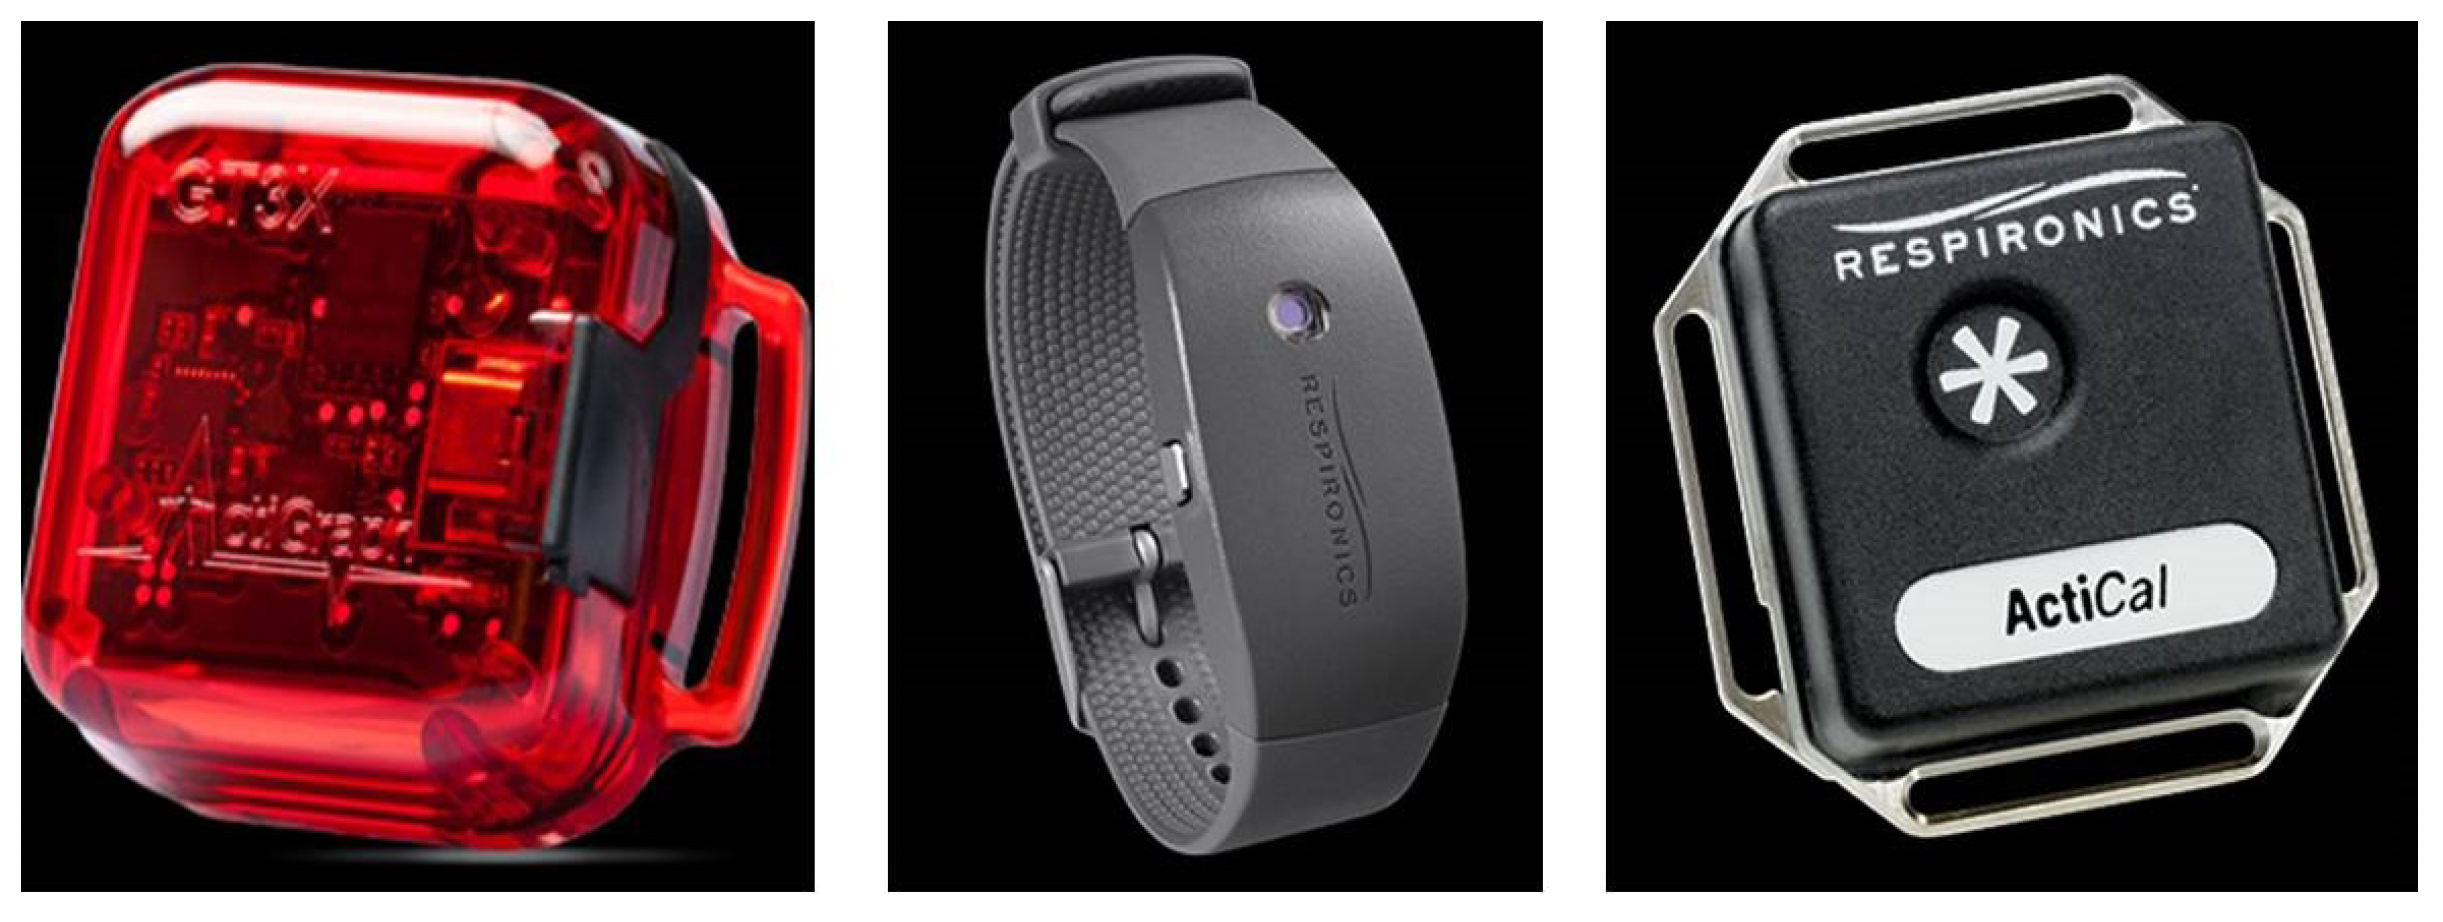
- Developing safe, non-invasive and comfortable wearables embedded with sensors for collecting and processing physiological data in a remote setting.
2. Actigraphy
- Piezoelectric accelerometer for capturing motion/vibrations.
- Signal amplifier coupled with an A-to-D converter.
- low-pass filter to remove external vibrations.
- Flash-memory to store sampled and filtered amplitudes.
- Capacitive and rechargeable battery.
- A micro-USBTM, serial or low power wireless interface to transfer data to a local computer.
- (1)
- A-to-D conversion in order to assign discrete amplitudes to specific movements [29].
- (2)
- (3)
- Additional band-pass filters could be implemented in order to remove low frequency artifacts and noise.
- (4)
- Depending on application, the actigraphy signal is annotated using time-stamps. For example, in many sleep studies, actigraphy data was clipped between “Lights-off” and “Lights-on” time periods, in order to ensure alignment with other clinical signals recorded in simultaneous PSG [7].
- (1)
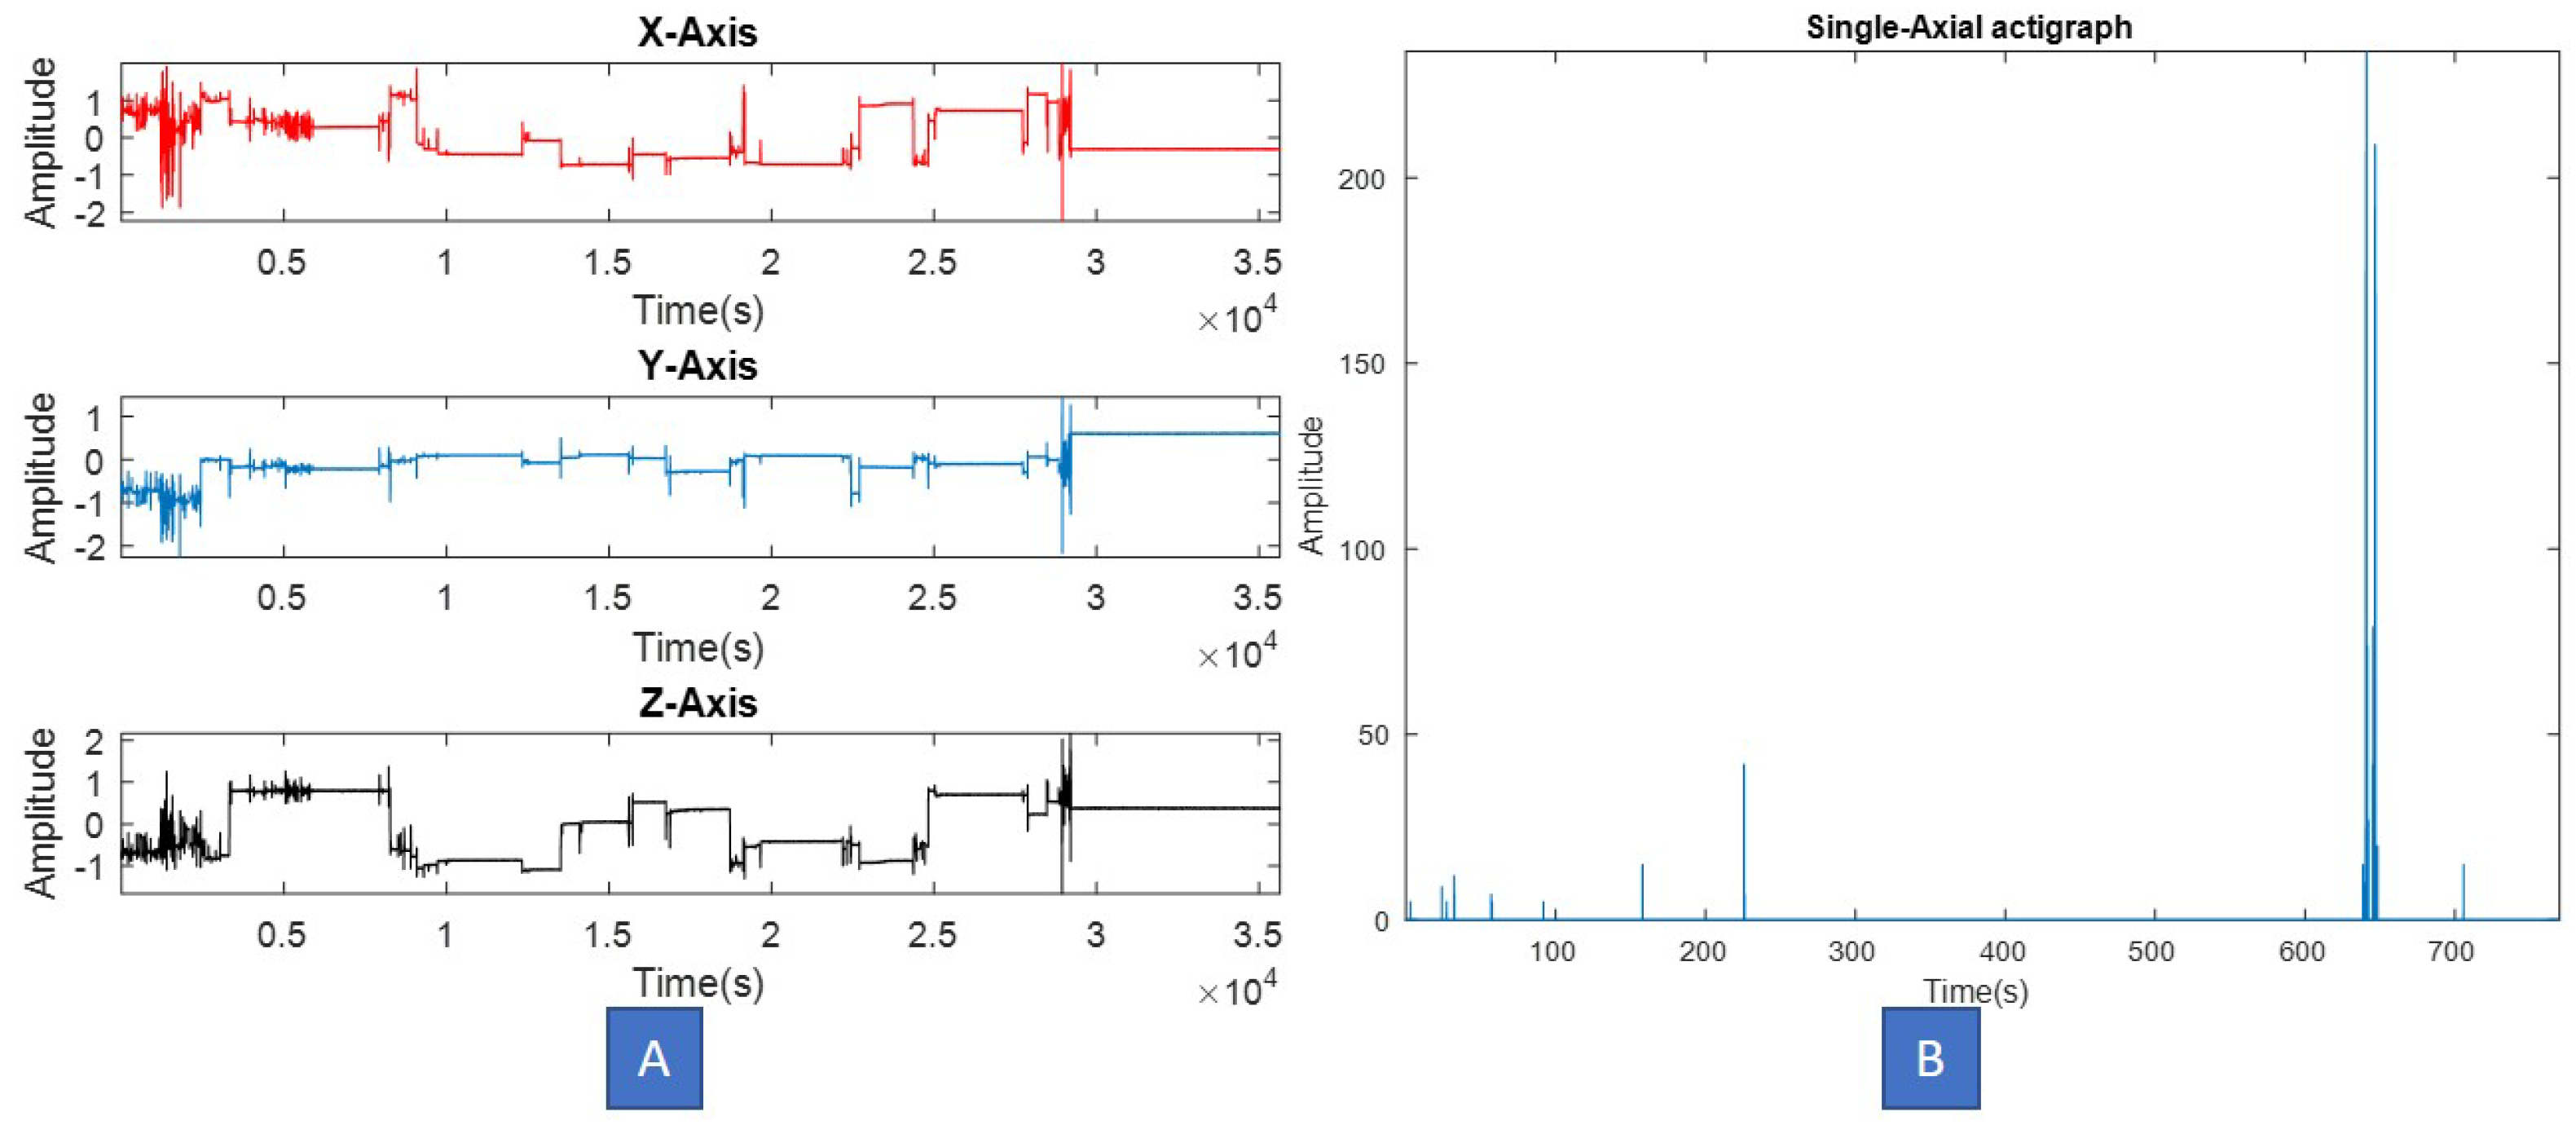
- Actigraphs that sample data at higher frequencies (typically 100 Hz and above) along with a high quantization rate (typically 12–16 bits per sample), often lead to memory leakage and underutilization of battery life during recording.
- (2)
- (3)
- Many prior studies have been conducted on short-duration actigraphy datasets and did not require extensive memory and computational resources for analysis [14,22]. Translating these studies into long-term activity monitoring solutions is not feasible unless the actigraphy data is subjected to significant compression and segmentation at the source.
- (4)
- Increased use of computational resources (local or cloud) during offline processing of long-term recordings. Conventionally, actigraphy data is captured and entirely transferred to a local computer or cloud for analysis. Our review indicates that in most studies, no prior data processing is done at the source to retain only meaningful information and discard redundant values.
Proposed Approach
- (1)
- Data compression at the source. The proposed encoding method intends to reduce the output actigraphy file size, thus enabling faster transfer and read time on a local computer.
- (2)
- Signal normalization and denoising, which removes redundant and minute vibrations captured from highly sensitive accelerometers.
- (3)
- SNR (signal-to-noise ratio) increase and enhancement of meaningful movement amplitudes in the signal.
- (4)
- The proposed scheme also ensures operation across different types of actigraphs, thus promoting device-independency of this algorithm.
3. Materials and Methods
3.1. Data Acquisition
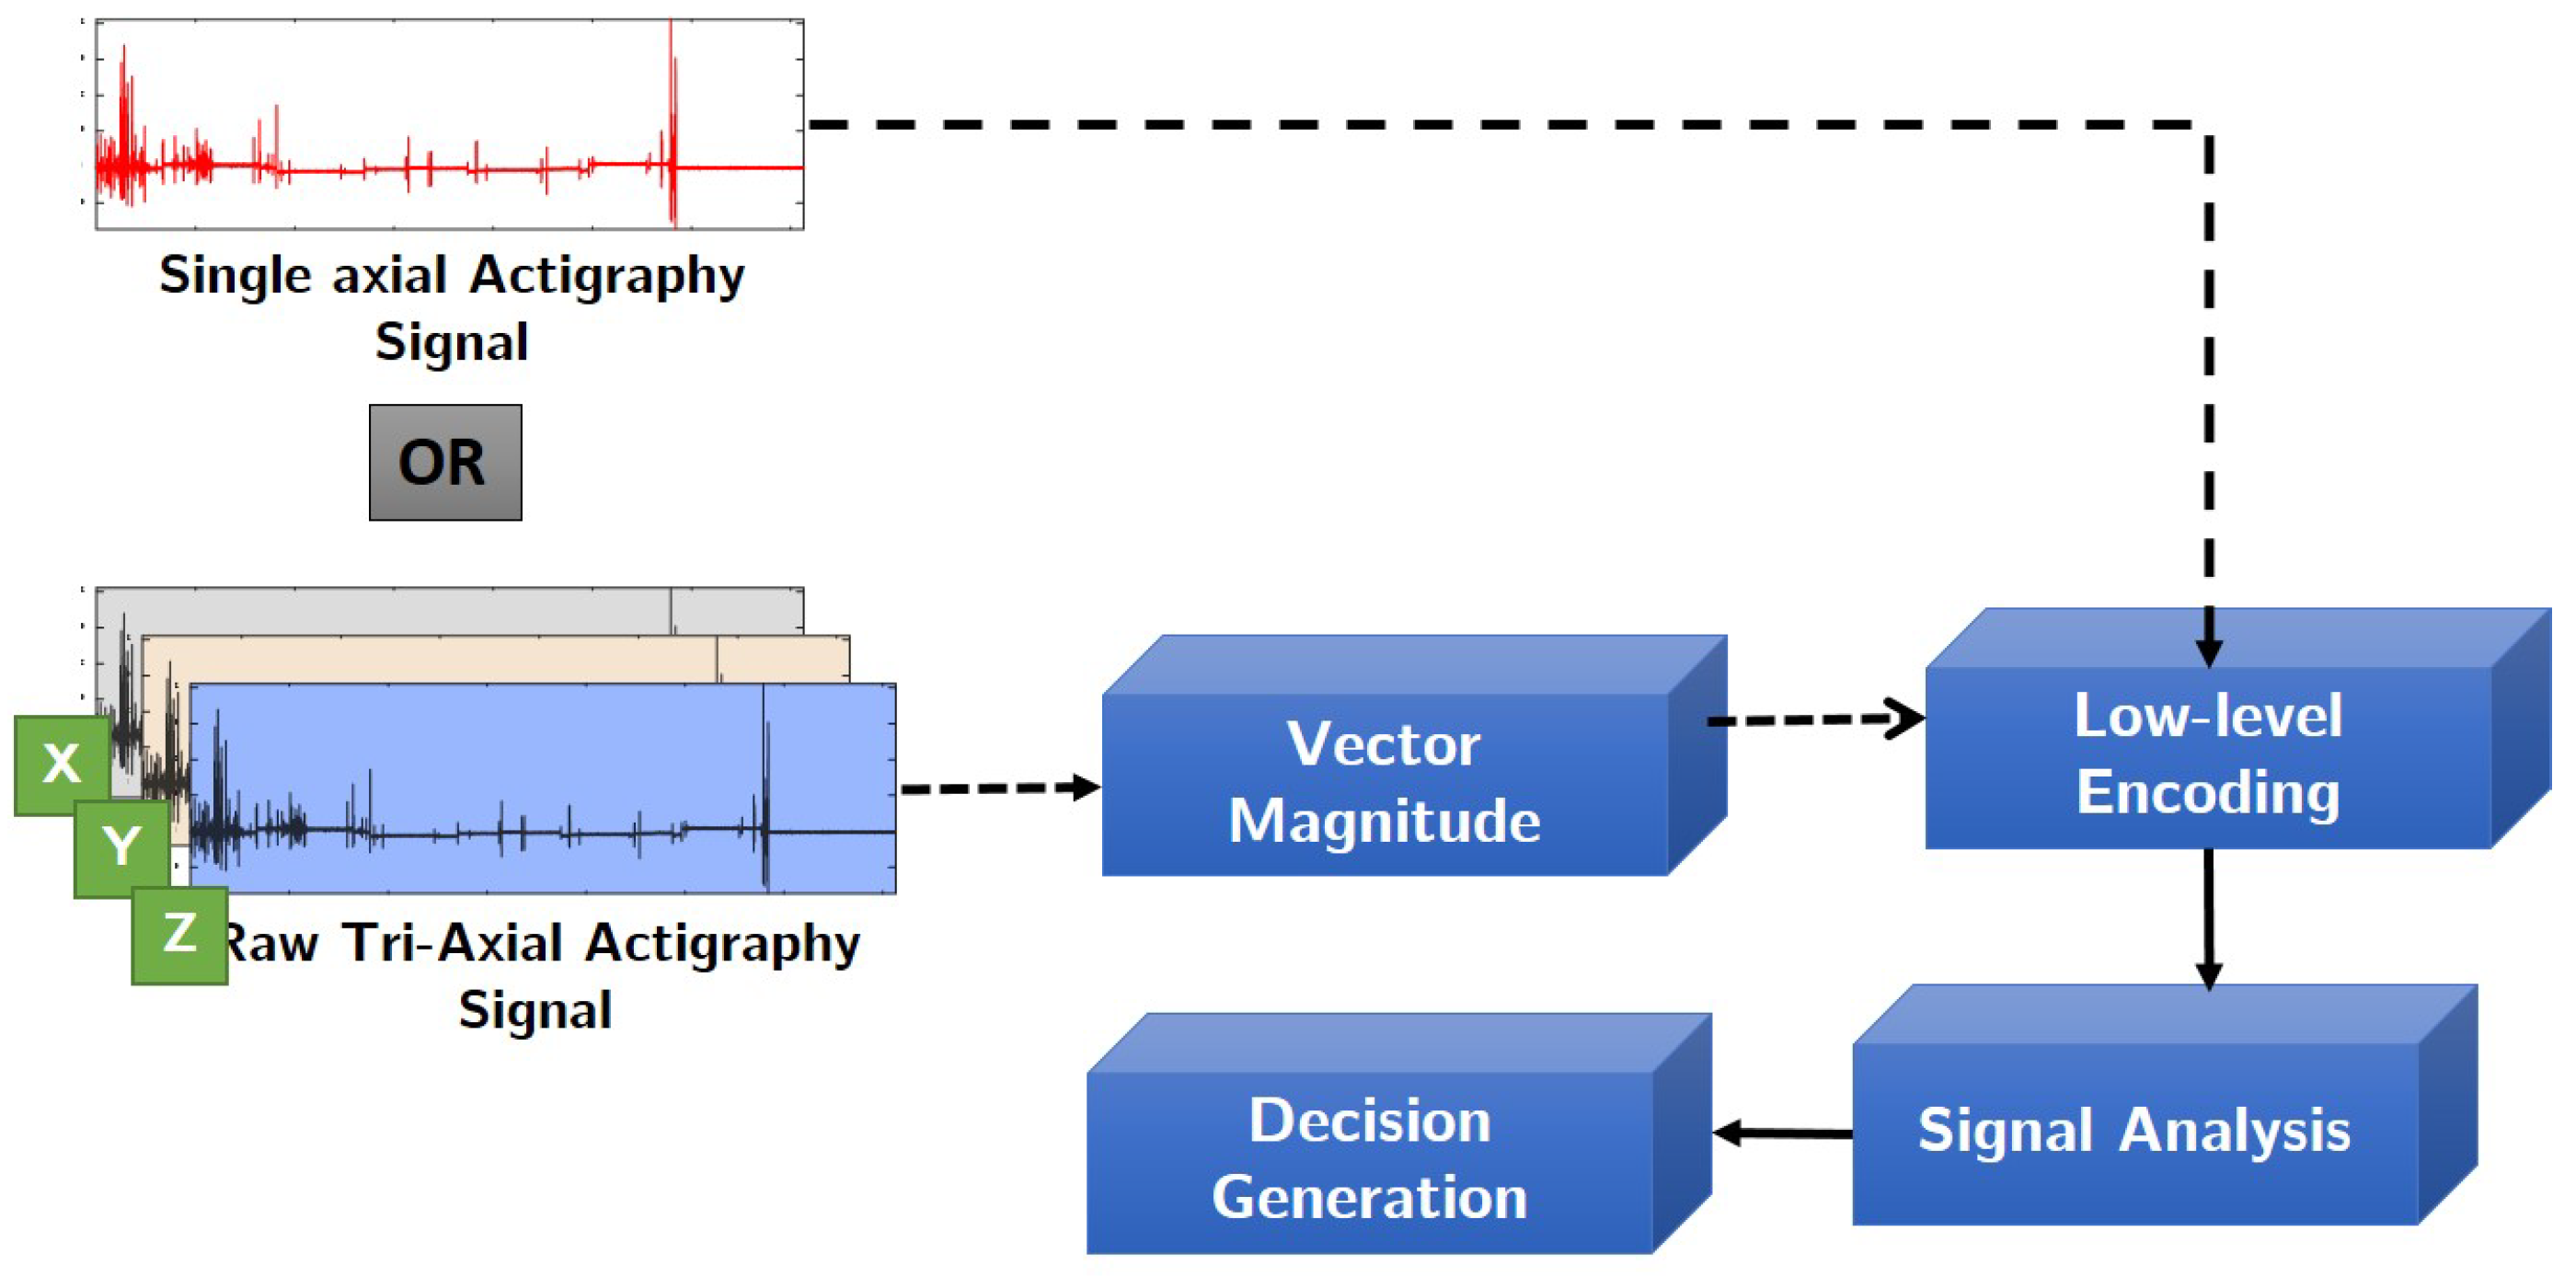
3.2. Proposed Encoding Scheme
- (1)
- The raw actigraphy signal is first normalized with respect to “g” factor using the device specifications. This operation removes signal components which have been amplified or caused due to earth’s gravitational effect on the accelerometer sensor [31]. In this study, depending on the application and device used, one of the following normalization step has been applied. Given a raw actigraphy signal , its corresponding normalized version can be computed as follows:Note that the normalization operation is applied to each axis of the actigraphy signal.
- (2)
- (3)
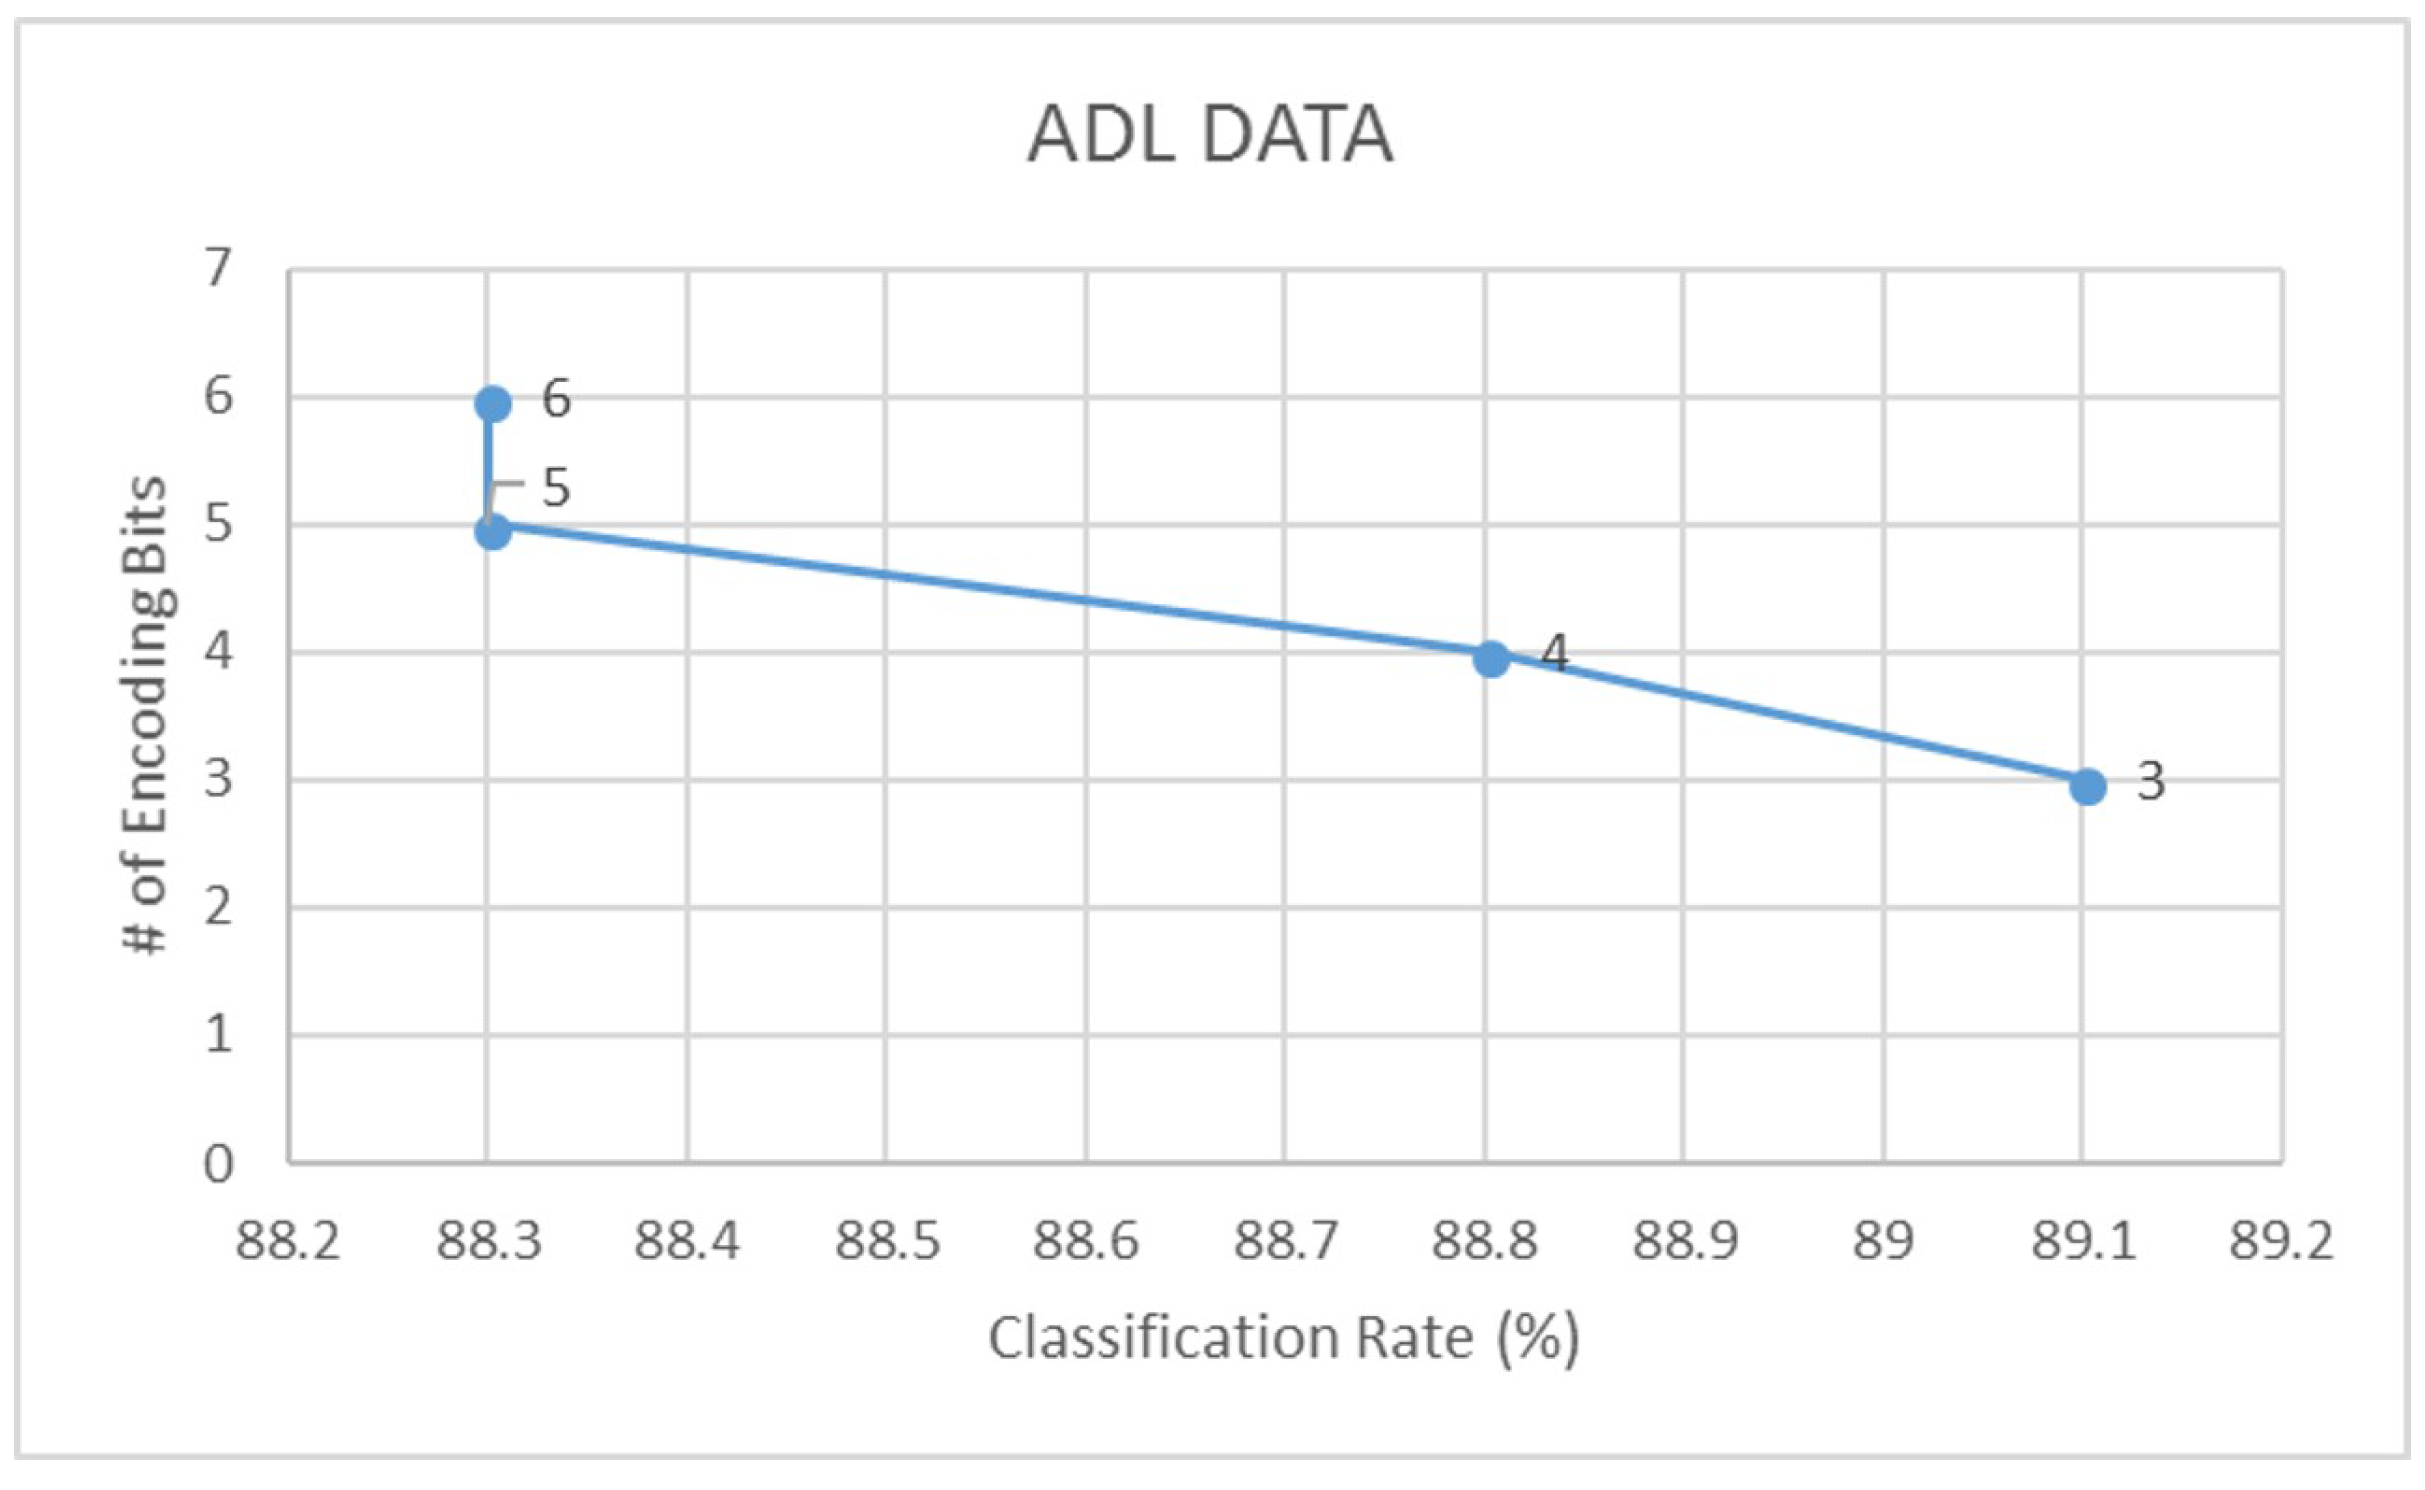
- Assuming that b is the number of encoding bits, and is the quantization factor, we encode the signal S using the floor operation,The floor operation in Equation (5) digitally approximates each value generated from to the greatest integer less than or equal to it. For example, a value of would be mapped to 3. Note that in this study, we have experimented with different levels of encoding depending on the dataset. From our experiments, we have observed that a 3-bit encoding provides highest signal clarity.
- (4)
- The SNR of the encoded actigraphy signal is then calculated as,where, and are the root mean square values of the input normalized signal and the quantization error respectively. The quantization error can be computed as .
3.3. Validation Using Machine Learning
- (1)
- For each dataset, we create two distinct groups, namely:
- Group 1: Raw actigraphy signals, and;
- Group 2: Encoded actigraphy signals
- (2)
- From each signal in Groups 1 and 2, we extract 13 time, frequency [7] and signal-specific features, defined in Table 3 as shown. For the reader’s reference, in this research study we propose two new signal specific features, namely—rapid change factor and spiky index. The remaining 11 features have been used in prior works pertaining to actigraphy and other physiological signal analysis applications [29].
- (3)
- Next, depending on the dataset and its corresponding application, we apply pre-defined labels to Group 1 and 2 feature sets as follows:
- (4)
- Finally, using a 70–30 ratio of training and testing feature data, we use an LDA (linear discriminant analysis) tool to classify actigraphy feature data within Groups 1 and 2 of each dataset. Further to this, we also cross-validate our results with a support vector machine (SVM).
4. Results
4.1. Signal-Encoding Results
4.2. Encoding Validation Results
5. Discussions and Future Works
Author Contributions
Funding
Acknowledgments
Conflicts of Interest
Abbreviations
| IoT | Internet of Things |
| IoMT | Internet of Medical Things |
| VAG | Vibroarthrography |
| ADL | Activities of Daily Life |
| SNR | signal-to-noise ratio |
| LDA | linear discriminant analysis |
| SVM | support vector machine |
References
- Miorandi, D.; Sicari, S.; De Pellegrini, F.; Chlamtac, I. Internet of things: Vision, applications and research challenges. Ad Hoc Netw. 2012, 10, 1497–1516. [Google Scholar] [CrossRef]
- Wortmann, F.; Flüchter, K. Internet of things. Bus. Inf. Syst. Eng. 2015, 57, 221–224. [Google Scholar] [CrossRef]
- Atzori, L.; Iera, A.; Morabito, G. Understanding the Internet of Things: definition, potentials, and societal role of a fast evolving paradigm. Ad Hoc Netw. 2017, 56, 122–140. [Google Scholar] [CrossRef]
- Sethi, P.; Sarangi, S.R. Internet of things: Architectures, protocols, and applications. J. Electr. Comput. Eng. 2017, 2007, 9324035. [Google Scholar] [CrossRef]
- Rodrigues, J.J.; Segundo, D.B.; Junqueira, H.A.; Sabino, M.H.; Prince, R.M.; Al-Muhtadi, J.; de Albuquerque, V.H.C. Enabling Technologies for the Internet of Health Things. IEEE Access 2018, 6, 13129–13141. [Google Scholar] [CrossRef]
- Athavale, Y.; Krishnan, S. Biosignal monitoring using wearables: Observations and opportunities. Biomed. Signal Process. Control 2017, 38, 22–33. [Google Scholar] [CrossRef]
- Athavale, Y.; Krishnan, S.; Dopsa, D.D.; Berneshawi, A.G.; Nouraei, H.; Raissi, A.; Murray, B.J.; Boulos, M.I. Advanced signal analysis for the detection of periodic limb movements from bilateral ankle actigraphy. J. Sleep Res. 2017, 26, 14–20. [Google Scholar] [CrossRef] [PubMed]
- Vandrico—Wearable Technology Database. Available online: http://vandrico.com/wearables/ (accessed on 16 June 2016).
- McMahon, E.; Williams, R.; El, M.; Samtani, S.; Patton, M.; Chen, H. Assessing medical device vulnerabilities on the Internet of Things. In Proceedings of the 2017 IEEE International Conference on Intelligence and Security Informatics (ISI), Beijing, China, 22–24 July 2017; pp. 176–178. [Google Scholar]
- Before Wearables Can Be Used for Health Care Monitoring, These Issues Must Be Addressed-IEEE-The Institute. Available online: http://theinstitute.ieee.org/technology-topics/life-sciences/before-wearables-can-be-used-for-health-care-monitoring-these-issues-must-be-addressed/ (accessed on 7 October 2018).
- Gazis, V. A Survey of Standards for Machine-to-Machine and the Internet of Things. IEEE Commun. Surv. Tutor. 2017, 19, 482–511. [Google Scholar] [CrossRef]
- Acebo, C. Actigraphy. In Sleep: A Comprehensive Handbook; Wiley: Hoboken, NJ, USA, 2005; pp. 1035–1038. [Google Scholar]
- Domingues, A.; Paiva, T.; Sanches, J.M. Sleep and wakefulness state detection in nocturnal actigraphy based on movement information. IEEE Trans. Biomed. Eng. 2014, 61, 426–434. [Google Scholar] [CrossRef] [PubMed]
- Muns, I.W.; Lad, Y.; Guardiola, I.G.; Thimgan, M. Classification of Rest and Active Periods in Actigraphy Data Using PCA. Procedia Comput. Sci. 2017, 114, 275–280. [Google Scholar] [CrossRef]
- El-Manzalawy, Y.; Buxton, O.; Honavar, V. Sleep/wake state prediction and sleep parameter estimation using unsupervised classification via clustering. In Proceedings of the 2017 IEEE International Conference on Bioinformatics and Biomedicine (BIBM), Kansas City, MO, USA, 13–16 November 2017; pp. 718–723. [Google Scholar]
- Camargos, E.F.; Louzada, F.M.; Nóbrega, O.T. Wrist actigraphy for measuring sleep in intervention studies with Alzheimer’s disease patients: Application, usefulness, and challenges. Sleep Med. Rev. 2013, 17, 475–488. [Google Scholar] [CrossRef] [PubMed]
- Maglione, J.E.; Liu, L.; Neikrug, A.B.; Poon, T.; Natarajan, L.; Calderon, J.; Avanzino, J.A.; Corey-Bloom, J.; Palmer, B.W.; Loredo, J.S.; et al. Actigraphy for the assessment of sleep measures in Parkinson’s disease. Sleep 2013, 36, 1209–1217. [Google Scholar] [CrossRef] [PubMed]
- Barth, J.; Klucken, J.; Kugler, P.; Kammerer, T.; Steidl, R.; Winkler, J.; Hornegger, J.; Eskofier, B. Biometric and mobile gait analysis for early diagnosis and therapy monitoring in Parkinson’s disease. In Proceedings of the 2011 Annual International Conference of the IEEE Engineering in Medicine and Biology Society, Boston, MA, USA, 30 August–3 September 2011; pp. 868–871. [Google Scholar]
- Miller, N.L.; Shattuck, L.G.; Matsangas, P. Longitudinal study of sleep patterns of United States Military Academy cadets. Sleep 2010, 33, 1623–1631. [Google Scholar] [CrossRef] [PubMed]
- De Crescenzo, F.; Licchelli, S.; Ciabattini, M.; Menghini, D.; Armando, M.; Alfieri, P.; Mazzone, L.; Pontrelli, G.; Livadiotti, S.; Foti, F.; et al. The use of actigraphy in the monitoring of sleep and activity in ADHD: A meta-analysis. Sleep Med. Rev. 2016, 26, 9–20. [Google Scholar] [CrossRef] [PubMed]
- Wiggs, L.; Stores, G. Sleep patterns and sleep disorders in children with autistic spectrum disorders: Insights using parent report and actigraphy. Dev. Med. Child Neurol. 2004, 46, 372–380. [Google Scholar] [CrossRef] [PubMed]
- Kye, S.; Moon, J.; Lee, T.; Lee, S.; Lee, K.; Shin, S.C.; Lee, Y.S. Detecting periodic limb movements in sleep using motion sensor embedded wearable band. In Proceedings of the IEEE International Conference on Systems, Man, and Cybernetics (SMC), Banff, AB, Canada, 5–8 October 2017; pp. 1087–1092. [Google Scholar]
- Plante, D.T. Leg actigraphy to quantify periodic limb movements of sleep: A systematic review and meta-analysis. Sleep Med. Rev. 2014, 18, 425–434. [Google Scholar] [CrossRef] [PubMed]
- Töreyin, H.; Hersek, S.; Teague, C.N.; Inan, O.T. A Proof-of-Concept System to Analyze Joint Sounds in Real Time for Knee Health Assessment in Uncontrolled Settings. IEEE Sens. J. 2016, 16, 2892–2893. [Google Scholar] [CrossRef]
- Töreyin, H.; Jeong, H.K.; Hersek, S.; Teague, C.N.; Inan, O.T. Quantifying the Consistency of Wearable Knee Acoustical Emission Measurements During Complex Motions. IEEE J. Biomed. Health Inf. 2016, 20, 1265–1272. [Google Scholar] [CrossRef] [PubMed]
- Morrish, E.; King, M.A.; Pilsworth, S.N.; Shneerson, J.M.; Smith, I.E. Periodic limb movement in a community population detected by a new actigraphy technique. Sleep Med. 2002, 3, 489–495. [Google Scholar] [CrossRef]
- Khabou, M.A.; Parlato, M.V. Classification and feature analysis of actigraphy signals. In Proceedings of the 2013 Proceedings of IEEE Southeastcon, Jacksonville, FL, USA, 4–7 April 2013; pp. 1–5. [Google Scholar]
- Athavale, Y.; Krishnan, S.; Raissiz, A.; Kirolos, N.; Murray, B.J.; Boulos, M.I. Integrated Signal Encoding and Analysis System for Actigraphy-based Long-term Monitoring of Periodic Limb Movements in Sleep. Presented at the 2018 IEEE EMBC International Conference, Honolulu, HI, USA, 17–21 July 2018. In Press, Engineering in Medicine and Biology Society. [Google Scholar]
- Krishnan, S.; Athavale, Y. Trends in biomedical signal feature extraction. Biomed. Signal Process. Control 2018, 43, 41–63. [Google Scholar] [CrossRef]
- Marcio de Almeida Mendes, M.; da Silva, I.C.; Ramires, V.V.; Reichert, F.F.; Martins, R.C.; Tomasi, E. Calibration of raw accelerometer data to measure physical activity: A systematic review. Gait Posture 2018, 61, 98–110. [Google Scholar] [CrossRef] [PubMed]
- Gyllensten, I.C. Physical Activity Recognition in Daily Life Using a Traxial Accelerometer; Skolan för Datavetenskap och Kommunikation, Kungliga Tekniska högskolan: Stockholm, Sweden, 2010. [Google Scholar]
- Zhang, S.; Rowlands, A.V.; Murray, P.; Hurst, T.L. Physical activity classification using the GENEA wrist-worn accelerometer. Med. Sci. Sports Exerc. 2012, 44, 742–748. [Google Scholar] [CrossRef] [PubMed]
- Kwiatkowski, D.; Phillips, P.C.; Schmidt, P.; Shin, Y. Testing the null hypothesis of stationarity against the alternative of a unit root: How sure are we that economic time series have a unit root? J. Econometr. 1992, 54, 159–178. [Google Scholar] [CrossRef]
- Fuller, W.A. Introduction to Statistical Time Series; John Wiley & Sons: New York, NY, USA, 1976. [Google Scholar]
- Ghasemi, A.; Zahediasl, S. Normality tests for statistical analysis: A guide for non-statisticians. Int. J. Endocrinol. Metab. 2012, 10, 486. [Google Scholar] [CrossRef] [PubMed]
- Zonoobi, D.; Kassim, A.A.; Venkatesh, Y.V. Gini index as sparsity measure for signal reconstruction from compressive samples. IEEE J. Sel. Top. Signal Process. 2011, 5, 927–932. [Google Scholar] [CrossRef]
- Athavale, Y.; Boulos, M.; Murray, B.J.; Krishnan, S. Classification of periodic leg movements through actigraphy signal analysis. In Proceedings of the 2016 CMBES39 Conference, Calgary, AB, Canada, 24–27 May 2016. [Google Scholar]
- Dheeru, D.; Karra Taniskidou, E. UCI Machine Learning Repository. 2017. Available online: https://archive.ics.uci.edu/ml/index.php (accessed on 23 July 2018).
- Krishnan, S.; Rangayyan, R.M.; Bell, G.D.; Frank, C.B. Adaptive time-frequency analysis of knee joint vibroarthrographic signals for noninvasive screening of articular cartilage pathology. IEEE Trans. Biomed. Eng. 2000, 47, 773–783. [Google Scholar] [CrossRef] [PubMed]
- Ferri, R. The time structure of leg movement activity during sleep: the theory behind the practice. Sleep Med. 2012, 13, 433–441. [Google Scholar] [CrossRef] [PubMed]
- Gschliesser, V.; Frauscher, B.; Brandauer, E.; Kohnen, R.; Ulmer, H.; Poewe, W.; Högl, B. PLM detection by actigraphy compared to polysomnography: A validation and comparison of two actigraphs. Sleep Med. 2009, 10, 306–311. [Google Scholar] [CrossRef] [PubMed]
- Hjorth, B. EEG analysis based on time domain properties. Electroencephalogr. Clin. Neurophysiol. 1970, 29, 306–310. [Google Scholar] [CrossRef]
- Celler, B.G.; Sparks, R.S. Home Telemonitoring of Vital Signs Technical Challenges and Future Directions. IEEE J. Biomed. Health Inform. 2015, 19, 82–91. [Google Scholar] [CrossRef] [PubMed]


| Property Test | Observations |
|---|---|
| Visual inspection | Spiky data with a lot of transient information randomly distributed. Motion events seem uncorrelated when separated by significant time period. |
| Stationarity—KPSS test [33] | Non-stationary signals |
| Linearity—Augmented Dickey–Fuller test [34] | Non-linear data |
| Gaussianity—KS test [35] | Non-Gaussian distribution in most cases, since human motion is random. |
| Sparsity test—Gini Index [36] | Sparse in short windows. In case of tri-axial data, vector compounding and additional quantization may be needed. |
| Application | Data-Type | No. of Signals | Length/Signal | Resolution | |
|---|---|---|---|---|---|
| Sleep [28] | Tri-axial | 50 | 6–8 h | 16-bits/sample | 25 Hz |
| ADL [38] | Tri-axial | 274 | 5–60 s | 6-bits/sample | 32 Hz |
| VAG [39] | Single-axial | 89 | 3–5 s | 12-bits/sample | 2 kHz |
| Domain | Feature | Description |
|---|---|---|
| Time | RMS | Root mean square value of the signal |
| Maxima | Maximum Peak value in the signal | |
| Peak-to-Peak | Difference between maximum and minimum peak | |
| Peak-to-RMS | Maximum peak to RMS ratio | |
| Peak-to-Avg.Power | Maximum peak to avg. power ratio | |
| SNDR | Signal to noise & distortion ratio | |
| Hjorth’s Parameters [42] | First order mobility, | |
| Second order mobility, | ||
| Complexity, | ||
| Frequency | Median Frequency | Median normalized frequency of power spectrum |
| Band power | Average signal power | |
| Signal-Specific | Spiky Index | |
| Rapid Change Factor |
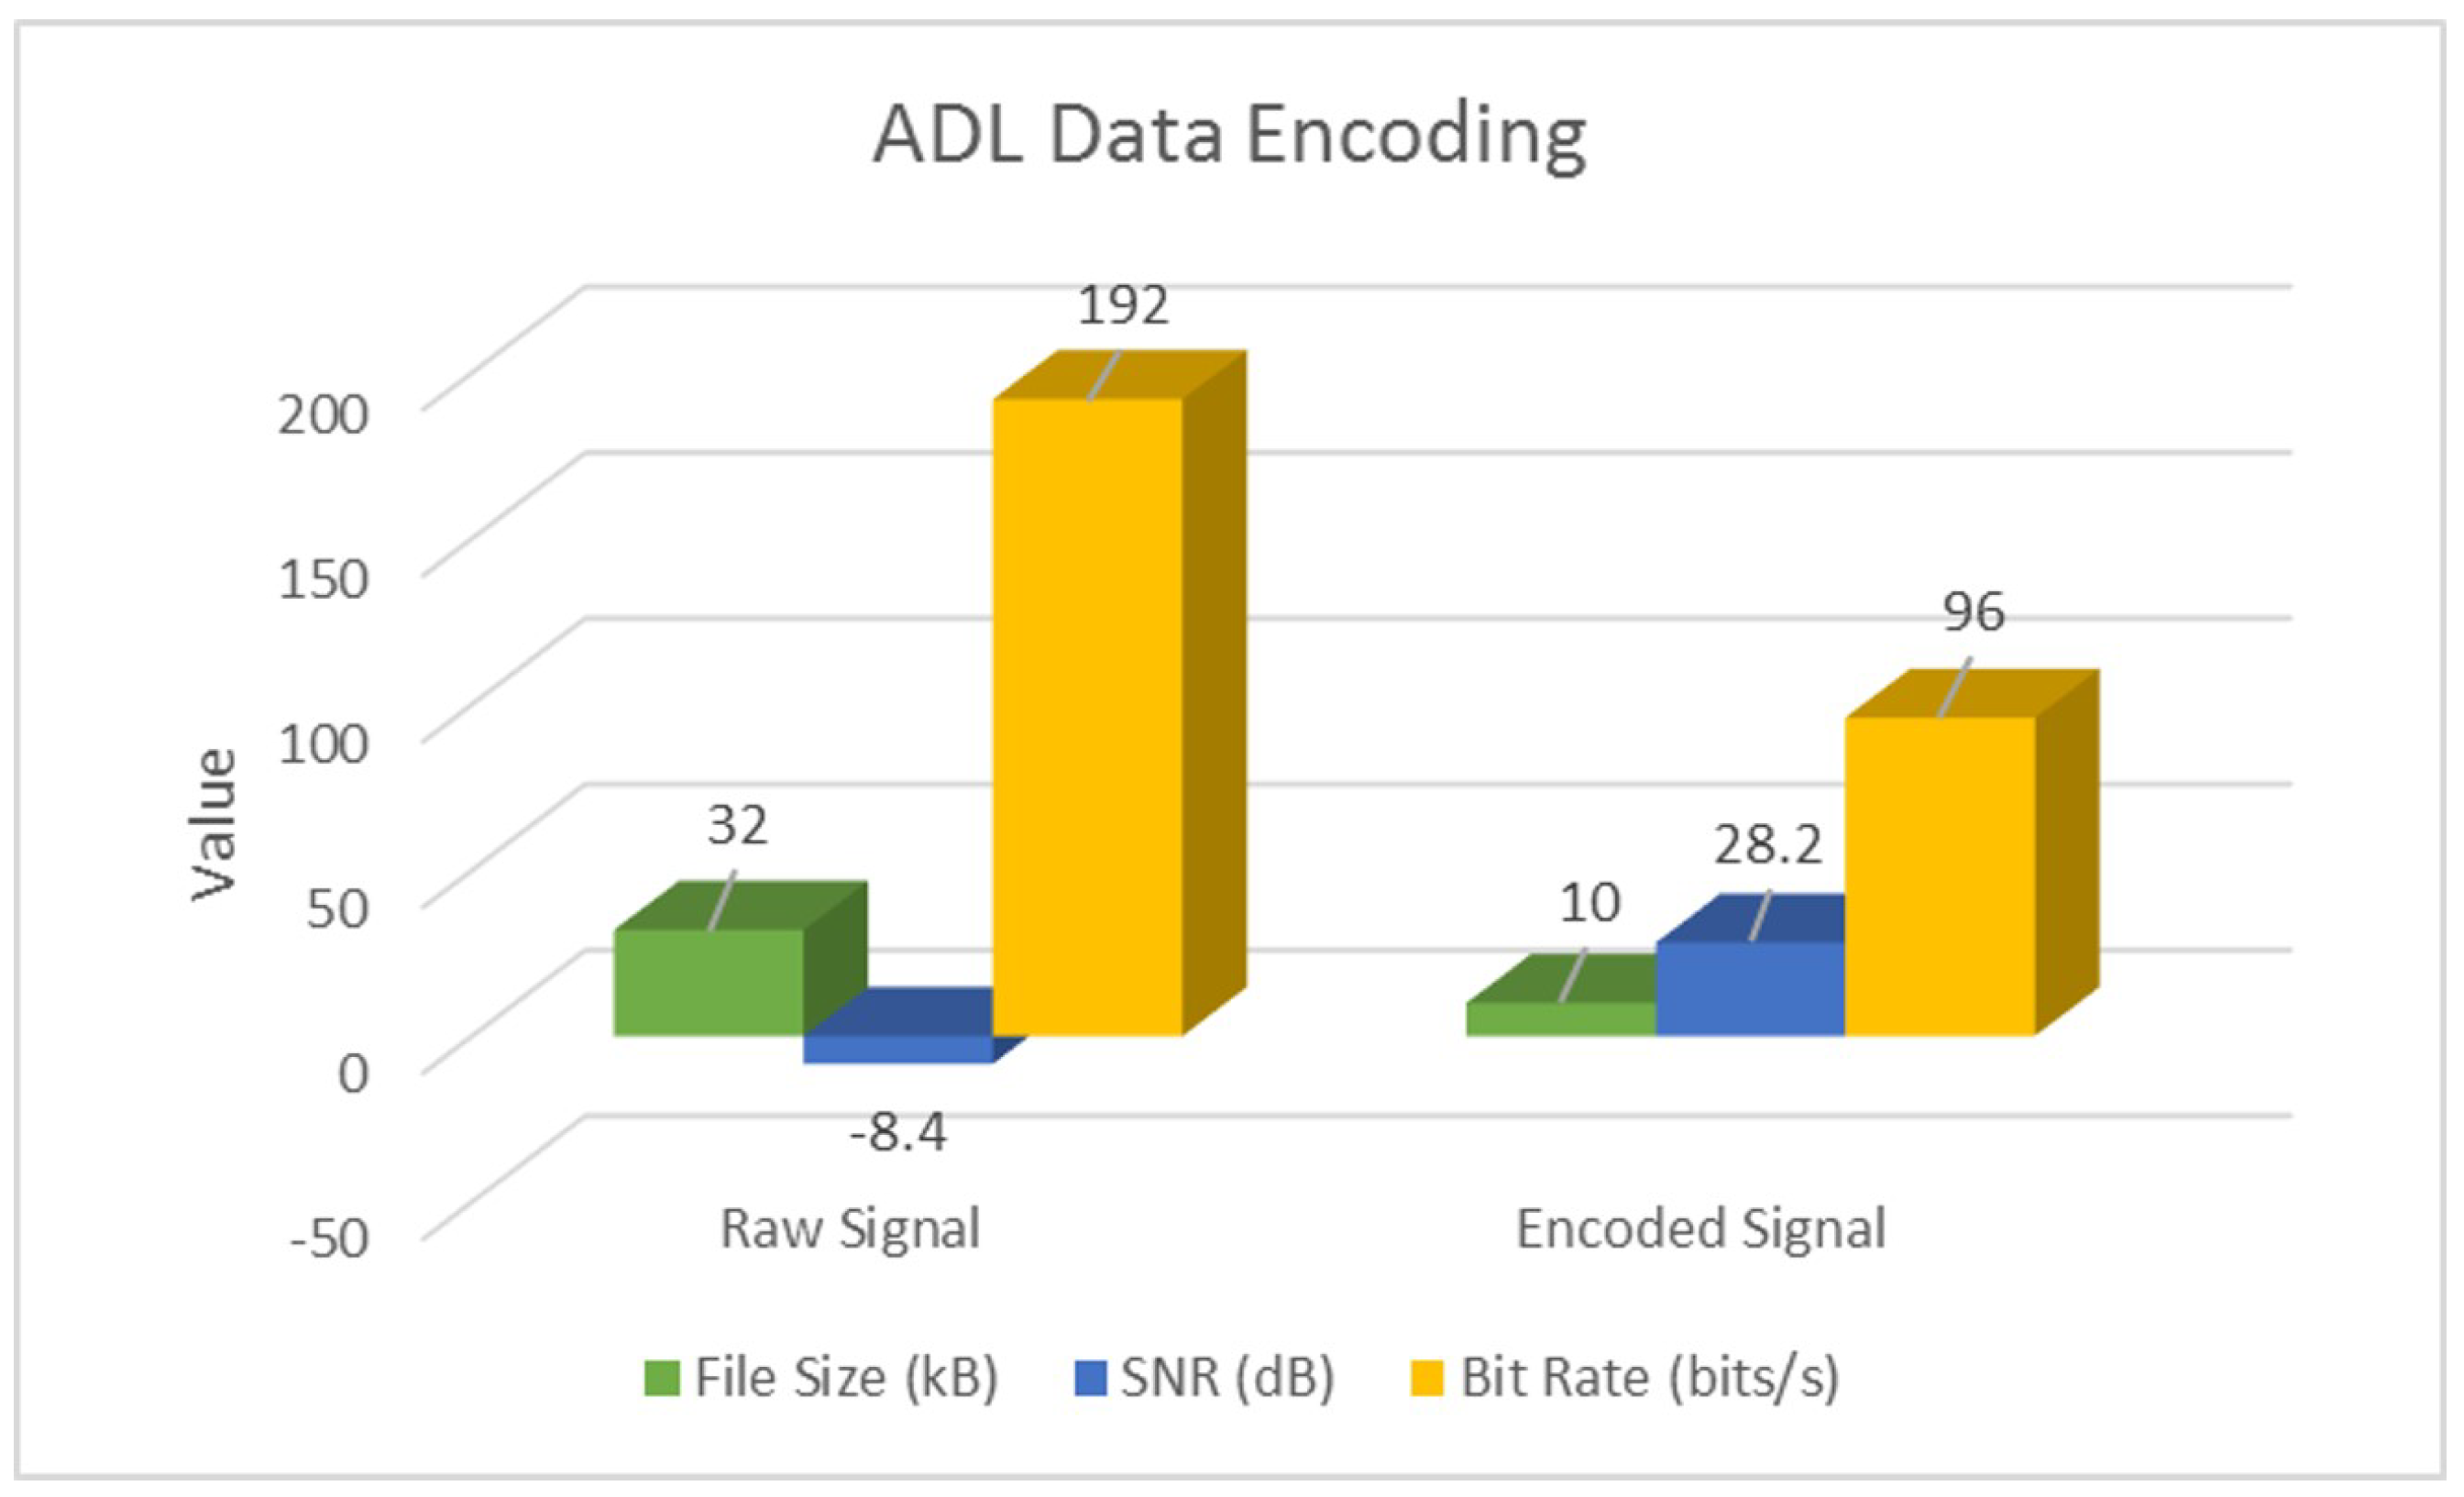
| Signal Type | Parameter | Sleep | ADL | VAG |
|---|---|---|---|---|
| Raw | SNR (dB) | −18.9 | −48.4 | −0.1 |
| Bit Rate (bits/s) | 400 | 192 | ||
| Encoded | SNR (dB) | 38.8 | 28.2 | 19.9 |
| Bit Rate (bits/s) | 75 | 96 | ||
| Overall | % Space Savings | 92% | 68% | 88% |
| Data | Raw Features | Encoded Features | ||||||
|---|---|---|---|---|---|---|---|---|
| LDA | SVM | LDA | SVM | |||||
| Accuracy (%) | F1-Score | Accuracy (%) | F1-Score | Accuracy (%) | F1-Score | Accuracy (%) | F1-Score | |
| Sleep | 87.1 | 0.78 | 83.3 | 0.71 | 93.3 | 0.90 | 93.3 | 0.91 |
| ADL | 88.3 | 0.82 | 82.8 | 0.73 | 89.1 | 0.85 | 84.9 | 0.76 |
| VAG | 57.7 | 0.45 | 65.4 | 0.59 | 76.0 | 0.70 | 84.6 | 0.81 |
© 2018 by the authors. Licensee MDPI, Basel, Switzerland. This article is an open access article distributed under the terms and conditions of the Creative Commons Attribution (CC BY) license (http://creativecommons.org/licenses/by/4.0/).
Share and Cite
Athavale, Y.; Krishnan, S. A Device-Independent Efficient Actigraphy Signal-Encoding System for Applications in Monitoring Daily Human Activities and Health. Sensors 2018, 18, 2966. https://doi.org/10.3390/s18092966
Athavale Y, Krishnan S. A Device-Independent Efficient Actigraphy Signal-Encoding System for Applications in Monitoring Daily Human Activities and Health. Sensors. 2018; 18(9):2966. https://doi.org/10.3390/s18092966
Chicago/Turabian StyleAthavale, Yashodhan, and Sridhar Krishnan. 2018. "A Device-Independent Efficient Actigraphy Signal-Encoding System for Applications in Monitoring Daily Human Activities and Health" Sensors 18, no. 9: 2966. https://doi.org/10.3390/s18092966
APA StyleAthavale, Y., & Krishnan, S. (2018). A Device-Independent Efficient Actigraphy Signal-Encoding System for Applications in Monitoring Daily Human Activities and Health. Sensors, 18(9), 2966. https://doi.org/10.3390/s18092966