Research on Construction Workers’ Activity Recognition Based on Smartphone


Abstract
1. Introduction
2. Literature Review
3. Research Method
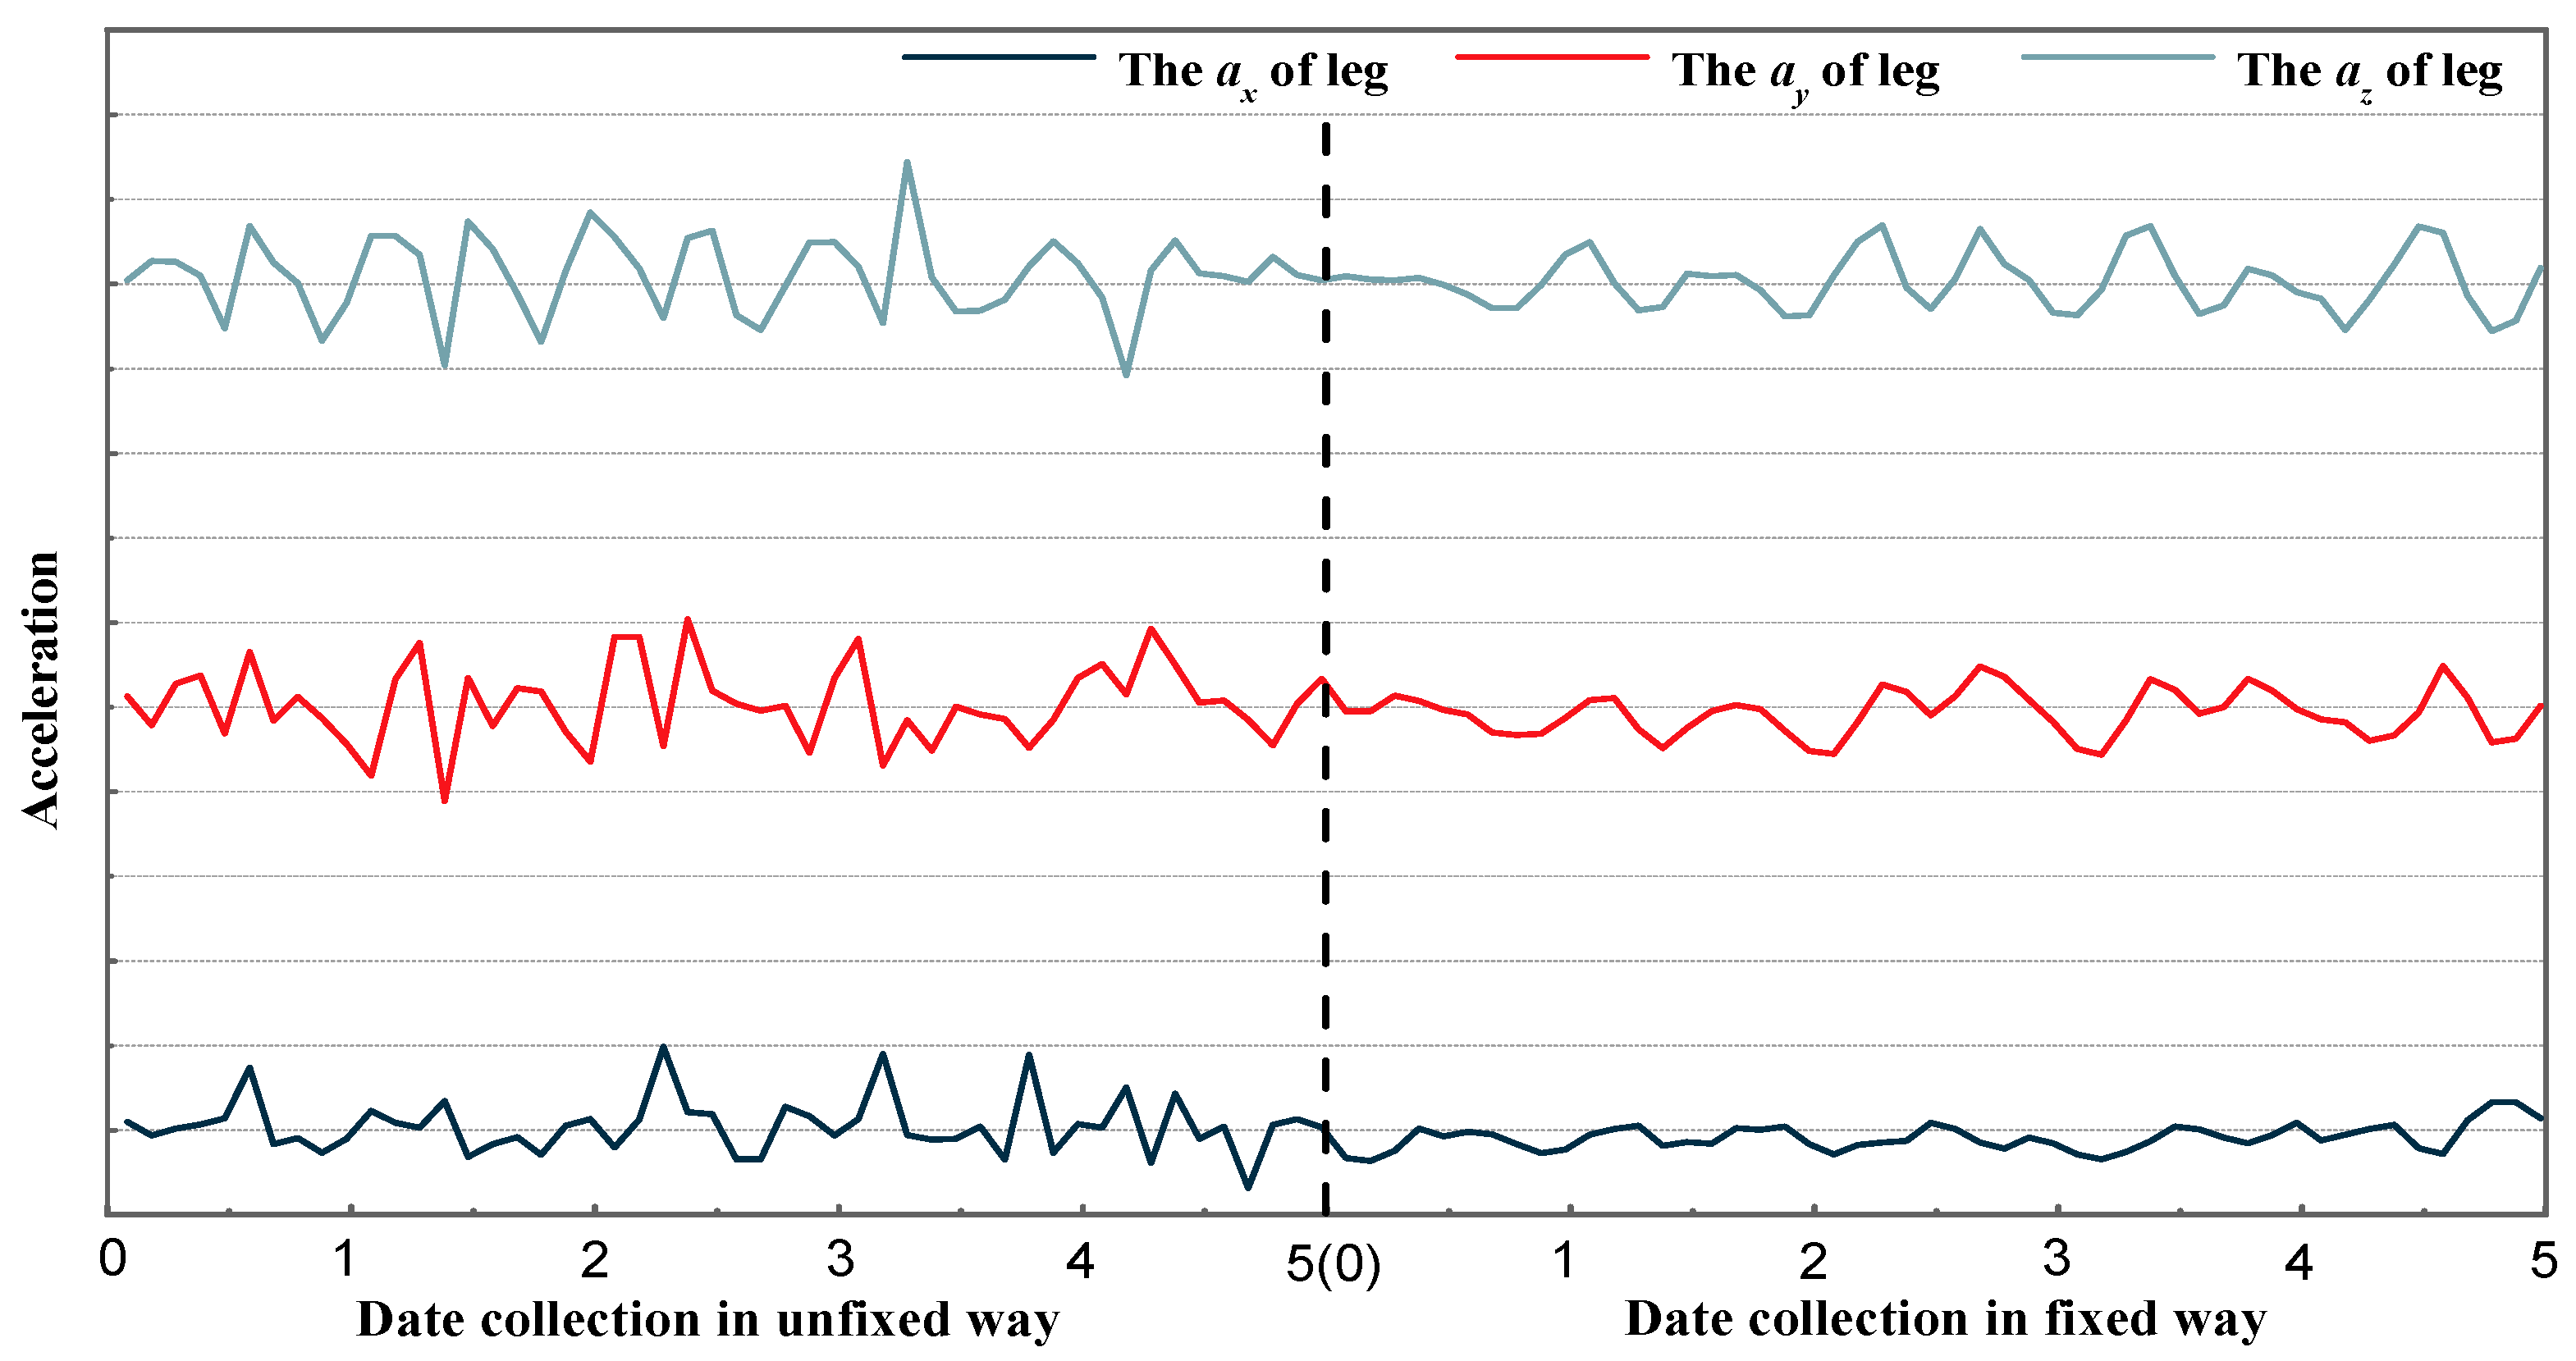
3.1. Data Collection Using Smartphones
3.2. Data Preparation
3.3. Feature Extraction
3.4. Data Labelling
3.5. Supervised Learning
3.6. Classification Model Verification and Evaluation
3.7. Activity Identification
4. Experiment Setup
4.1. Data Acquisition
4.2. Feature Extraction
4.3. Activity Classification and Recognition
5. Results and Discussion
6. Conclusions
7. Future Work
Author Contributions
Funding
Conflicts of Interest
References
- Stiefmeier, T.; Roggen, D.; Ogris, G.; Lukowicz, P.; Tröster, G. Wearable Activity tracking in car manufacturing. IEEE Pervasive Comput. 2008, 7, 42–50. [Google Scholar] [CrossRef]
- Cheng, T.; Teizer, J.; Migliaccio, G.C.; Gatti, U.C. Automated task-level activity analysis through fusion of real time location sensors and worker’s thoracic posture data. Autom. Constr. 2013, 29, 24–39. [Google Scholar] [CrossRef]
- Akhavian, R.; Behzadan, AH. Smartphone-based construction workers’ activity recognition and classification. Autom. Constr. 2016, 71, 198–209. [Google Scholar] [CrossRef]
- Favela, J.; Tentori, M.; Castro, L.A.; Gonzalez, V.M.; Moran, E.B.; Martínez-García, A.I. Activity Recognition for Context-aware Hospital Applications: Issues and Opportunities for the Deployment of Pervasive Networks. Mob. Netw. Appl. 2007, 12, 155–171. [Google Scholar] [CrossRef]
- Anjum, A.; Ilyas, M.U. Activity recognition using smartphone sensors. In Proceedings of the 2013 IEEE 10th Consumer Communications and Networking Conference, Las Vegas, NV, USA, 11–14 January 2013; pp. 914–919. [Google Scholar]
- Lara, O.D.; Labrador, M.A. A Mobile Platform for Real-time Human Activity Recognition. In Proceedings of the 2012 IEEE Consumer Communications and Networking Conference, Las Vegas, NV, USA, 14–17 January 2012; pp. 667–671. [Google Scholar]
- Lu, H.; Yang, J.; Liu, Z.; Lane, N.D.; Houdhury, T.; Campbell, A.T. The Jigsaw Continuous Sensing Engine for Mobile Phone Applications. In Proceedings of the 8th ACM Conference on Embedded Networked Sensor Systems, Zurich, Switzerland, 3–5 November 2010; pp. 71–84. [Google Scholar]
- Reddy, S.; Mun, M.; Burke, J.; Estrin, D.; Hansen, M.; Srivastava, M. Using mobile phones to determine transportation modes. ACM Trans. Sens. Netw. 2010, 6, 1–27. [Google Scholar] [CrossRef]
- Ryder, J.; Longstaff, B.; Reddy, S.; Estrin, D. Ambulation: A tool for monitoring mobility patterns over time using mobile phones. In Proceedings of the 2009 International Conference on Computational Science and Engineering, Vancouver, BC, Canada, 29–31 August 2009. [Google Scholar]
- Lin, K.C.; Chang, L.S.; Tseng, C.M.; Lin, H.H.; Chen, Y.F.; Chao, C.L. A Smartphone APP for Health and Tourism Promotion. Math. Probl. Eng. 2014, 2014, 583179. [Google Scholar] [CrossRef]
- Kim, T.S.; Cho, J.H.; Kim, J.T. Mobile Motion Sensor-Based Human Activity Recognition and Energy Expenditure Estimation in Building Environments. Sustainability in Energy and Buildings. In Sustainability in Energy and Buildings; Springer: Berlin/Heidelberg, Germany, 2013; pp. 987–993. [Google Scholar]
- Khan, A.M.; Tufail, A.; Khattak, A.M.; Laine, T.H. Activity Recognition on Smartphones via Sensor-Fusion and KDA-Based SVMs. Int. J. Distrib. Sens. Netw. 2014, 10, 503291. [Google Scholar] [CrossRef]
- Zhang, M.Y.; Cao, T.Z.; Zhao, X.F. Applying Sensor-Based Technology to Improve Construction Safety Management. Sensors 2017, 17, 1841. [Google Scholar] [CrossRef] [PubMed]
- Miluzzo, E.; Lane, N.D. Sensing Meets Mobile Social Networks: The Design, Implementation and Evaluation of the CenceMe Application. In Proceedings of the 6th ACM Conference on Embedded Networked Sensor Systems, Raleigh, NC, USA, 4–7 November 2008; pp. 337–350. [Google Scholar]
- Kazushige, O.; Miwako, D. Indoor-Outdoor Activity Recognition by a Smartphone. In Proceedings of the 2012 ACM Conference on Ubiquitous Computing, Pittsburgh, PA, USA, 5–8 September 2012; pp. 600–601. [Google Scholar]
- Berchtold, M.; Budde, M.; Gordon, D.; Schmidtke, H.R.; Beigl, M. ActiServ: Activity Recognition Service for Mobile Phones. In Proceedings of the International Symposium on Wearable Computers, Seoul, Korea, 10–13 October 2010; pp. 1–8. [Google Scholar]
- Joshua, L.; Varghese, K. Selection of Accelerometer Location on Bricklayers Using Decision Trees. Comput.-Aided Civ. Infrastruct. Eng. 2013, 28, 372–388. [Google Scholar] [CrossRef]
- Figo, D.; Diniz, P.C.; Ferreira, D.R.; Cardoso, J.M. Preprocessing techniques for context recognition from accelerometer data. Pers. Ubiquitous Comput. 2010, 14, 645–662. [Google Scholar] [CrossRef]
- Shoaib, M.; Bosch, S.; Incel, O.D.; Scholten, H.; Havinga, P.J.M. A Survey of Online Activity Recognition Using Mobile Phones. Sensors 2015, 15, 2059–2085. [Google Scholar] [CrossRef] [PubMed]
- Cornacchia, M.; Ozcan, K.; Zheng, Y.; Velipasalar, S. A Survey on Activity Detection and Classification Using Wearable Sensors. IEEE Sens. J. 2017, 17, 386–403. [Google Scholar]
- Tharindu, W.; Janaka, Y.R. Automated Data Acquisition System to Assess Construction Worker Performance. In Proceedings of the Construction Research Congress 2009: Building a Sustainable Future, Seattle, VA, USA, 5–7 April 2009; pp. 61–70. [Google Scholar]
- Joshua, L.; Varghese, K. Accelerometer-Based Activity Recognition in Construction. J. Comput. Civ. Eng. 2011, 25, 370–380. [Google Scholar] [CrossRef]
- Joshua, L.; Varghese, K. Automated recognition of construction labour activity using accelerometers in field situations. Int. J. Prod. Perform. Manag. 2014, 63, 841–862. [Google Scholar] [CrossRef]
- Akhavian, R.; Behzadan, A. Wearable sensor-based activity recognition for data-driven simulation of construction workers’ activities. In Proceedings of the 2015 Winter Simulation Conference, Huntington Beach, CA, USA, 6–9 December 2015; pp. 3333–3344. [Google Scholar]
- Siirtola, P.; Roning, J. Ready-to-Use Activity Recognition for Smartphones. In Proceedings of the 2013 IEEE Symposium on Computational Intelligence and Data Mining, Singapore, 16–19 April 2013; pp. 59–64. [Google Scholar]
- Kim, H.; Ahn, C.R.; Yang, K. Identifying Safety Hazards Using Collective Bodily Responses of Workers. J. Constr. Eng. Manag. 2017, 143, 04016090. [Google Scholar] [CrossRef]
- Schindhelm, C. Activity recognition and step detection with smartphones: Towards terminal based indoor positioning system. In Proceedings of the 2012 IEEE 23rd International Symposium on Personal Indoor and Mobile Radio Communications (PIMRC), Sydney, Australia, 9–12 September 2012; pp. 2454–2459. [Google Scholar]
- Thiemjarus, S.; Henpraserttae, A.; Marukatat, S. A study on instance-based learning with reduced training prototypes for device-context-independent activity recognition on a mobile phone. In Proceedings of the 2013 IEEE International Conference on Body Sensor Networks (BSN), Cambridge, MA, USA, 6–9 May 2013; pp. 1–6. [Google Scholar]
- Lim, T.K.; Park, S.M.; Lee, H.C.; Lee, D.E. Artificial Neural Network-Based Slip-Trip Classifier Using Smart Sensor for Construction Workplace. Comput. Netw. Commun. 2016, 142, 533. [Google Scholar] [CrossRef]
- Wang, Y.; Lin, J.L.; Annavaram, M.; Jacobson, Q.A.; Hong, J.; Krishnamachari, B.; Sadeh, N. A Framework of Energy Efficient Mobile Sensing for Automatic User State Recognition. In Proceedings of the 7th International Conference on Mobile Systems, Applications, and Services, Kraków, Poland, 22–25 June 2009; pp. 179–192. [Google Scholar]
- Liang, Y.; Zhou, X.; Yu, Z.; Guo, B.; Yang, Y. Energy Efficient Activity Recognition Based on Low Resolution Accelerometer in Smart Phones. Lect. Notes Comput. Sci. 2012, 7296, 122–136. [Google Scholar]
- Kose, M.; Incel, O.D.; Ersoy, C. Online Human Activity Recognition on Smart Phones. In Proceedings of the Workshop on Mobile Sensing: From Smartphones and Wearables to Big Data, Beijing, China, 16 April 2012; pp. 11–15. [Google Scholar]
- Xiao, W.D.; Lu, Y.J. Daily Human Physical Activity Recognition Based on Kernel Discriminant Analysis and Extreme Learning Machine. Math. Probl. Eng. 2015, 2015, 790412. [Google Scholar] [CrossRef]
- Bonomi, G.A.; Goris, H.C.; Yin, B.; Westerterp, K.R. Detection of Type, Duration, and Intensity of Physical Activity Using an Accelerometer. Med. Sci. Sports Exerc. 2009, 41, 1770–1777. [Google Scholar] [CrossRef] [PubMed]
- Chernbumroong, S.; Atkins, A.S.; Yu, H. Activity classification using a single wristworn accelerometer. In Proceedings of the 2011 5th International Conference on Software, Knowledge Information, Industrial Management and Applications (SKIMA), Benevento, Italy, 8–11 September 2011; pp. 1–6. [Google Scholar]
- Dernbach, S.; Das, B.; Krishnan, N.C.; Thomas, B.L.; Cook, D.J. Simple and Complex Activity Recognition through Smart Phones. In Proceedings of the 2012 Eighth International Conference on Intelligent Environments, Guanajuato, Mexico, 26–29 June 2012; pp. 214–221. [Google Scholar]
- Morales, J.; Akopian, D. Physical activity recognition by smartphones, a survey. Biocybern. Biomed. Eng. 2017, 37, 388–400. [Google Scholar] [CrossRef]


| Time Domain | Frequency Domain | Discrete Domain |
|---|---|---|
| Mean, Median Variance, Standard deviation Max, Min, Range Interquartile range (IQR) Skewness Kurtosis Root mean square (RMS) Integration Correlation, Cross-correlation Zero-crossings Signal magnitude area (SMA) Signal vector magnitude (SVM) | Coefficients sum | Euclidean-based distances |
| DC component | Levenshtein Edit distance | |
| Spectral entropy | DTW distance | |
| Information entropy | ||
| Spectral analysis of key coefficients | ||
| Frequency-domain entropy |
| Classifiers | Human Activity | Recognition Accuracy (%) |
|---|---|---|
| Decision tree | Running, Walking, Sitting | 92.64% [6] |
| Standing, Walking, Jogging, Upstairs, Downstairs | 92.30% [27] | |
| Naive Bayes | Cycling, Vehicle, Running, Stationary, Walking | 93.87% [7] |
| SVM | Walking Treadmill, Running, Running Treadmill, Going Upstairs, Going Downstairs, etc. | 92.40% [12] |
| K-nearest neighbor (KNN) | Lying, Sitting, Standing, Walking, Running, Jumping | 78.23% [28] |
| Artificial neural networks (ANN) | Walk, Slip, Trip | 94.00% [29] |
| Subject | Classification Accuracy (%) | Prediction Accuracy (%) |
|---|---|---|
| Subject 1 | 97.78% | 90.12% |
| Subject 2 | 94.27% | 90.02% |
| Subject 3 | 92.05% | 88.07% |
| Subject 4 | 97.55% | 98.76% |
| Subject 5 | 95.11% | 92.59% |
| Subject 6 | 97.11% | 93.82% |
| Subject 7 | 92.11% | 88.89% |
| Subject 8 | 95.12% | 97.53% |
| Subject 9 | 97.94% | 97.04% |
| Average | 95.45% | 92.98% |
| Index | Precision | Recall | F1-Score | Classification Accuracy | Prediction Accuracy |
|---|---|---|---|---|---|
| Result | 94.91% | 94.91% | 94.91% | 89.85% | 94.91% |
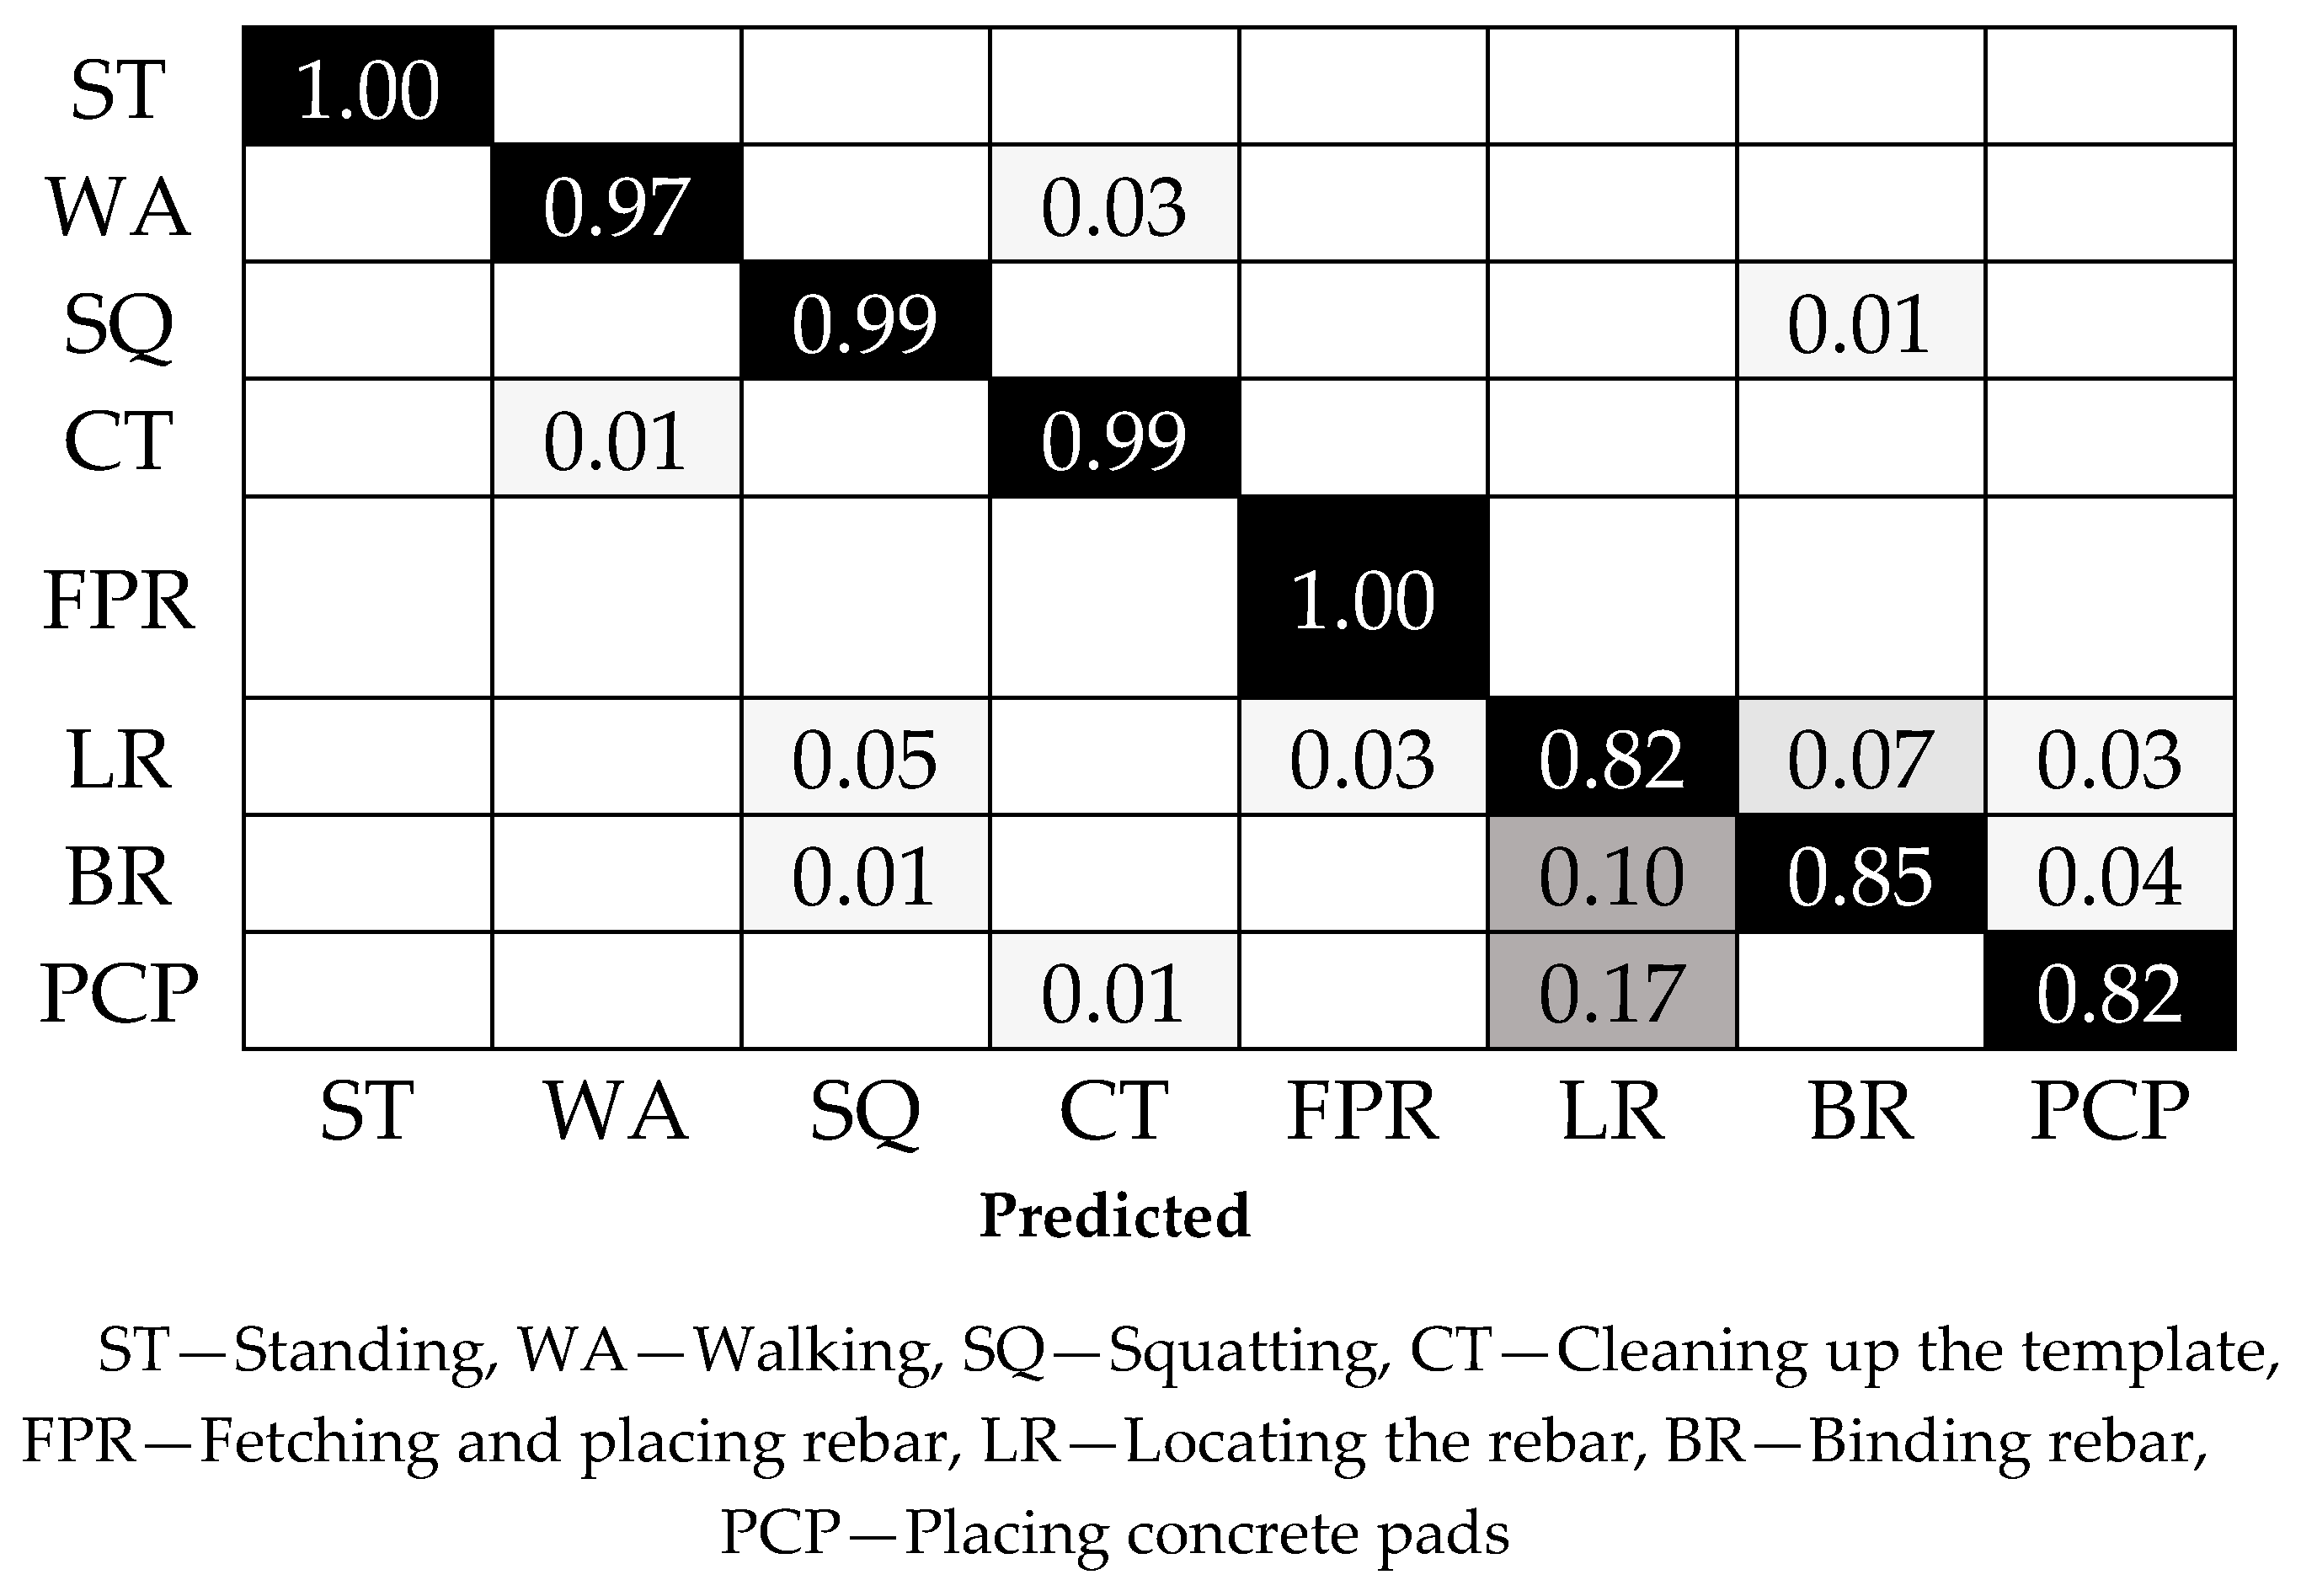
| Activities | Precision | Recall | F1-Score |
|---|---|---|---|
| Standing | 1.00 | 1.00 | 1.00 |
| Walking | 0.98 | 0.97 | 0.97 |
| Squatting | 0.93 | 0.99 | 0.96 |
| Cleaning up the template | 0.96 | 0.99 | 0.97 |
| Fetching and placing rebar | 0.98 | 1.00 | 0.99 |
| Locating the rebar | 0.76 | 0.82 | 0.79 |
| Binding rebar | 0.91 | 0.85 | 0.88 |
| Placing concrete pads | 0.92 | 0.82 | 0.87 |
© 2018 by the authors. Licensee MDPI, Basel, Switzerland. This article is an open access article distributed under the terms and conditions of the Creative Commons Attribution (CC BY) license (http://creativecommons.org/licenses/by/4.0/).
Share and Cite
Zhang, M.; Chen, S.; Zhao, X.; Yang, Z. Research on Construction Workers’ Activity Recognition Based on Smartphone. Sensors 2018, 18, 2667. https://doi.org/10.3390/s18082667
Zhang M, Chen S, Zhao X, Yang Z. Research on Construction Workers’ Activity Recognition Based on Smartphone. Sensors. 2018; 18(8):2667. https://doi.org/10.3390/s18082667
Chicago/Turabian StyleZhang, Mingyuan, Shuo Chen, Xuefeng Zhao, and Zhen Yang. 2018. "Research on Construction Workers’ Activity Recognition Based on Smartphone" Sensors 18, no. 8: 2667. https://doi.org/10.3390/s18082667
APA StyleZhang, M., Chen, S., Zhao, X., & Yang, Z. (2018). Research on Construction Workers’ Activity Recognition Based on Smartphone. Sensors, 18(8), 2667. https://doi.org/10.3390/s18082667