ABE-VIEW: Android Interface for Wireless Data Acquisition and Control


Abstract
1. Introduction
1.1. Overview/Objective
1.2. Background/Related Works
2. Materials and Methods
2.1. Overview
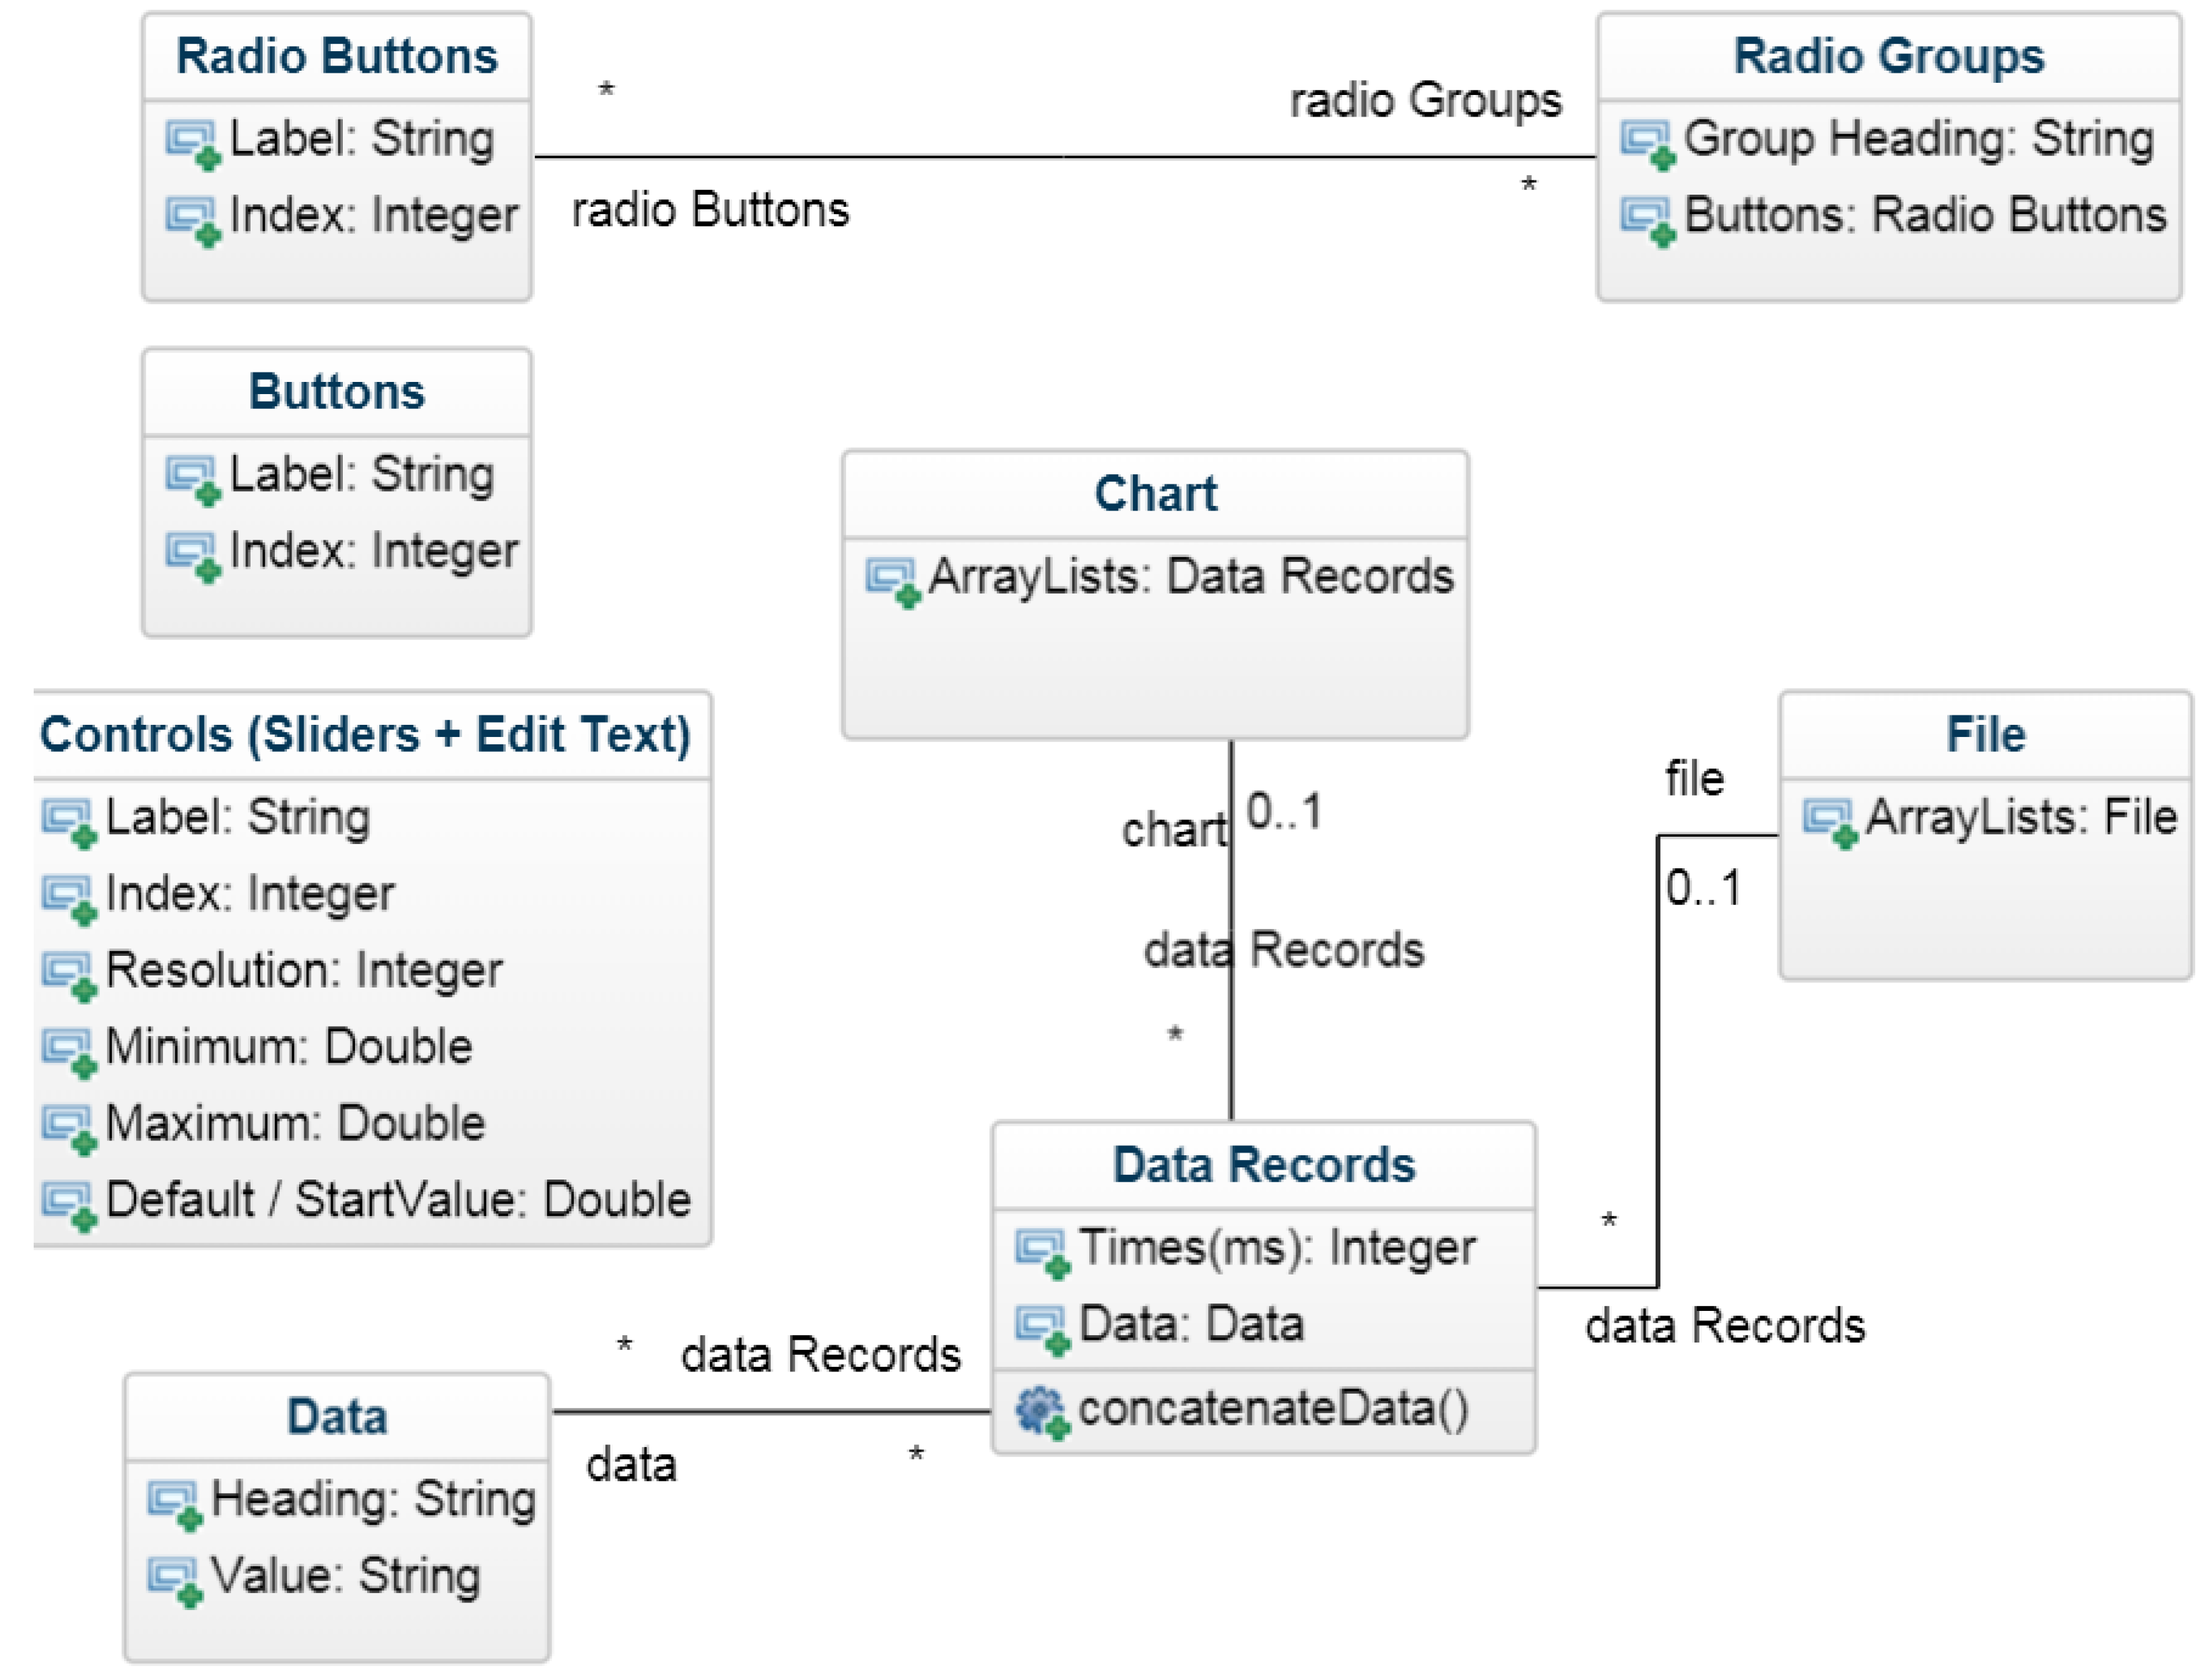
2.2. General Architecture of ABE-VIEW
2.3. Application of ABE-VIEW for Student Data Acquisition and Control
2.4. ABE-VIEW for Rapid Device/Sensor Development
3. Results
3.1. Overview
3.2. ABE-VIEW for Flexible Data-Acquisition and Control
3.3. ABE-VIEW for Custom Device Testing and Troubleshooting
4. Discussion
Supplementary Materials
Author Contributions
Funding
Acknowledgments
Conflicts of Interest
References
- Dryden, M.D.M.; Fobel, R.; Fobel, C.; Wheeler, A.R. Upon the Shoulders of Giants: Open-Source Hardware and Software in Analytical Chemistry. Anal. Chem. 2017, 89, 4330–4338. [Google Scholar] [CrossRef] [PubMed]
- Rueden, C.T.; Schindelin, J.; Hiner, M.C.; DeZonia, B.E.; Walter, A.E.; Arena, E.T.; Eliceiri, K.W. ImageJ2: ImageJ for the next generation of scientific image data. BMC Bioinform. 2017, 18, 529. [Google Scholar] [CrossRef] [PubMed]
- Zhu, X.; Wolfgruber, T.K.; Tasato, A.; Arisdakessian, C.; Garmire, D.G.; Garmire, L.X. Granatum: A graphical single-cell RNA-Seq analysis pipeline for genomics scientists. Genome Med. 2017, 9, 108. [Google Scholar] [CrossRef] [PubMed]
- Zhang, B.; Dai, J.; Zhang, T. NeoAnalysis: A Python-based toolbox for quick electrophysiological data processing and analysis. Biomed. Eng. Online 2017, 16, 129. [Google Scholar] [CrossRef] [PubMed]
- Mejías, A.; Herrera, R.; Márquez, M.; Calderón, A.; González, I.; Andújar, J. Easy Handling of Sensors and Actuators over TCP/IP Networks by Open Source Hardware/Software. Sensors 2017, 17, 94. [Google Scholar] [CrossRef] [PubMed]
- Martínez, E.; Toma, D.; Jirka, S.; del Río, J. Middleware for Plug and Play Integration of Heterogeneous Sensor Resources into the Sensor Web. Sensors 2017, 17, 2923. [Google Scholar] [CrossRef] [PubMed]
- Lütjohann, D.S.; Jung, N.; Bräse, S. Open source life science automation: Design of experiments and data acquisition via “dial-a-device”. Chemom. Intell. Lab. Syst. 2015, 144, 100–107. [Google Scholar] [CrossRef]
- Chen, X.; Li, H. ArControl: An Arduino-Based Comprehensive Behavioral Platform with Real-Time Performance. Front. Behav. Neurosci. 2017, 11, 244. [Google Scholar] [CrossRef] [PubMed]
- Gao, Y.; Ramirez, B.C.; Hoff, S.J. Omnidirectional thermal anemometer for low airspeed and multi-point measurement applications. Comput. Electron. Agric. 2016, 127, 439–450. [Google Scholar] [CrossRef]
- Barnard, H.R.; Findley, M.C.; Csavina, J. PARduino: A simple and inexpensive device for logging photosynthetically active radiation. Tree Physiol. 2014, 34, 640–645. [Google Scholar] [CrossRef] [PubMed]
- Tovar, J.C.; Hoyer, J.S.; Lin, A.; Tielking, A.; Callen, S.T.; Elizabeth Castillo, S.; Miller, M.; Tessman, M.; Fahlgren, N.; Carrington, J.C.; et al. Raspberry Pi-powered imaging for plant phenotyping. Appl. Plant Sci. 2018, 6, 1031. [Google Scholar] [CrossRef] [PubMed]
- Axani, S.N.; Frankiewicz, K.; Conrad, J.M. The CosmicWatch Desktop Muon Detector: A self-contained, pocket sized particle detector. J. Instrum. 2018, 13, P03019. [Google Scholar] [CrossRef]
- Soler-Llorens, J.L.; Galiana-Merino, J.J.; Giner-Caturla, J.; Jauregui-Eslava, P.; Rosa-Cintas, S.; Rosa-Herranz, J. Development and programming of Geophonino: A low cost Arduino-based seismic recorder for vertical geophones. Comput. Geosci. 2016, 94, 1–10. [Google Scholar] [CrossRef]
- Soler-Llorens, J.L.; Galiana-Merino, J.J.; Giner-Caturla, J.J.; Jauregui-Eslava, P.; Rosa-Cintas, S.; Rosa-Herranz, J.; Nassim Benabdeloued, B.Y. Design and test of Geophonino-3D: A low-cost three-component seismic noise recorder for the application of the H/V method. Sens. Actuators A Phys. 2018, 269, 342–354. [Google Scholar] [CrossRef]
- Beddows, P.A.; Mallon, E.K. Cave Pearl Data Logger: A Flexible Arduino-Based Logging Platform for Long-Term Monitoring in Harsh Environments. Sensors 2018, 18, 530. [Google Scholar] [CrossRef] [PubMed]
- Husain, A.R.; Hadad, Y.; Zainal Alam, M.N.H. Development of Low-Cost Microcontroller-Based Interface for Data Acquisition and Control of Microbioreactor Operation. J. Lab. Autom. 2016, 21, 660–670. [Google Scholar] [CrossRef] [PubMed]
- De Morais, C.D.L.M.; Carvalho, J.C.; Sant’Anna, C.; Eugênio, M.; Gasparotto, L.H.S.; Lima, K.M.G. A low-cost microcontrolled photometer with one color recognition sensor for selective detection of Pb2+ using gold nanoparticles. Anal. Methods 2015, 7, 7917–7922. [Google Scholar] [CrossRef]
- Shen, H.-Y.; Chen, Y.-C.; Hsu, C.-H. A Power Frequency Sensing Device Using an Arduino Device and Zero-Crossing Algorithm and Its Implementation on Android App. Sensors Mater. 2017, 29, 741–756. [Google Scholar] [CrossRef]
- Segura, F.; Bartolucci, V.; Andújar, J. Hardware/Software Data Acquisition System for Real Time Cell Temperature Monitoring in Air-Cooled Polymer Electrolyte Fuel Cells. Sensors 2017, 17, 1600. [Google Scholar] [CrossRef] [PubMed]
- Jin, H.; Qin, Y.; Pan, S.; Alam, A.U.; Dong, S.; Ghosh, R.; Deen, M.J. Open-Source Low-Cost Wireless Potentiometric Instrument for pH Determination Experiments. J. Chem. Educ. 2018, 95, 326–330. [Google Scholar] [CrossRef]
- Grinias, J.P.; Whitfield, J.T.; Guetschow, E.D.; Kennedy, R.T. An Inexpensive, Open-Source USB Arduino Data Acquisition Device for Chemical Instrumentation. J. Chem. Educ. 2016, 93, 1316–1319. [Google Scholar] [CrossRef] [PubMed]
- Nichols, D. Arduino-Based Data Acquisition into Excel, LabVIEW, and MATLAB. Phys. Teach. 2017, 55, 226–227. [Google Scholar] [CrossRef]
- Jenkins, D.M. Google Play, ABE-VIEW. Available online: Https://play.google.com/store/apps/details?id=com.uhmbe.DAQCTRL&hl=en_US (accessed on 1 May 2018).
- Brunelli, D.; Farella, E.; Giovanelli, D.; Milosevic, B.; Minakov, I. Design Considerations for Wireless Acquisition of Multichannel sEMG Signals in Prosthetic Hand Control. IEEE Sens. J. 2016, 16, 8338–8347. [Google Scholar] [CrossRef]
- Rossi, M.; Khouia, A.O.; Lorenzelli, L.; Brunelli, D. Energy neutral 32-channels embedded readout system for IoT-ready fitness equipments. In Proceedings of the 2016 IEEE Sensors Applications Symposium (SAS), Catania, Italy, 20–22 April 2016; pp. 1–6. [Google Scholar]
- Brunelli, D.; Tadesse, A.M.; Vodermayer, B.; Nowak, M.; Castellini, C. Low-cost wearable multichannel surface EMG acquisition for prosthetic hand control. In Proceedings of the 2015 6th IEEE International Workshop on Advances in Sensors and Interfaces, IWASI 2015, Gallipoli, Italy, 18–19 June 2015; pp. 94–99. [Google Scholar]
- Brunelli, D.; Farella, E.; Rocchi, L.; Dozza, M.; Chiari, L.; Benini, L. Bio-feedback system for rehabilitation based on a wireless body area network. In Proceedings of the 4th Annual IEEE International Conference on Pervasive Computing and Communications (PerCOM 2006)—Workshop UbiCare, Pisa, Italy, 13–17 March 2006. [Google Scholar]
- Koda Forms. Available online: http://koda.darkhost.ru/page.php?id=index (accessed on 11 June 2018).
- ProviewR. Available online: http://www.proview.se/v3/ (accessed on 11 June 2018).
- MIT App Inventor. Available online: http://appinventor.mit.edu/explore/index-2.html (accessed on 11 June 2018).
- MIT App Inventor 2. Available online: http://ai2.appinventor.mit.edu/Ya_tos_form.html (accessed on 12 June 2018).
- Mnati, M.; Van den Bossche, A.; Chisab, R. A Smart Voltage and Current Monitoring System for Three Phase Inverters Using an Android Smartphone Application. Sensors 2017, 17, 872. [Google Scholar] [CrossRef] [PubMed]
- Blynk. Available online: https://www.blynk.cc/ (accessed on 11 June 2018).
- Arduino Graph. Available online: https://www.arduino.cc/en/tutorial/Graph (accessed on 11 June 2018).
- Koenka, I.J.; Sáiz, J.; Hauser, P.C. Instrumentino: An Open-Source Software for Scientific Instruments. Chim. Int. J. Chem. 2015, 69, 172–175. [Google Scholar] [CrossRef]
- SerialComInstruments. Available online: http://www.serialcominstruments.com/instrument.php (accessed on 11 June 2018).
- Arduino Dashboard. Available online: http://www.mathias-wilhelm.de/arduino/projects/arduino-dashboard/ (accessed on 11 June 2018).
- EzScrn. Available online: https://forum.arduino.cc/index.php?topic=312547.0 (accessed on 11 June 2018).
- Sandesh, R.S.; Venkatesan, N. LabVIEW-based design and control of five-digit anthropomorphic robotic hand using EEG signals. Int. J. Biomed. Eng. Technol. 2016, 22, 258–271. [Google Scholar] [CrossRef]
- Cvjetkovic, V.M.; Matijevic, M. Overview of Architectures with Arduino Boards as Building Blocks for Data Acquisition and Control Systems. Int. J. Online Eng. 2016, 12, 10–17. [Google Scholar] [CrossRef]
- Priye, A.; Wong, S.; Bi, Y.; Carpio, M.; Chang, J.; Coen, M.; Cope, D.; Harris, J.; Johnson, J.; Keller, A.; et al. Lab-on-a-Drone: Toward Pinpoint Deployment of Smartphone-Enabled Nucleic Acid-Based Diagnostics for Mobile Health Care. Anal. Chem. 2016, 88, 4651–4660. [Google Scholar] [CrossRef] [PubMed]
- Dryden, M.D.M.; Wheeler, A.R. DStat: A Versatile, Open-Source Potentiostat for Electroanalysis and Integration. PLoS ONE 2015, 10, e0140349. [Google Scholar] [CrossRef] [PubMed]
- Rowe, A.A.; Bonham, A.J.; White, R.J.; Zimmer, M.P.; Yadgar, R.J.; Hobza, T.M.; Honea, J.W.; Ben-Yaacov, I.; Plaxco, K.W. CheapStat: An Open-Source, “Do-It-Yourself” Potentiostat for Analytical and Educational Applications. PLoS ONE 2011, 6, e23783. [Google Scholar] [CrossRef] [PubMed]
- Analog_Devices AD5933 Datasheet, Rev F. Available online: http://www.analog.com/media/en/technical-documentation/data-sheets/AD5933.pdf (accessed on 2 May 2018).


| Tool | Standalone Mobile App | No Additional Software Dependencies | Android | iOS | PC/Windows/Linux | Direct Support for Wireless Bluetooth | GUI Fully Configured by Remote Instrument | Easy user Options to Save/Share Data | High Quality Graphical Displays | Numerical Controls with Arbitrary Precision | Easily Scalable Structured Coding (Cut/Paste/Edit) | Can Operate without Internet | Can Connect to Hardware through Internet |
|---|---|---|---|---|---|---|---|---|---|---|---|---|---|
| ABE-VIEW | √ | √ | √ | × | × | √ | √ | √ | √ | √ | √ | √ | × |
| Blynk [33] | √ | √ | √ | √ | × | √ | × | √ | √ | √ | × | × | √ |
| MIT App Inventor [30,31] | × | × 1 | √ | × | √ 1 | √ | × | √ | √ | √ | × | √ 1 | √ |
| Arduino Dashboard [37] | × | × | × | × | √ | × | √ | √ 2 | √ | × | √ | √ | × |
| EzScrn [38] | × | × | × | × | √ | × | √ | × | × | × | √ | √ | × |
| Instrumentino [35] | × | × | × | × | √ | × | × | √ | √ | √ | √ | √ | × |
| SerialComInstruments [36] | × | × | × | × | √ | × | × | √ | √ | √ | × | √ | × |
| Arduino Graph [34] | × | × | × | × | √ | × | × | × | × | × | √ | √ | × |
| ProviewR [29] | × | × | × | × | √ | × | × | × | √ | √ | √ 3 | √ | √ |
| Code | Description | Options 1 | Example Text String(s) | GUI Result |
|---|---|---|---|---|
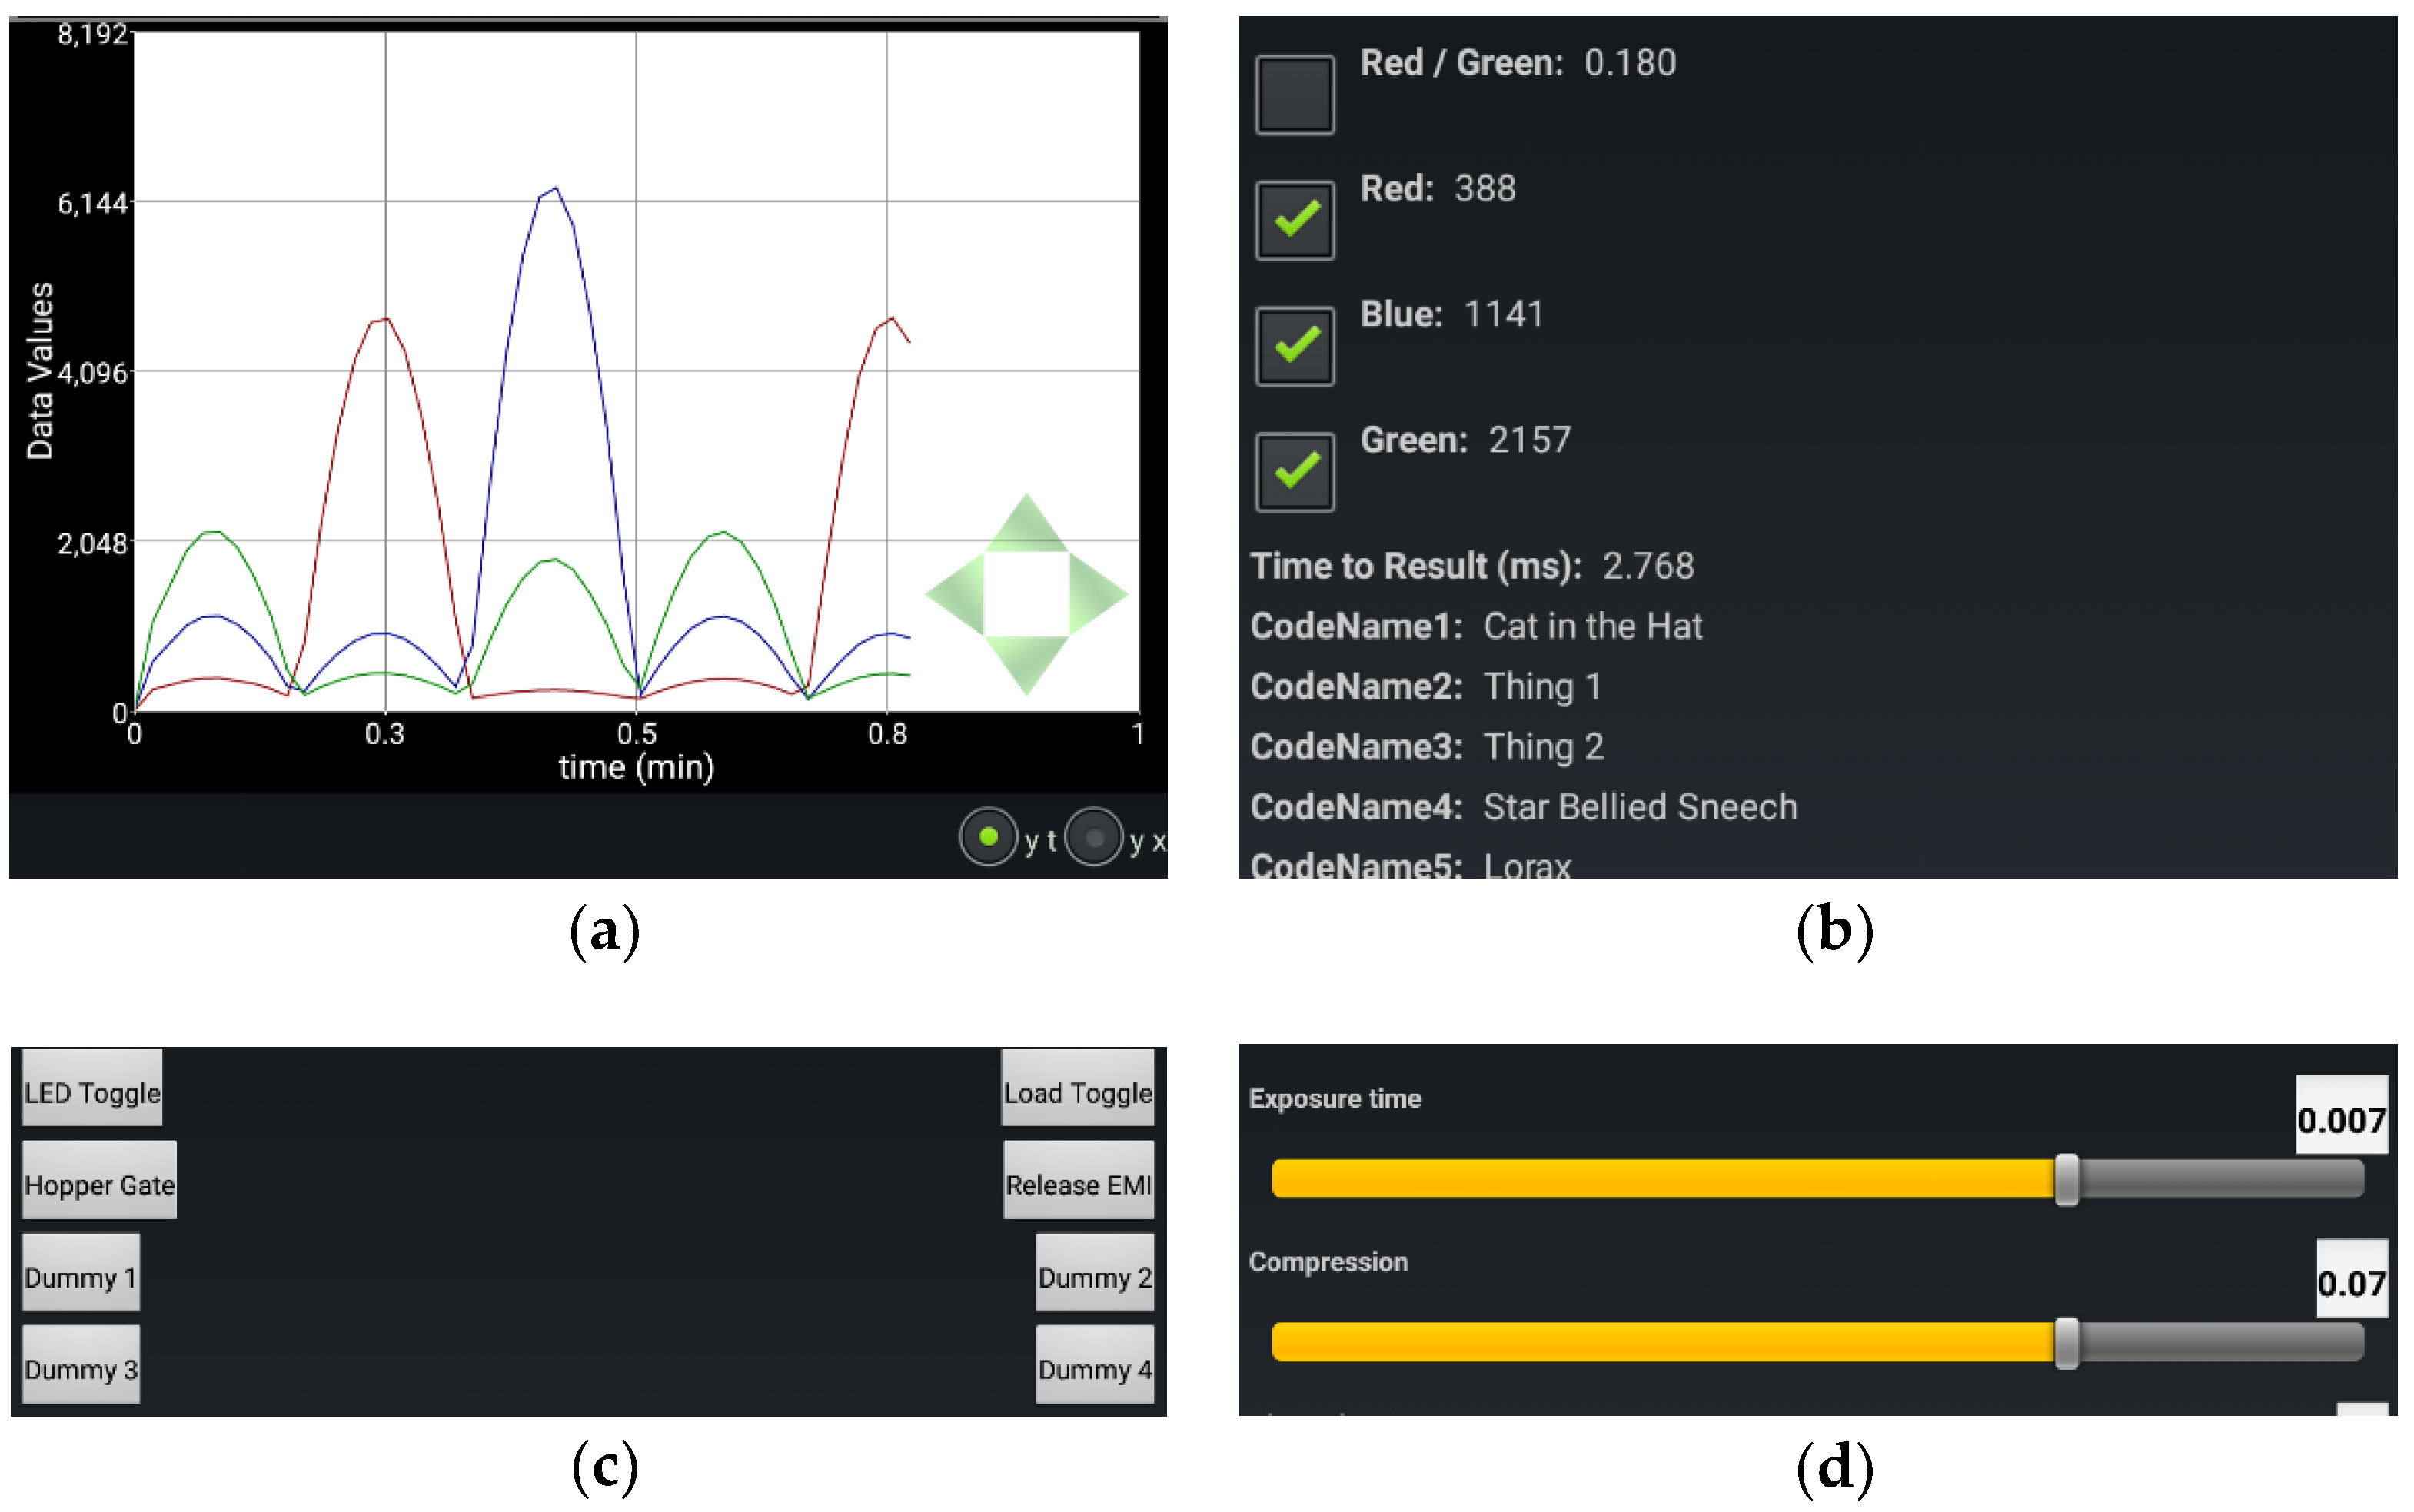
| g | display chart | enable (0 or 1) | “g1\t” | Graph visible (i.e., Figure 2a) |
| h | configure data heading/options | heading index (0–15) enable checkbox for chart (0 or 1) heading text | “h2\t1\tBlue: \t” | Data (index 2) enabled with checkbox to plot on graph, with heading “Blue: (i.e., Figure 2b) |
| b | configure button | button index (0–7) button text/label | “b0\tLED Toggle\t” | Button (index 0) enabled, with label “LED Toggle” (i.e., Figure 2c) |
| c | configure numerical control | control index (0–7) resolution (integer–decimal digits) minimum value default/start value maximum value heading text | “c4\t3\t-0.015\t0.007\t0.015\tExposure time\t” | Numerical control (index 4) enabled, with 3 decimal place precision, range −0.015 to 0.015, default value 0.007, labelled “Exposure time” (Figure 2d) |
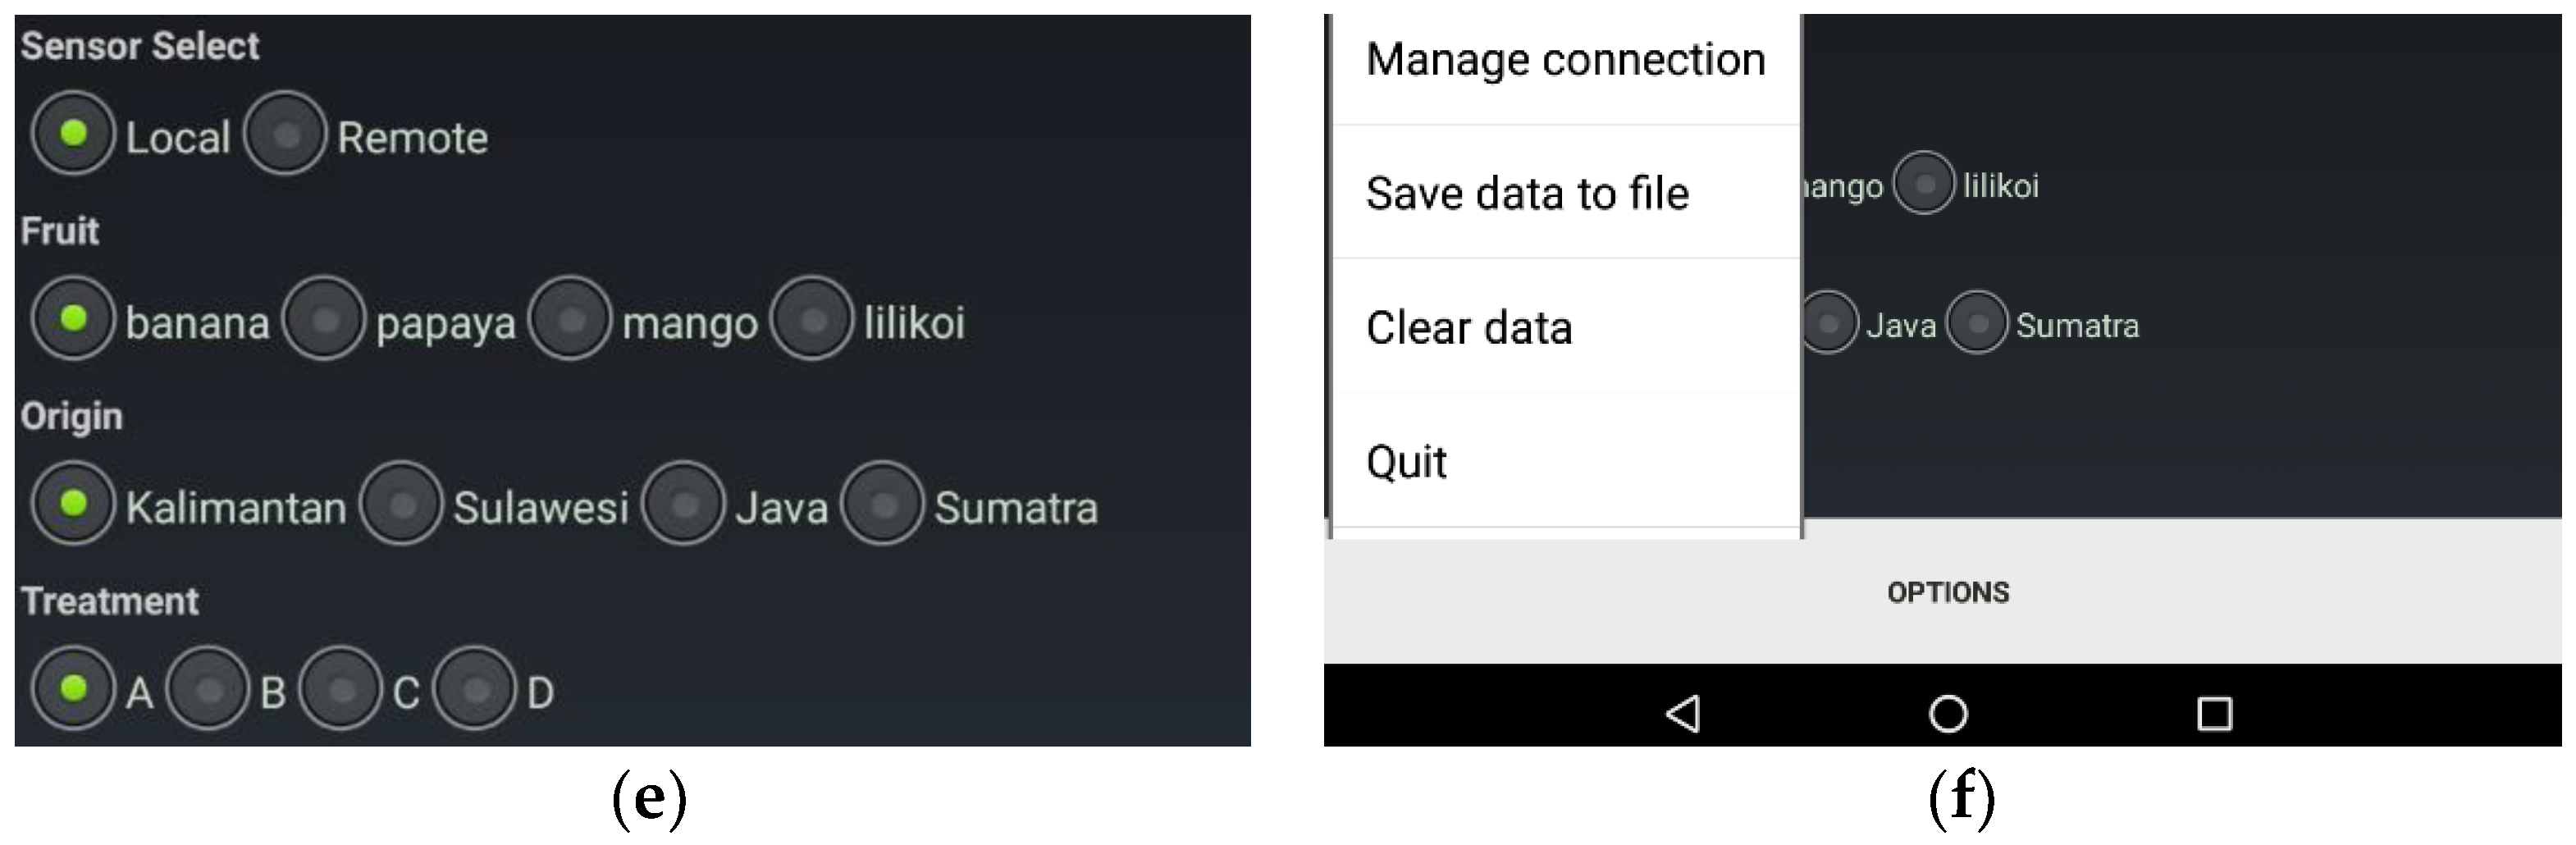
| r | configure radio buttons | radio group index (0–3) radio group text radio button 1 text radio button 2 text radio button 3 text radio button 4 text | “r0\tSensor Select\tLocal\tRemote\t\t\t” “r1\tFruit\tbanana\tpapaya\tmango\tlilikoi\t” | Radio group (index 0) enabled, group label “Sensor Select” with buttons “Local” and “Remote” Radio group (index 1) enabled, group label “Fruit”, with buttons “banana”, “papaya”, “mango”, “lilikoi” (i.e., Figure 2e) |
| d | send data | data index (0–15) data value | “d2\t1141\t” | New data element (“1141”) for data array index 2 (Figure 2b) |
| p | set period for automatically concatenating latest data into array(s) | period (in seconds) | “p10\t” | Most recently communicated value in each data field (and system time) will be automatically concatenated into its corresponding ArrayList every 10 s |
| u | concatenate most recent data into array(s) | n/a | “u” | Most recently communicated value in each data field (and system time) will immediately be concatenated into its corresponding ArrayList |
| Code | Description | Options 1 | Example Text String (s) | Response to User Action |
|---|---|---|---|---|
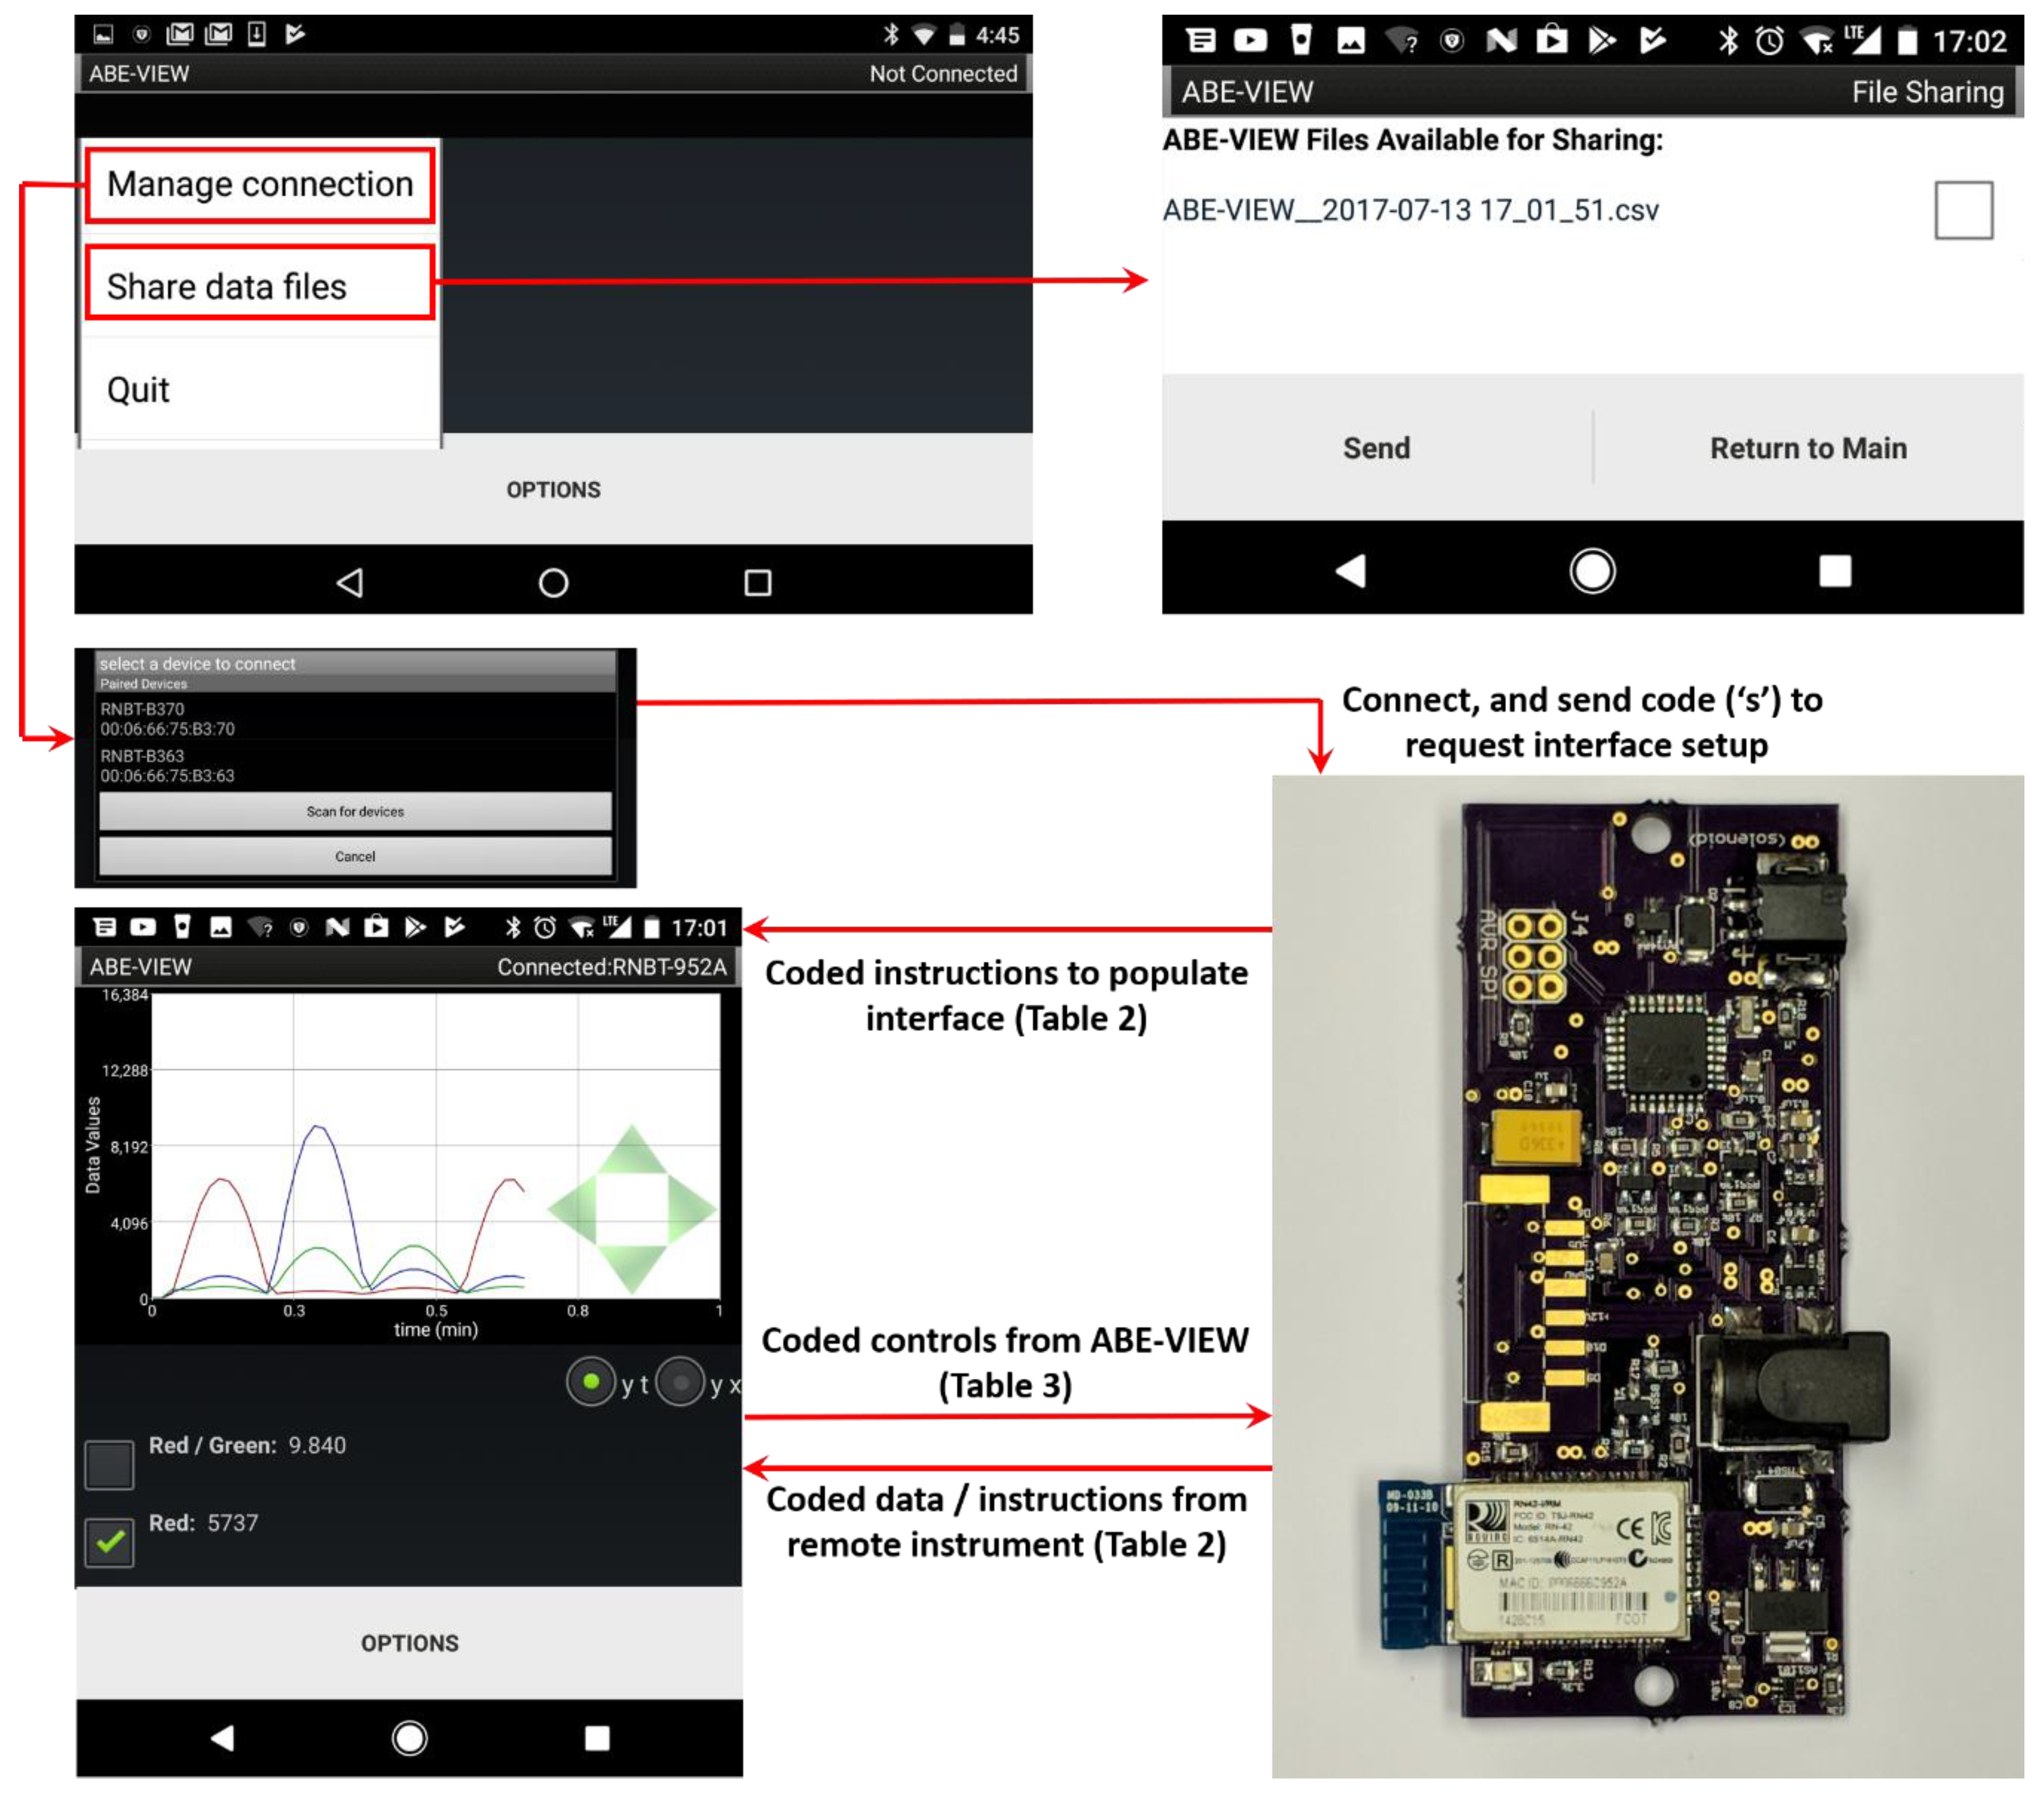
| s | device connected—request GUI configuration | n/a | “s” | User/app just connected to remote Bluetooth (request GUI configuration) |
| b | button pressed | button index (0–7) | “b0\t” | Button (index 0) pressed |
| c | control value changed | control index (0–7) control value | “c0\t100.0\t” | Control (index 0) set to 100.0 |
| r | radio button pressed | radio button identifier (“ij”) where i is radio group (1–4) and j is button (1–4) | “r12\t” | Second button in first radio group was pressed |
© 2018 by the authors. Licensee MDPI, Basel, Switzerland. This article is an open access article distributed under the terms and conditions of the Creative Commons Attribution (CC BY) license (http://creativecommons.org/licenses/by/4.0/).
Share and Cite
Jenkins, D.M.; Kurasaki, R. ABE-VIEW: Android Interface for Wireless Data Acquisition and Control. Sensors 2018, 18, 2647. https://doi.org/10.3390/s18082647
Jenkins DM, Kurasaki R. ABE-VIEW: Android Interface for Wireless Data Acquisition and Control. Sensors. 2018; 18(8):2647. https://doi.org/10.3390/s18082647
Chicago/Turabian StyleJenkins, Daniel M., and Ryan Kurasaki. 2018. "ABE-VIEW: Android Interface for Wireless Data Acquisition and Control" Sensors 18, no. 8: 2647. https://doi.org/10.3390/s18082647
APA StyleJenkins, D. M., & Kurasaki, R. (2018). ABE-VIEW: Android Interface for Wireless Data Acquisition and Control. Sensors, 18(8), 2647. https://doi.org/10.3390/s18082647