Visual Localizer: Outdoor Localization Based on ConvNet Descriptor and Global Optimization for Visually Impaired Pedestrians


Abstract
1. Introduction
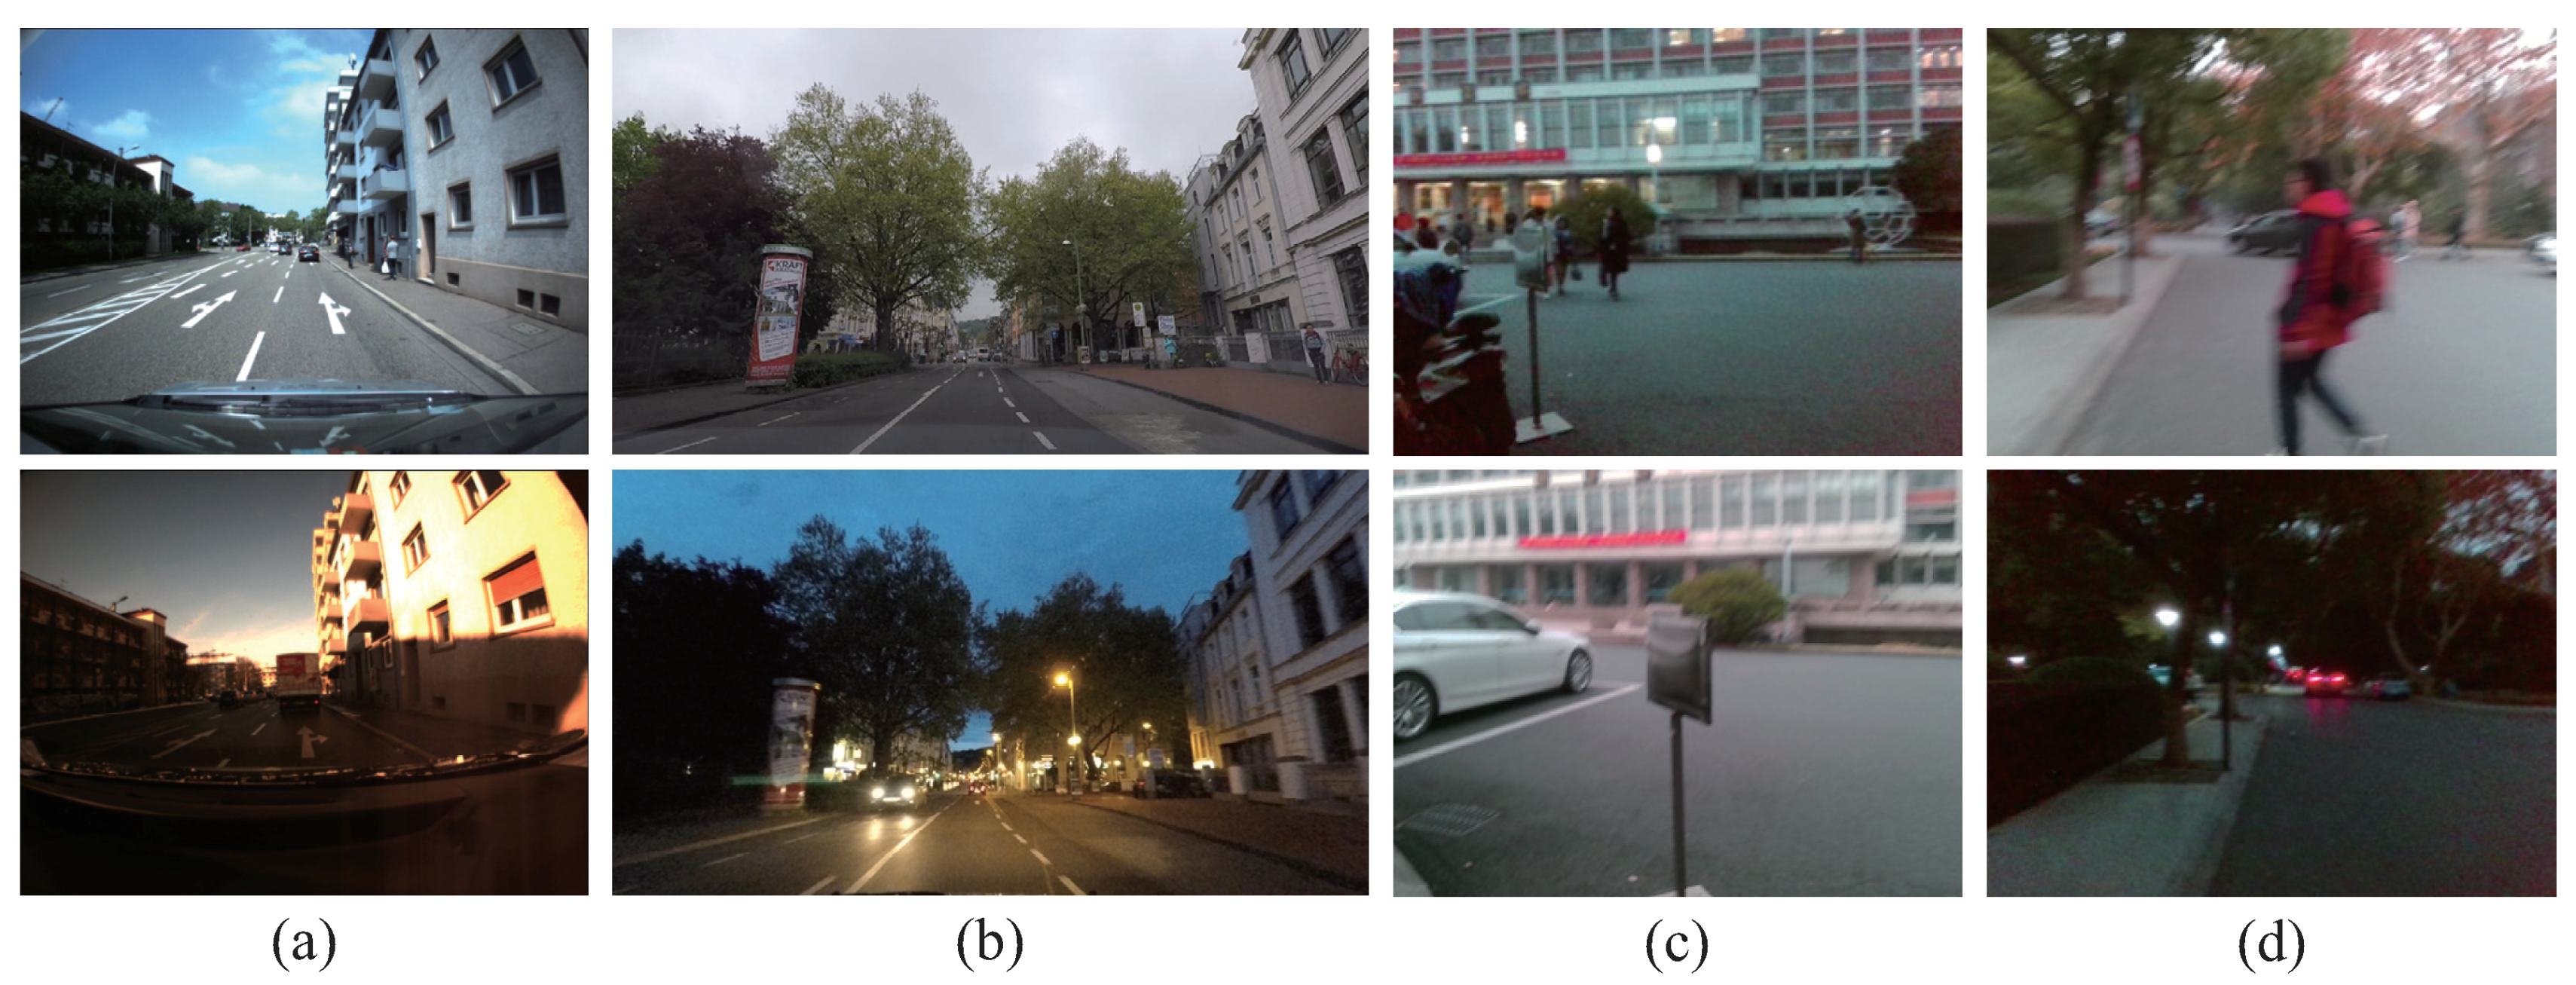
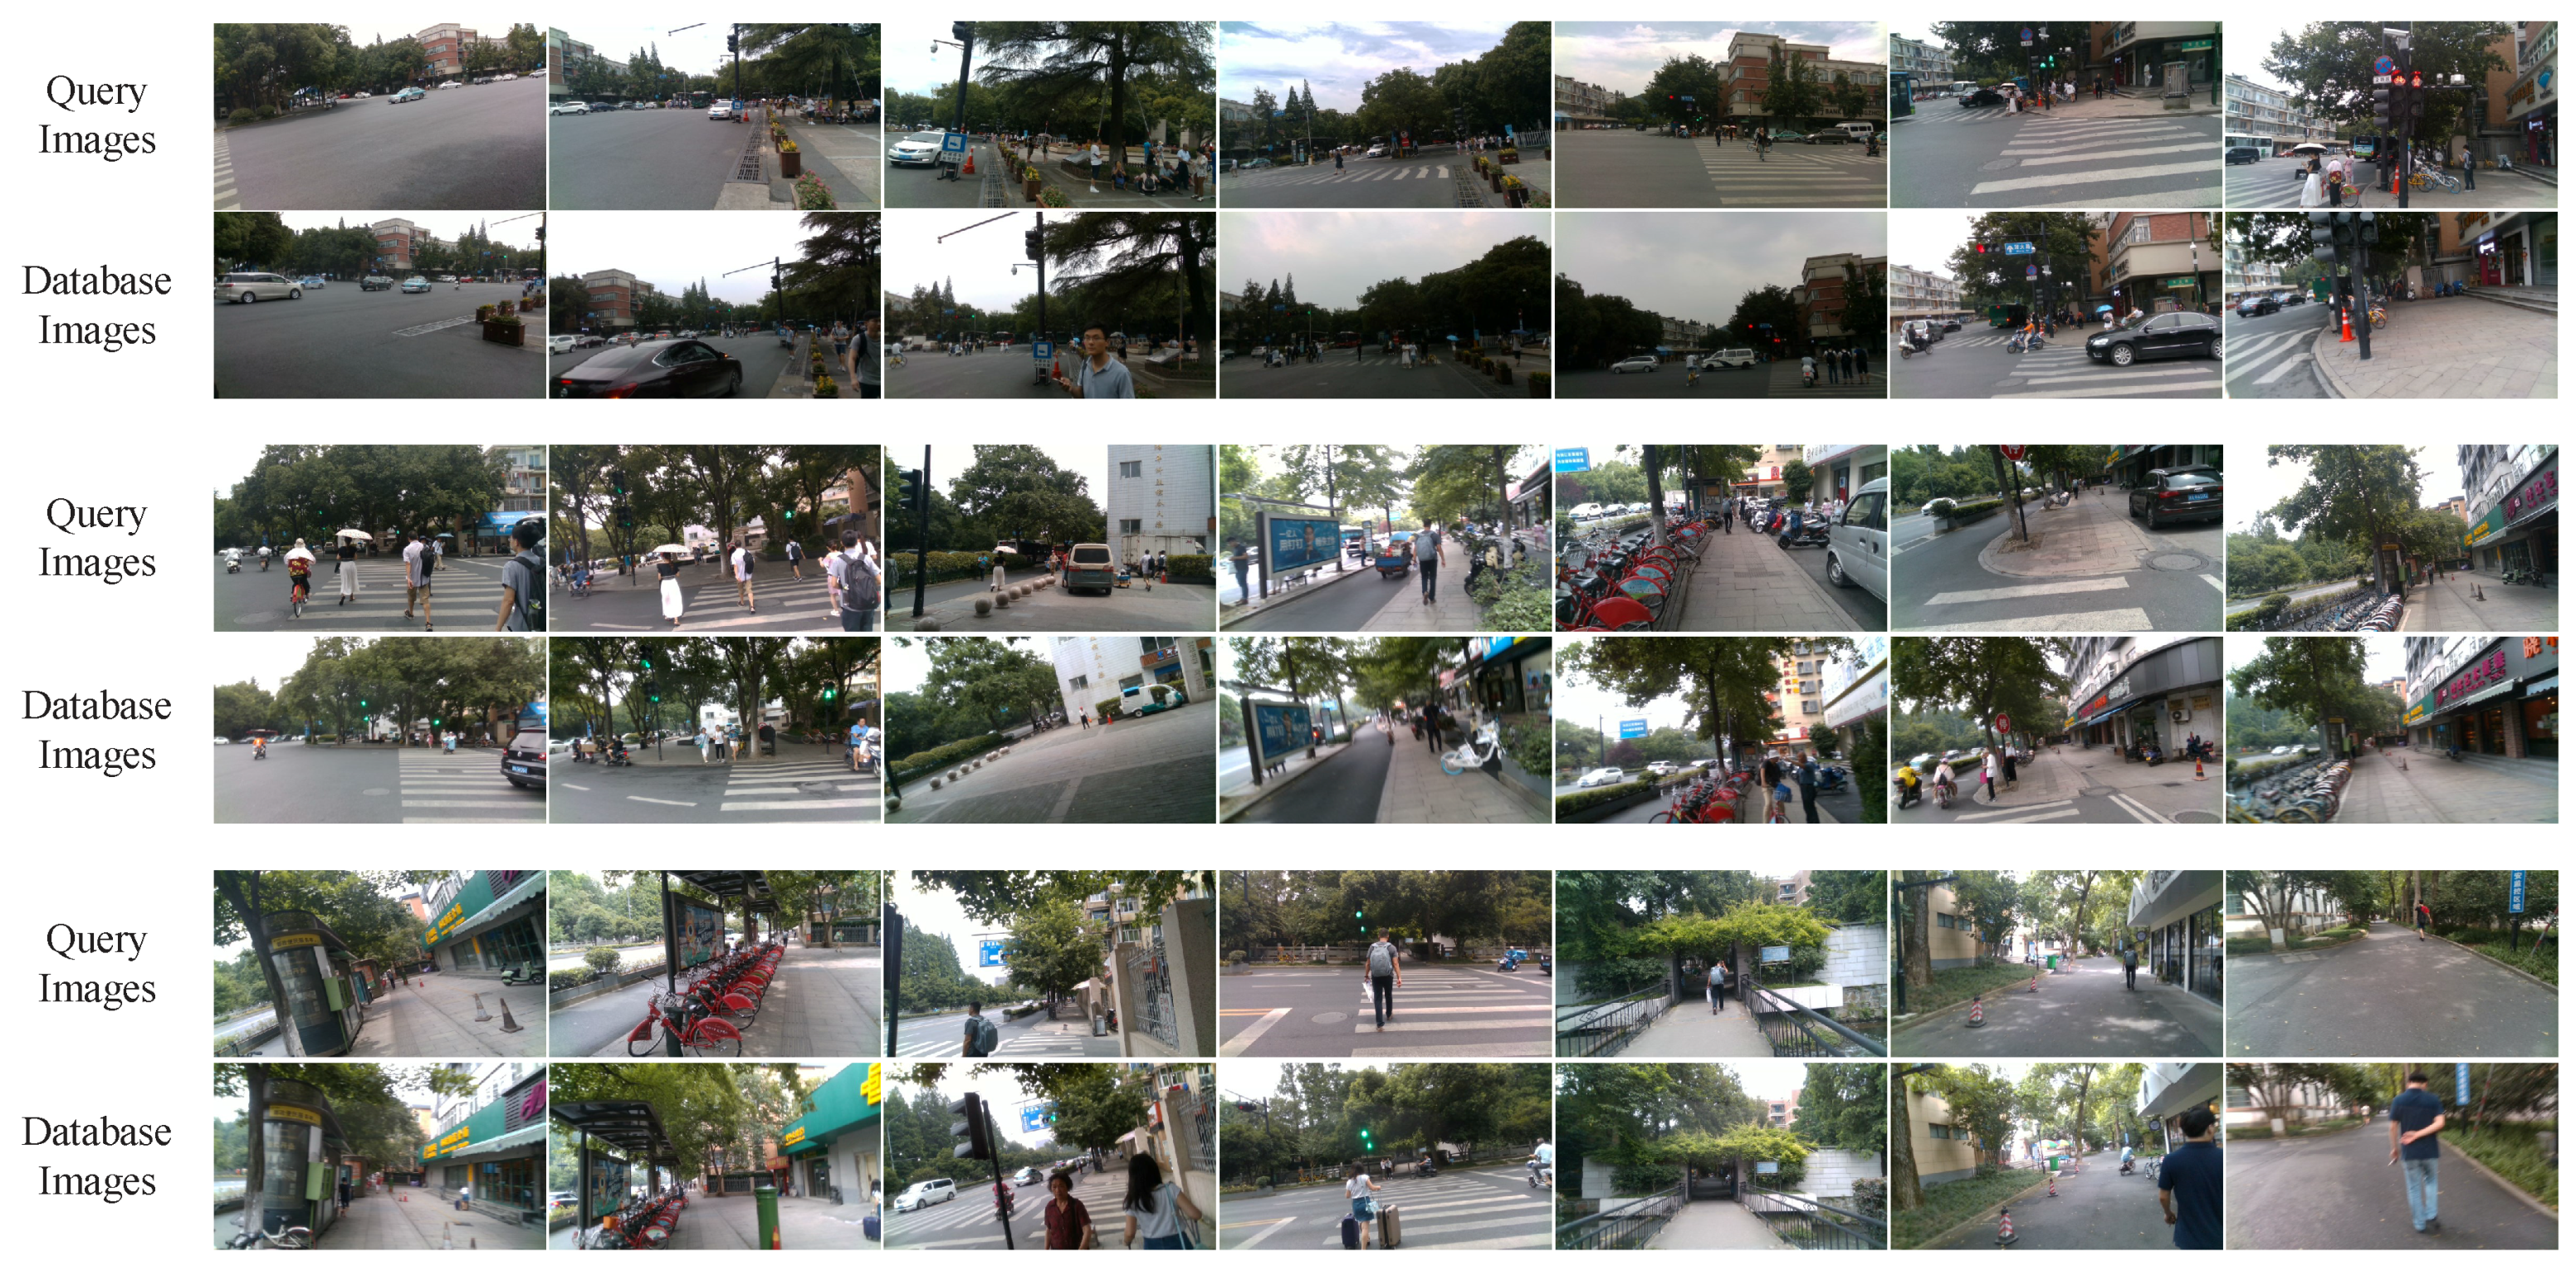
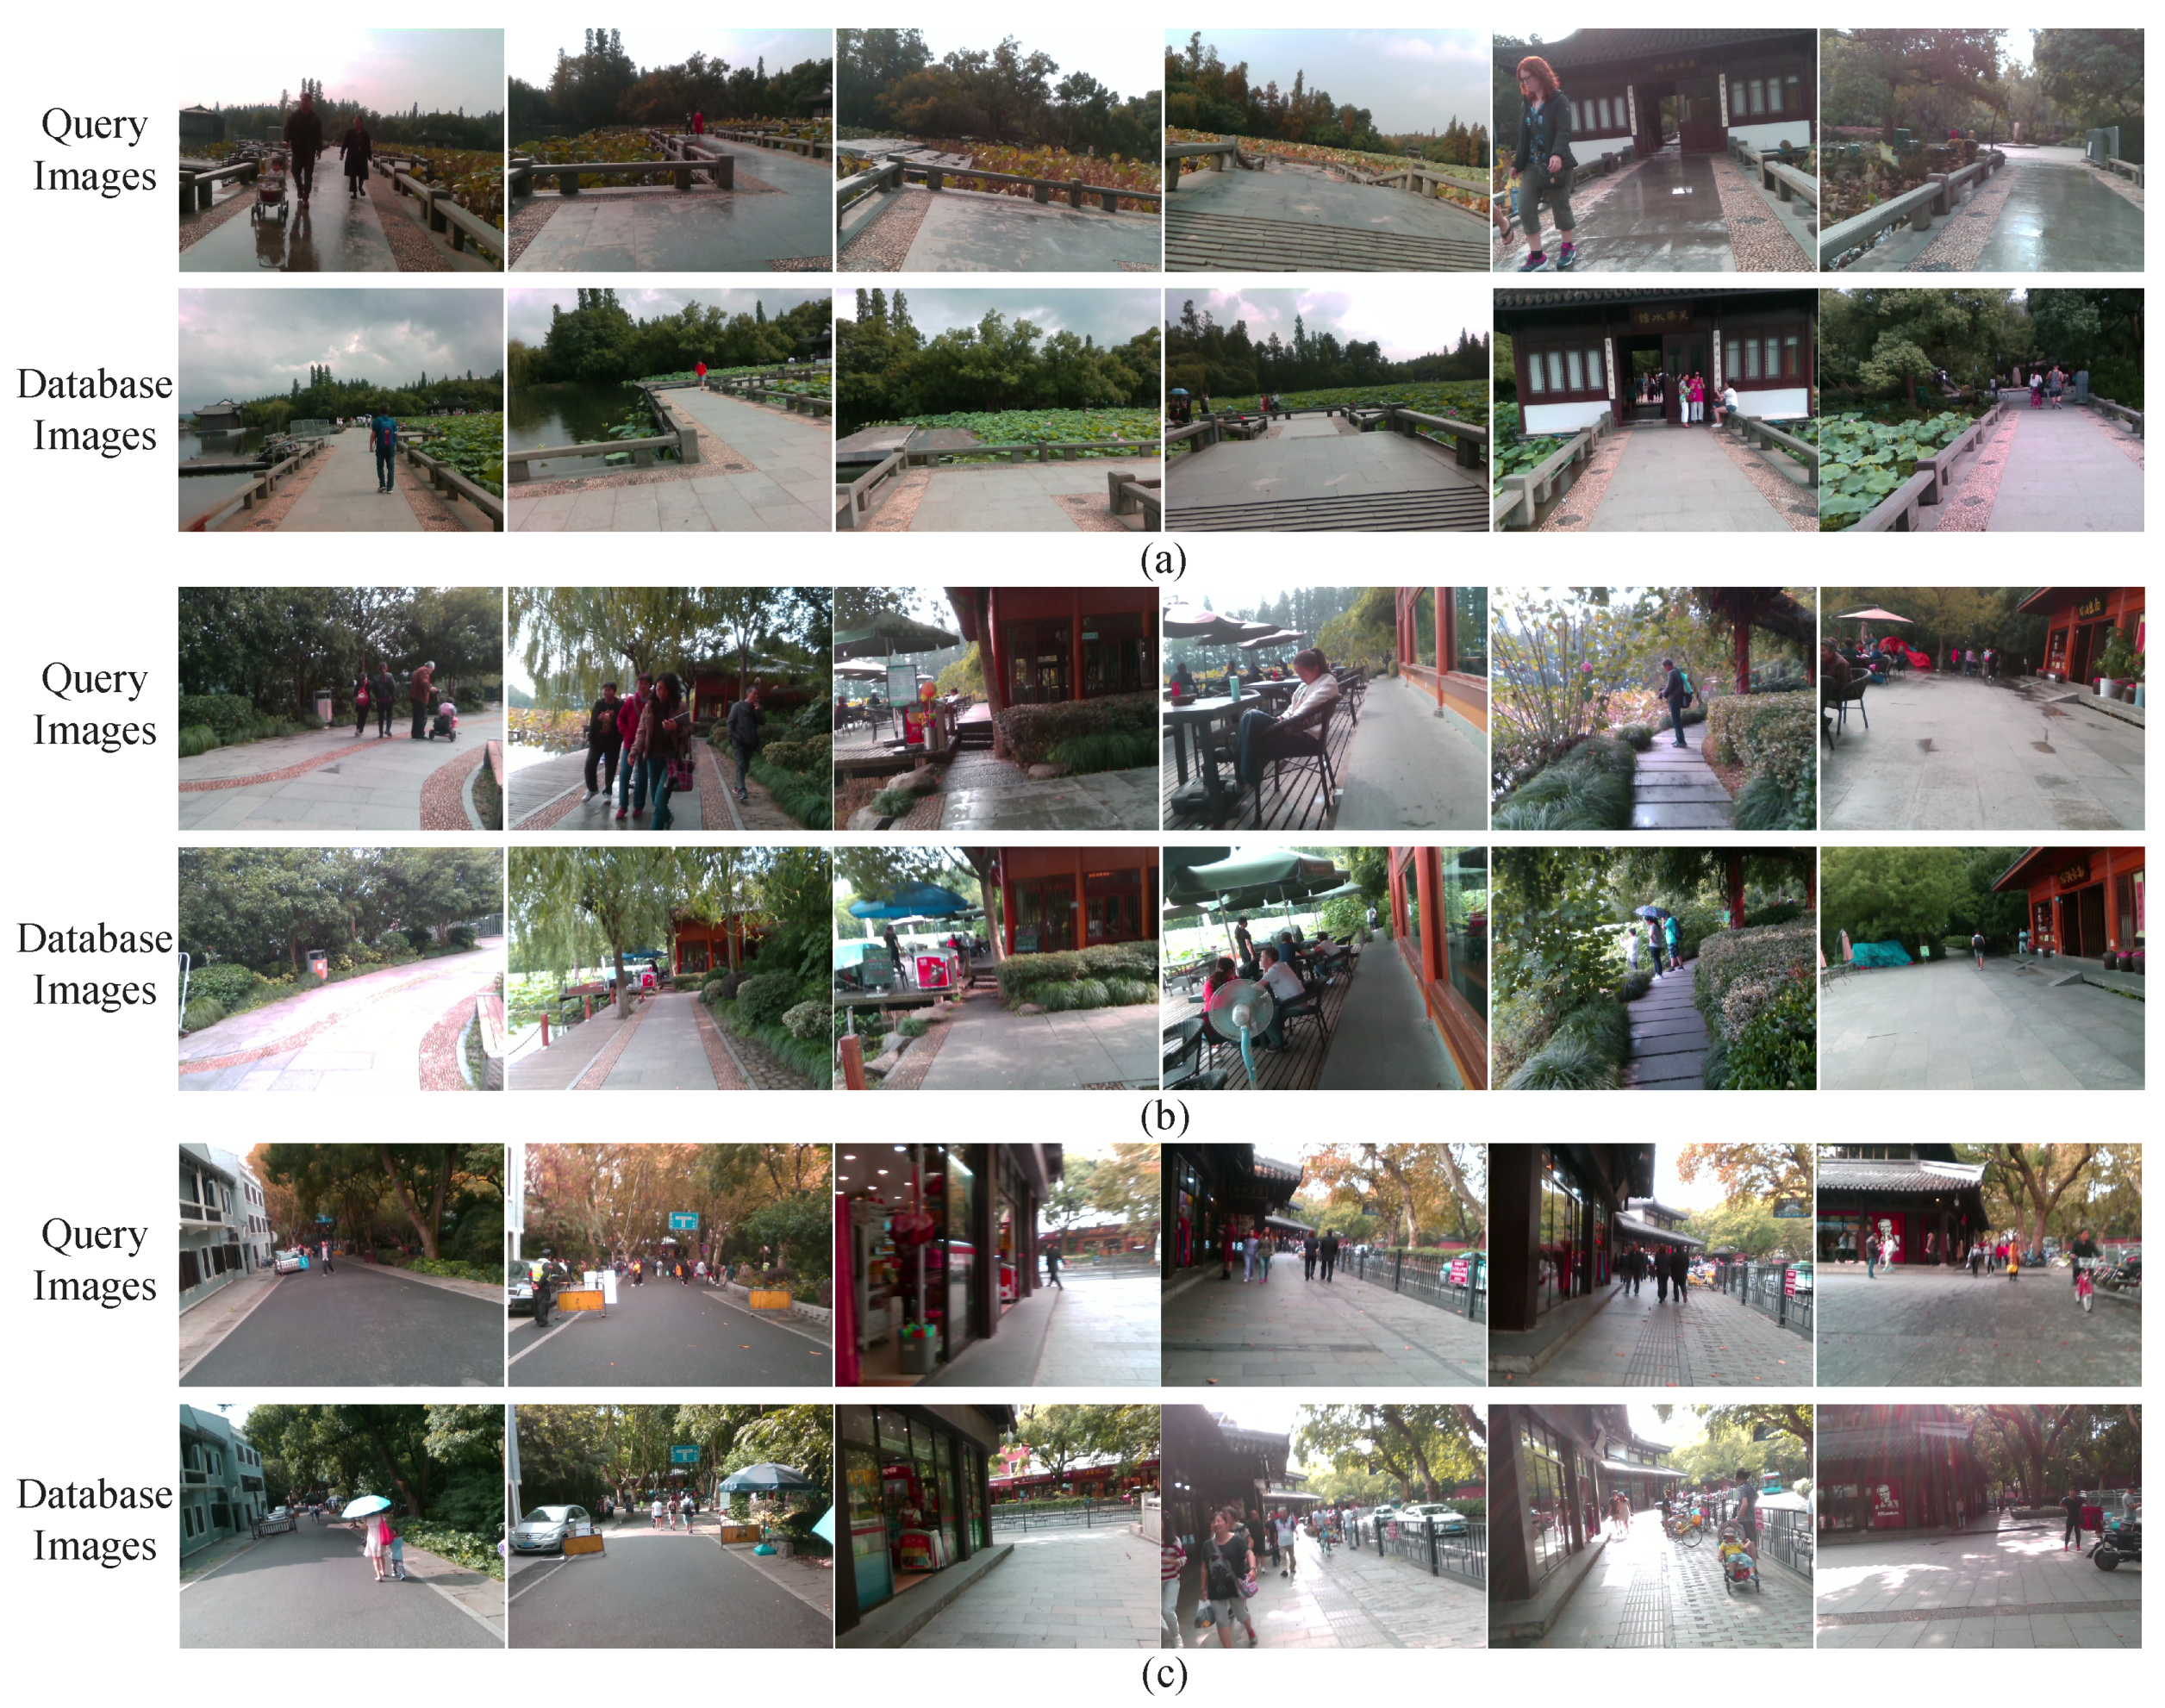
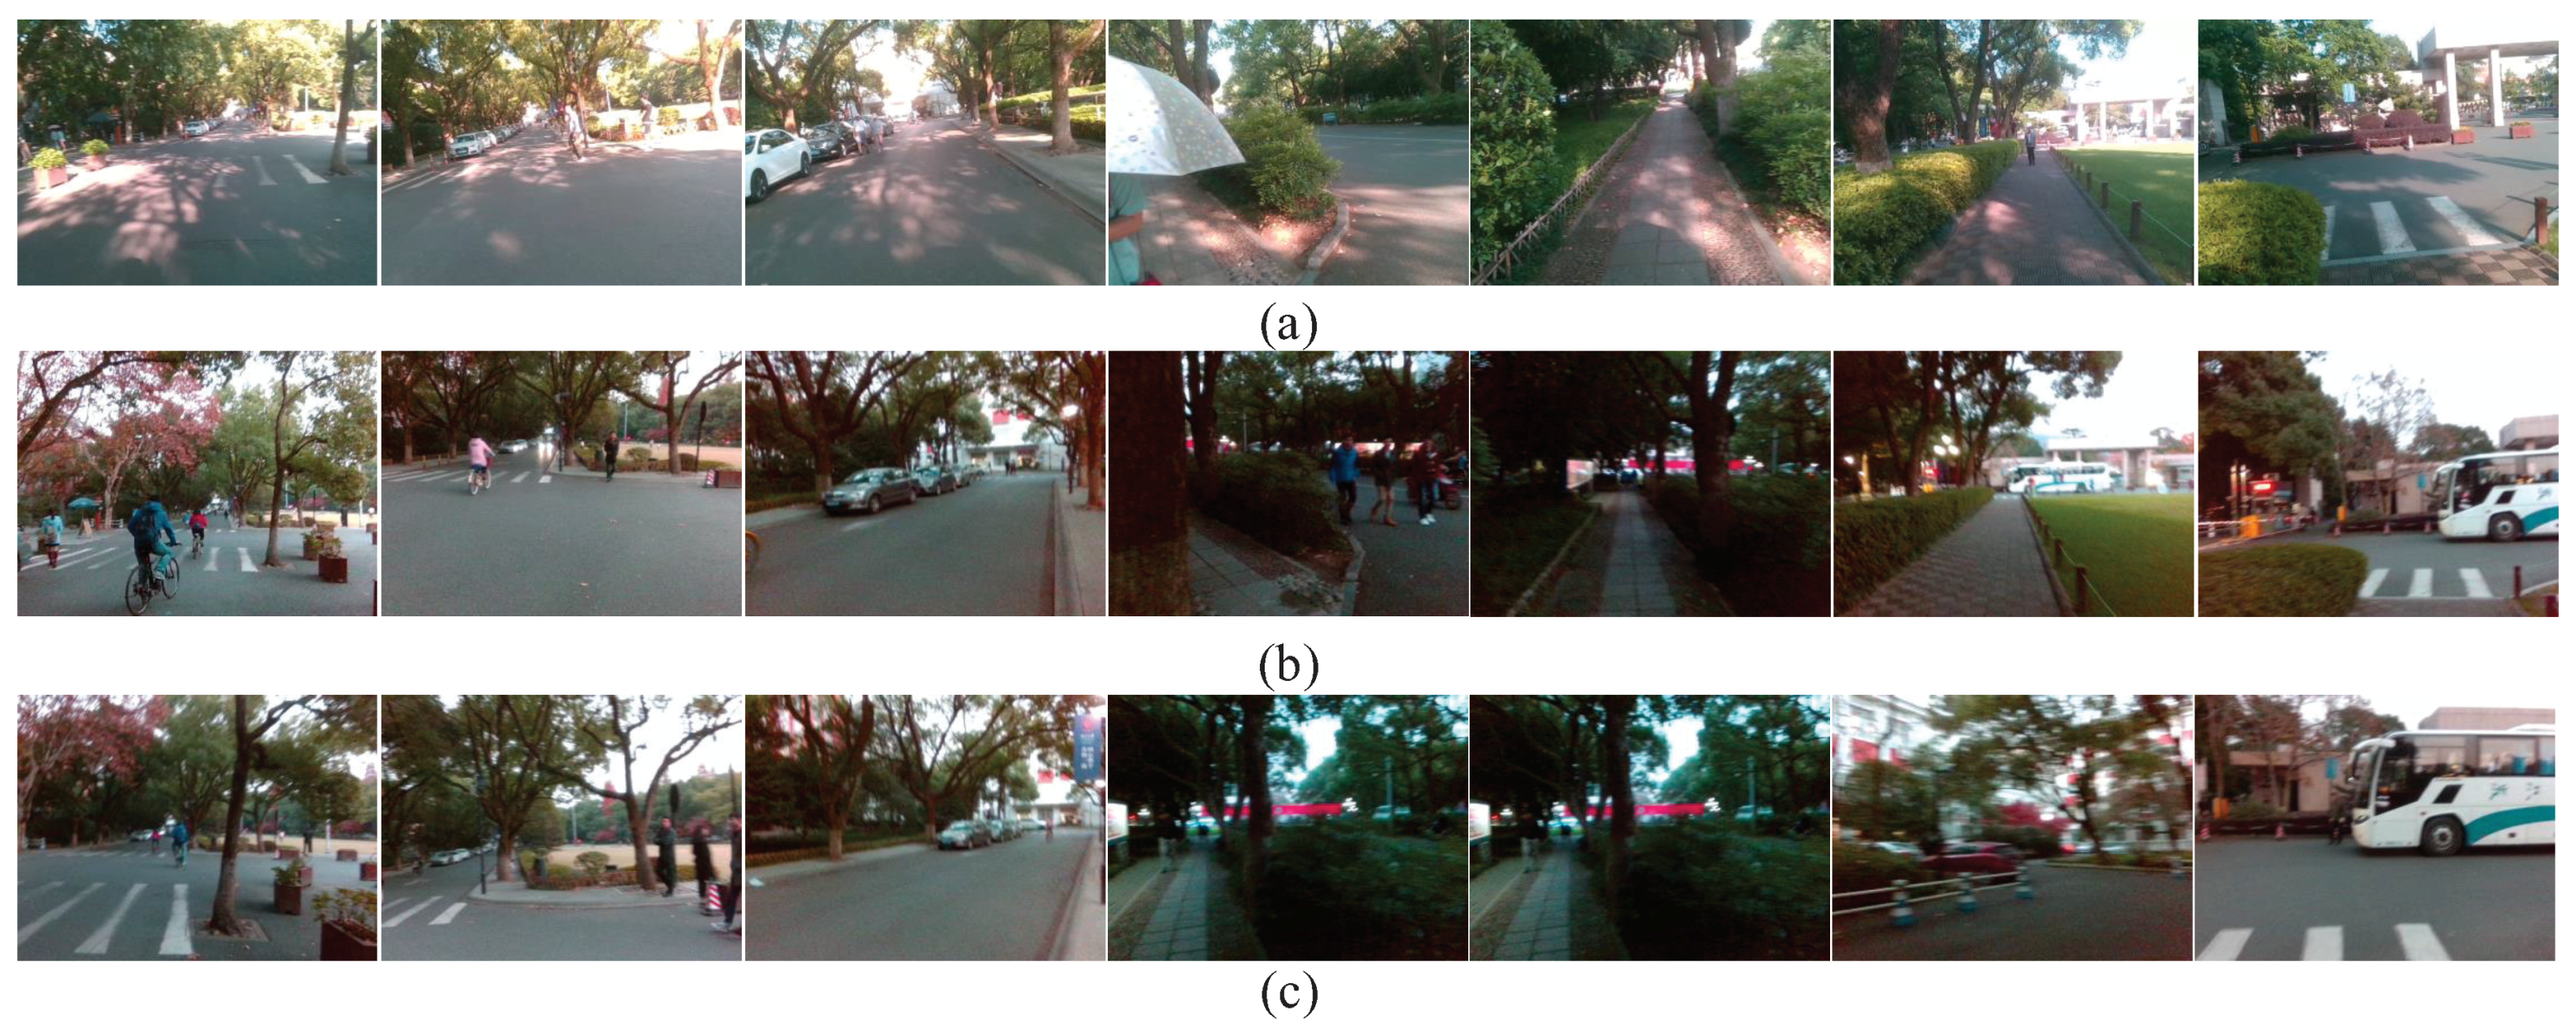
- Viewpoint changes. As shown in Figure 1c, visually impaired people have no concept of viewpoint, and the wearable camera features large variations of lateral displacement and orientation during capturing visual images. Therefore, the database images and the query images of the same location most likely exhibit diverse viewpoints. In the context of autonomous vehicles, cameras are usually fixed on vehicles, thus the captured images share a relatively stationary viewpoint.
- Appearance changes. As shown in Figure 1c,d, dynamic objects (e.g., vehicles, bicycles and pedestrians) in images result in appearance changes between database and query images. In the context of autonomous vehicles, the moving vehicles often maintain a secure distance from other vehicles or pedestrians, hence those dynamic objects are not salient in images. Moreover, the images captured by wearable cameras tend to be blurry due to shaking of carriers’ walking. If visual localization is deficient of the capability of recognizing the same location under different conditions, the practicability is largely limited.
- Route changes. The visually impaired people may travel into a new place, which was not recorded in database. The localization system needs to not only reduce false alarms, but also re-localize the place when users return to the recorded route.
- Providing comprehensive evaluation of ConvNets on visual assisted localization. Aiming at practical scenarios of visual localization for the visually impaired, we perform layer-by-layer comparisons in five prevailing ConvNets on the problems of environmental changes, and analyze the description capability of layers in different levels.
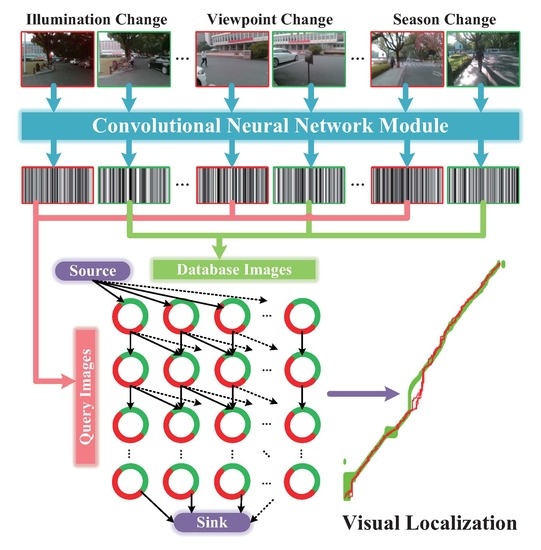
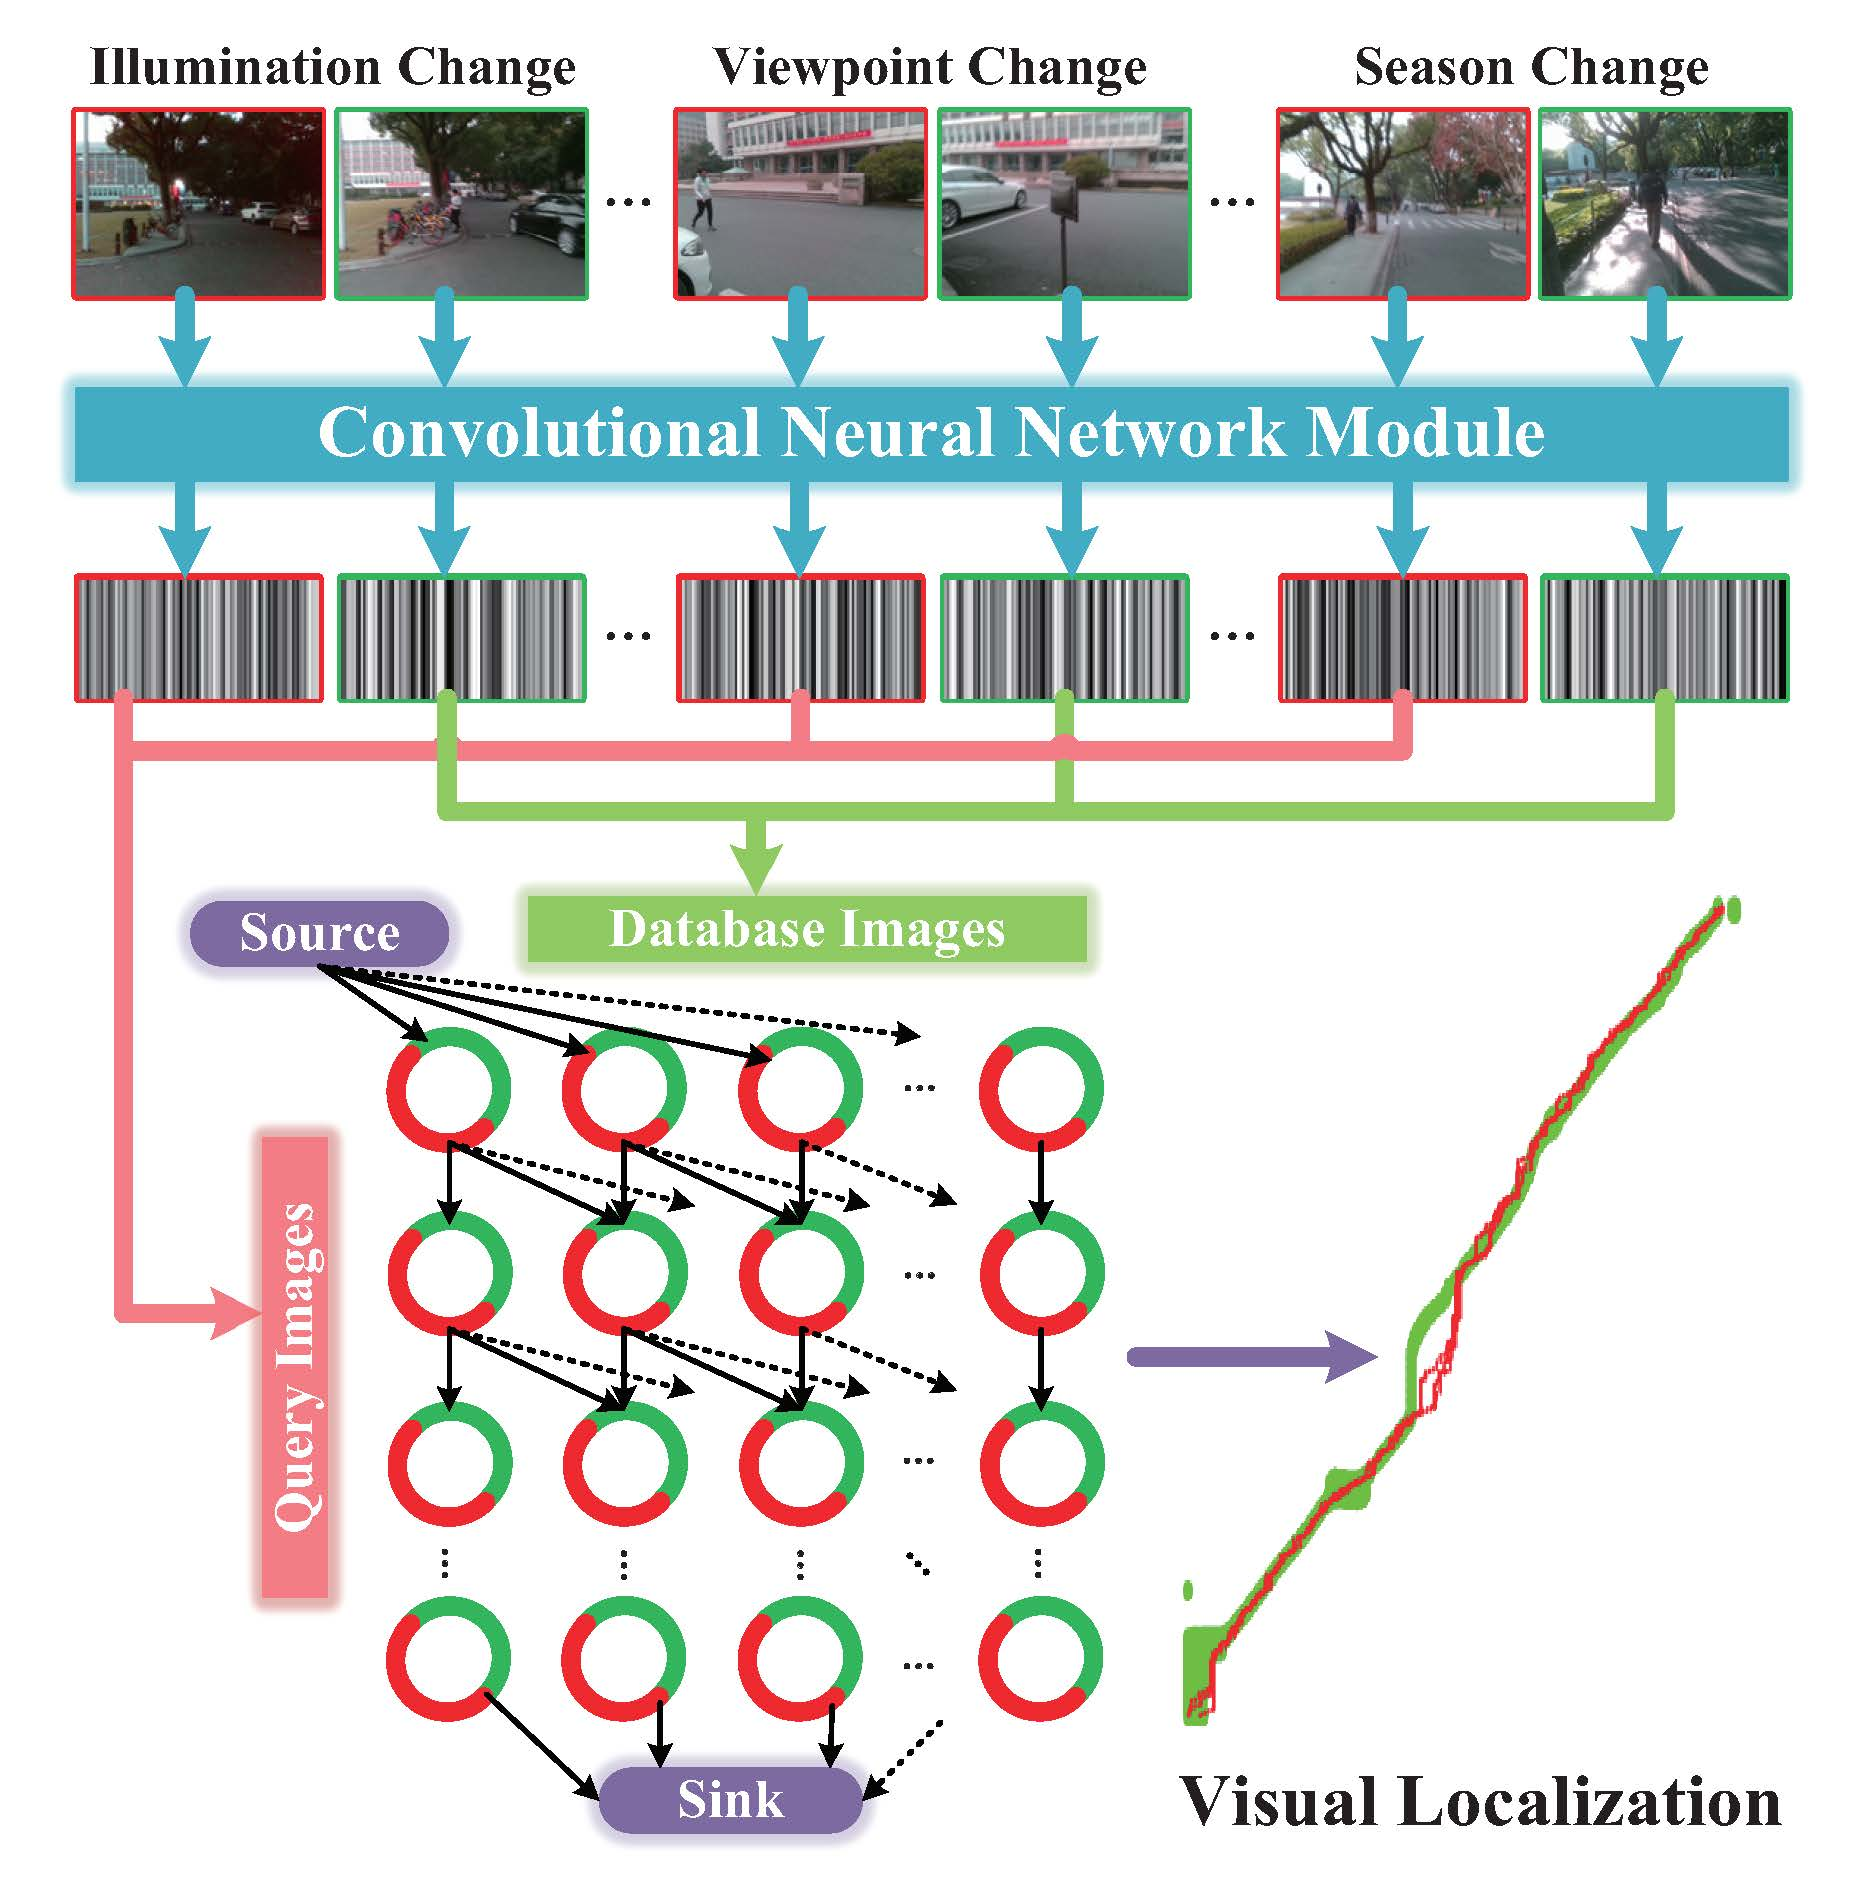
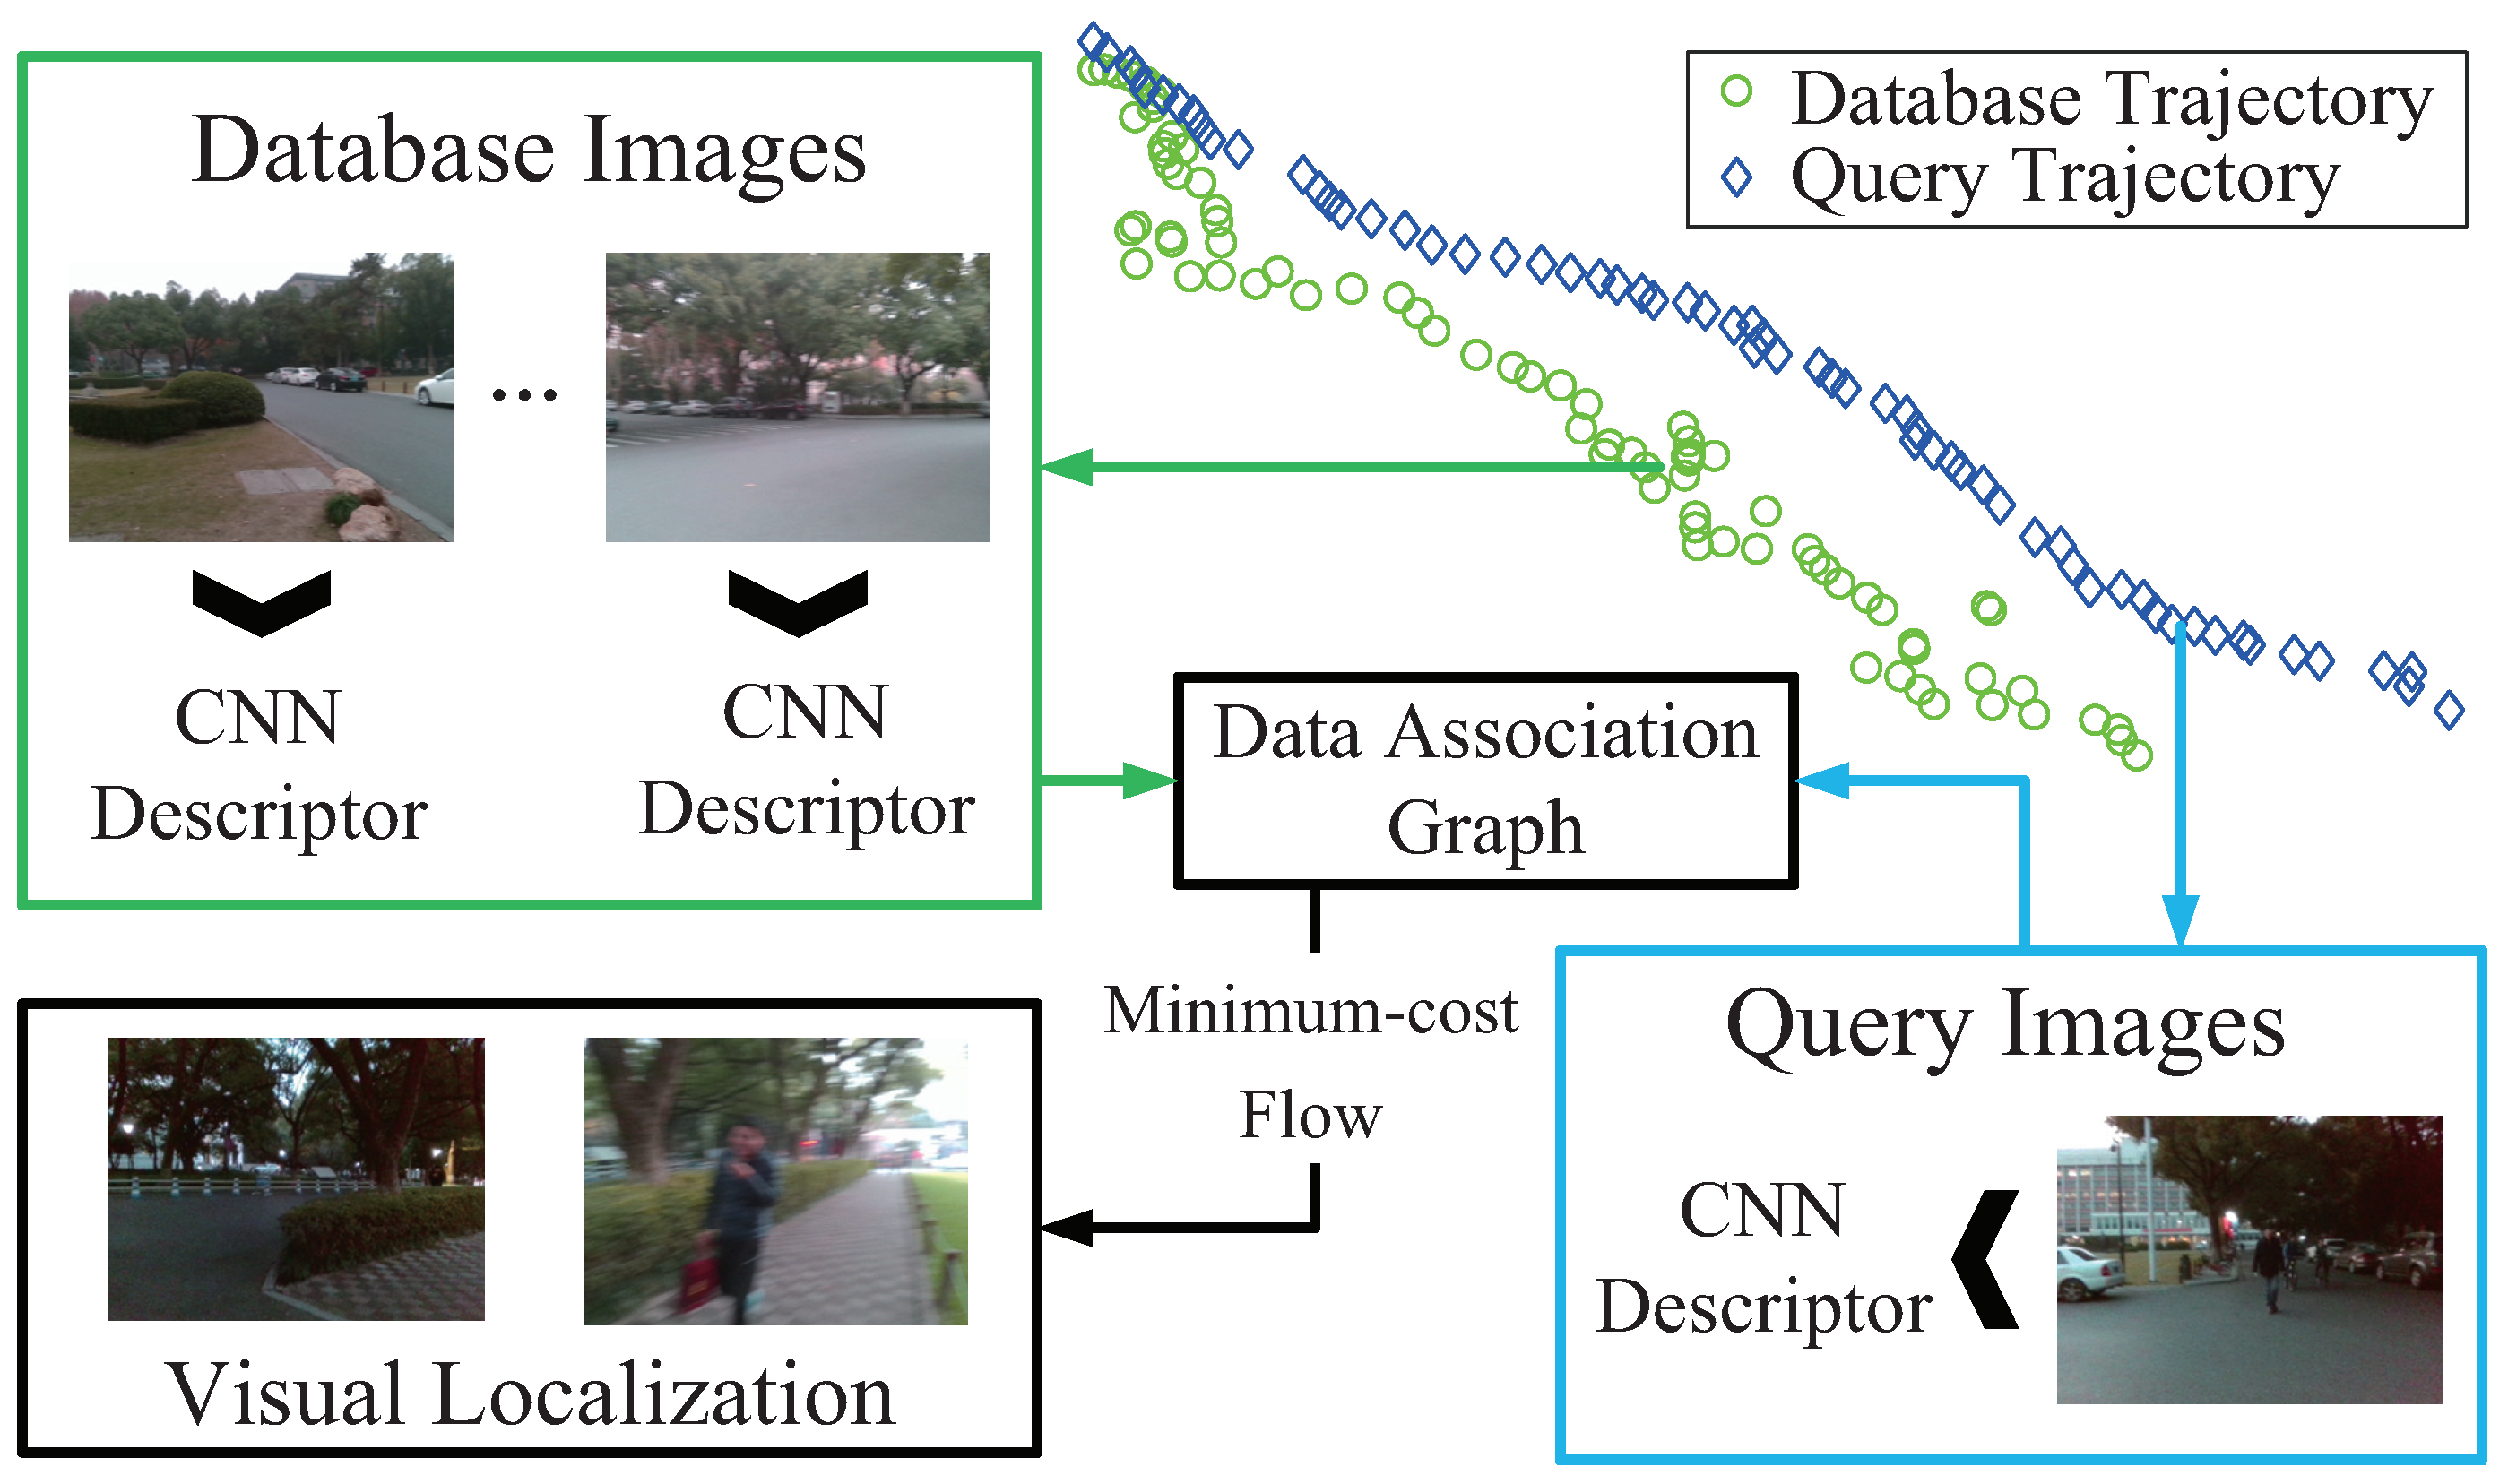
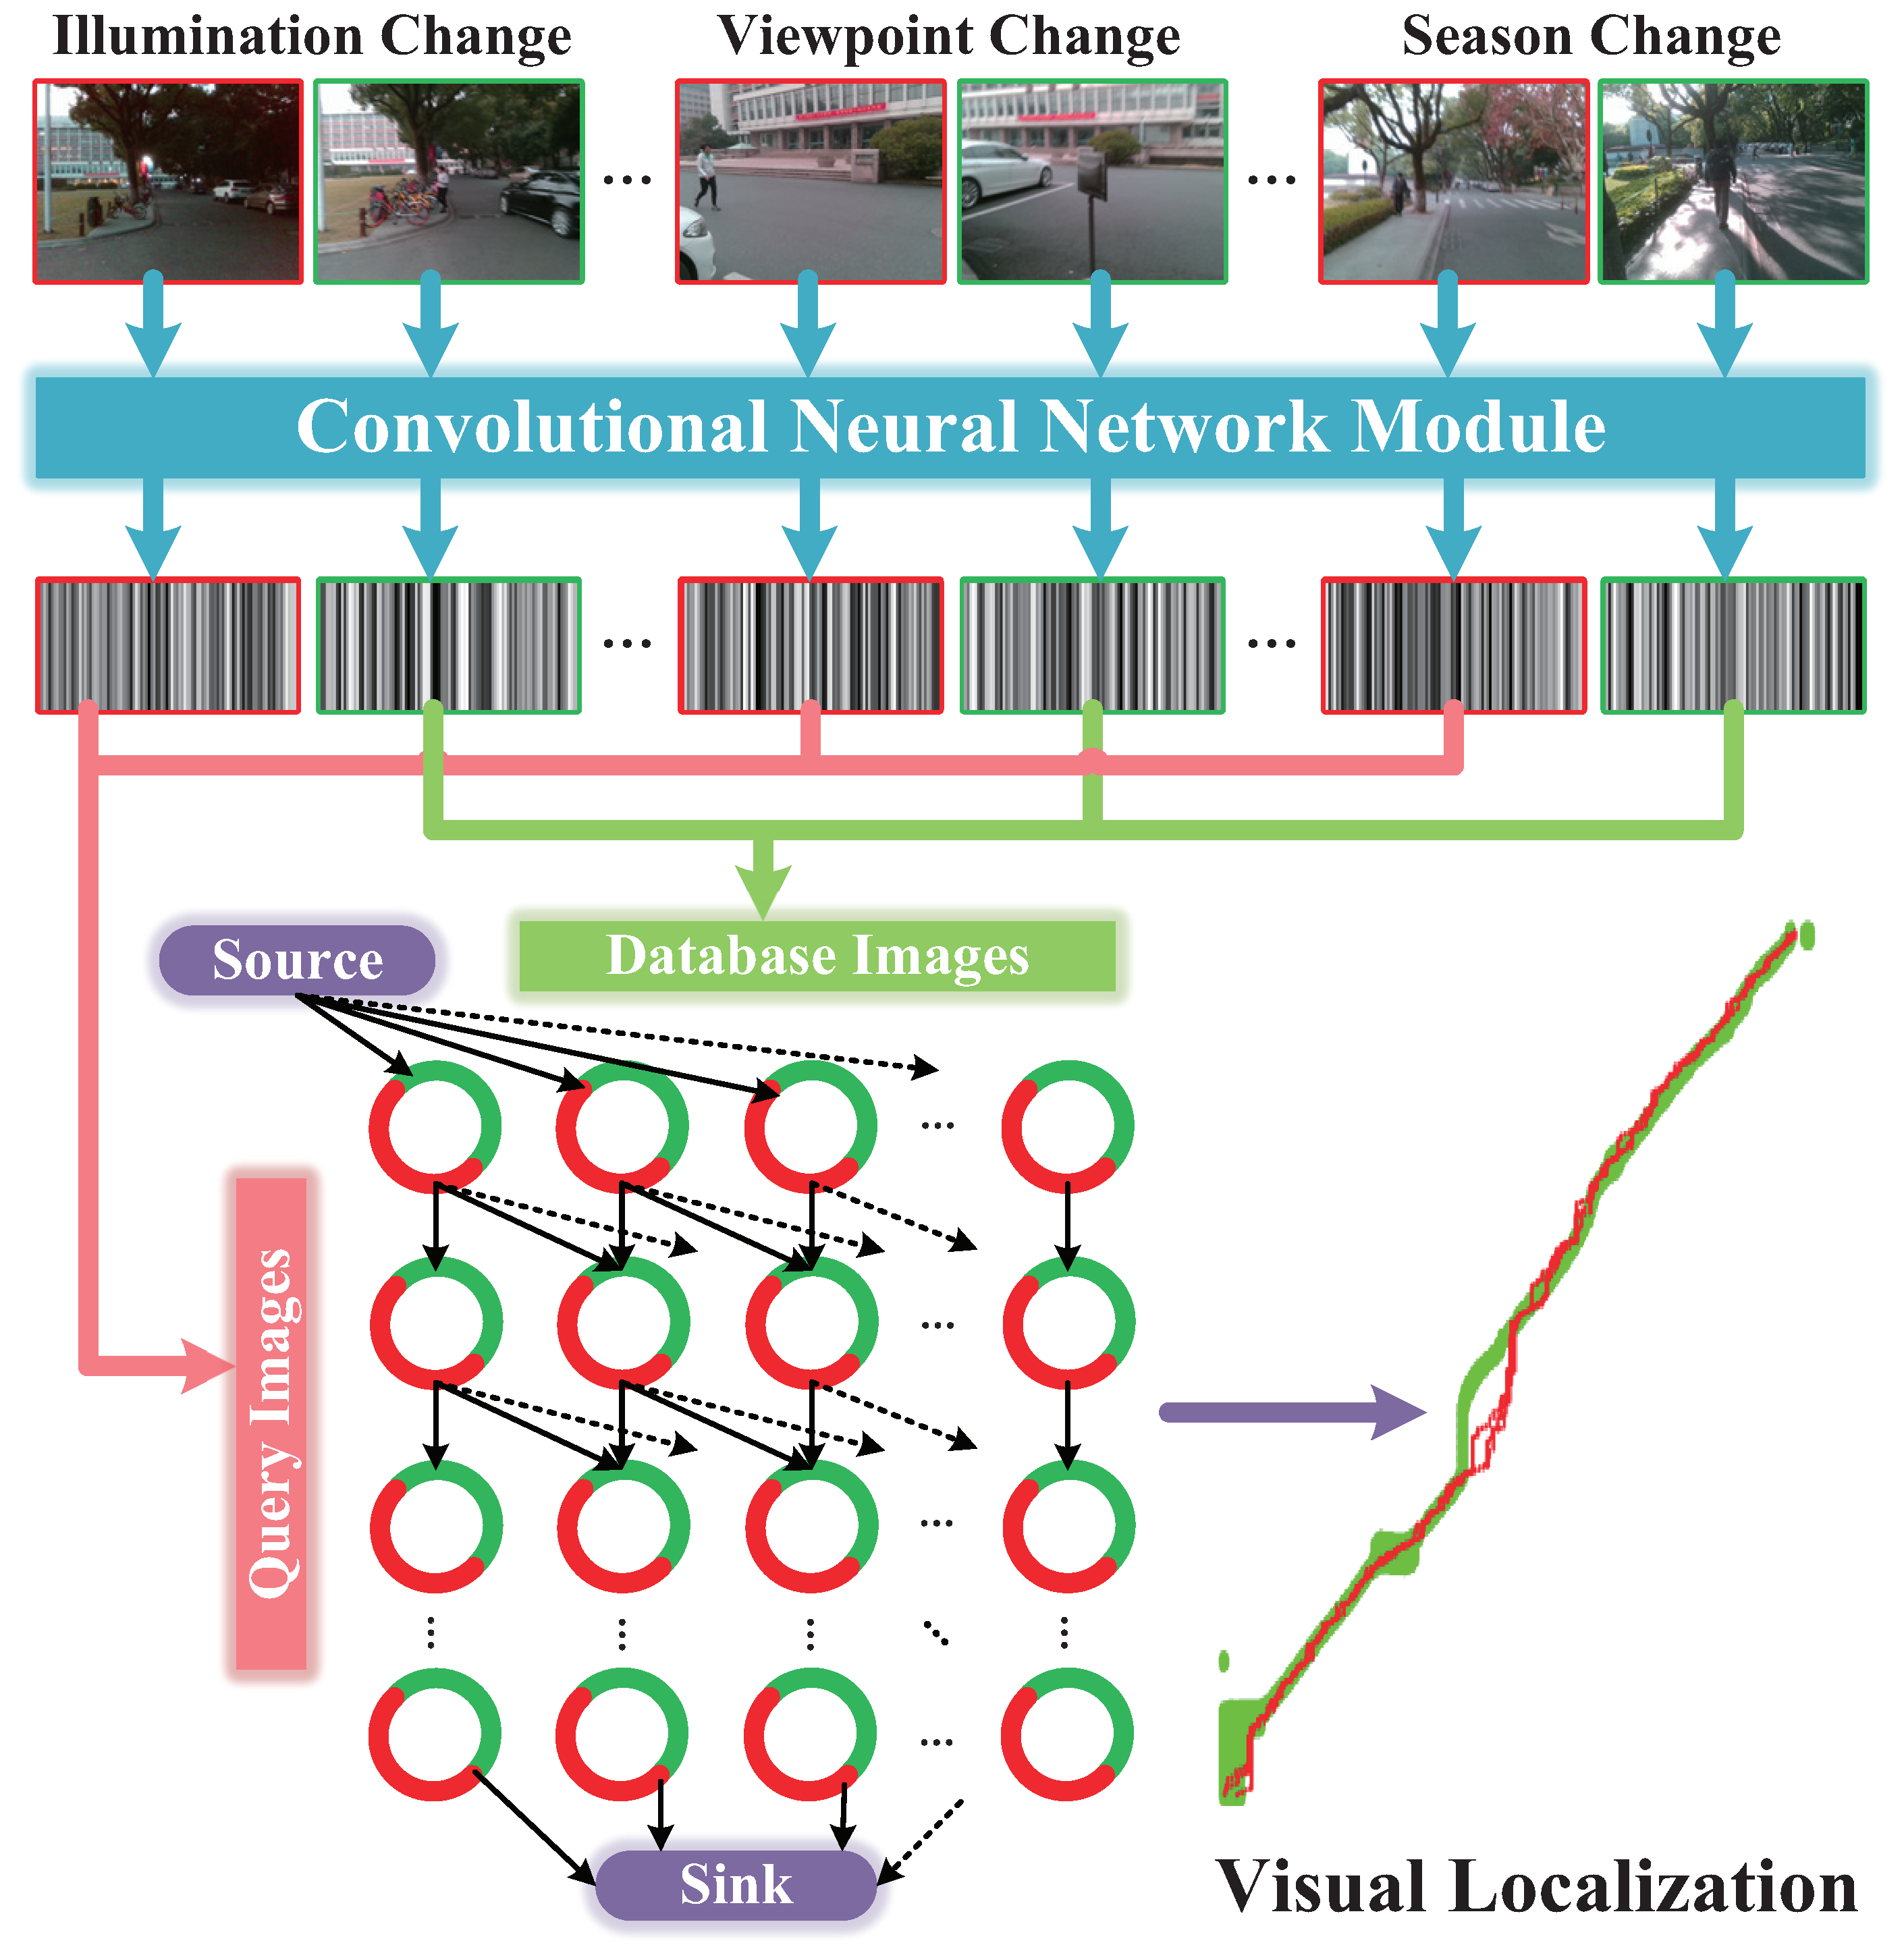
- Proposing a visual localization framework—Visual Localizer. Considering the comprehensive comparison of different ConvNets, a lightweight ConvNet-based descriptor is put forward to depict holistic information of images. The possible image matching results are organized as a data association graph, based on which a minimum-cost flow problem is addressed to obtain optimal matching results and refuse potential mismatching images. In addition, the ConvNet descriptor and global optimization do not require training or tuning for specific environments.
- Adaptability to real-world scenarios. Visual Localizer is tested sufficiently both on public datasets and in practical environments, which demonstrates the robustness against viewpoint changes, appearance changes and route changes. The database and query images used in the real-world experiments are captured by visually impaired volunteers. Beyond the domain of assisted navigation, the system can also be applied to autonomous driving and robotics context.
2. Related Work
2.1. State-of-the-Art Assisted Localization
2.2. Visual Localization System
2.2.1. Image Representation
2.2.2. Image Matching
3. Visual Localizer
3.1. ConvNet-Based Image Representation
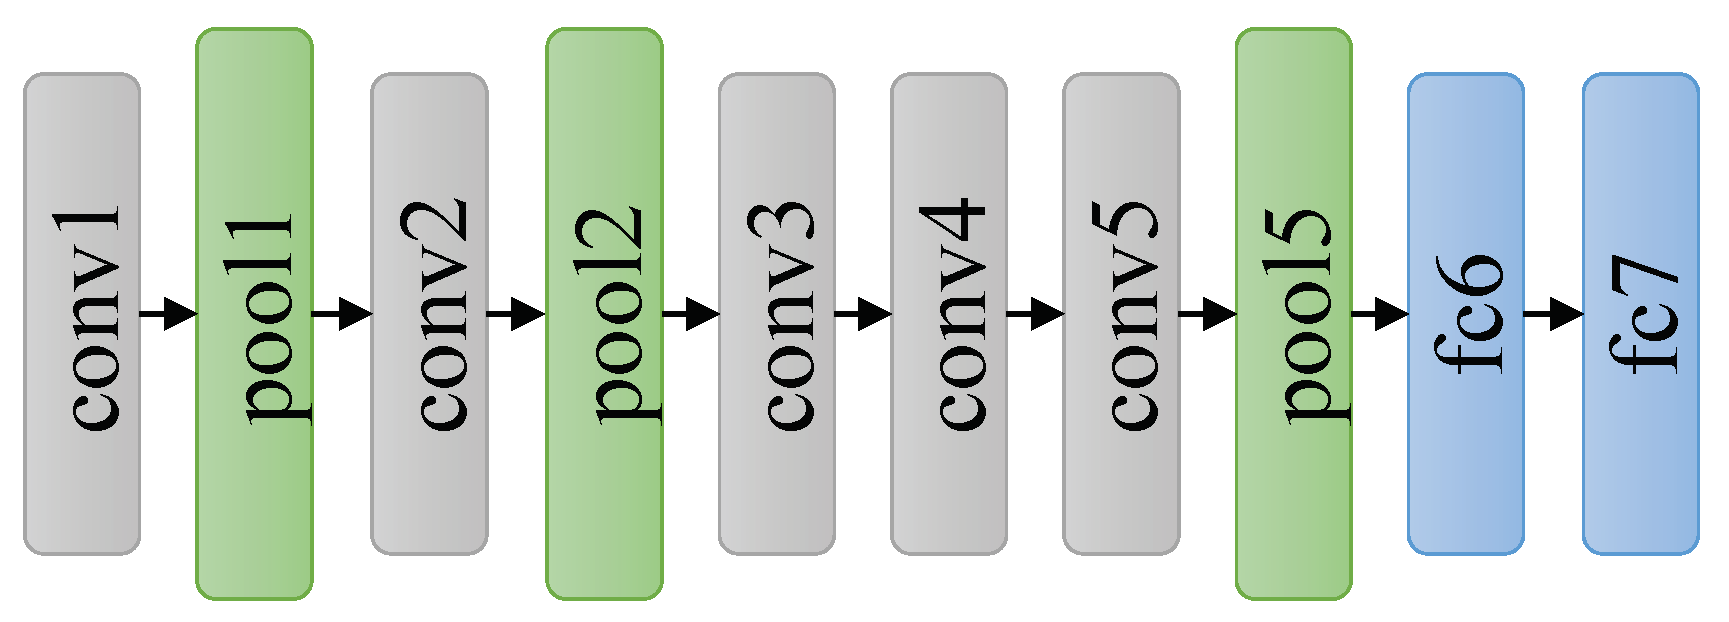
3.1.1. AlexNet
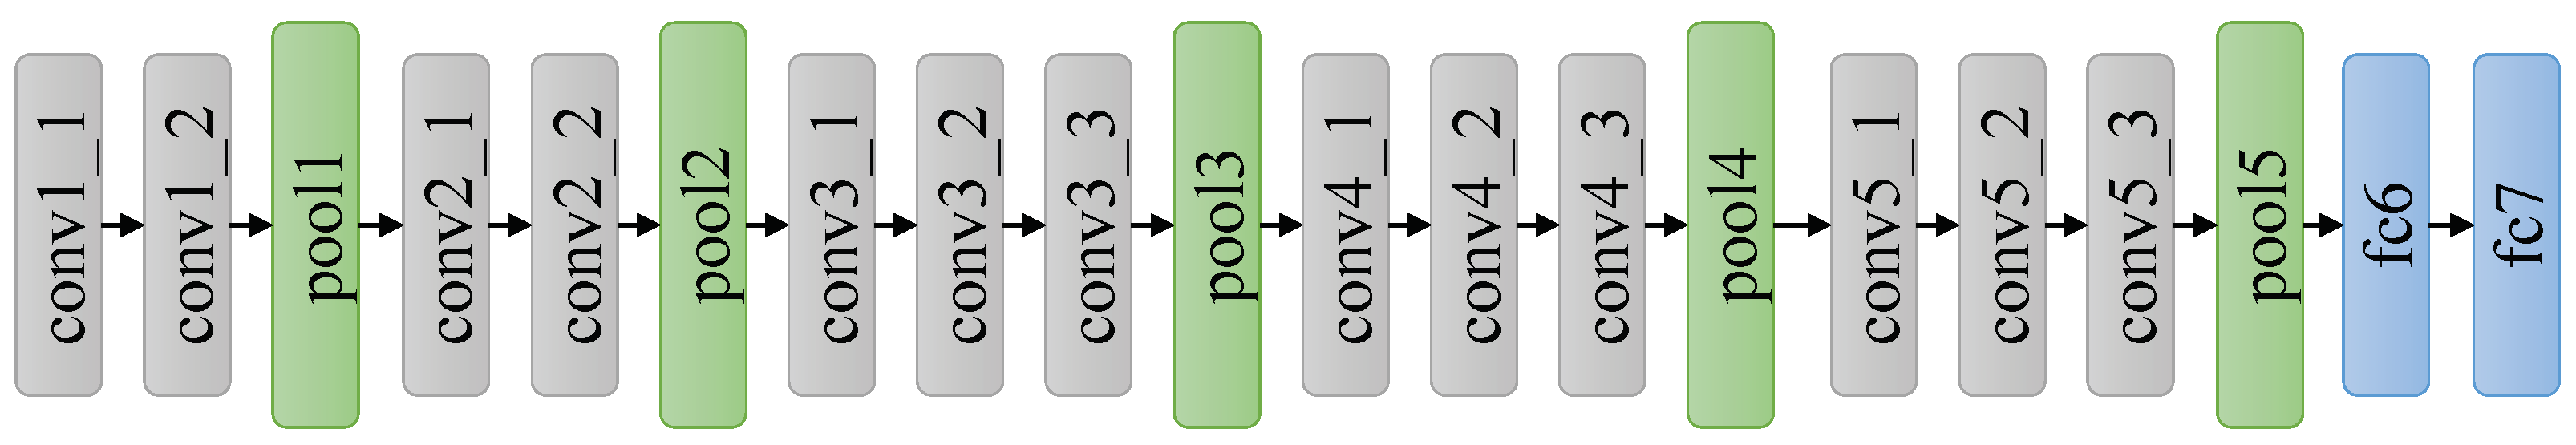
3.1.2. VGGNets
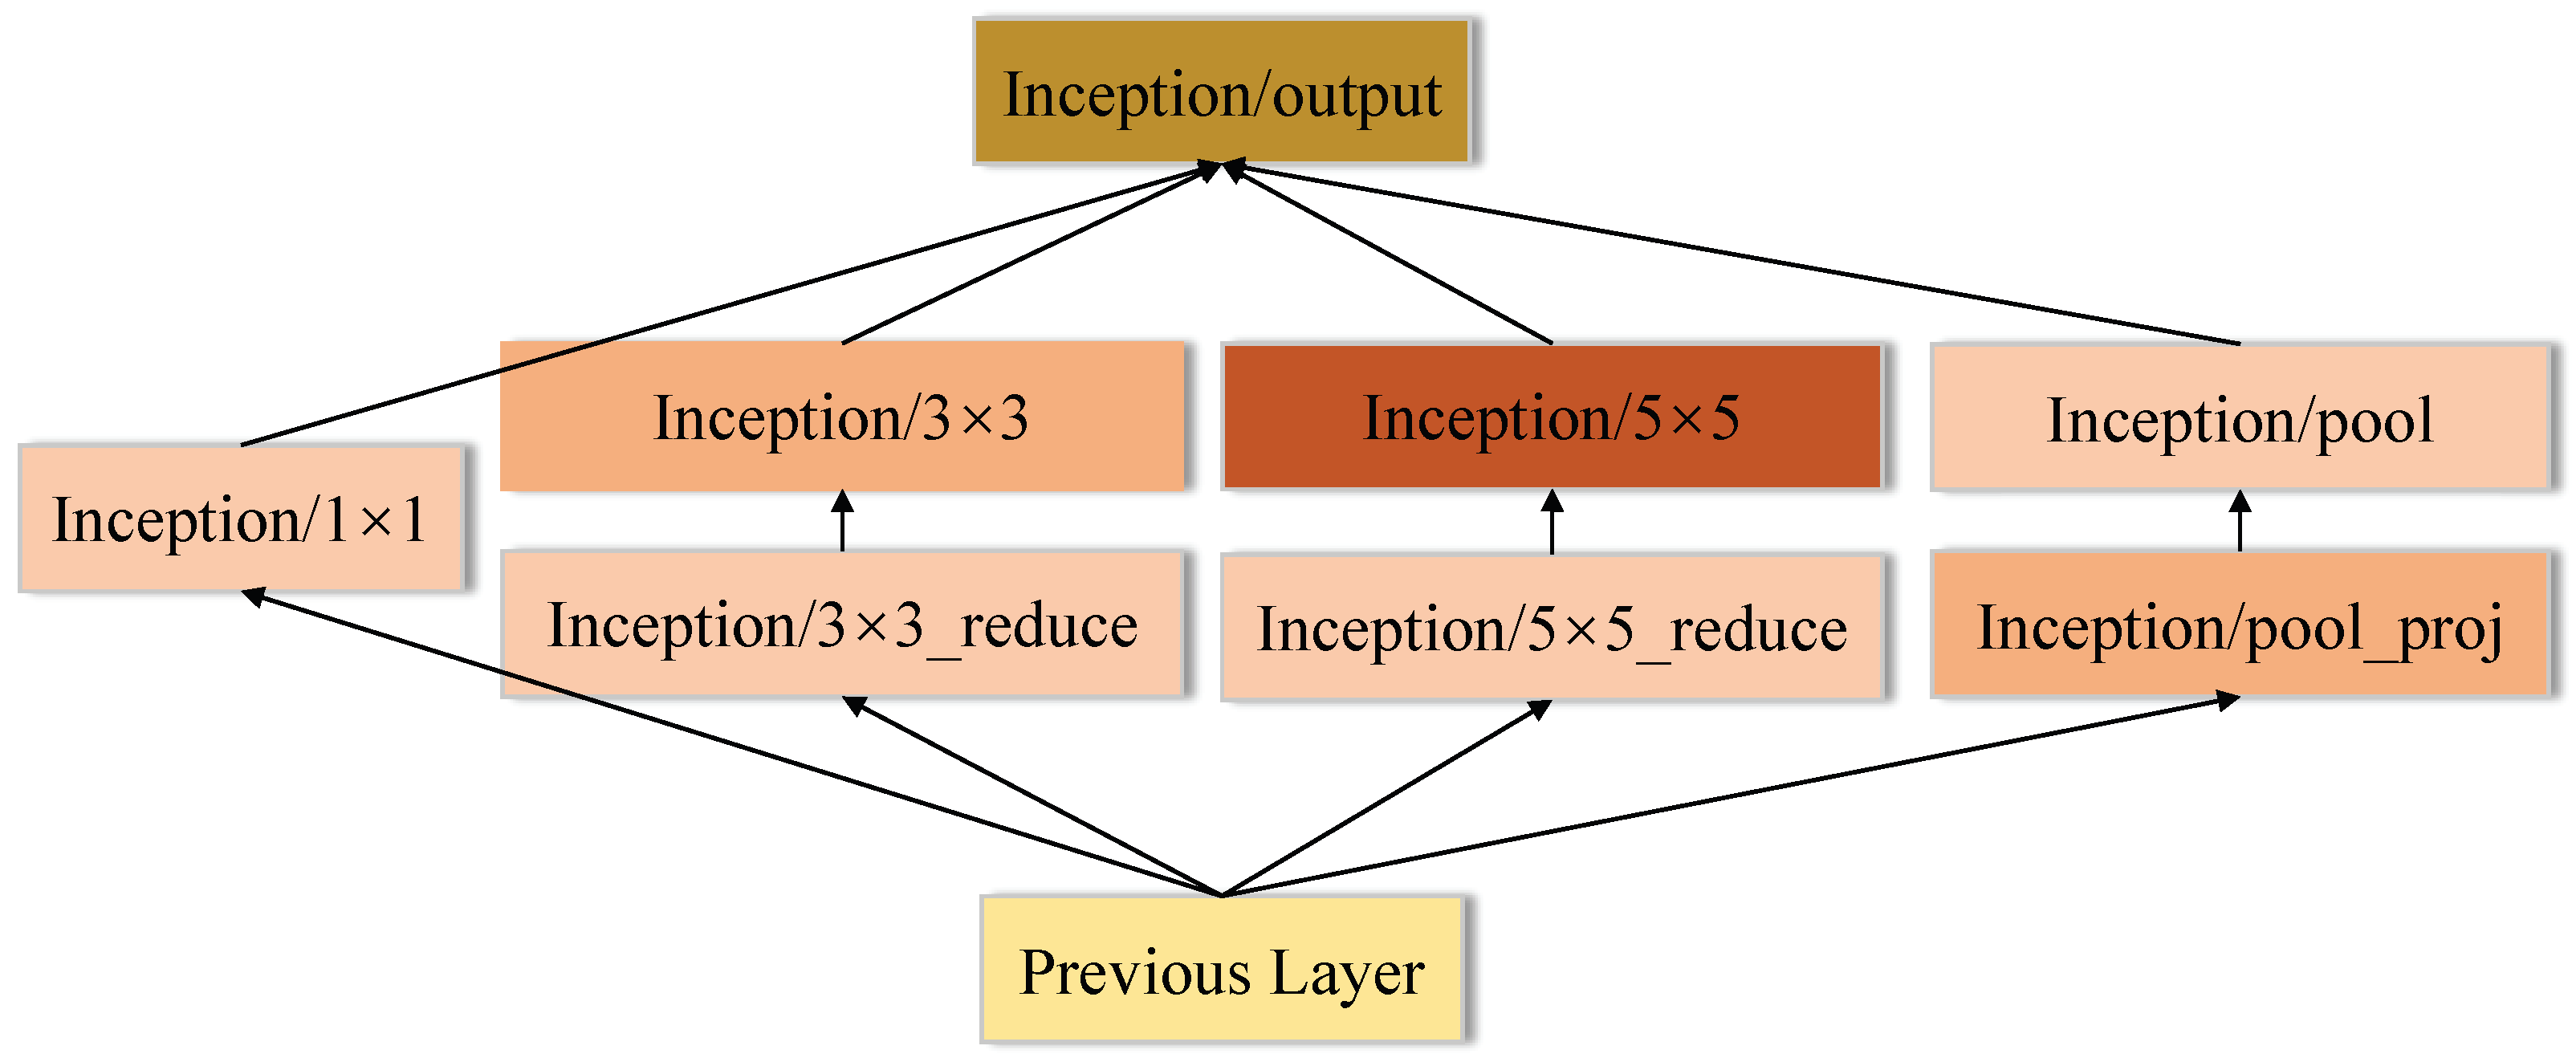
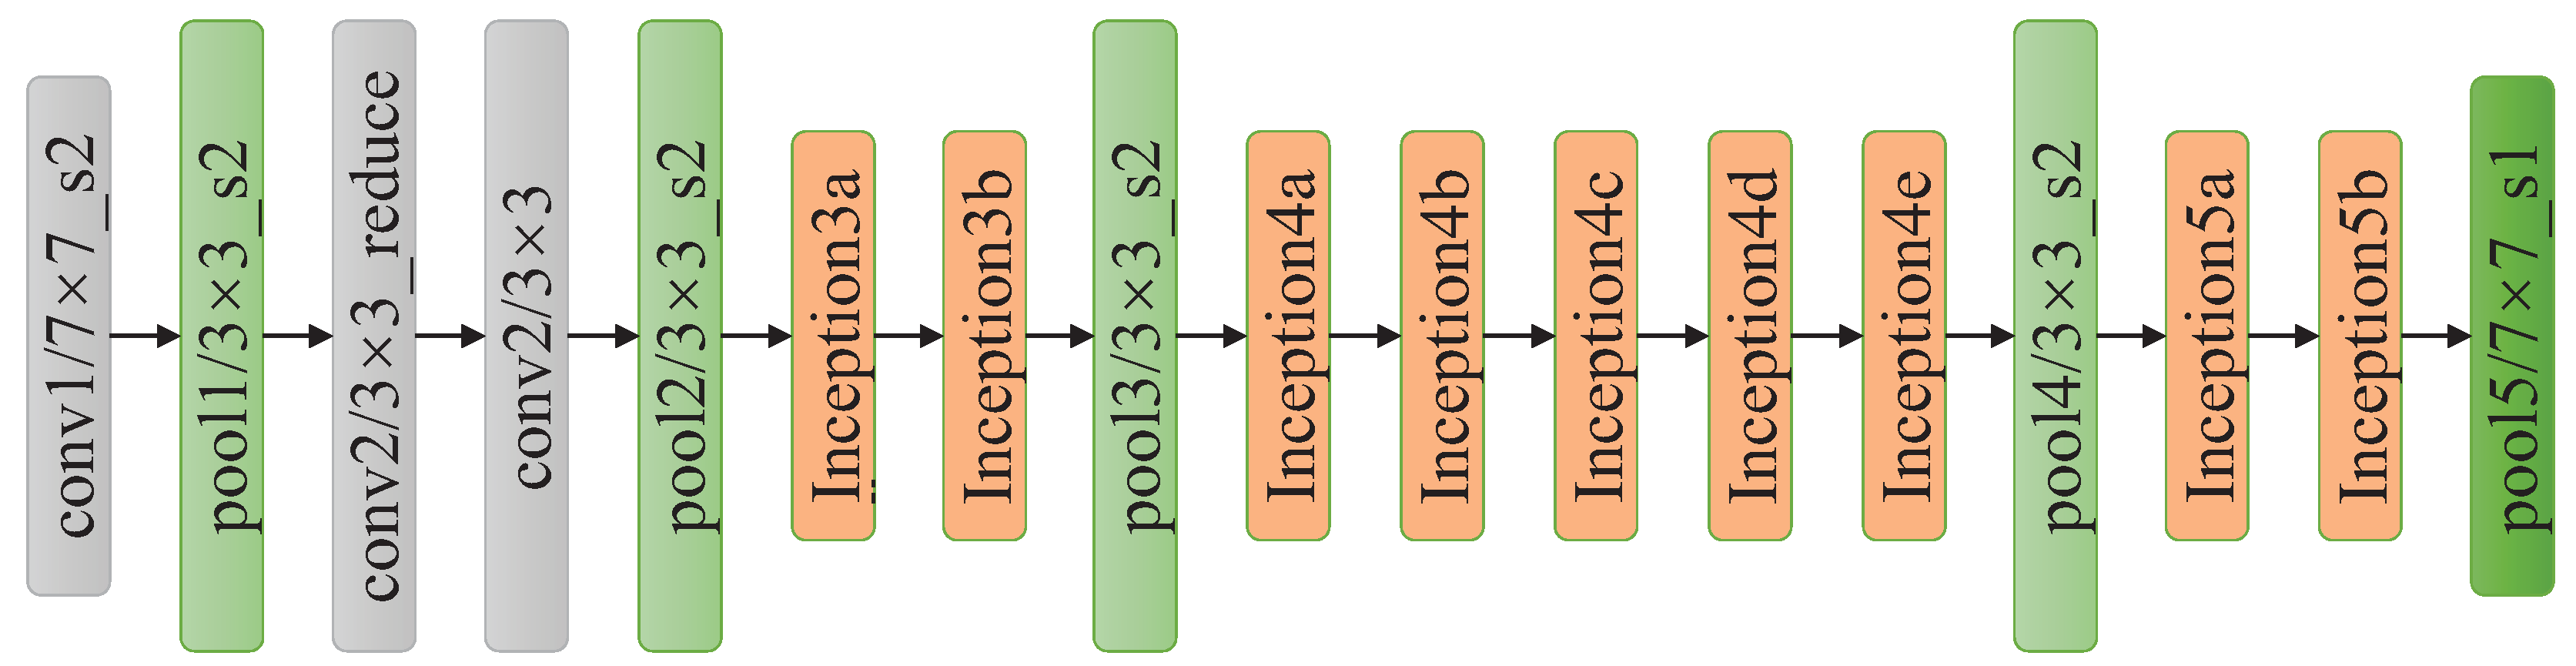
3.1.3. GoogLeNet
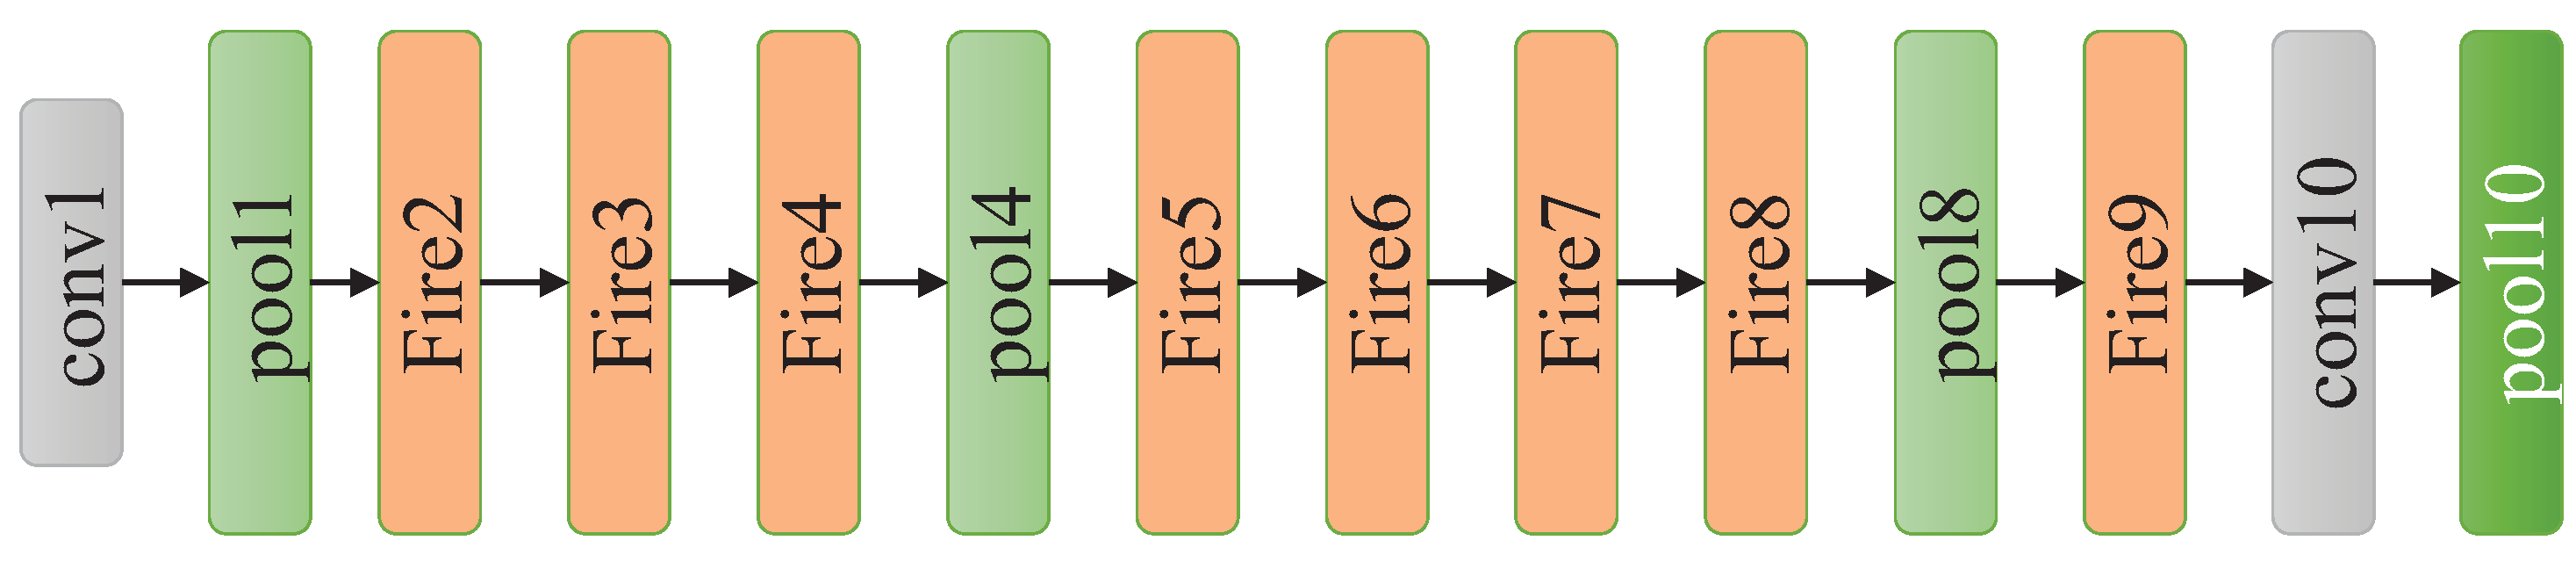
3.1.4. SqueezeNet
3.1.5. MobileNet
3.2. Global Optimization of Image Matching
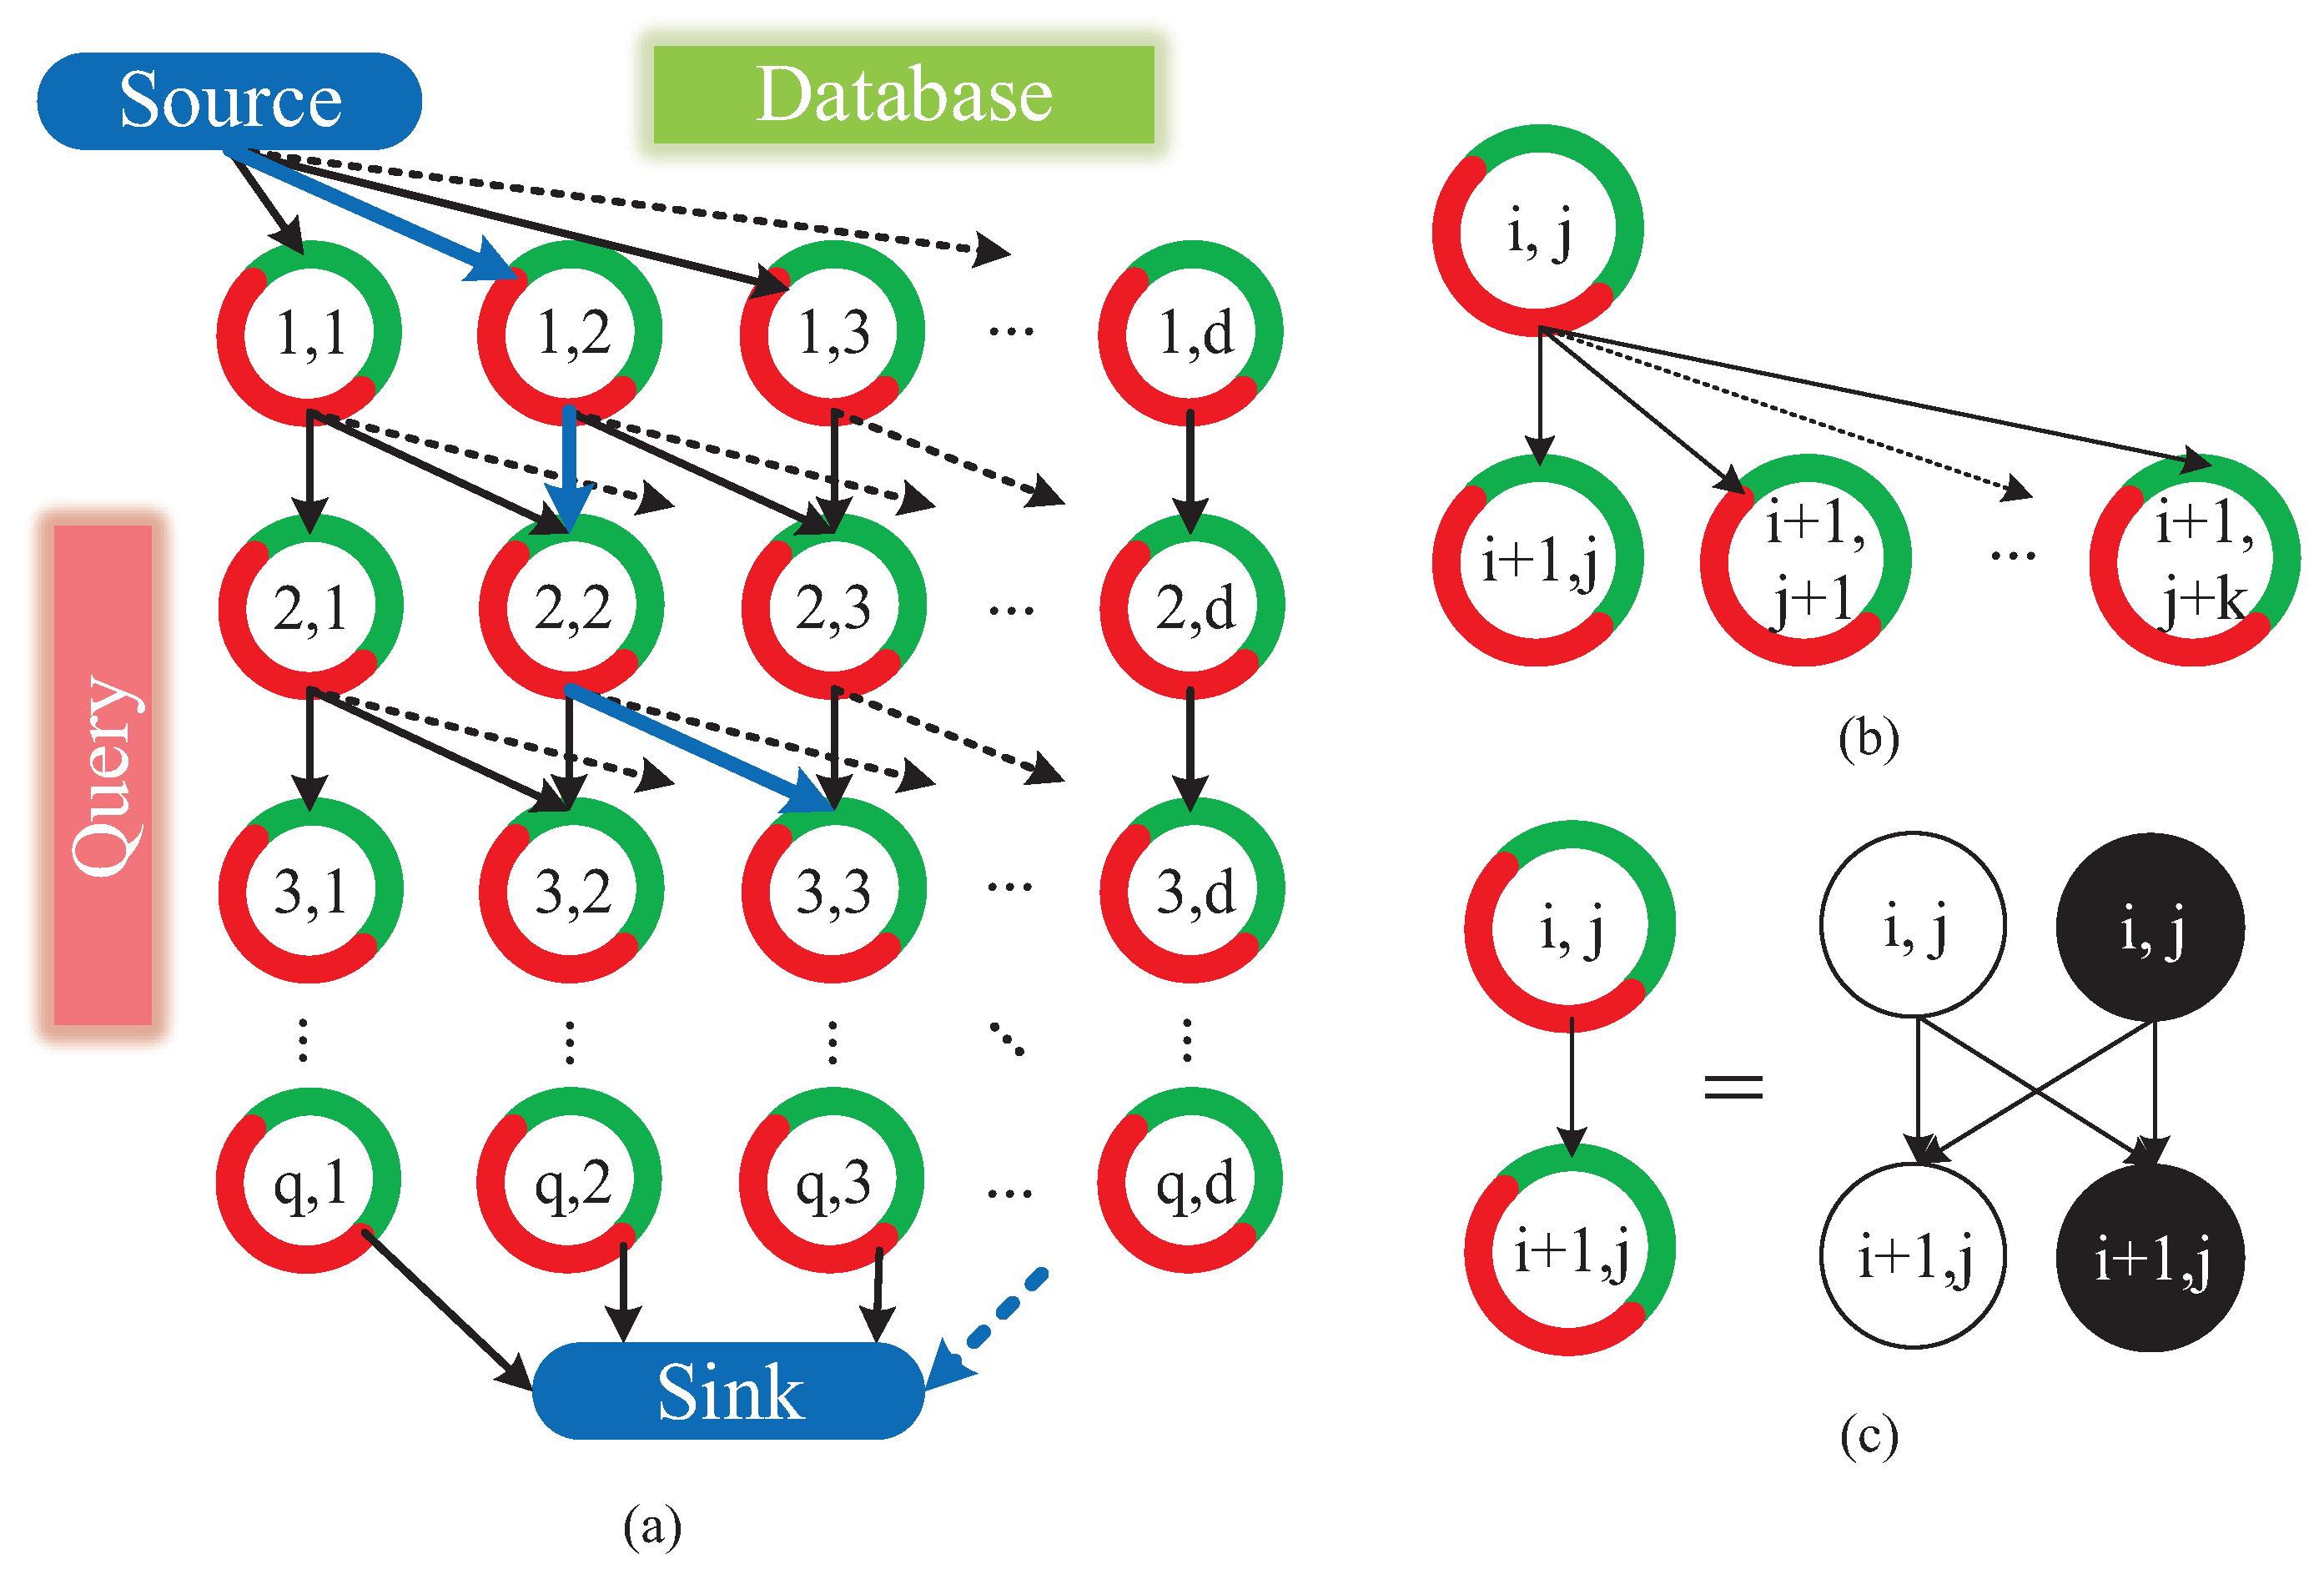
- Node. Nodes fall into three types: source node, sink node and ordinary “node”. The ordinary “node” reflects the state that the i-th query image matches with j-th database image. As Figure 12c showing, each ordinary “node” is actually comprised of a matching node and a hidden node, which denotes the matching or mismatching state of two images, respectively.
- Edge. We define a directed connection between two “nodes” as an arc, which is represented with an arrow in Figure 12a,b. Meanwhile, as shown in Figure 12c, a directed connection between actual nodes is defined as an edge. The arc is the encapsulation of multiple edges. Source node connects with all of the nodes in the first row of graph. Similarly, sink node connects with all of the nodes in the last row of graph. As Figure 12b,c shows, the number of arcs originated from one ordinary node is equal to or less than , and those arcs merely point to nodes in the next row of graph.
- Cost. Cost w is associated to each edge. The cost of edges associating with source or sink node is set to 0. The cosine distance [23] is utilized to measure the similarity of two images in a matching node. The cost of edges pointing to a matching node is the reciprocal of corresponding cosine distance. Moreover, the cost of edges pointing to a hidden node is set to c.
4. System Evaluations and Experiments
4.1. Datasets
- Gardens Point Walking dataset [32]. The Gardens Point dataset consists of three traverses of the Gardens Point Campus of QUT in Brisbane. Two subsets were captured. One was captured during the day, which forms viewpoint change (left vs. right). The other one subset was captured during the night, which forms illumination change (day vs. night).
- Nordland dataset [46]. The Nordland dataset consisting of 10-h video footages of sceneries captured on the train in different seasons exhibits no viewpoint variations, and therefore allows testing the ConvNets on pure condition changes and appearance (across-season) changes. In our experiments, 400 images are extracted from the summer videos (as database images) and winter videos (as query images), respectively.
- Bonn dataset [8]. Recorded by the car-mounted camera in Bonn city during different time, the Bonn dataset consists of 488 images (as database dataset) and 544 images (as query dataset). The query as well as database trajectory contains several revisits of the same places. The dataset features illumination changes and viewpoint changes.
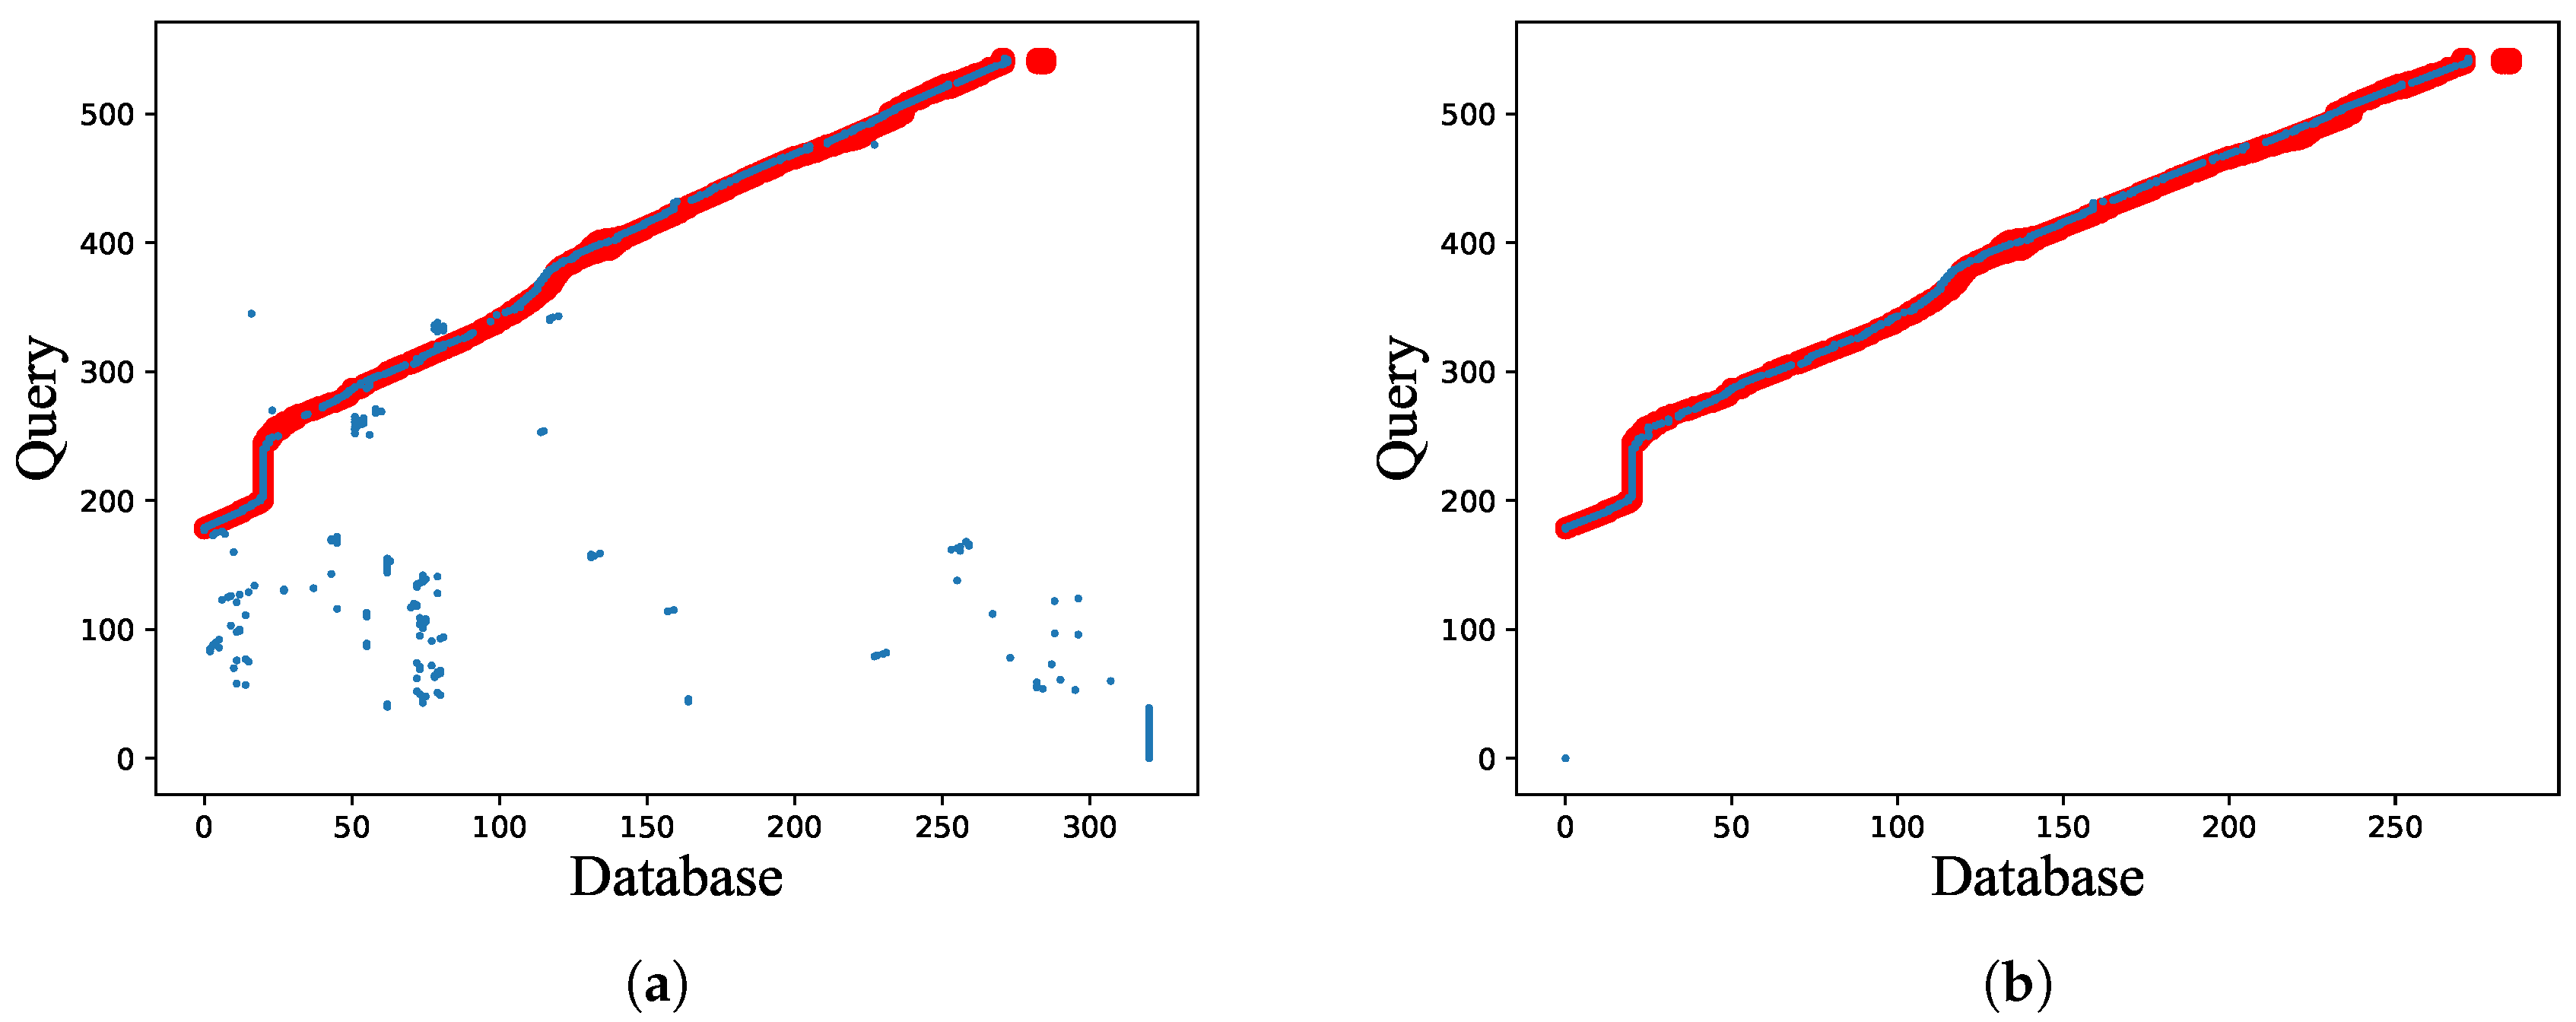
- Freiburg dataset [9]. Recorded by the car-mounted camera during different seasons, the Freiburg dataset consists of 361 images (as database dataset) and 676 images (as query dataset). The dataset captures significant perceptual and structural changes over the span of three years, which includes viewpoint changes and extreme seasonal variations. The database images and query images have the same start and end points. It is worth noting that the query images include the situation that the vehicle encounters red traffic light and stays for a while on the road.
4.2. Evaluation Criteria
- True positive (). The localization system matches the query image with a database image and the matching result is consistent with the ground truth.
- False positive (). The localization system matches the query image with a wrong image, which is different from the ground truth.
- False negative (). The localization system gives no response for a query image, but there are database images associated with the query image.
4.3. Performance Analysis and Comparison between Different ConvNet Layers
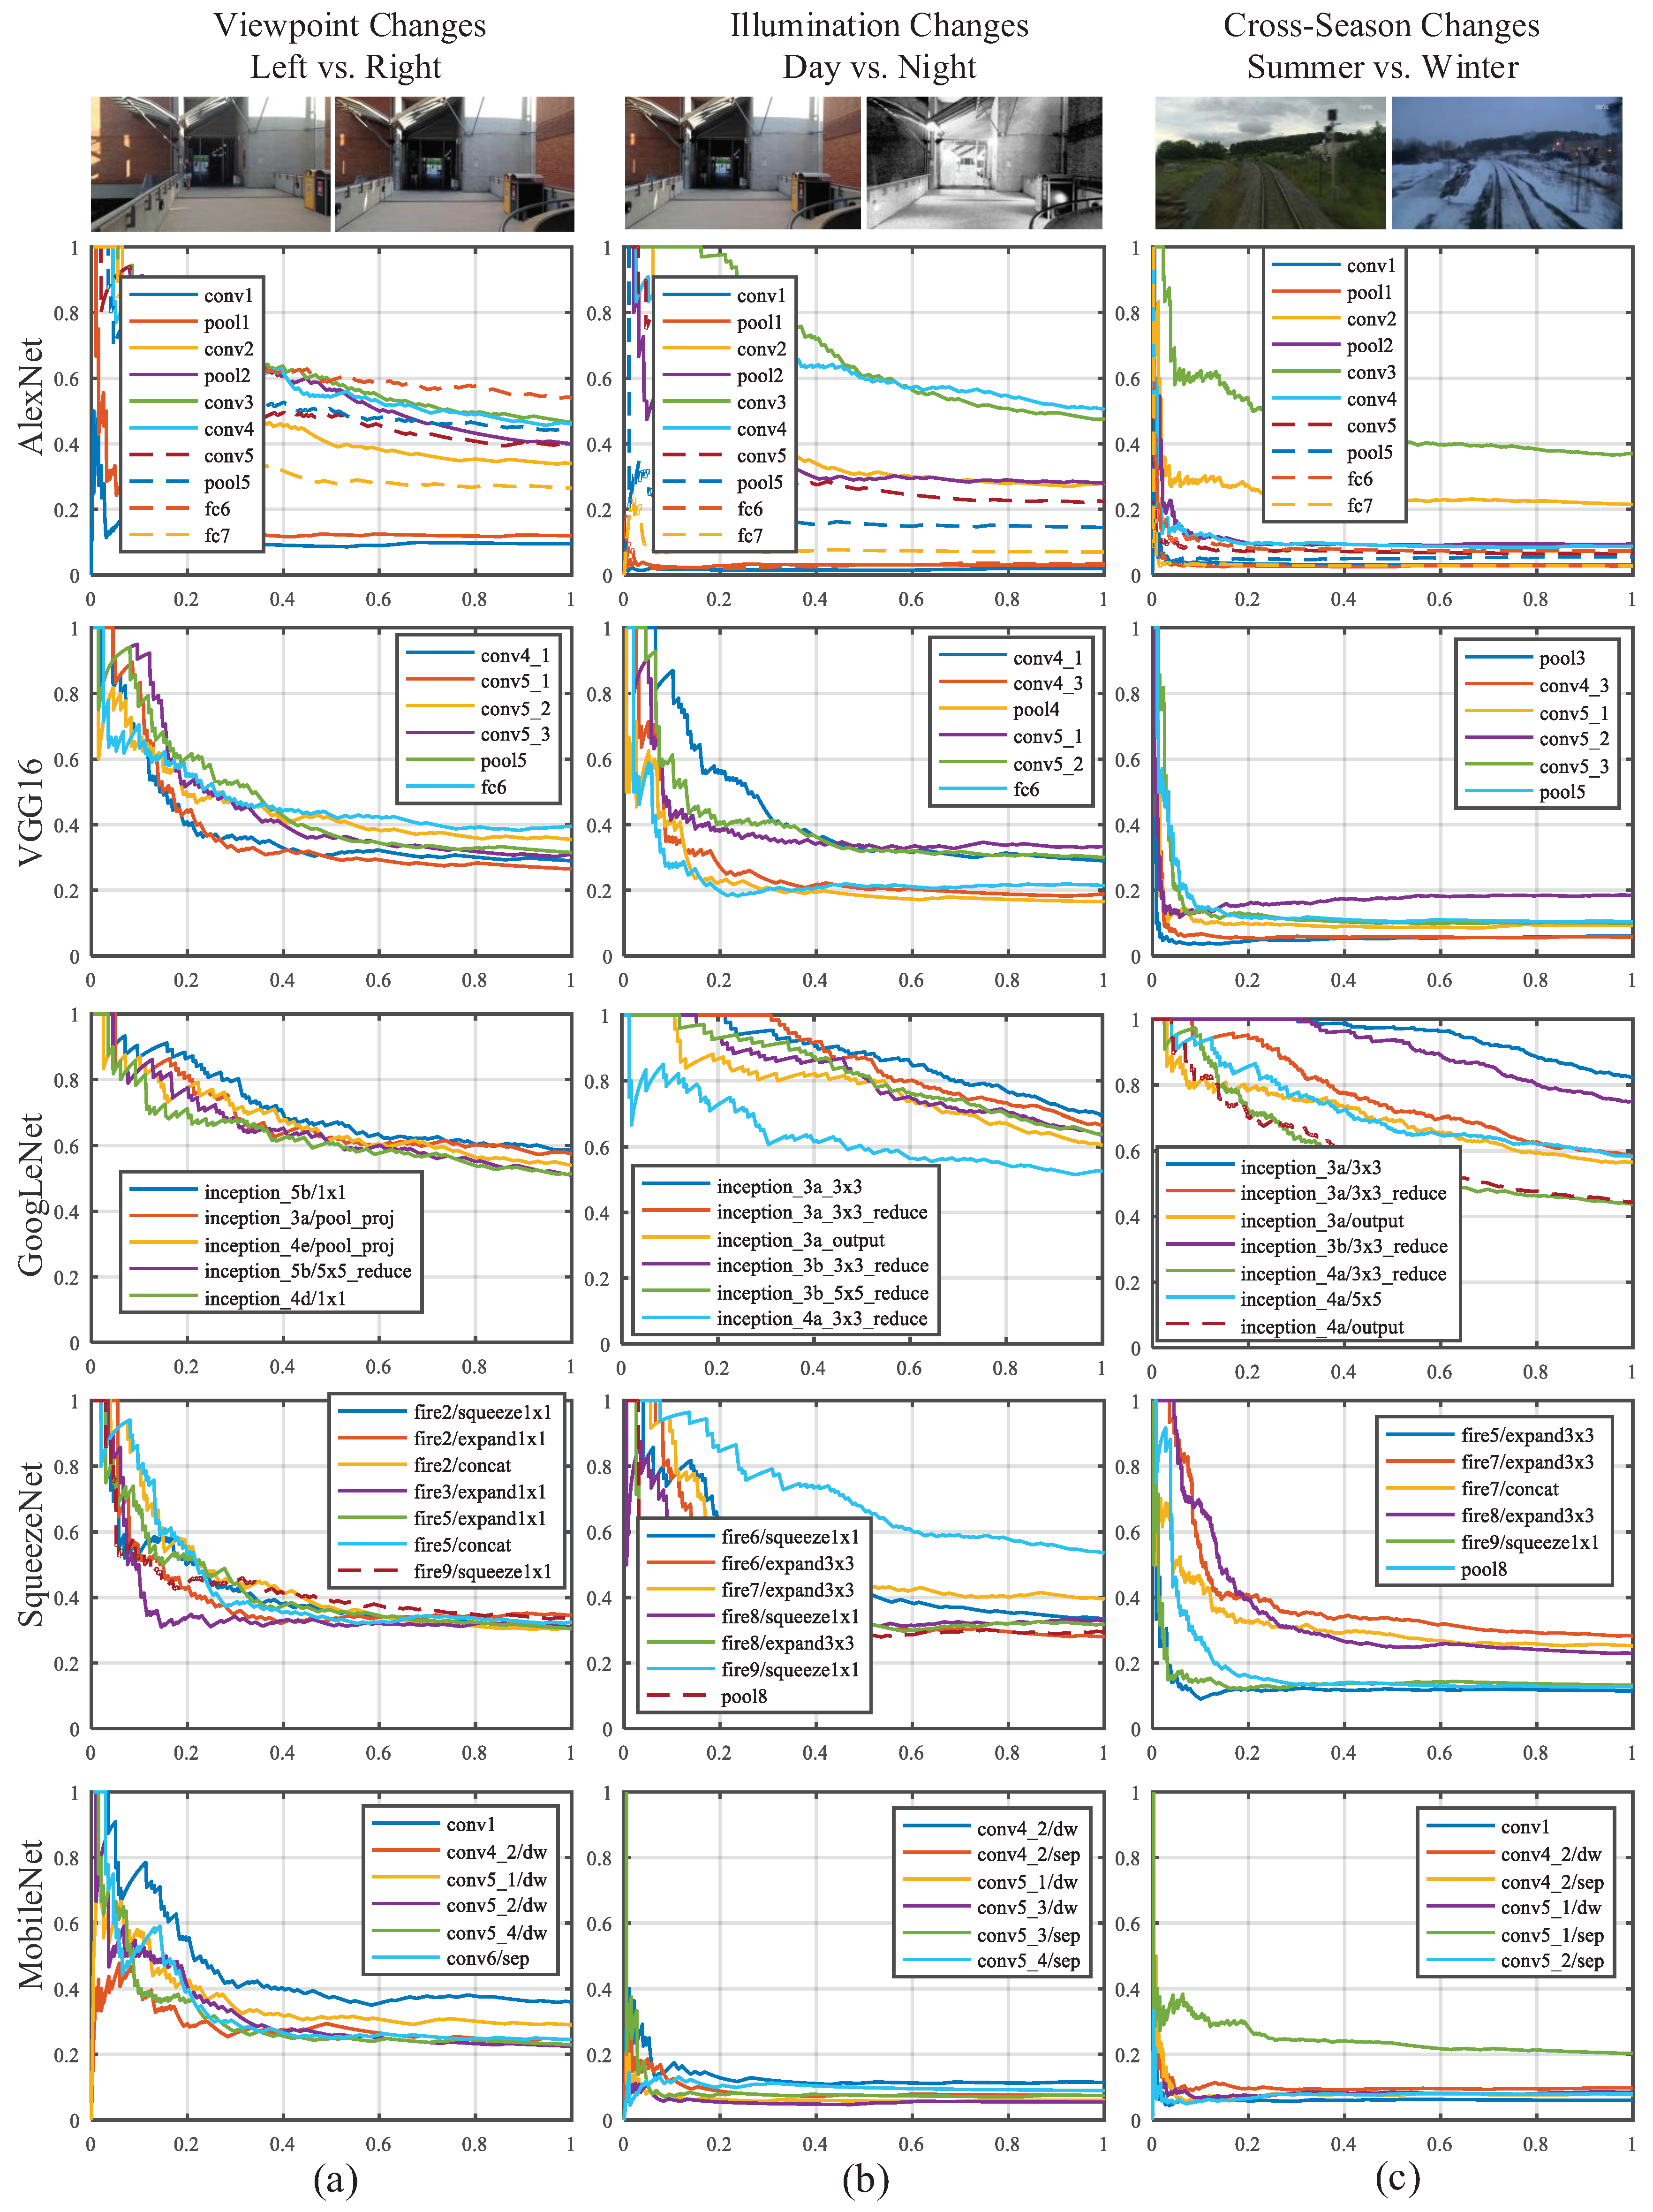
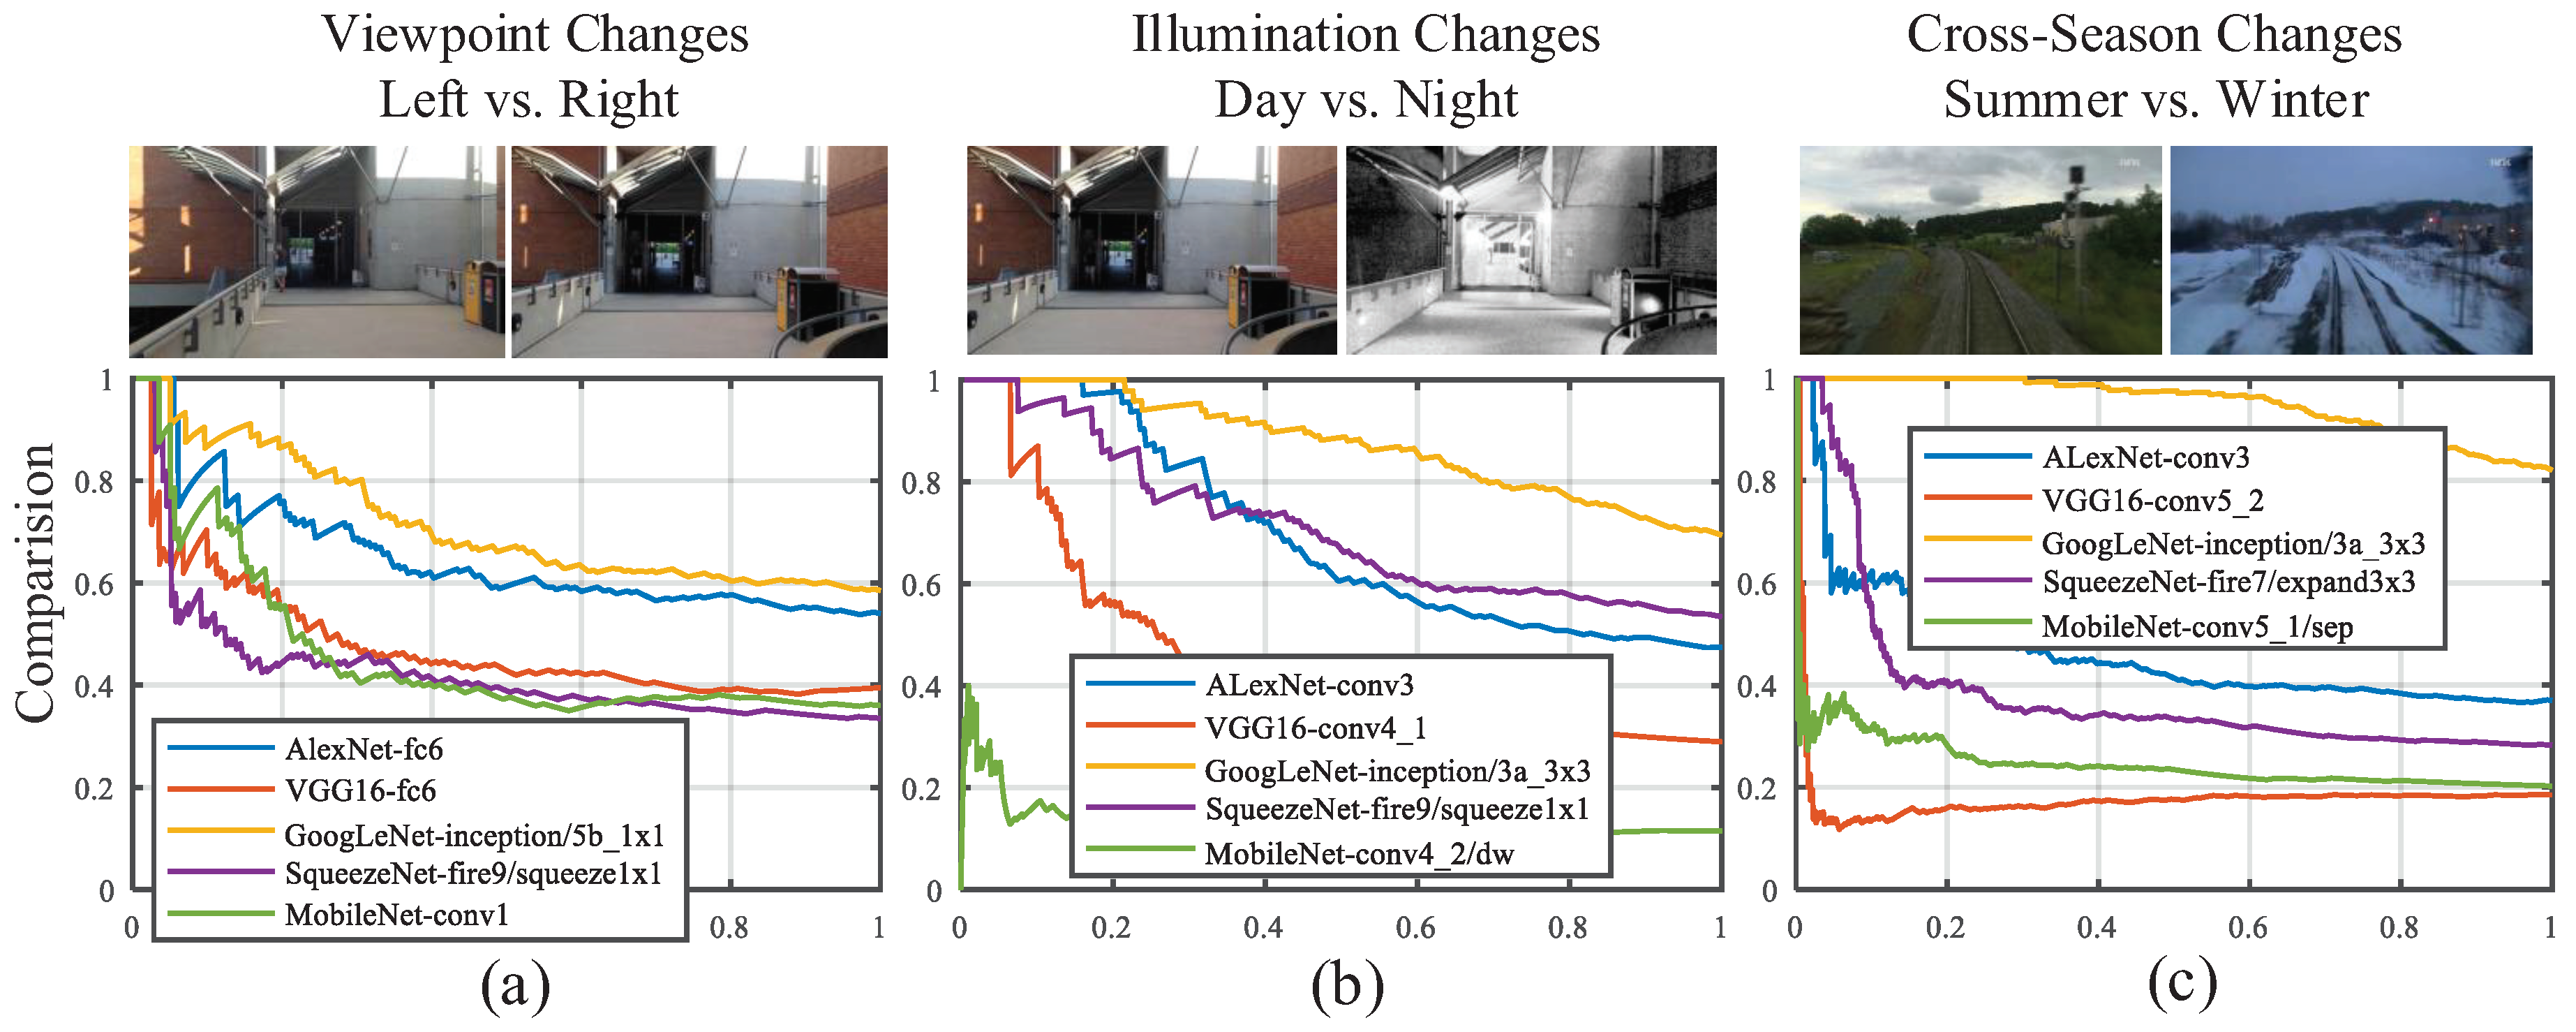
- In AlexNet, VGG16 and GoogLeNet, the features extracted from the mid-level layers are more robust against appearance changes, which is consistent with the conclusion made by Sünderhauf et.al. [32]. If the feature is illumination-invariant, it also exhibits season-invariant robustness, such as conv3 of AlexNet, conv4 and conv5 of VGG16 and Inception3a module of GoogLeNet. However, lightweight CovNets, such as SqueezeNet, seem contrary to the conclusions mentioned above.
- As shown in Table 1, the object recognition accuracy on the ImageNet dataset of VGG16 and MobileNet are 71.5% and 70.6%, respectively, which are better than other ConvNets. However, the features from VGG16 and MobileNet have inferior performance on appearance invariance. It illustrates the fact that the performance on the object recognition is not completely transferable to the task of visual place localization.
- As presented in Figure 14, the most layers of each ConvNet exhibit satisfactory precision on the viewpoint changes dataset, which illustrates the fact that convolutional layer features the nature of translation invariance. Given this insight, appearance changes will be paid more attention to in our selection of robust convolutional layer.
- GoogLeNet has overwhelming advantages against other ConvNets because of best performance on both appearance invariance and viewpoint invariance as well as modest computational complexity. Based on this observation, we choose GoogLeNet as the optimal ConvNet, from which we select robust layers to depict images.
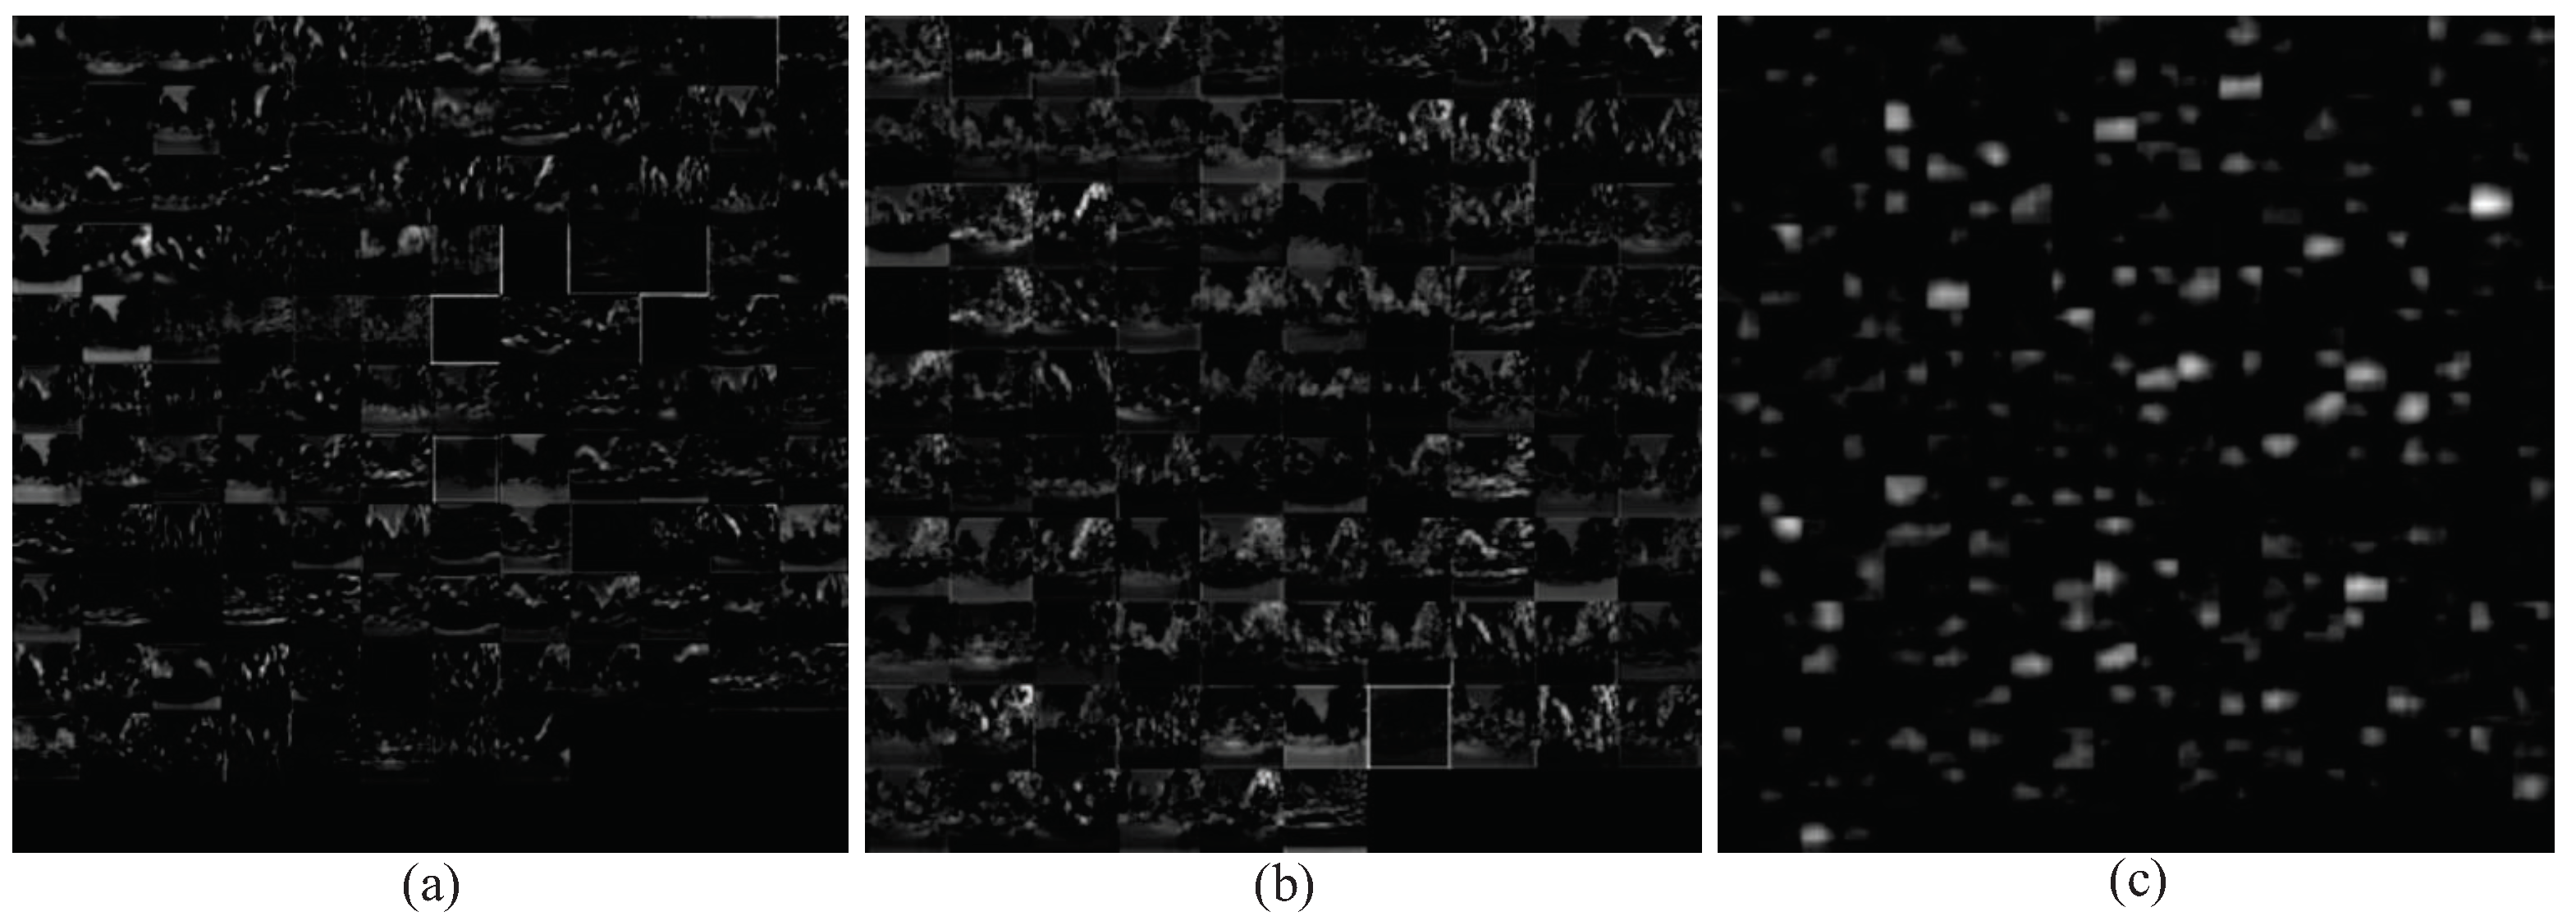
4.4. Visualization Analysis of Features Extracted from Different Levels of GoogLeNet
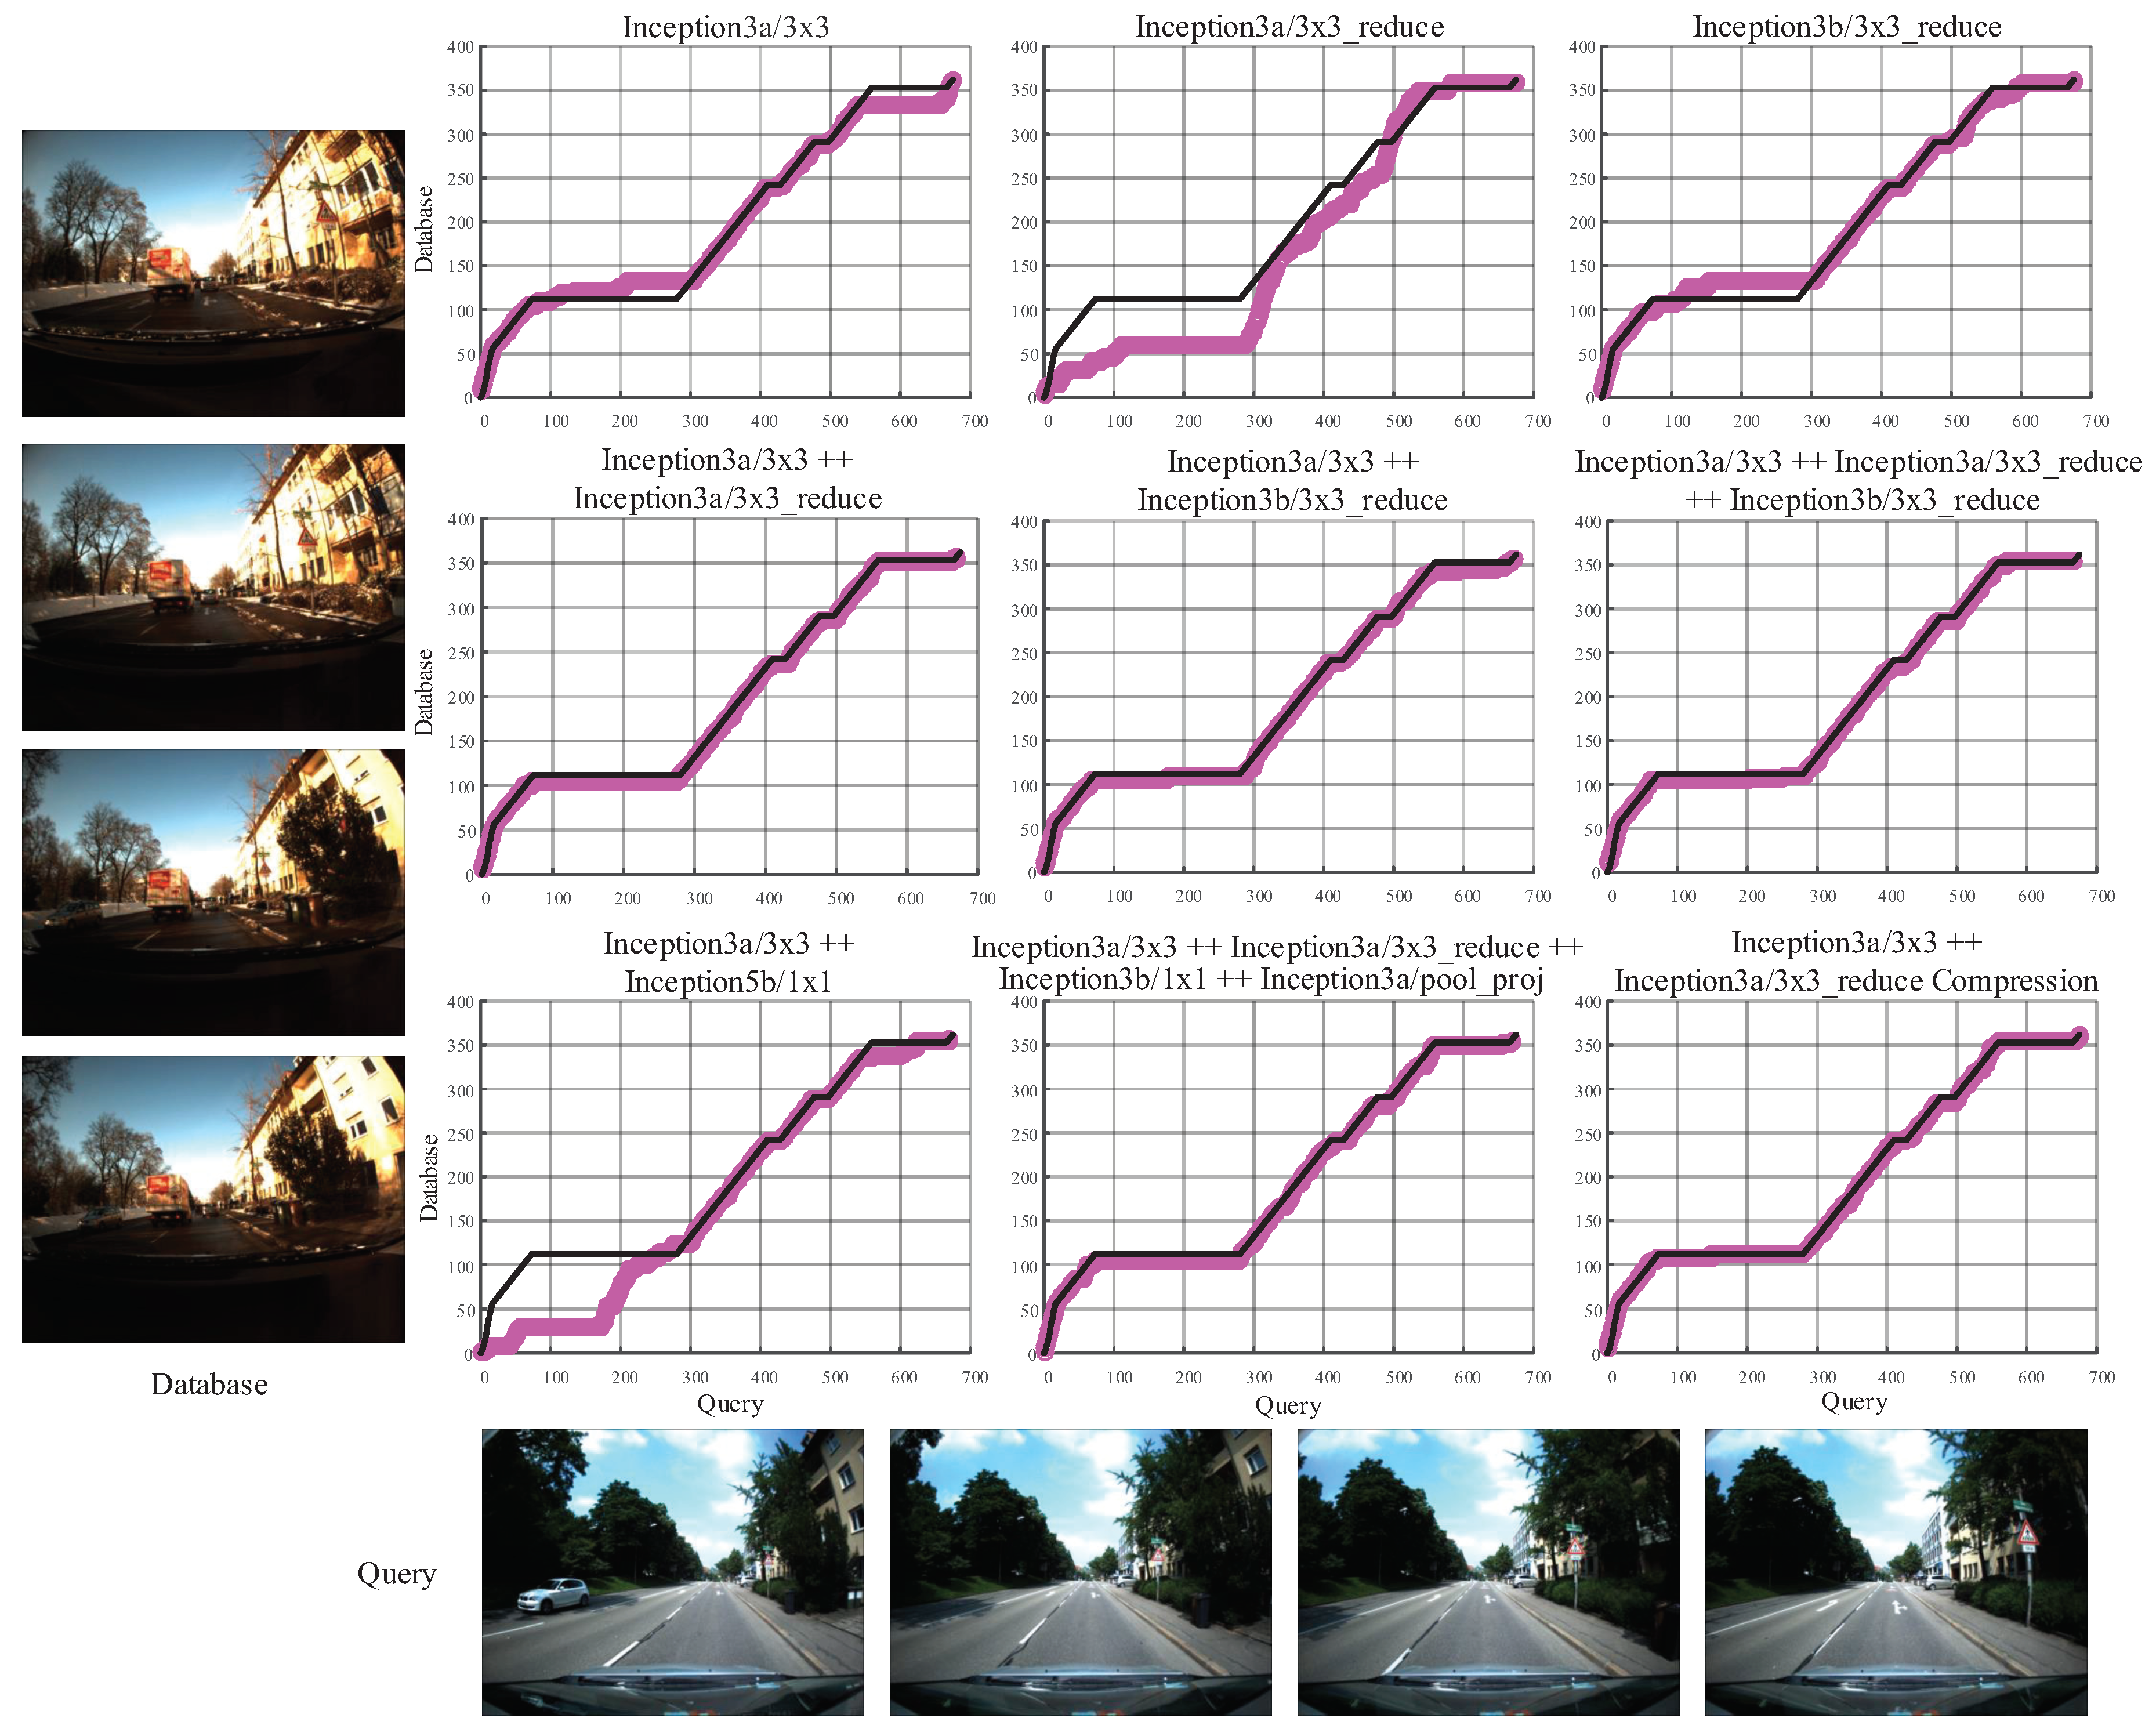
4.5. Concatenation and Compression
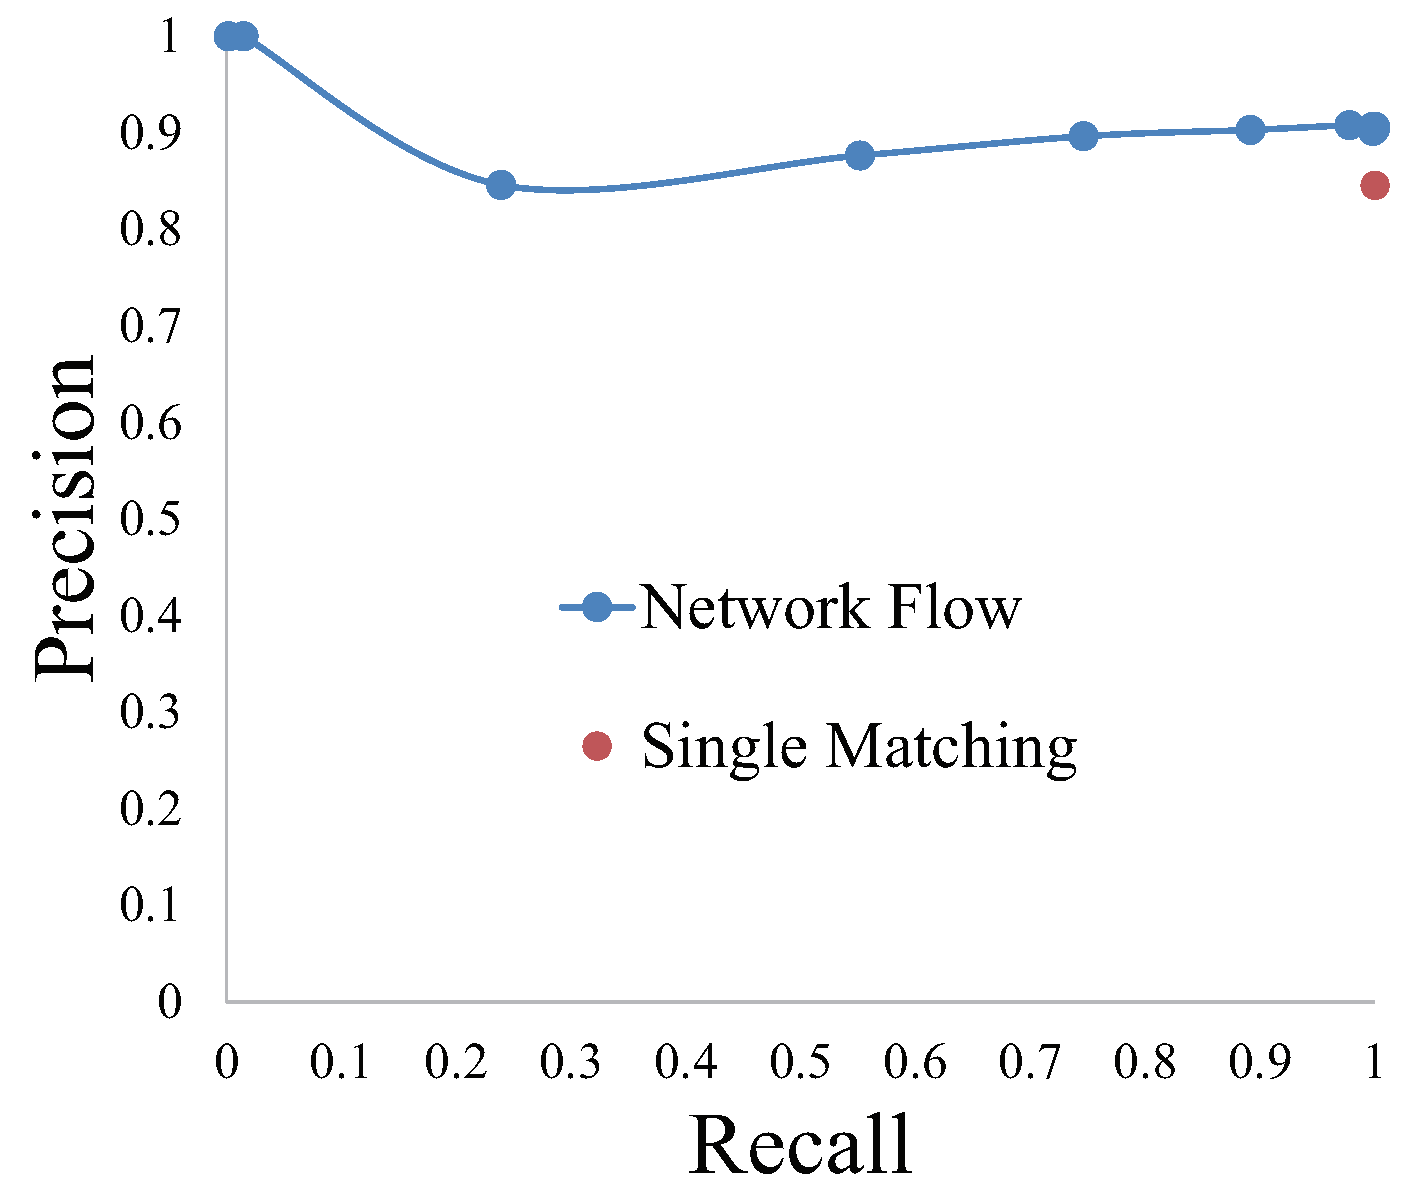
4.6. Parameter Tuning of Global Optimization
4.7. Real-World Experiments
5. Conclusions and Future Work
Supplementary Materials
Author Contributions
Funding
Conflicts of Interest
Abbreviations
| ABLE | Able for Binary-appearance Loop-closure Evaluation |
| BoW | Bag of Words |
| ConvNet | Convolutional Neural Network |
| FOV | Field Of View |
| GIS | Geographic Information System |
| GNSS | Global Navigation Satellite System |
| HOG | Histogram of Oriented Gradient |
| LDB | Local Difference Binary |
| MRoI | Multiple Regions of Interest |
| QR | Quick Response |
| RFID | Radio Frequency IDentification |
| SLAM | Simultaneous Localization And Mapping |
| SURF | Speeded Up Robust Features |
References
- Bourne, R.R.A.; Flaxman, S.R.; Braithwaite, T.; Cicinelli, M.V.; Das, A.; Jonas, J.B.; Keeffe, J.; Kempen, J.H.; Leasher, J.; Limburg, H.; et al. Magnitude, temporal trends, and projections of the global prevalence of blindness and distance and near vision impairment: a systematic review and meta-analysis. Lancet Glob. Health 2017, 5, e888–e897. [Google Scholar] [CrossRef]
- Brilhault, A.; Kammoun, S.; Gutierrez, O.; Truillet, P.; Jouffrais, C. Fusion of Artificial Vision and GPS to Improve Blind Pedestrian Positioning. In Proceedings of the 2011 4th IFIP International Conference on New Technologies, Mobility and Security, Paris, France, 7–10 February 2011; pp. 1–5. [Google Scholar]
- Lowry, S.; Sünderhauf, N.; Newman, P.; Leonard, J.J.; Cox, D.; Corke, P.; Milford, M.J. Visual Place Recognition: A Survey. IEEE Trans. Robot. 2016, 32, 1–19. [Google Scholar] [CrossRef]
- Pepperell, E.; Corke, P.I.; Milford, M.J. Automatic image scaling for place recognition in changing environments. In Proceedings of the 2015 IEEE International Conference on Robotics and Automation (ICRA), Seattle, WA, USA, 26–30 May 2015; pp. 1118–1124. [Google Scholar]
- Kanji, T. Cross-season place recognition using NBNN scene descriptor. In Proceedings of the 2015 IEEE/RSJ International Conference on Intelligent Robots and Systems (IROS), Hamburg, Germany, 28 September– 2 October 2015; pp. 729–735. [Google Scholar]
- Garg, S.; Suenderhauf, N.; Milford, M. LoST? Appearance-Invariant Place Recognition for Opposite Viewpoints Using Visual Semantics. arXiv, 2018; arXiv:1804.05526. [Google Scholar]
- Arroyo, R.; Alcantarilla, P.F.; Bergasa, L.M.; Romera, E. Are you ABLE to perform a life-long visual topological localization? Auton. Robots 2018, 42, 665–685. [Google Scholar] [CrossRef]
- Vysotska, O.; Stachniss, C. Relocalization under Substantial Appearance Changes Using Hashing. In Proceedings of the IROS Workshop on Planning, Perception and Navigation for Intelligent Vehicles, Vancouver, BC, Canada, 24 September 2017. [Google Scholar]
- Vysotska, O.; Naseer, T.; Spinello, L.; Burgard, W.; Stachniss, C. Efficient and effective matching of image sequences under substantial appearance changes exploiting GPS priors. In Proceedings of the 2015 IEEE International Conference on Robotics and Automation (ICRA), Seattle, WA, USA, 25–30 May 2015; Volume 2015, pp. 2774–2779. [Google Scholar]
- Kim, J.E.; Bessho, M.; Kobayashi, S.; Koshizuka, N.; Sakamura, K. Navigating visually impaired travelers in a large train station using smartphone and bluetooth low energy. In Proceedings of the 31st Annual ACM Symposium on Applied Computing (SAC ’16), Pisa, Italy, 4–8 April 2016; pp. 604–611. [Google Scholar]
- Tang, X.; Chen, Y.; Zhu, Z.; Lu, X. A visual aid system for the blind based on RFID and fast symbol recognition. In Proceedings of the 2011 6th International Conference on Pervasive Computing and Applications, Port Elizabeth, South Africa, 26–28 October 2011; pp. 184–188. [Google Scholar]
- Ivanov, R. An approach for developing indoor navigation systems for visually impaired people using Building Information Modeling. J. Ambient Intell. Smart Environ. 2017, 9, 449–467. [Google Scholar] [CrossRef]
- Al-Khalifa, S.; Al-Razgan, M. Ebsar: Indoor guidance for the visually impaired. Comput. Electr. Eng. 2016, 54, 26–39. [Google Scholar] [CrossRef]
- Li, B.; Muñoz, J.P.; Rong, X.; Xiao, J.; Tian, Y.; Arditi, A. ISANA: Wearable Context-Aware Indoor Assistive Navigation with Obstacle Avoidance for the Blind. In Lecture Notes in Computer Science, ECCV Workshop; Hua, G., Jégou, H., Eds.; Springer International Publishing: Cham, Switzerland, 2016; Volume 9914, pp. 448–462. [Google Scholar]
- Murata, M.; Ahmetovic, D.; Sato, D.; Takagi, H.; Kitani, K.M.; Asakawa, C. Smartphone-based Indoor Localization for Blind Navigation across Building Complexes. In Proceedings of the IEEE International Conference on Pervasive Computing and Communications (PerCom), Athens, Greece, 19–23 March 2018. [Google Scholar]
- Mekhalfi, M.L.; Melgani, F.; Bazi, Y.; Alajlan, N. A Compressive Sensing Approach to Describe Indoor Scenes for Blind People. IEEE Trans. Circuits Syst. Video Technol. 2015, 25, 1246–1257. [Google Scholar] [CrossRef]
- Nguyen, Q.H.; Tran, T.H. Scene description for visually impaired in outdoor environment. In Proceedings of the 2013 International Conference on Advanced Technologies for Communications (ATC 2013), Ho Chi Minh City, Vietnam, 16–18 October 2013; pp. 398–403. [Google Scholar]
- Fusco, G.; Shen, H.; Coughlan, J.M. Self-Localization at Street Intersections. In Proceedings of the 2014 Canadian Conference on Computer and Robot Vision, Montreal, QC, Canada, 6–9 May 2014; pp. 40–47. [Google Scholar]
- Cadena, C.; Carlone, L.; Carrillo, H.; Latif, Y.; Scaramuzza, D.; Neira, J.; Reid, I.D.; Leonard, J.J. Simultaneous Localization and Mapping: Present, Future, and the Robust-Perception Age. IEEE Trans. Robot. 2016, 32, 1309–1332. [Google Scholar] [CrossRef]
- Mur-Artal, R.; Tardos, J.D. ORB-SLAM2: An Open-Source SLAM System for Monocular, Stereo, and RGB-D Cameras. IEEE Trans. Robot. 2017, 33, 1255–1262. [Google Scholar] [CrossRef]
- Galvez-López, D.; Tardos, J.D. Bags of Binary Words for Fast Place Recognition in Image Sequences. IEEE Trans. Robot. 2012, 28, 1188–1197. [Google Scholar] [CrossRef]
- Arroyo, R.; Alcantarilla, P.F.; Bergasa, L.M.; Romera, E. OpenABLE: An open-source toolbox for application in life-long visual localization of autonomous vehicles. In Proceedings of the 2016 IEEE 19th International Conference on Intelligent Transportation Systems (ITSC), Rio de Janeiro, Brazil, 1–4 November 2016; pp. 965–970. [Google Scholar]
- Naseer, T.; Spinello, L.; Burgard, W.; Stachniss, C. Robust Visual Robot Localization Across Seasons Using Network Flows. In Proceedings of the Twenty-Eighth AAAI Conference on Artificial Intelligence (AAAI’14), Quebec City, QC, Canada, 27–31 July 2014; pp. 2564–2570. [Google Scholar]
- Kameda, Y.; Ohta, Y. Image Retrieval of First-Person Vision for Pedestrian Navigation in Urban Area. In Proceedings of the 2010 20th International Conference on Pattern Recognition, Istanbul, Turkey, 23–26 August 2010; pp. 364–367. [Google Scholar]
- Krizhevsky, A.; Sutskever, I.; Hinton, G.E. ImageNet Classification with Deep Convolutional Neural Networks. In Advances in Neural Information Processing Systems 25; Pereira, F., Burges, C.J.C., Bottou, L., Weinberger, K.Q., Eds.; Curran Associates, Inc.: Red Hook, NY, USA, 2012; pp. 1097–1105. [Google Scholar]
- Simonyan, K.; Zisserman, A. Very Deep Convolutional Networks for Large-Scale Image Recognition. arXiv, 2014; arXiv:1409.1556v6. [Google Scholar]
- Szegedy, C.; Liu, W.; Jia, Y.; Sermanet, P.; Reed, S.; Anguelov, D.; Erhan, D.; Vanhoucke, V.; Rabinovich, A. Going deeper with convolutions. In Proceedings of the IEEE Computer Society Conference on Computer Vision and Pattern Recognition, Boston, MA, USA, 7–12 June 2015; pp. 1–9. [Google Scholar]
- He, K.; Zhang, X.; Ren, S.; Sun, J. Deep Residual Learning for Image Recognition. In Proceedings of the 2016 IEEE Conference on Computer Vision and Pattern Recognition (CVPR), Las Vegas, NV, USA, 26 June–1 July 2016; pp. 770–778. [Google Scholar]
- Iandola, F.N.; Moskewicz, M.W.; Ashraf, K.; Han, S.; Dally, W.J.; Keutzer, K. SqueezeNet: AlexNet-level accuracy with 50x fewer parameters and <0.5MB model size. arXiv, 2016; arXiv:1602.07360. [Google Scholar]
- Howard, A.G.; Zhu, M.; Chen, B.; Kalenichenko, D.; Wang, W.; Weyand, T.; Andreetto, M.; Adam, H. MobileNets: Efficient Convolutional Neural Networks for Mobile Vision Applications. arXiv, 2017; arXiv:1704.04861. [Google Scholar]
- Zhang, X.; Zhou, X.; Lin, M.; Sun, J. ShuffleNet: An Extremely Efficient Convolutional Neural Network for Mobile Devices. arXiv, 2017; arXiv:1707.01083. [Google Scholar]
- Sünderhauf, N.; Shirazi, S.; Dayoub, F.; Upcroft, B.; Milford, M. On the performance of ConvNet features for place recognition. In Proceedings of the IEEE International Conference on Intelligent Robots and Systems, Hamburg, Germany, 28 September–2 October 2015; pp. 4297–4304. [Google Scholar]
- Chen, Z.; Lam, O.; Jacobson, A.; Milford, M. Convolutional Neural Network-Based Place Recognition. arXiv, 2014; arXiv:1411.1509. [Google Scholar]
- Suenderhauf, N.; Shirazi, S.; Jacobson, A.; Dayoub, F.; Pepperell, E.; Upcroft, B.; Milford, M. Place Recognition with ConvNet Landmarks: Viewpoint-Robust, Condition-Robust, Training-Free. In Proceedings of the Robotics Science Systems XI, Rome, Italy, 13–17 July 2015. [Google Scholar]
- Zitnick, C.L.; Doll, P. Edge Boxes:Locating Object Proposals from Edges. In Proceedings of the European Conference on Computer Vision, Zurich, Switzerland, 6–12 September 2014; pp. 391–405. [Google Scholar]
- Hou, Y.; Zhang, H.; Zhou, S.; Zou, H. Efficient ConvNet Feature Extraction with Multiple RoI Pooling for Landmark-Based Visual Localization of Autonomous Vehicles. Mob. Inf. Syst. 2017, 2017, 8104386. [Google Scholar] [CrossRef]
- Kendall, A.; Grimes, M.; Cipolla, R. PoseNet: A Convolutional Network for Real-Time 6-DOF Camera Relocalization. In Proceedings of the 2015 IEEE International Conference on Computer Vision (ICCV), Santiago, Chile, 7–13 December 2015; pp. 2938–2946. [Google Scholar]
- Arandjelovic, R.; Gronat, P.; Torii, A.; Pajdla, T.; Sivic, J. NetVLAD: CNN Architecture for Weakly Supervised Place Recognition. In Proceedings of the 2016 IEEE Conference on Computer Vision and Pattern Recognition (CVPR), Las Vegas, NV, USA, 27–30 June 2016; pp. 5297–5307. [Google Scholar]
- Dzulfahmi; Ohta, N. Performance Evaluation of Image Feature Detectors and Descriptors for Outdoor-Scene Visual Navigation. In Proceedings of the 2013 2nd IAPR Asian Conference on Pattern Recognition, Naha, Japan, 5–8 November 2013; pp. 872–876. [Google Scholar]
- Milford, M.J.; Wyeth, G.F. SeqSLAM: Visual route-based navigation for sunny summer days and stormy winter nights. In Proceedings of the 2012 IEEE International Conference on Robotics and Automation, Saint Paul, MN, USA, 14–18 May 2012; pp. 1643–1649. [Google Scholar]
- Russakovsky, O.; Deng, J.; Su, H.; Krause, J.; Satheesh, S.; Ma, S.; Huang, Z.; Karpathy, A.; Khosla, A.; Bernstein, M.; et al. ImageNet Large Scale Visual Recognition Challenge. Int. J. Comput. Vis. 2015, 115, 211–252. [Google Scholar] [CrossRef]
- Zhou, B.; Lapedriza, A.; Khosla, A.; Oliva, A.; Torralba, A. Places: A 10 million Image Database for Scene Recognition. IEEE Trans. Pattern Anal. Mach. Intell. 2017, 40, 1452–1464. [Google Scholar] [CrossRef] [PubMed]
- Sandler, M.; Howard, A.; Zhu, M.; Zhmoginov, A.; Chen, L.C. Inverted Residuals and Linear Bottlenecks: Mobile Networks for Classification, Detection and Segmentation. arXiv, 2018; arXiv:1801.04381. [Google Scholar]
- Goldberg, A.V.; Tarjan, R.E. Finding Minimum-Cost Circulations by Successive Approximation. Math. Oper. Res. 1990, 15, 430–466. [Google Scholar] [CrossRef]
- Google Optimization Tools. Available online: https://developers.google.com/optimization/ (accessed on 14 May 2018).
- Neubert, P.; Sünderhauf, N.; Protzel, P. Superpixel-based appearance change prediction for long-term navigation across seasons. Robot. Auton. Syst. 2015, 69, 15–27. [Google Scholar] [CrossRef]
- Arroyo, R.; Alcantarilla, P.F.; Bergasa, L.M.; Romera, E. Fusion and binarization of CNN features for robust topological localization across seasons. In Proceedings of the IEEE International Conference on Intelligent Robots and Systems, Daejeon, Korea, 9–14 October 2016; Volume 2016, pp. 4656–4663. [Google Scholar]
- Chicco, D. Ten quick tips for machine learning in computational biology. BioData Min. 2017, 10, 35. [Google Scholar] [CrossRef] [PubMed]
- KrVision. Intoer: Auxiliary Glasses for People with Visual Impairments. 2017. Available online: http://www.krvision.cn (accessed on 28 July 2018). (In Chinese).
- Intel. RealSense Camera ZR300. 2017. Available online: https://www.intel.com (accessed on 28 July 2018).
- AfterShokz. Bone-Conduction Earphone. 2018. Available online: https://aftershokz.co.uk (accessed on 28 July 2018).
- Yang, K.; Wang, K.; Hu, W.; Bai, J. Expanding the Detection of Traversable Area with RealSense for the Visually Impaired. Sensors 2016, 16, 1954. [Google Scholar] [CrossRef] [PubMed]
- Yang, K.; Wang, K.; Cheng, R.; Hu, W.; Huang, X.; Bai, J. Detecting Traversable Area and Water Hazards for the Visually Impaired with a pRGB-D Sensor. Sensors 2017, 17, 1890. [Google Scholar] [CrossRef] [PubMed]
- Yang, K.; Wang, K.; Bergasa, L.M.; Romera, E.; Hu, W.; Sun, D.; Sun, J.; Cheng, R.; Chen, T.; López, E. Unifying Terrain Awareness for the Visually Impaired through Real-Time Semantic Segmentation. Sensors 2018, 18, 1506. [Google Scholar] [CrossRef] [PubMed]
- Cheng, R.; Wang, K.; Yang, K.; Long, N.; Hu, W.; Chen, H.; Bai, J.; Liu, D. Crosswalk navigation for people with visual impairments on a wearable device. J. Electron. Imaging 2017, 26, 053025. [Google Scholar] [CrossRef]
- Cheng, R.; Wang, K.; Yang, K.; Long, N.; Bai, J.; Liu, D. Real-time pedestrian crossing lights detection algorithm for the visually impaired. Multimedia Tools Appl. 2017, 1–21, 1–21. [Google Scholar] [CrossRef]


| Model | ImageNet | Million | Million | Viewpoint | Illumination | Cross-Season |
|---|---|---|---|---|---|---|
| Accuracy | Multi-Adds | Parameters | Invariant | Invariant | Invariant | |
| AlexNet | 57.2% | 720 | 60 | Good | Good | Good |
| VGG16 | 71.5% | 15,300 | 138 | Normal | Normal | Bad |
| GoogLeNet | 69.8% | 1550 | 6.8 | Best | Best | Best |
| SqueezeNet | 57.5% | 1700 | 1.25 | Normal | Good | Normal |
| MobileNet | 70.6% | 569 | 4.2 | Normal | Bad | Bad |
| Size in Bytes | F1-Score | Percentage of Compression | Percentage of Speedup for Calculating Cosine Distance |
|---|---|---|---|
| 175,616 | 0.8406 | 0% | 0% |
| 131,072 | 0.8304 | 25.36% | 25.75% |
| 65,536 | 0.8372 | 62.68% | 36.36% |
| 32,768 | 0.8338 | 81.34% | 80.31% |
| 16,384 | 0.8095 | 90.67% | 89.39% |
| 8192 | 0.8131 | 95.34% | 93.94% |
| 4096 | 0.7889 | 97.67% | 96.97% |
| Parameter | Denotation |
|---|---|
| f | quantity of flow |
| number of children nodes | |
| c | cost of edges pointing to hidden nodes |
| Visual Localizer | GNSS-Based | |
|---|---|---|
| Mean Error | 7.95 | 24.09 |
| Precision | 89.66% | 39.22% |
| Matched Number | 58 | 255 |
© 2018 by the authors. Licensee MDPI, Basel, Switzerland. This article is an open access article distributed under the terms and conditions of the Creative Commons Attribution (CC BY) license (http://creativecommons.org/licenses/by/4.0/).
Share and Cite
Lin, S.; Cheng, R.; Wang, K.; Yang, K. Visual Localizer: Outdoor Localization Based on ConvNet Descriptor and Global Optimization for Visually Impaired Pedestrians. Sensors 2018, 18, 2476. https://doi.org/10.3390/s18082476
Lin S, Cheng R, Wang K, Yang K. Visual Localizer: Outdoor Localization Based on ConvNet Descriptor and Global Optimization for Visually Impaired Pedestrians. Sensors. 2018; 18(8):2476. https://doi.org/10.3390/s18082476
Chicago/Turabian StyleLin, Shufei, Ruiqi Cheng, Kaiwei Wang, and Kailun Yang. 2018. "Visual Localizer: Outdoor Localization Based on ConvNet Descriptor and Global Optimization for Visually Impaired Pedestrians" Sensors 18, no. 8: 2476. https://doi.org/10.3390/s18082476
APA StyleLin, S., Cheng, R., Wang, K., & Yang, K. (2018). Visual Localizer: Outdoor Localization Based on ConvNet Descriptor and Global Optimization for Visually Impaired Pedestrians. Sensors, 18(8), 2476. https://doi.org/10.3390/s18082476