Alignment Method for Linear-Scale Projection Lithography Based on CCD Image Analysis

Abstract
:1. Introduction
2. Method
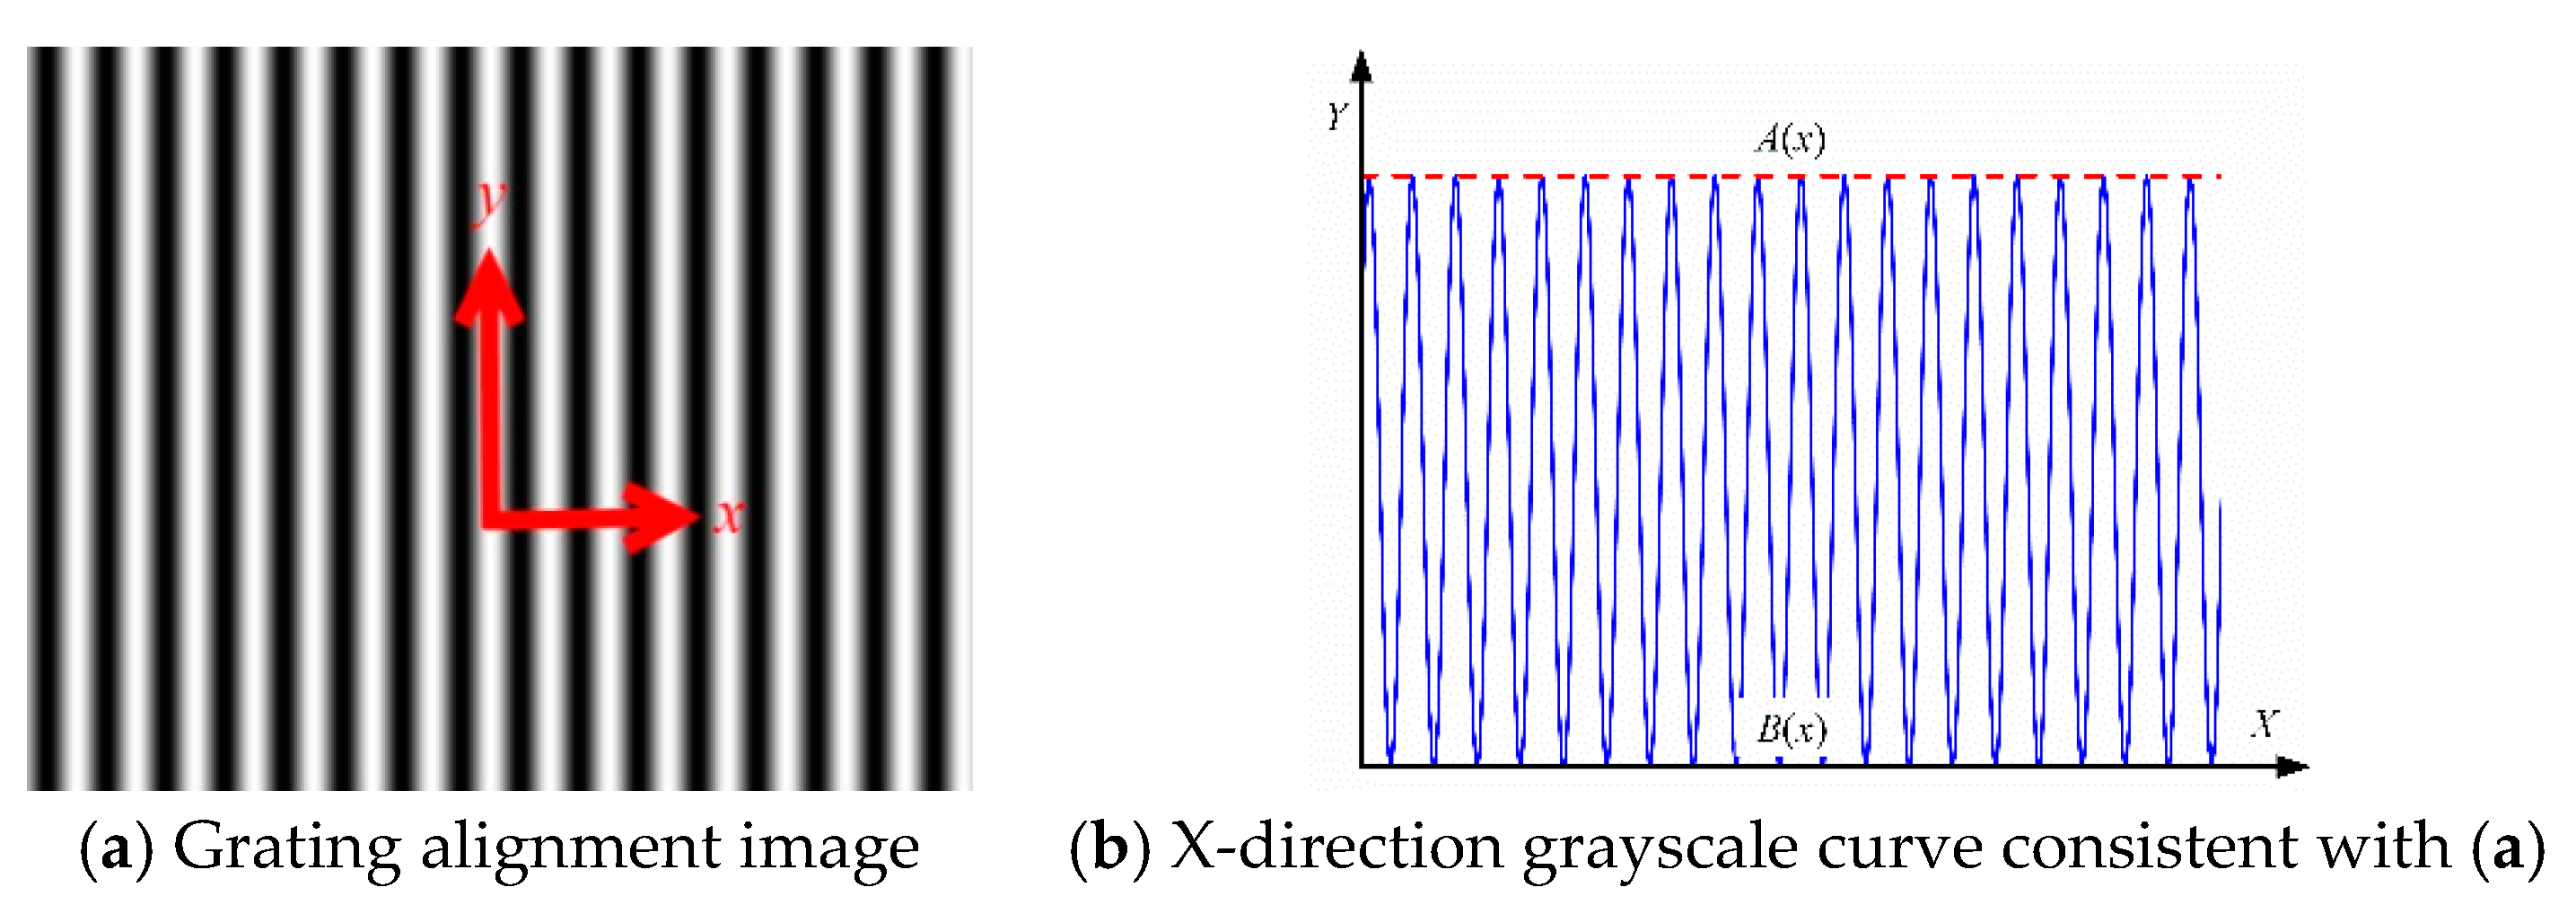
2.1. Principle of Accuracy Alignment
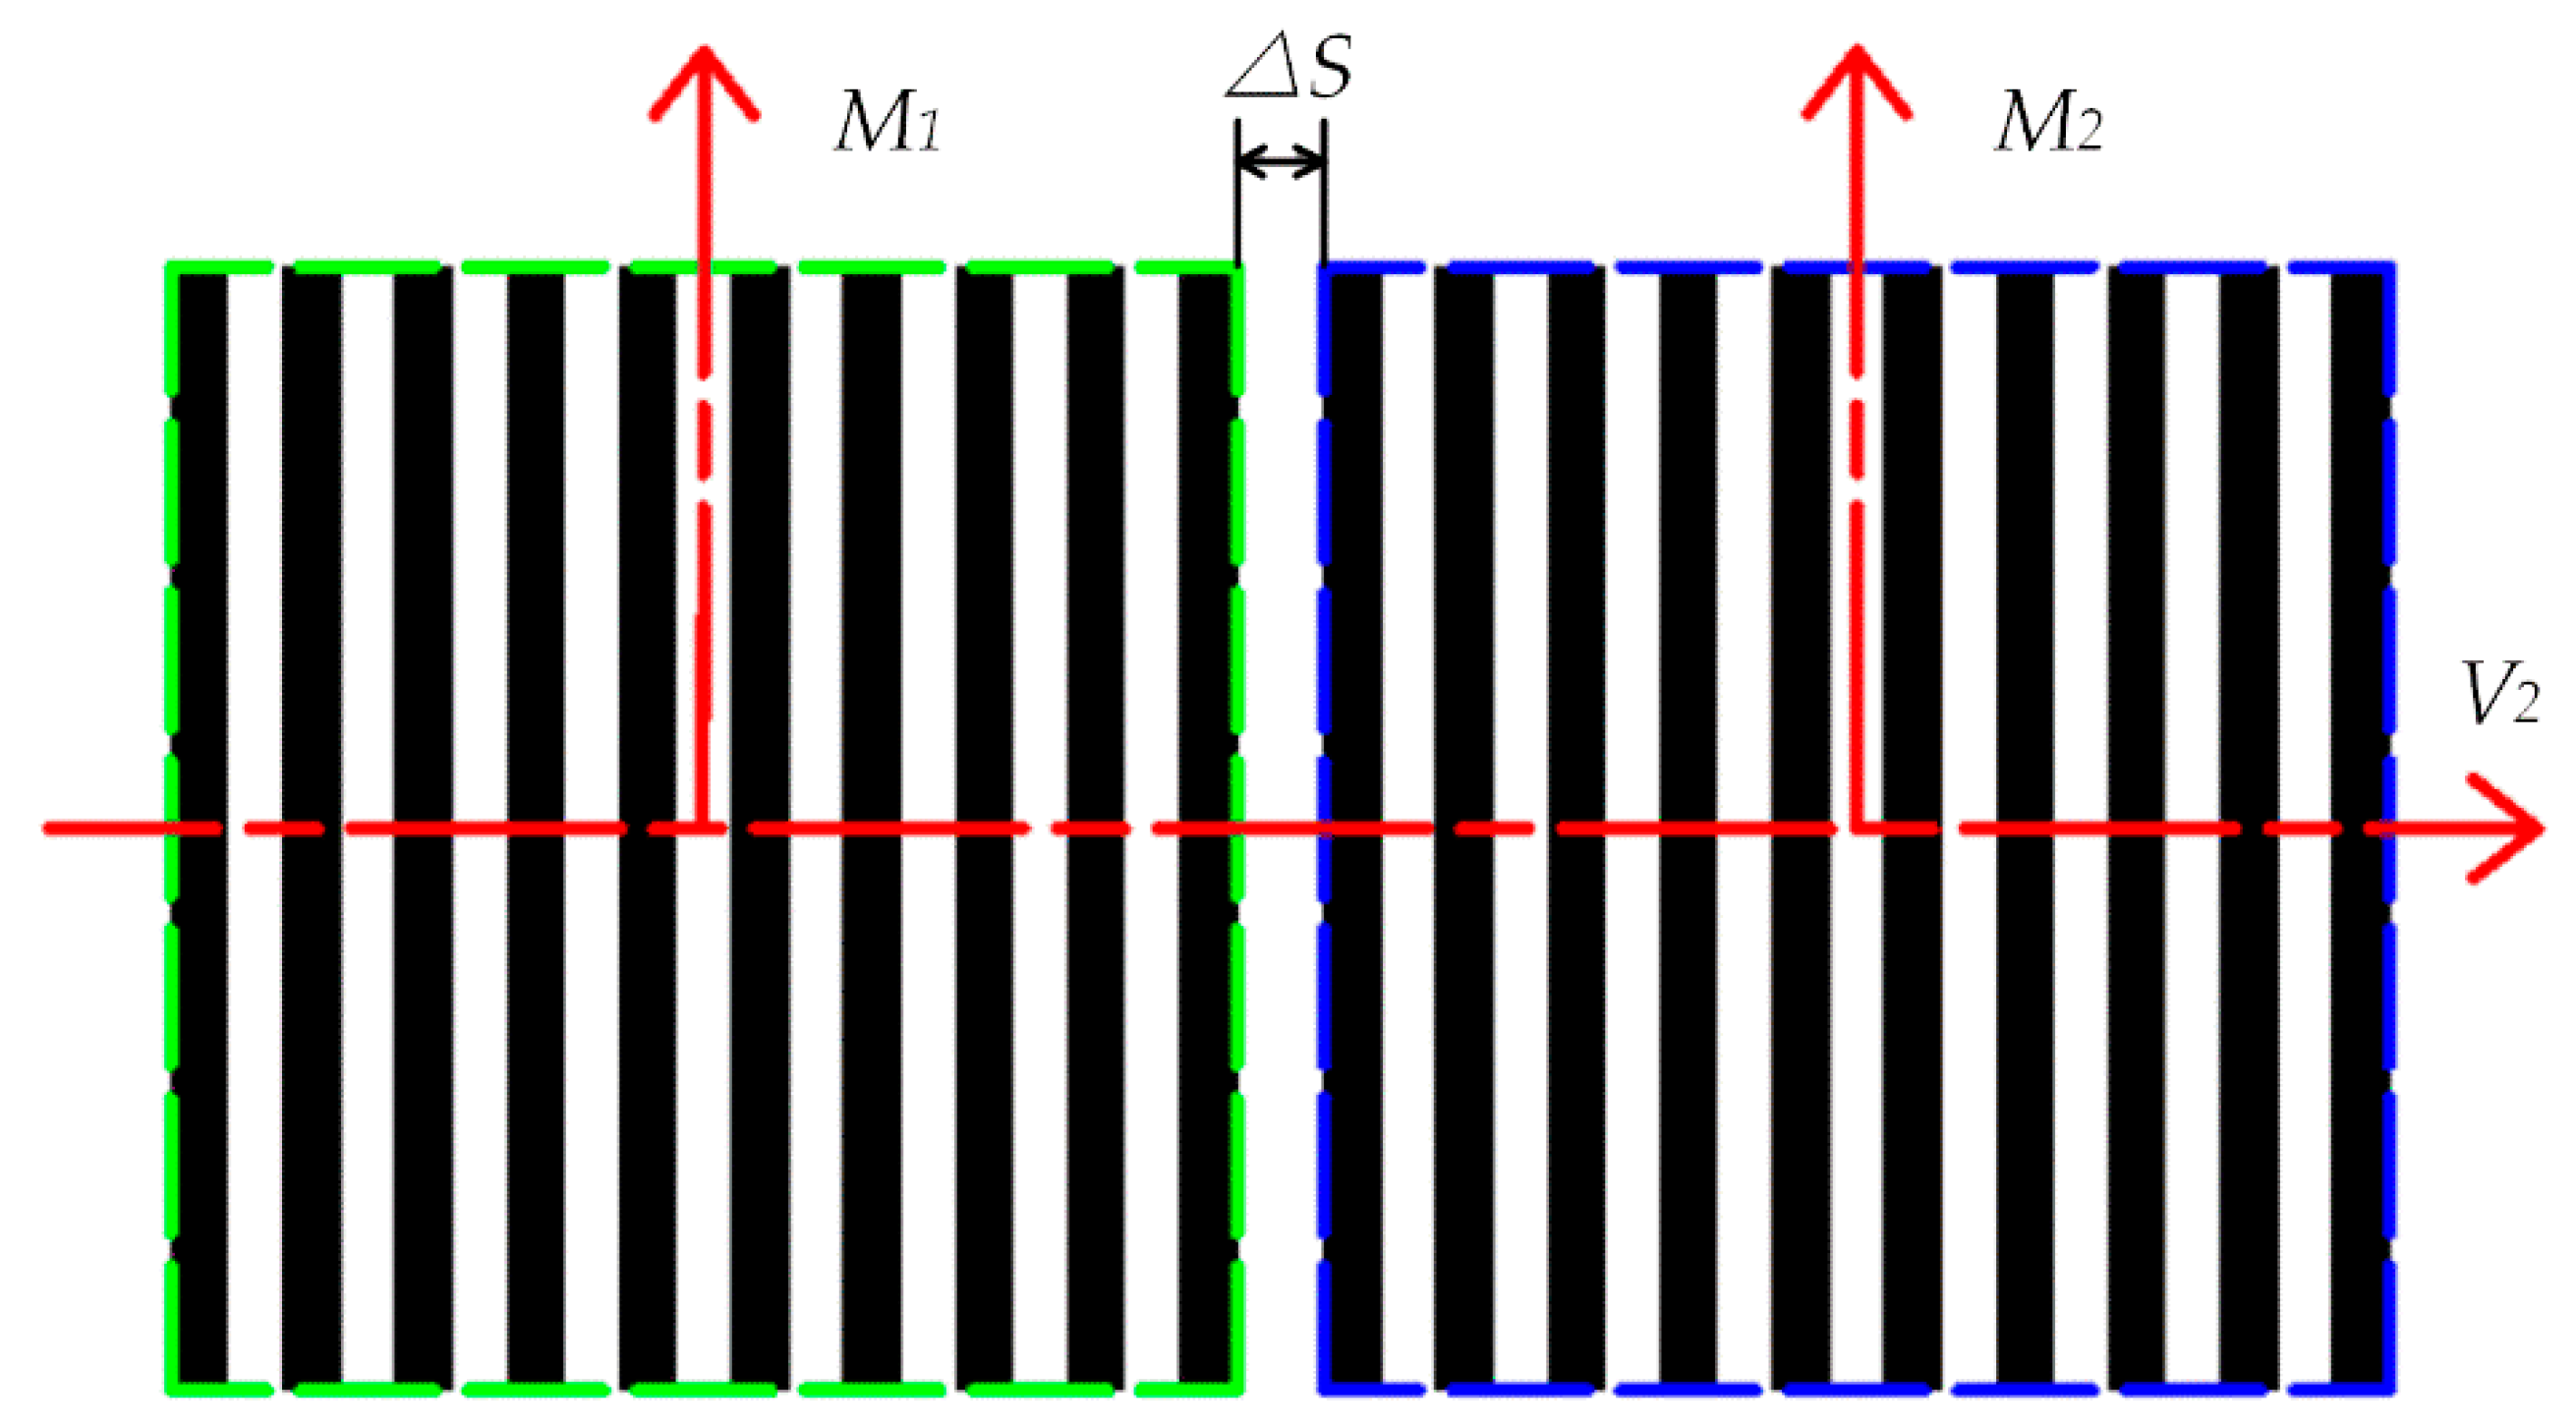
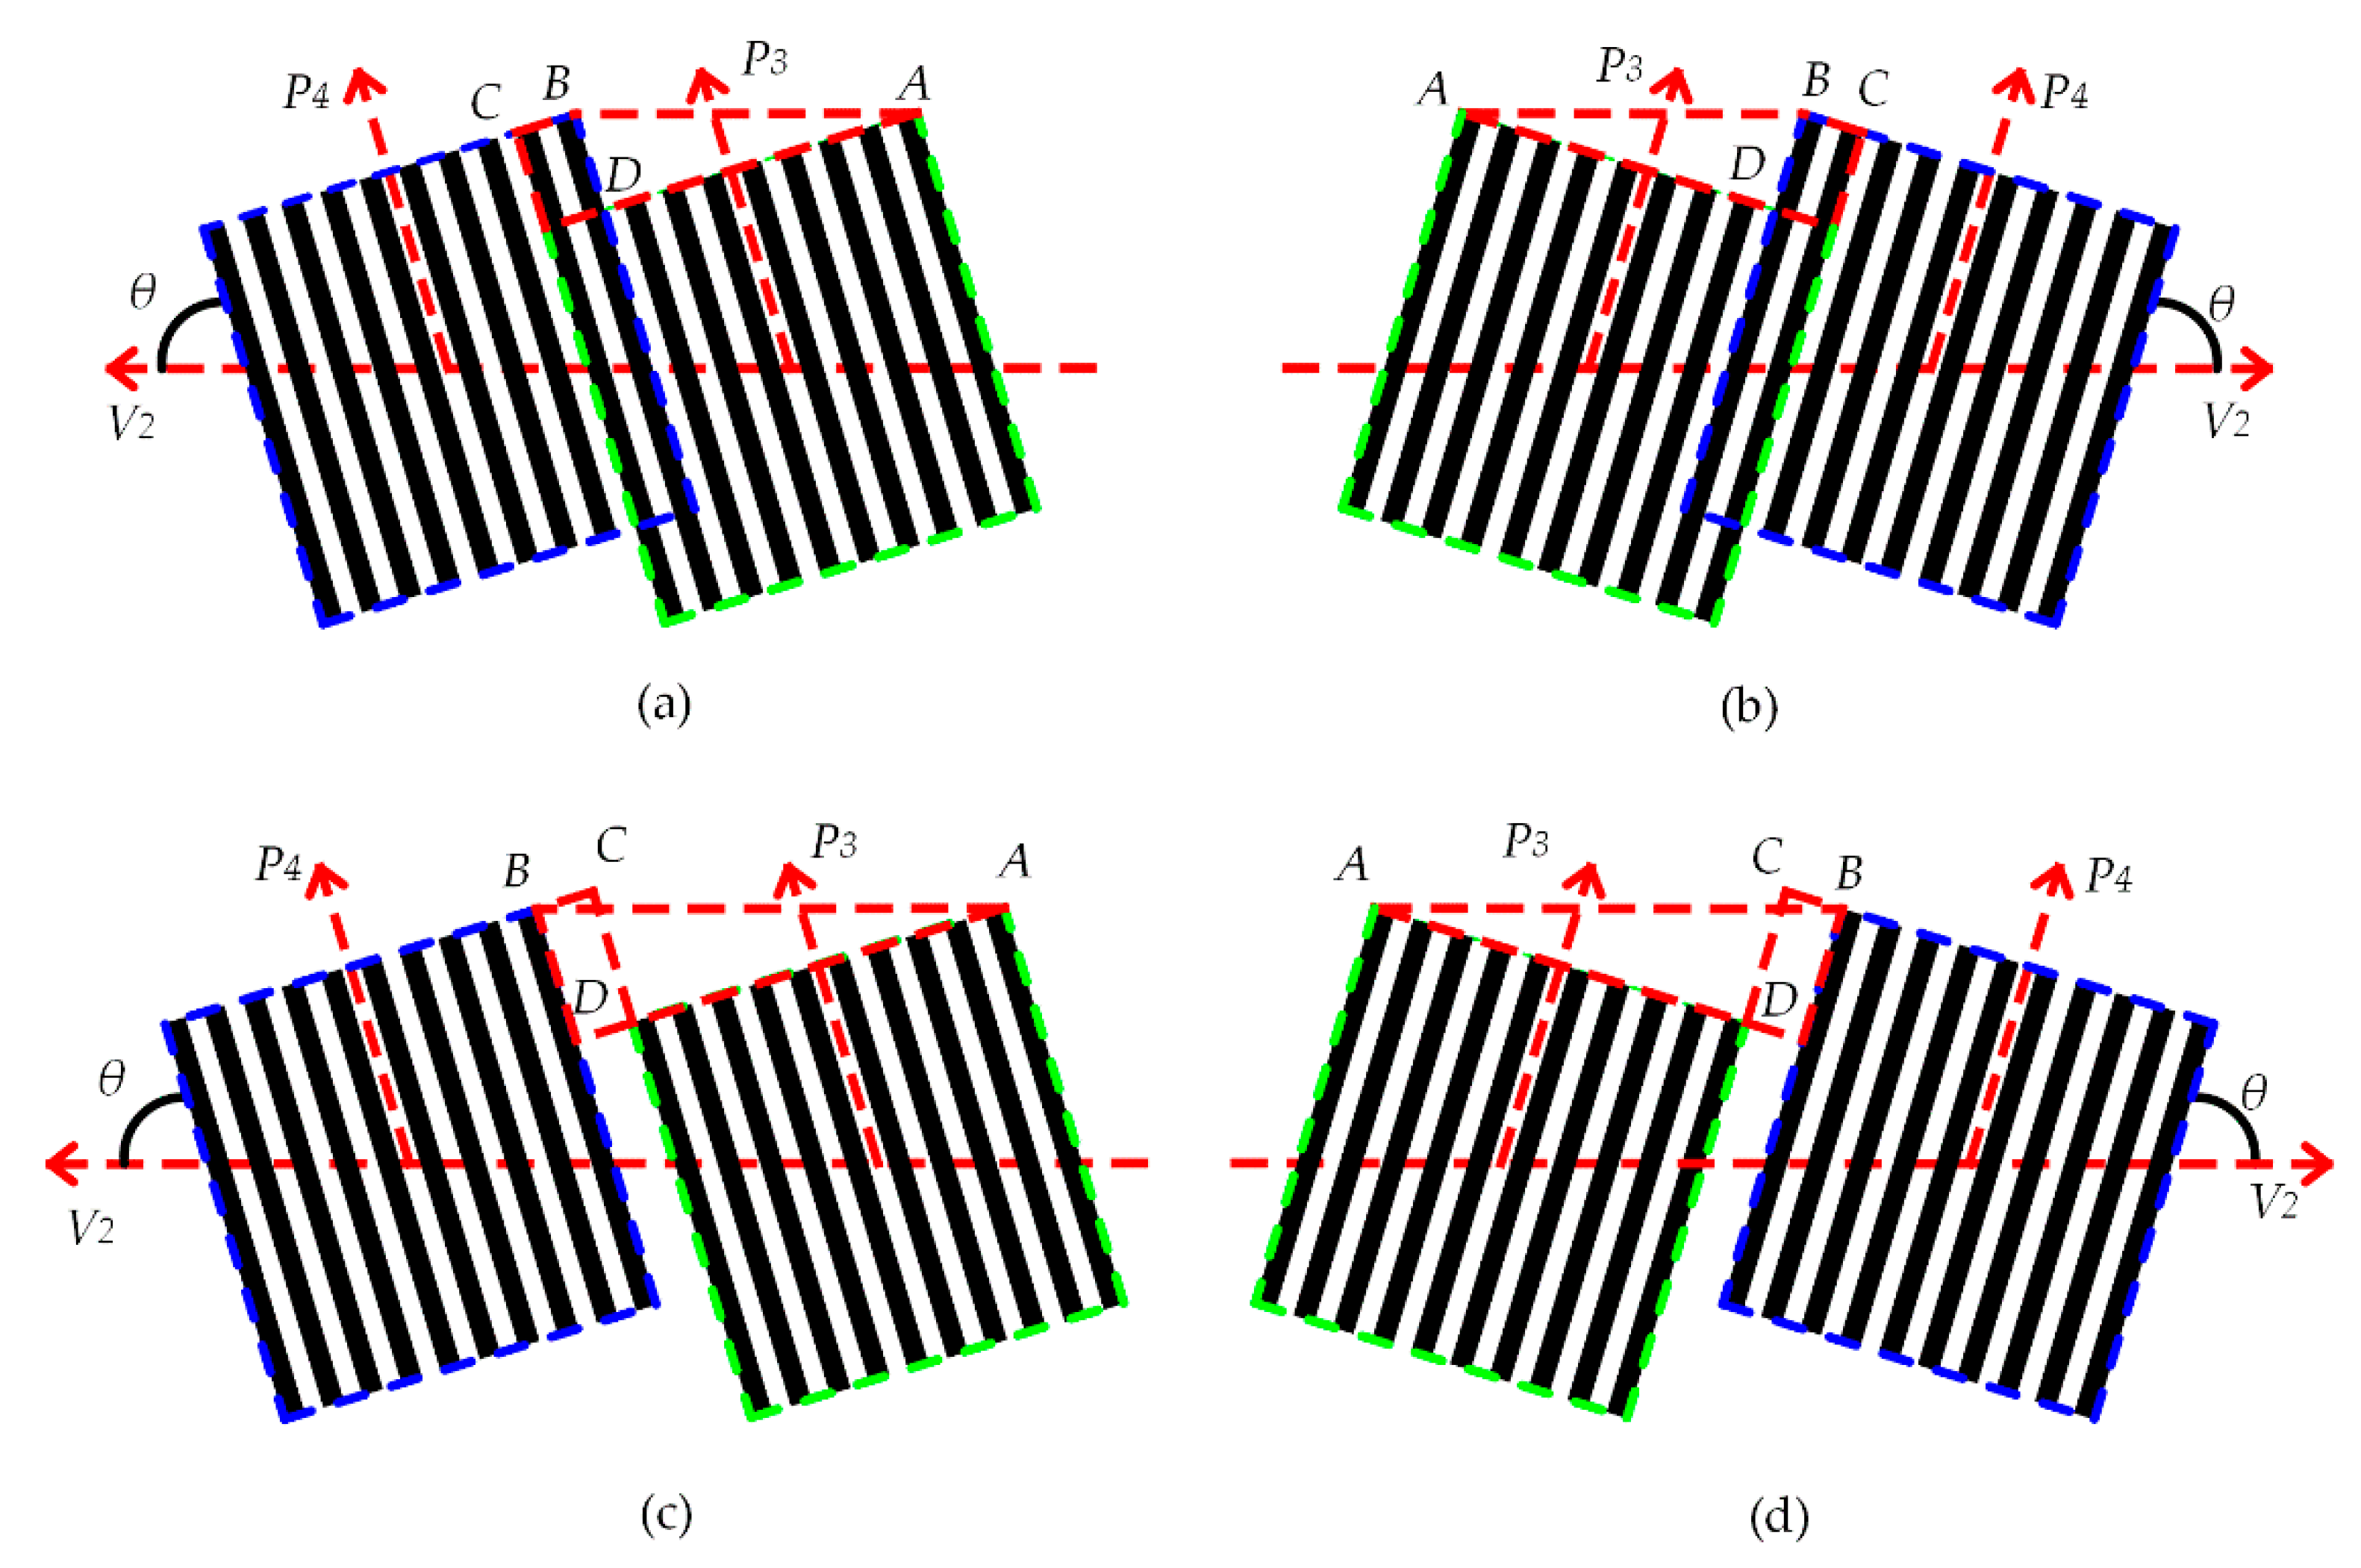
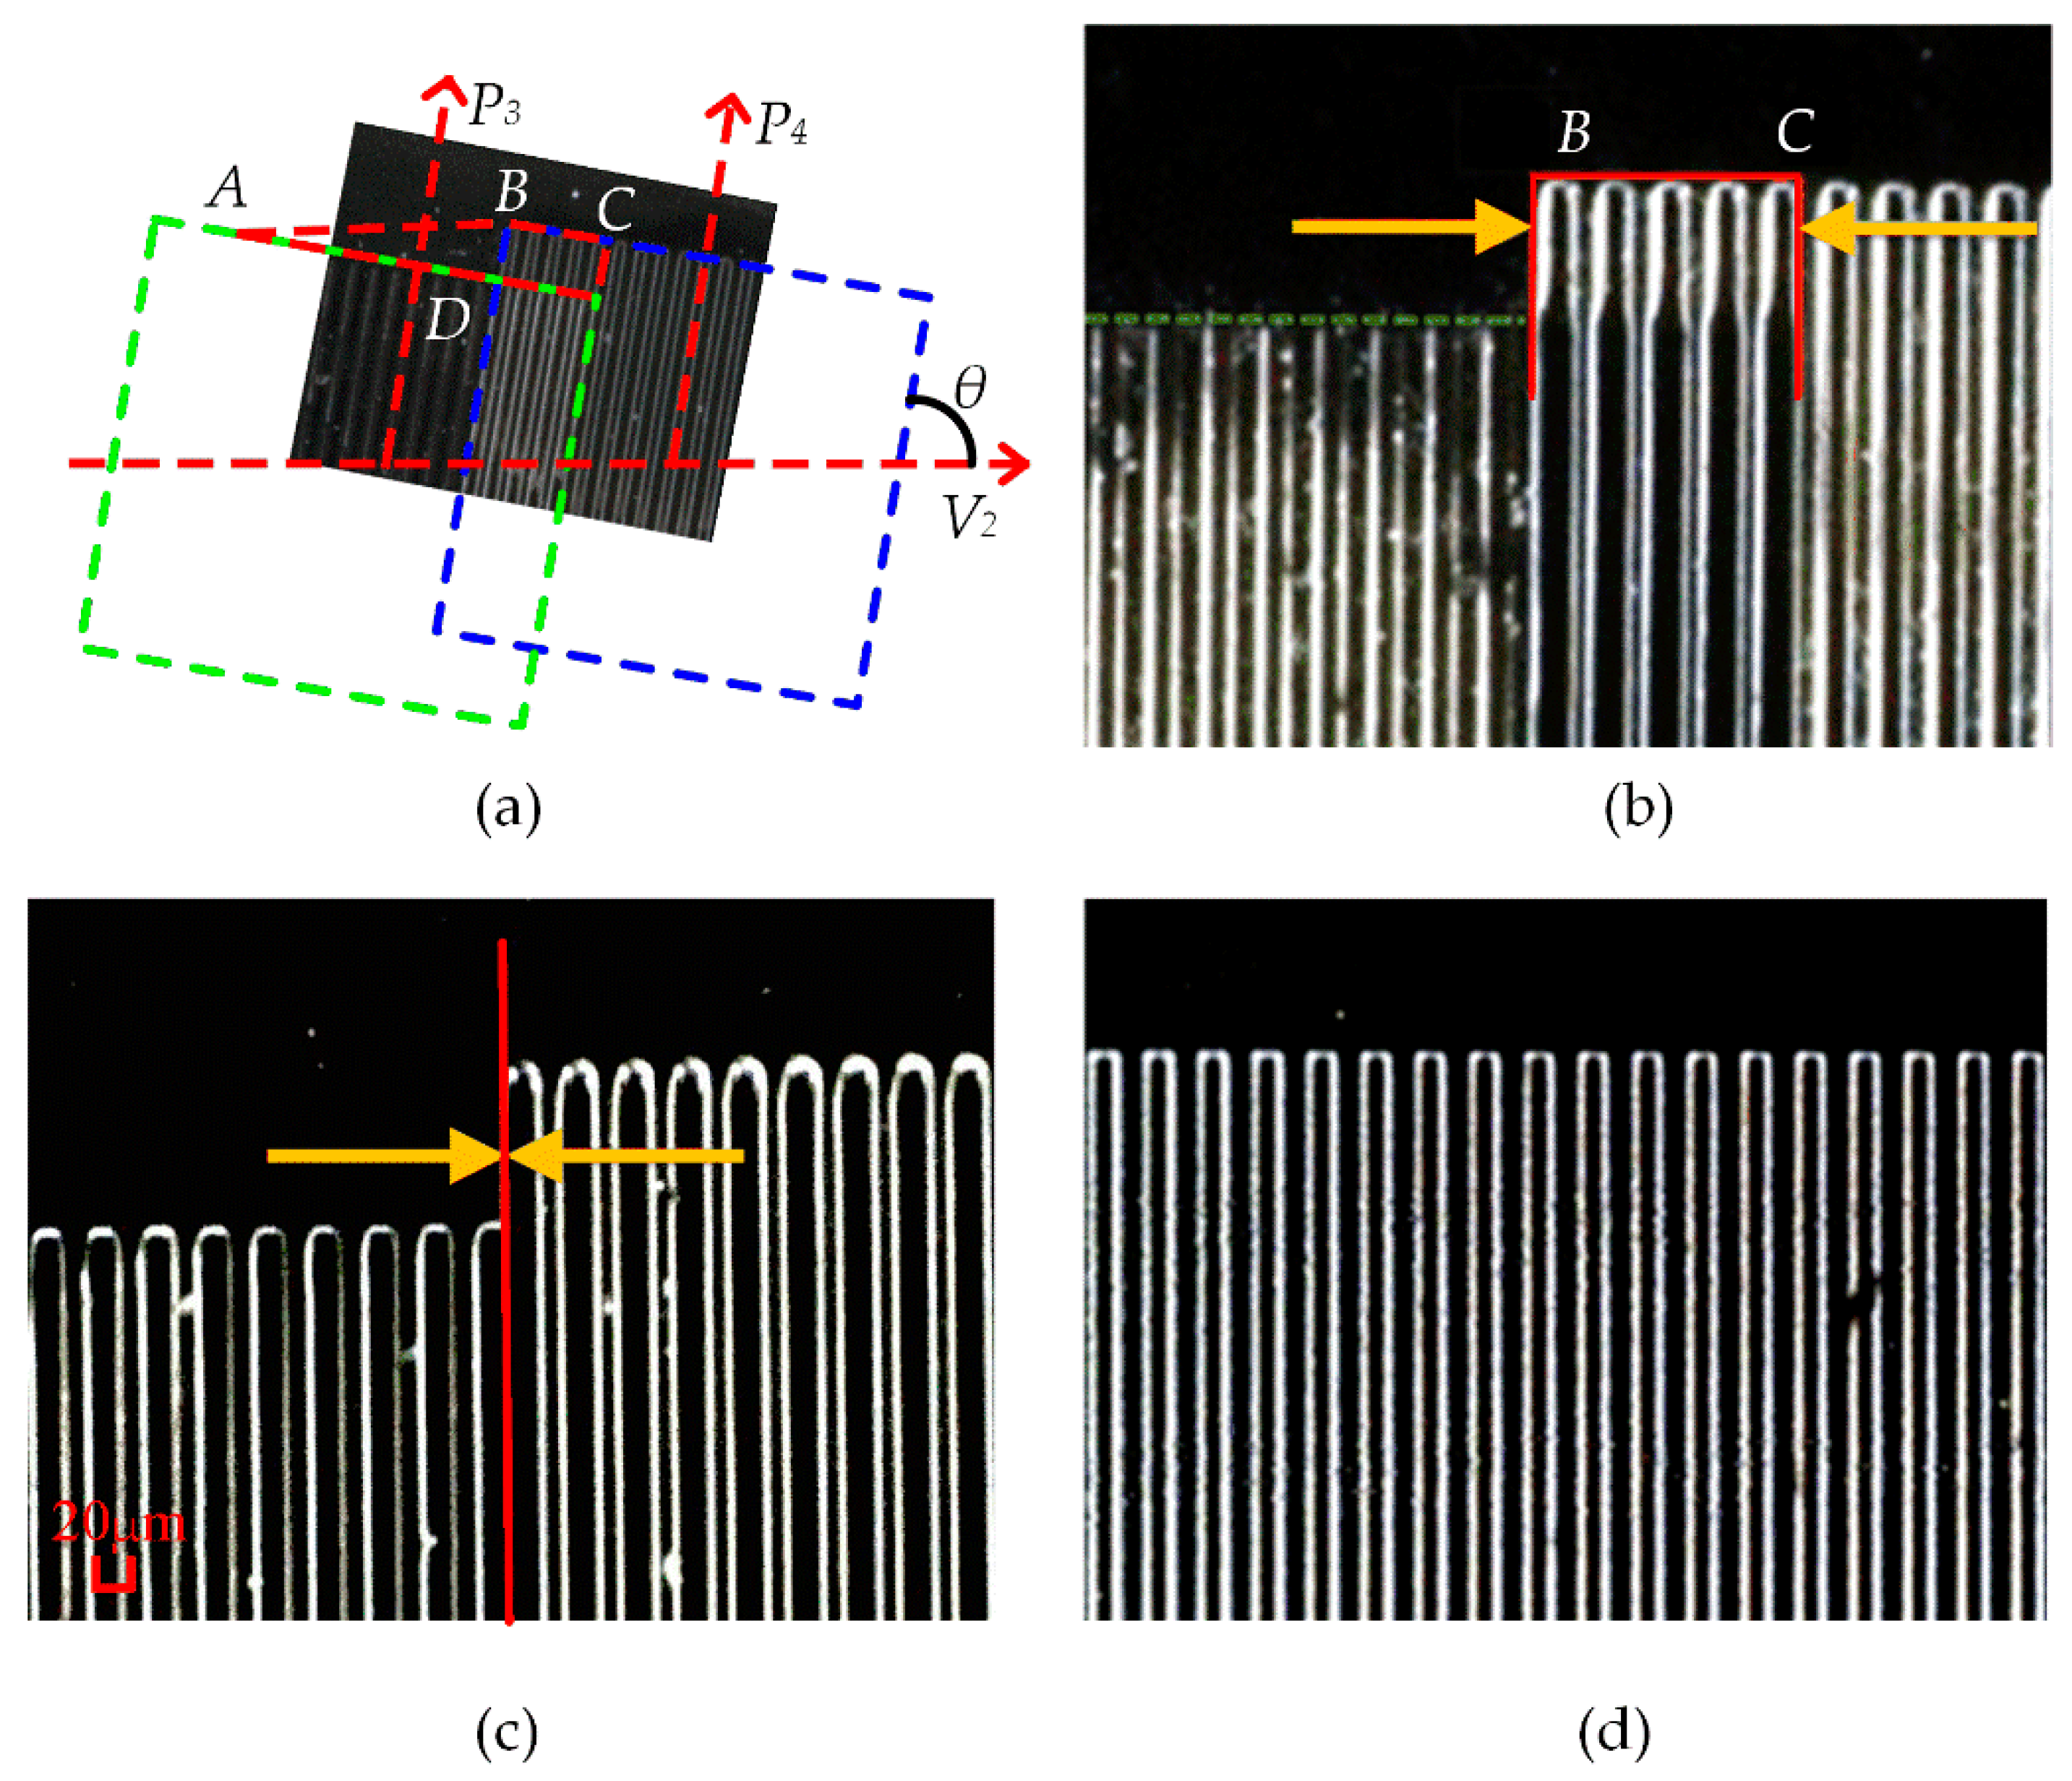
2.2. Tilt Mask Alignment
2.3. Rotation Mask Alignment
2.4. Focal Length Alignment
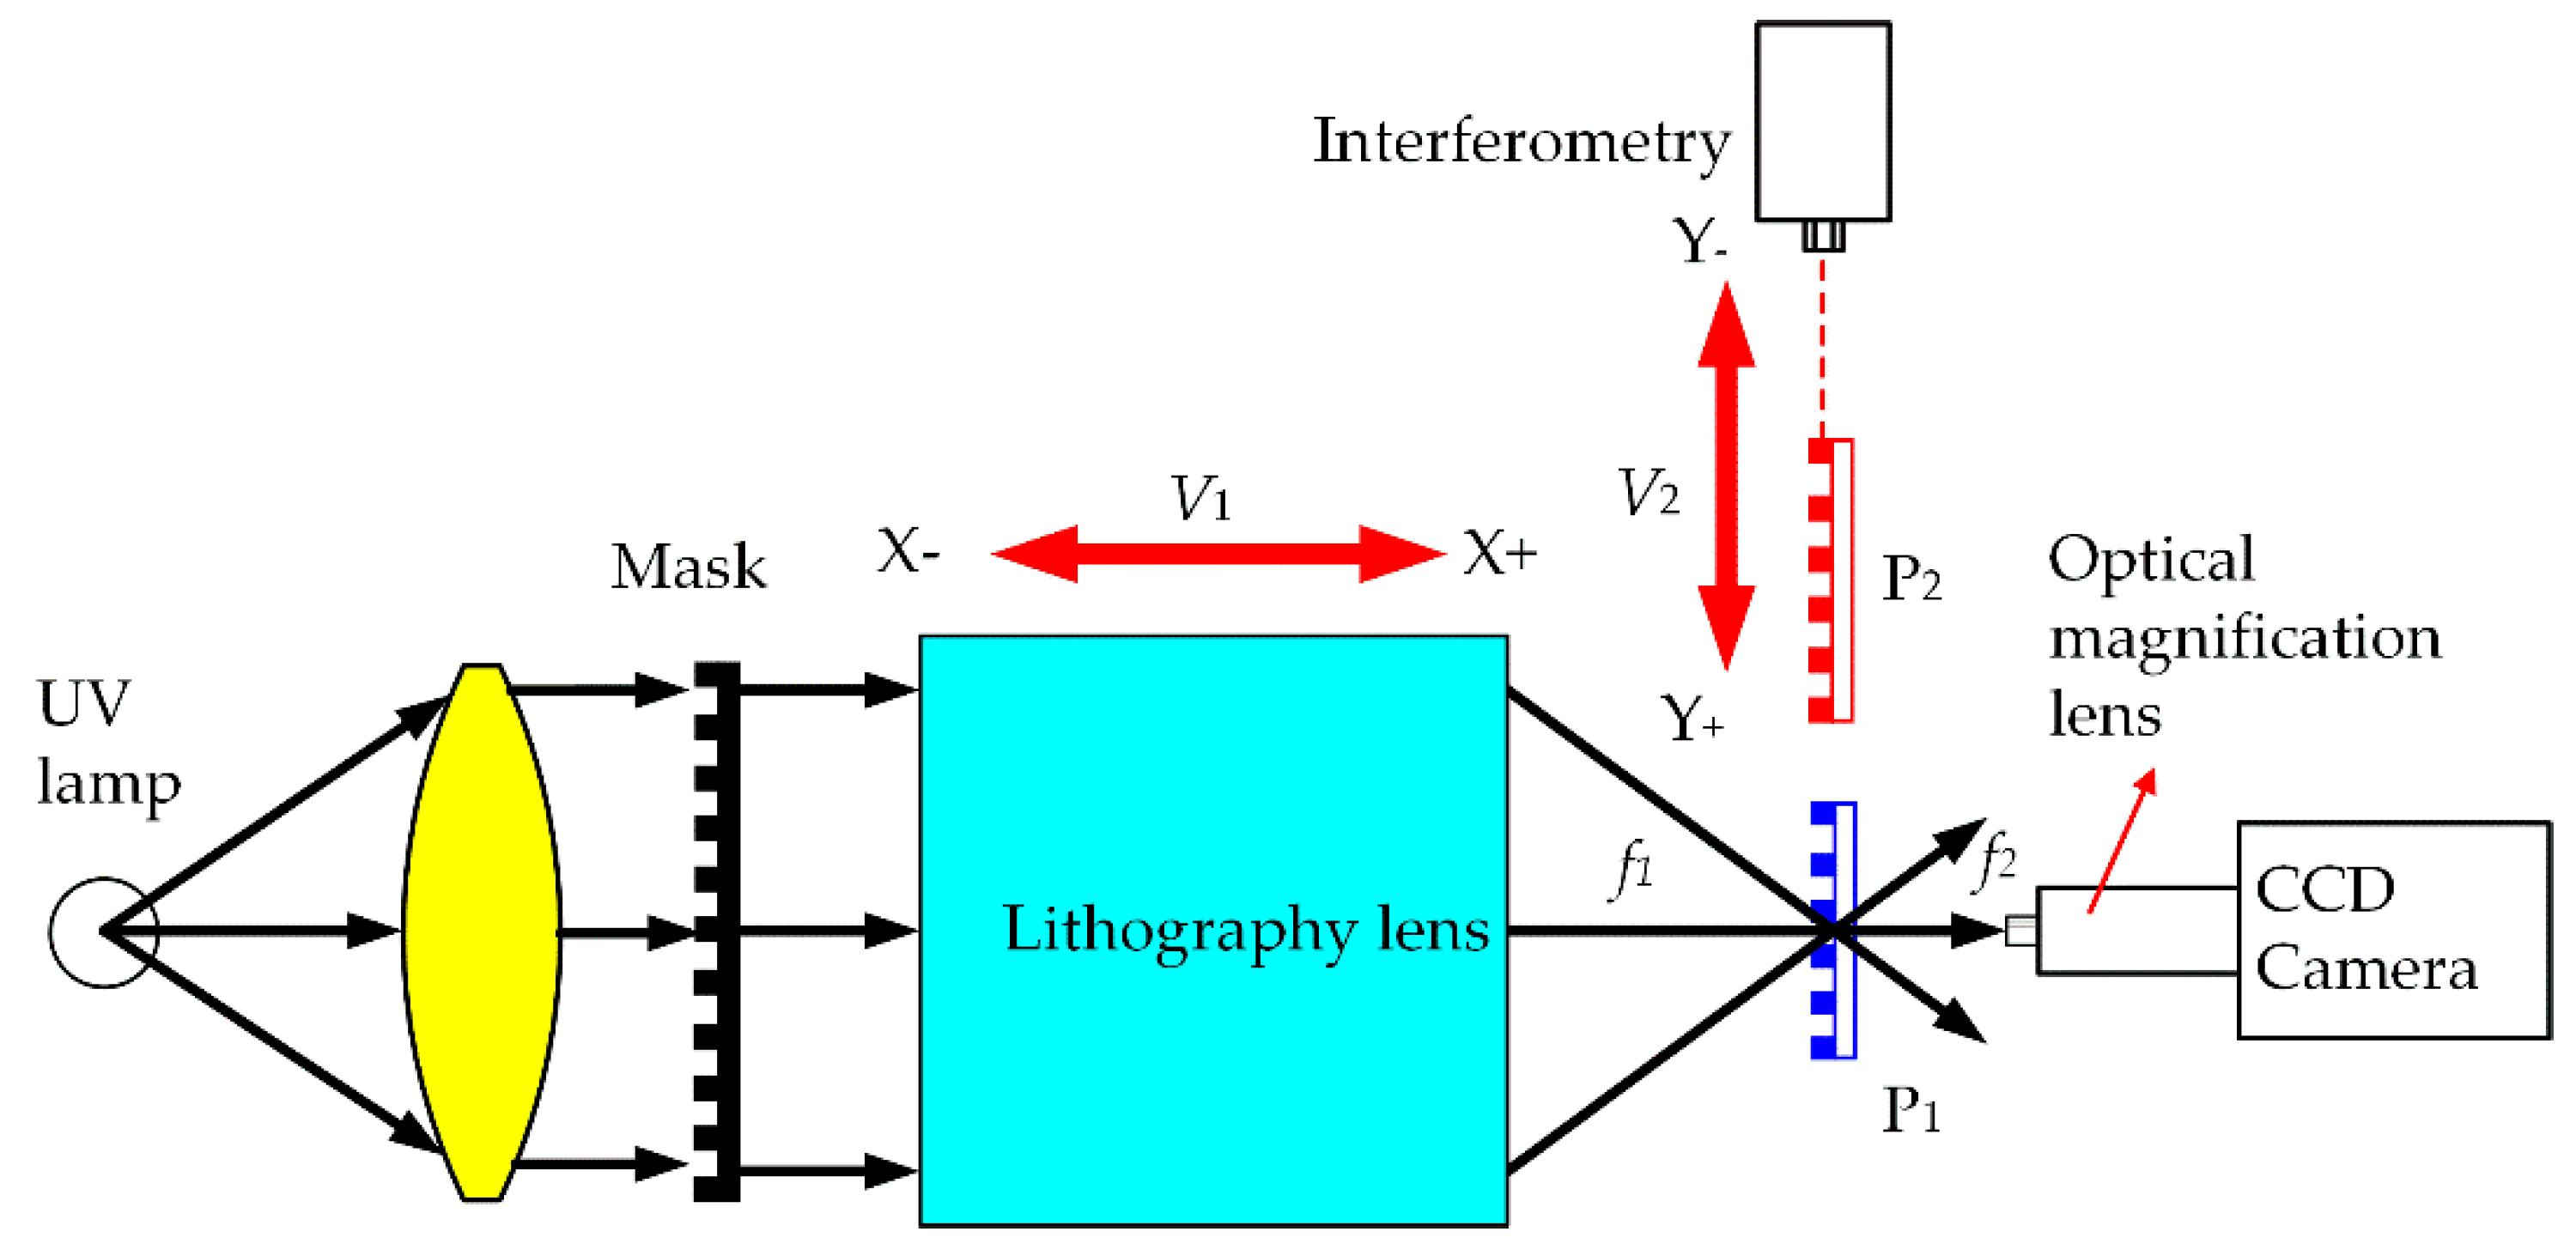
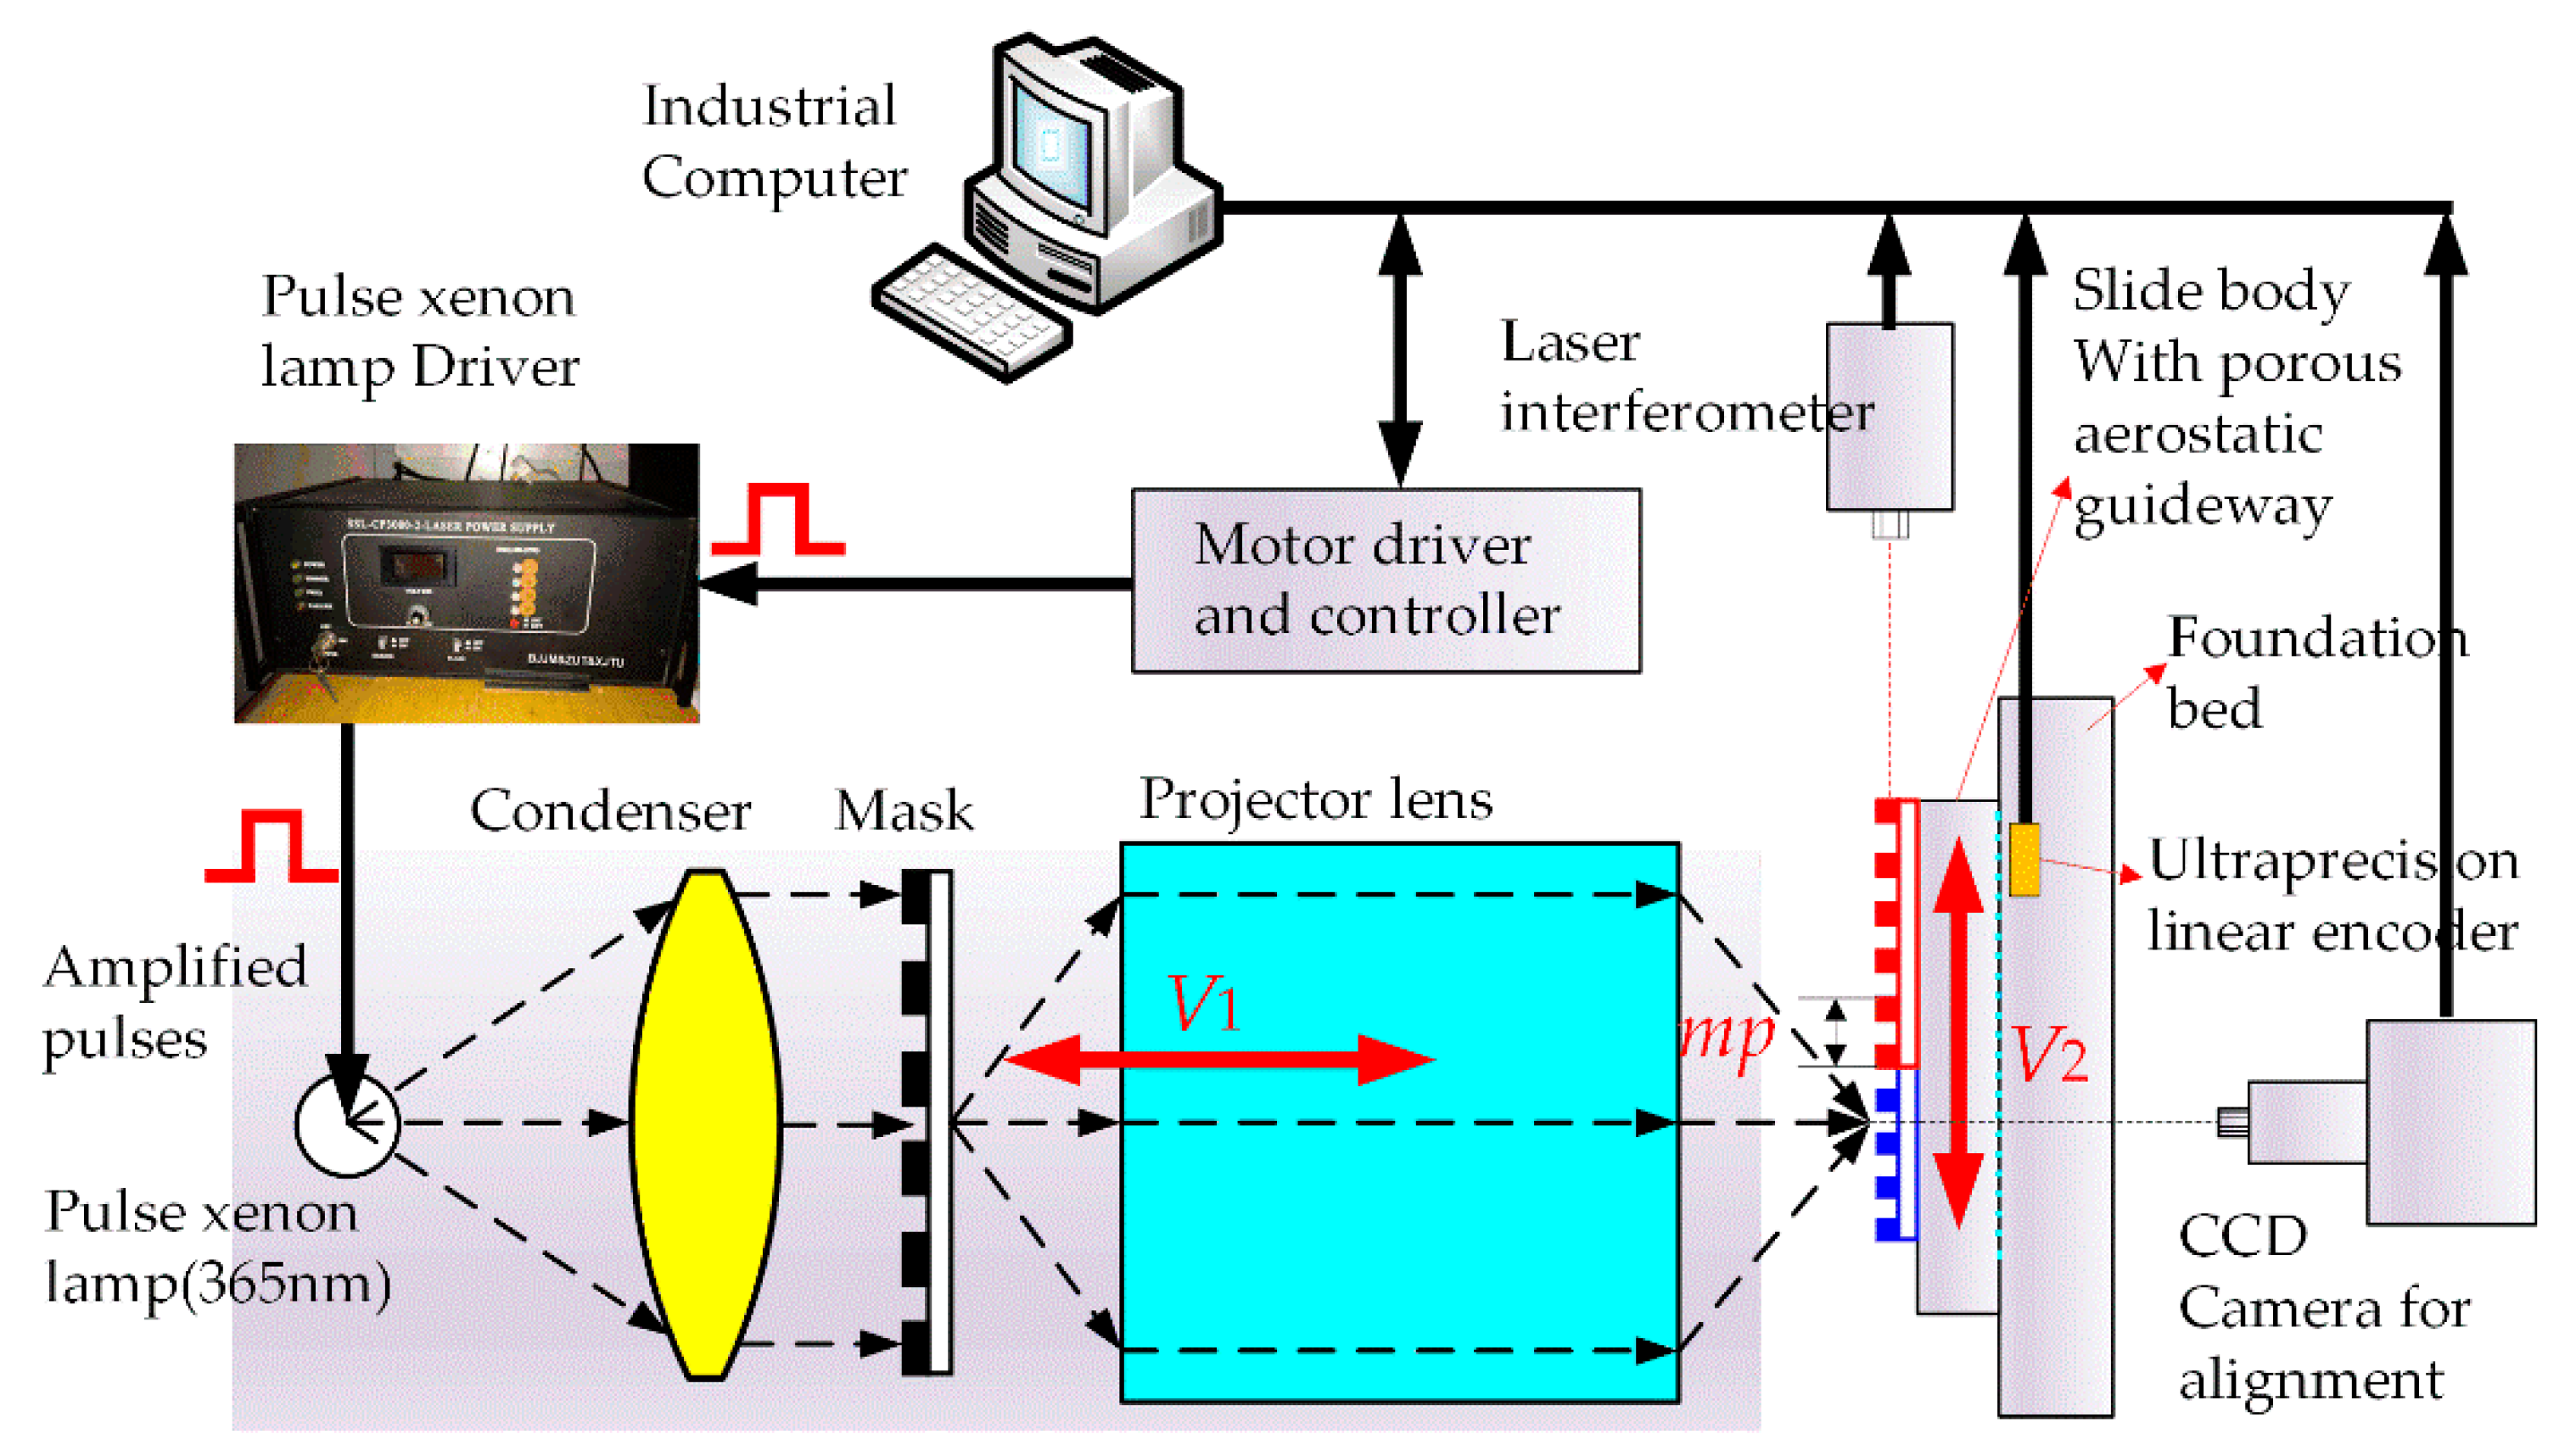
3. Experimental Setup
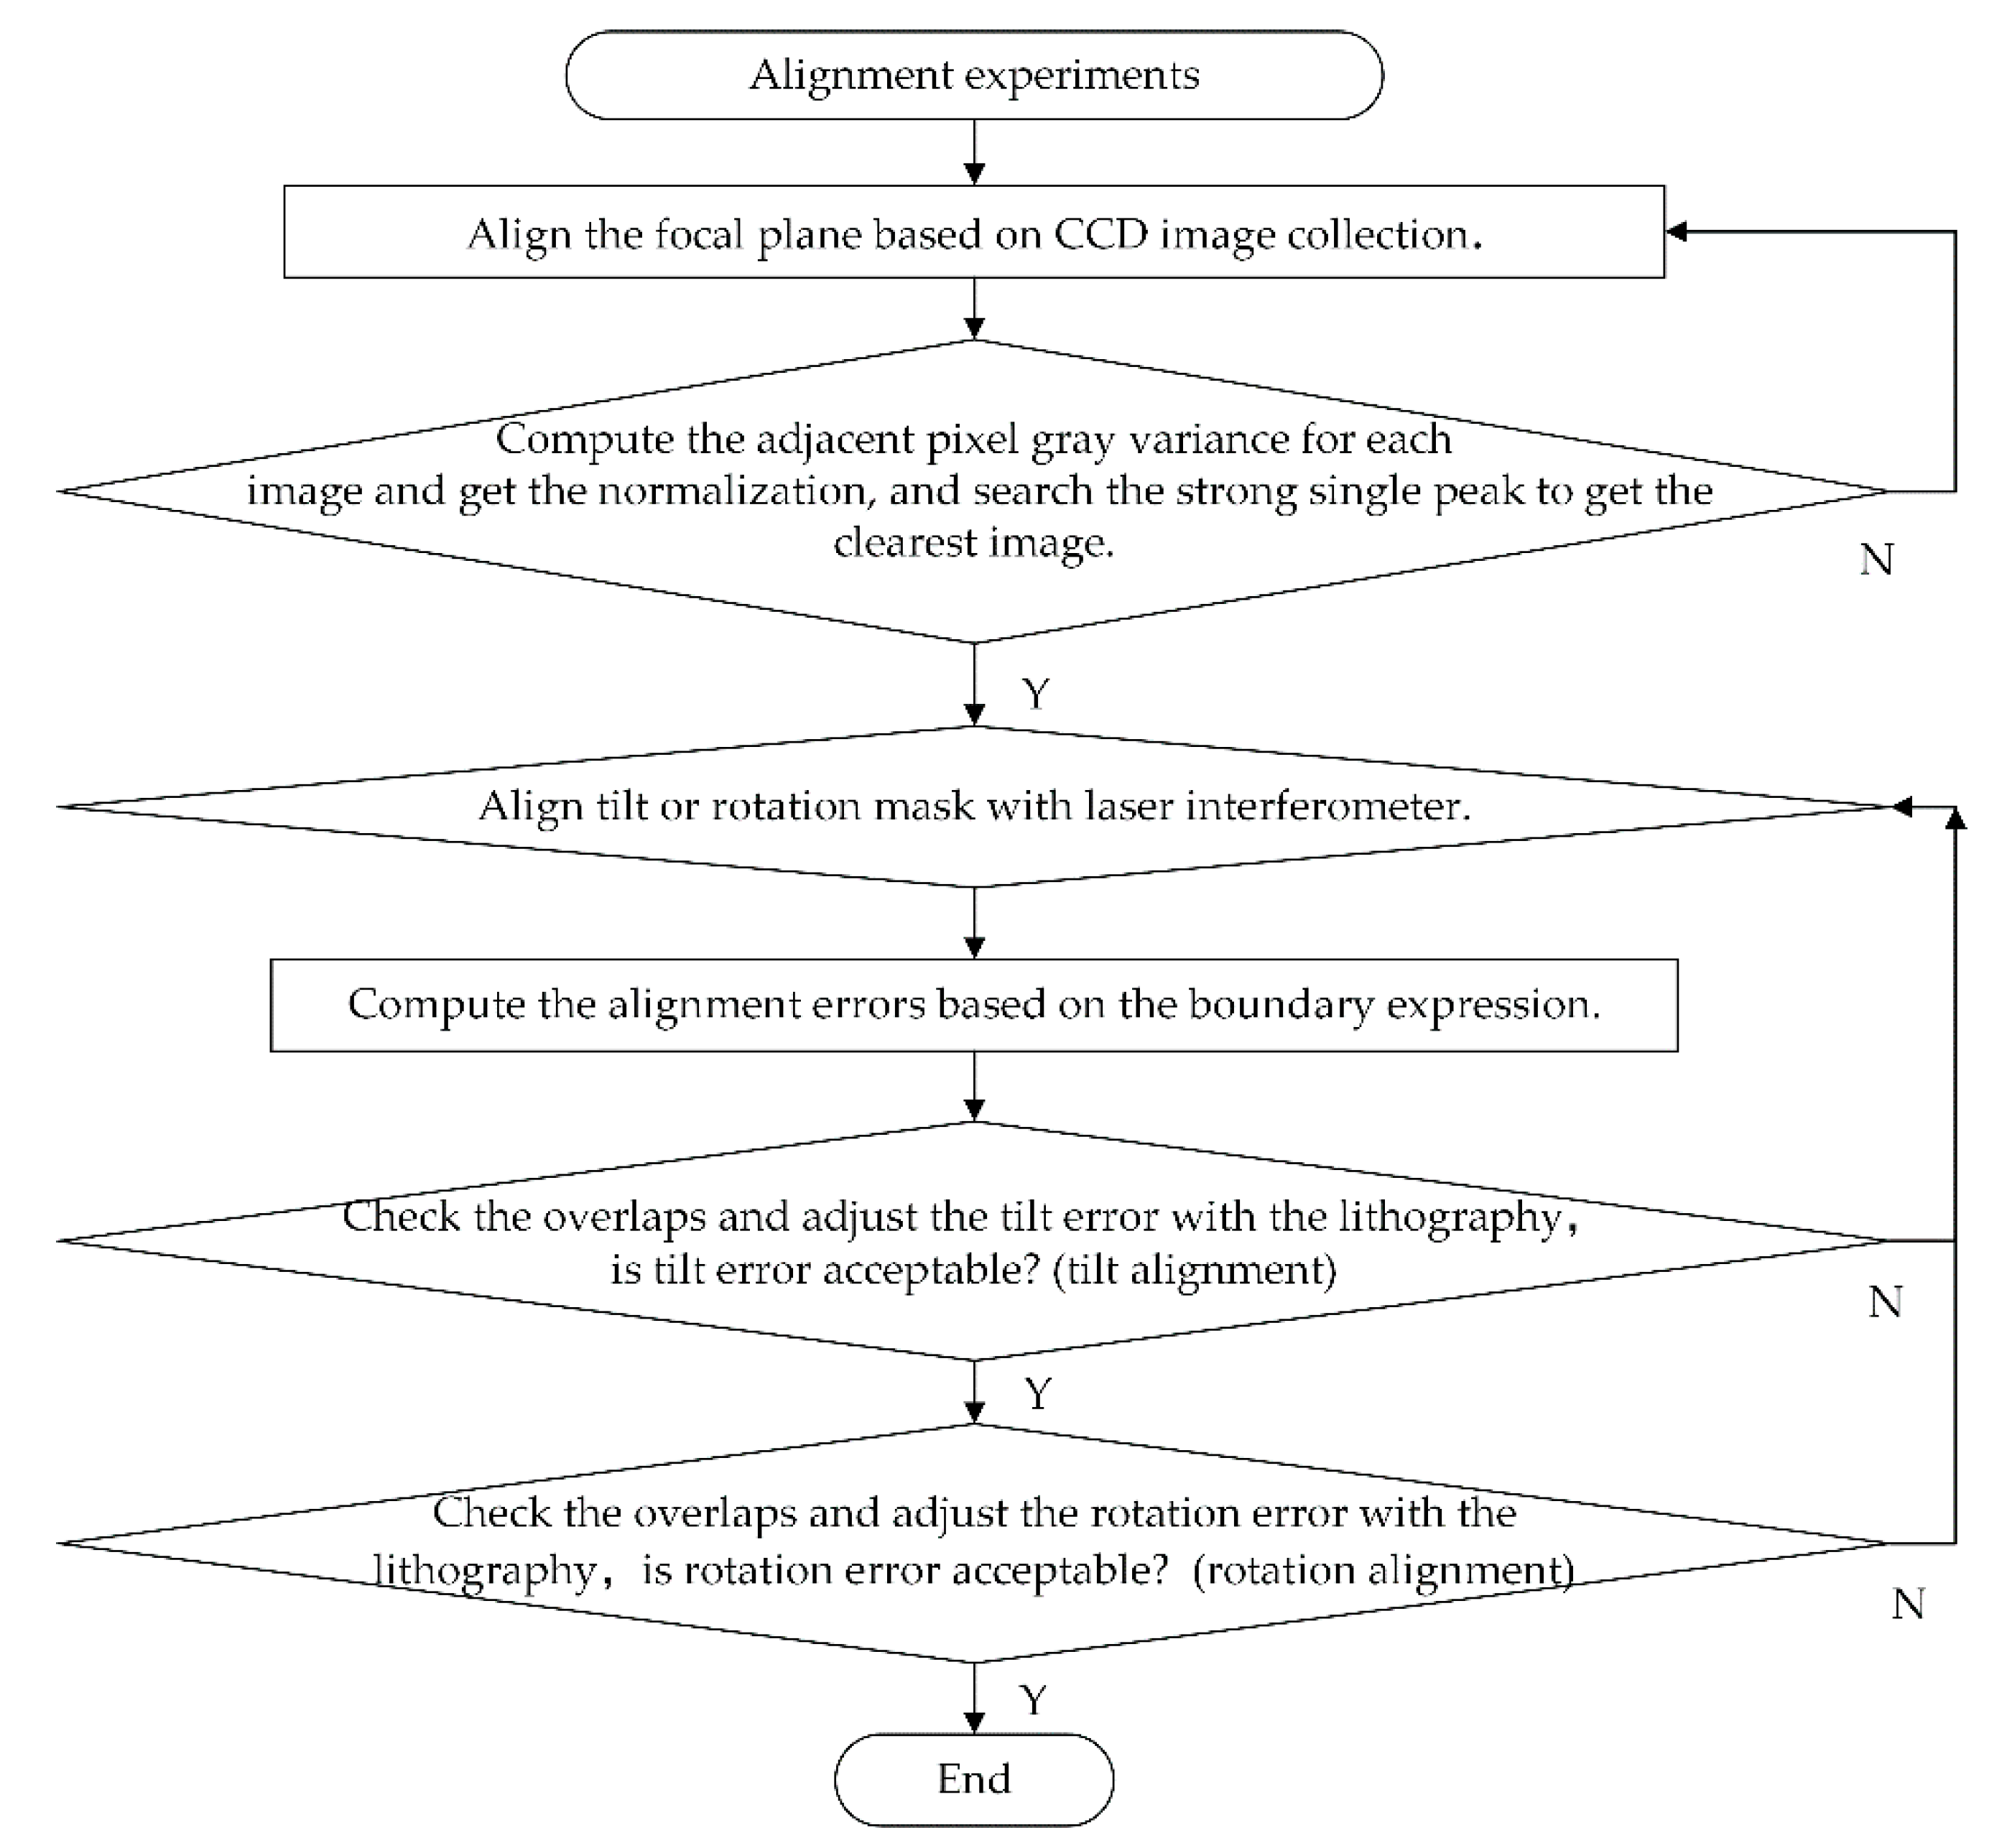
4. Alignment Experiments
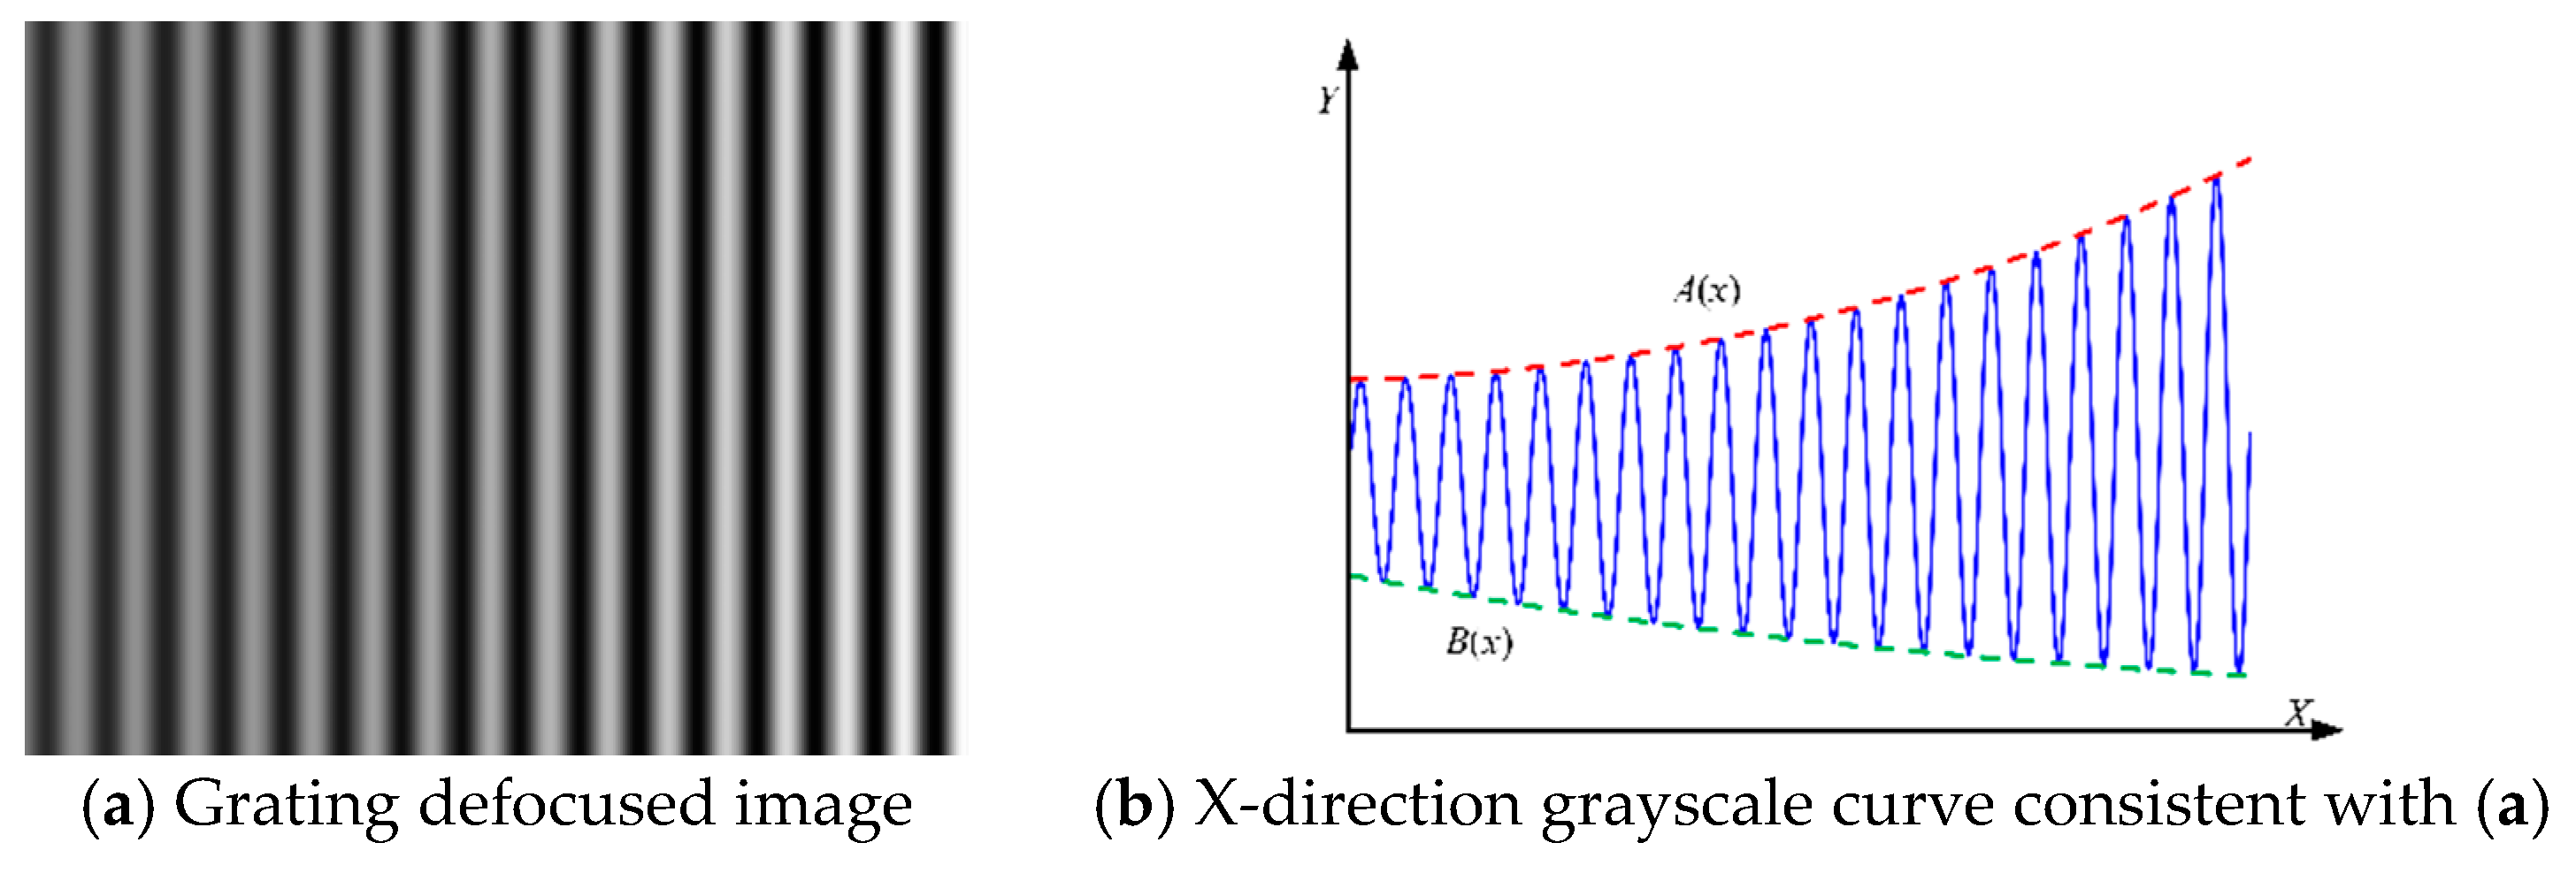
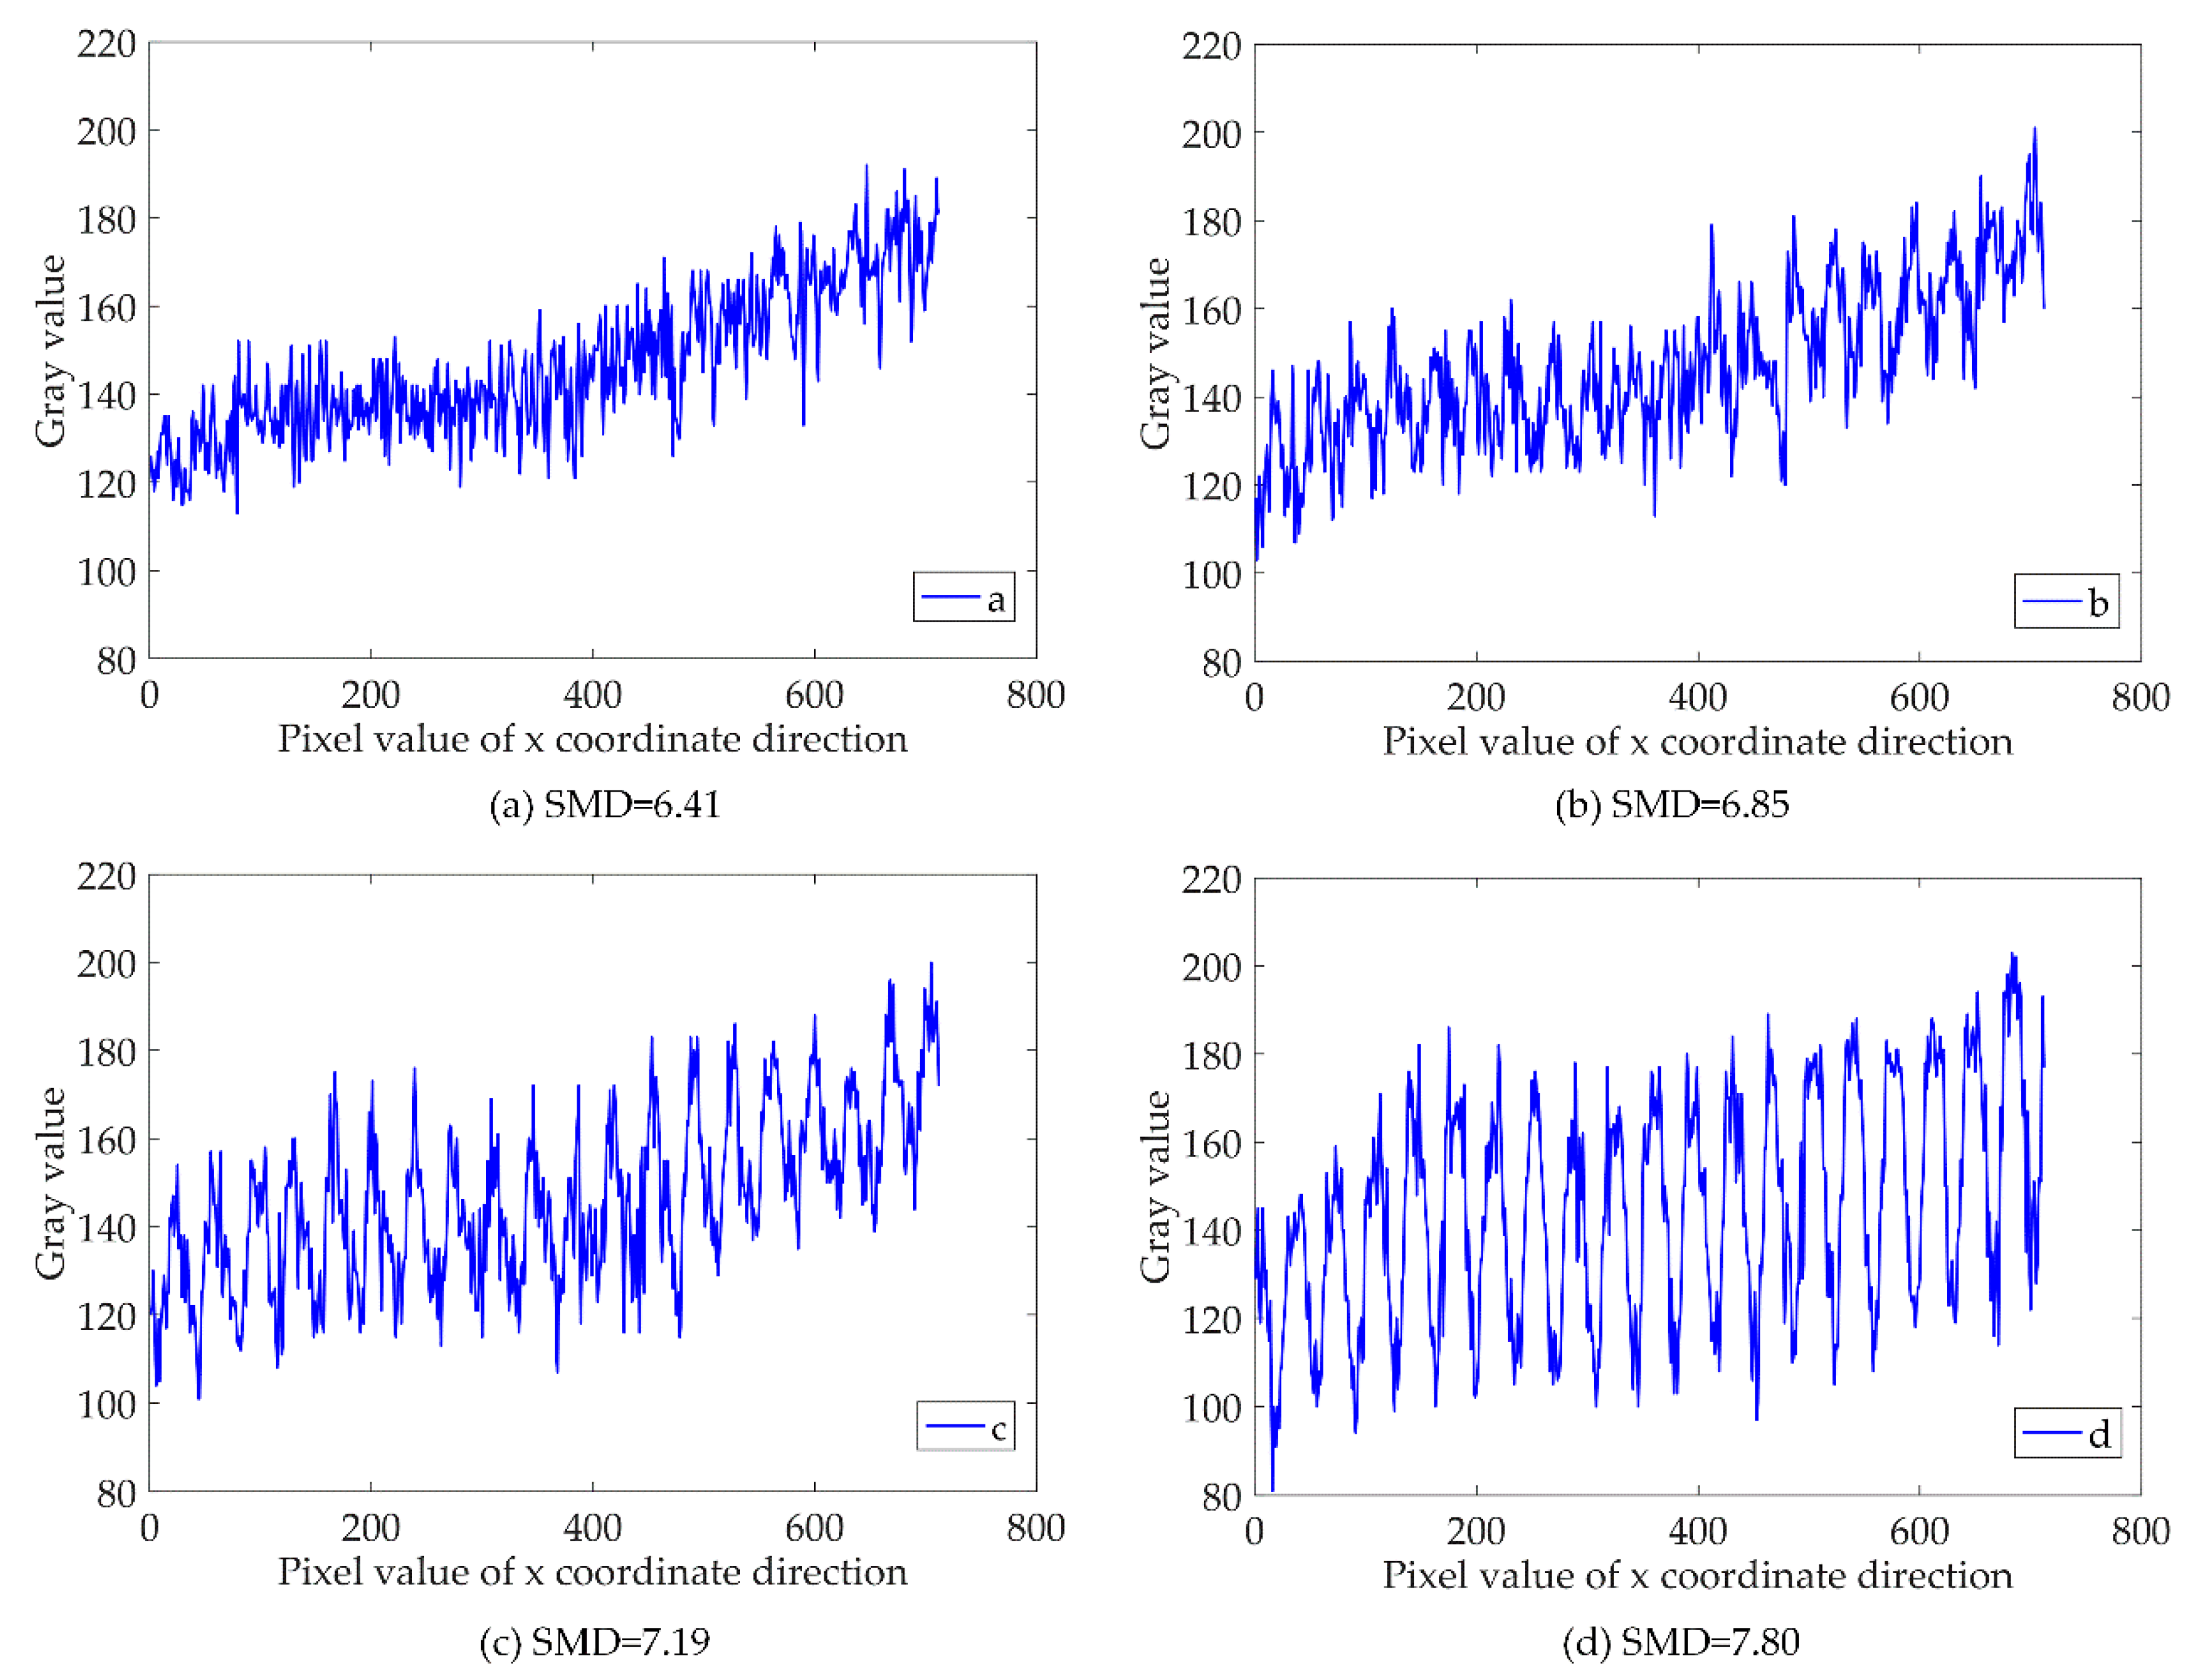
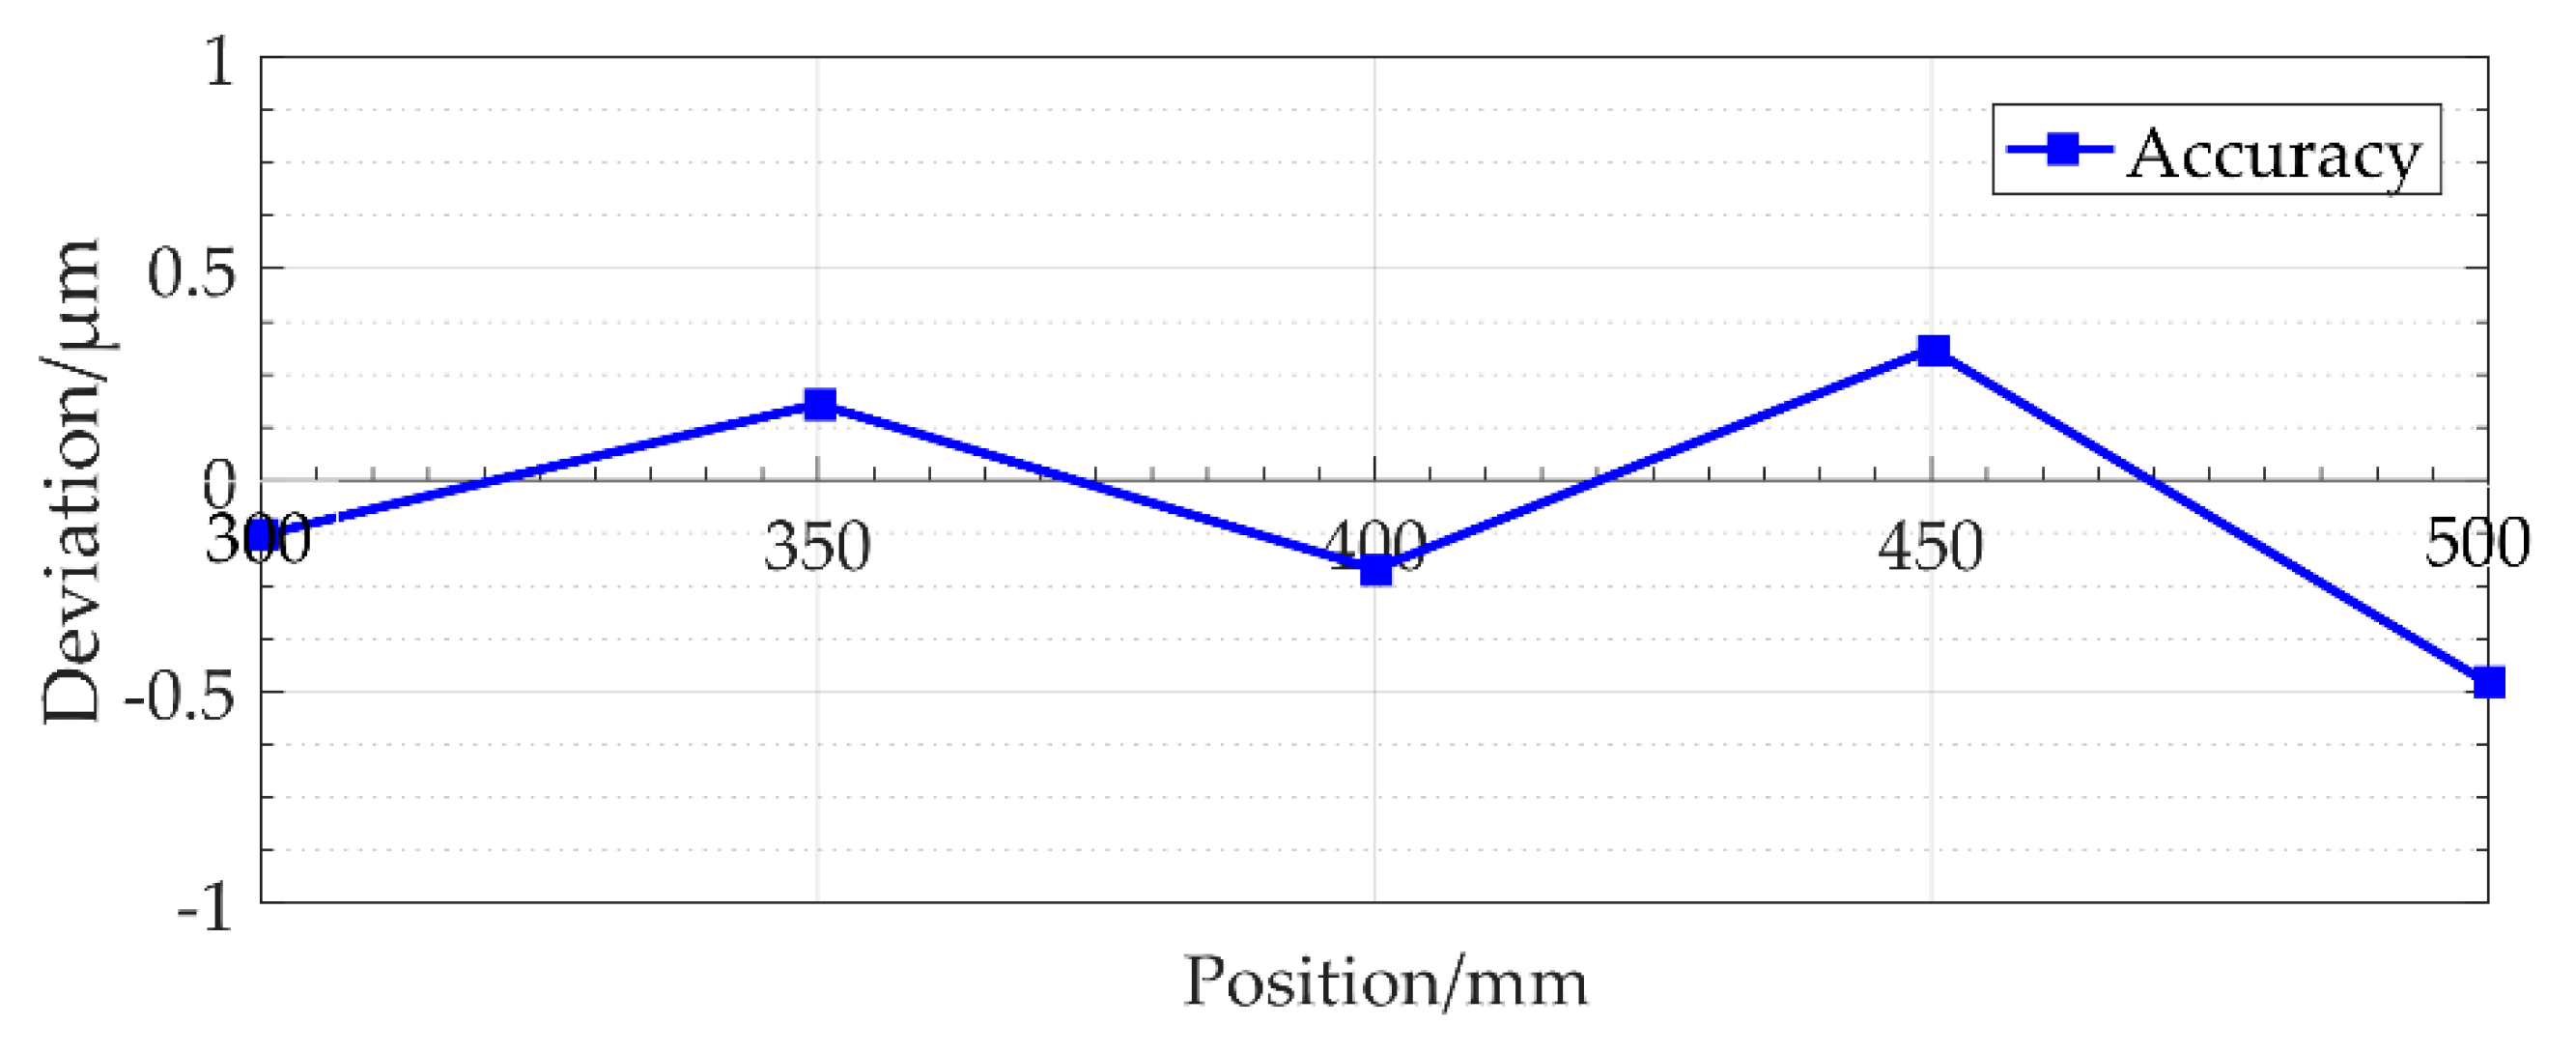
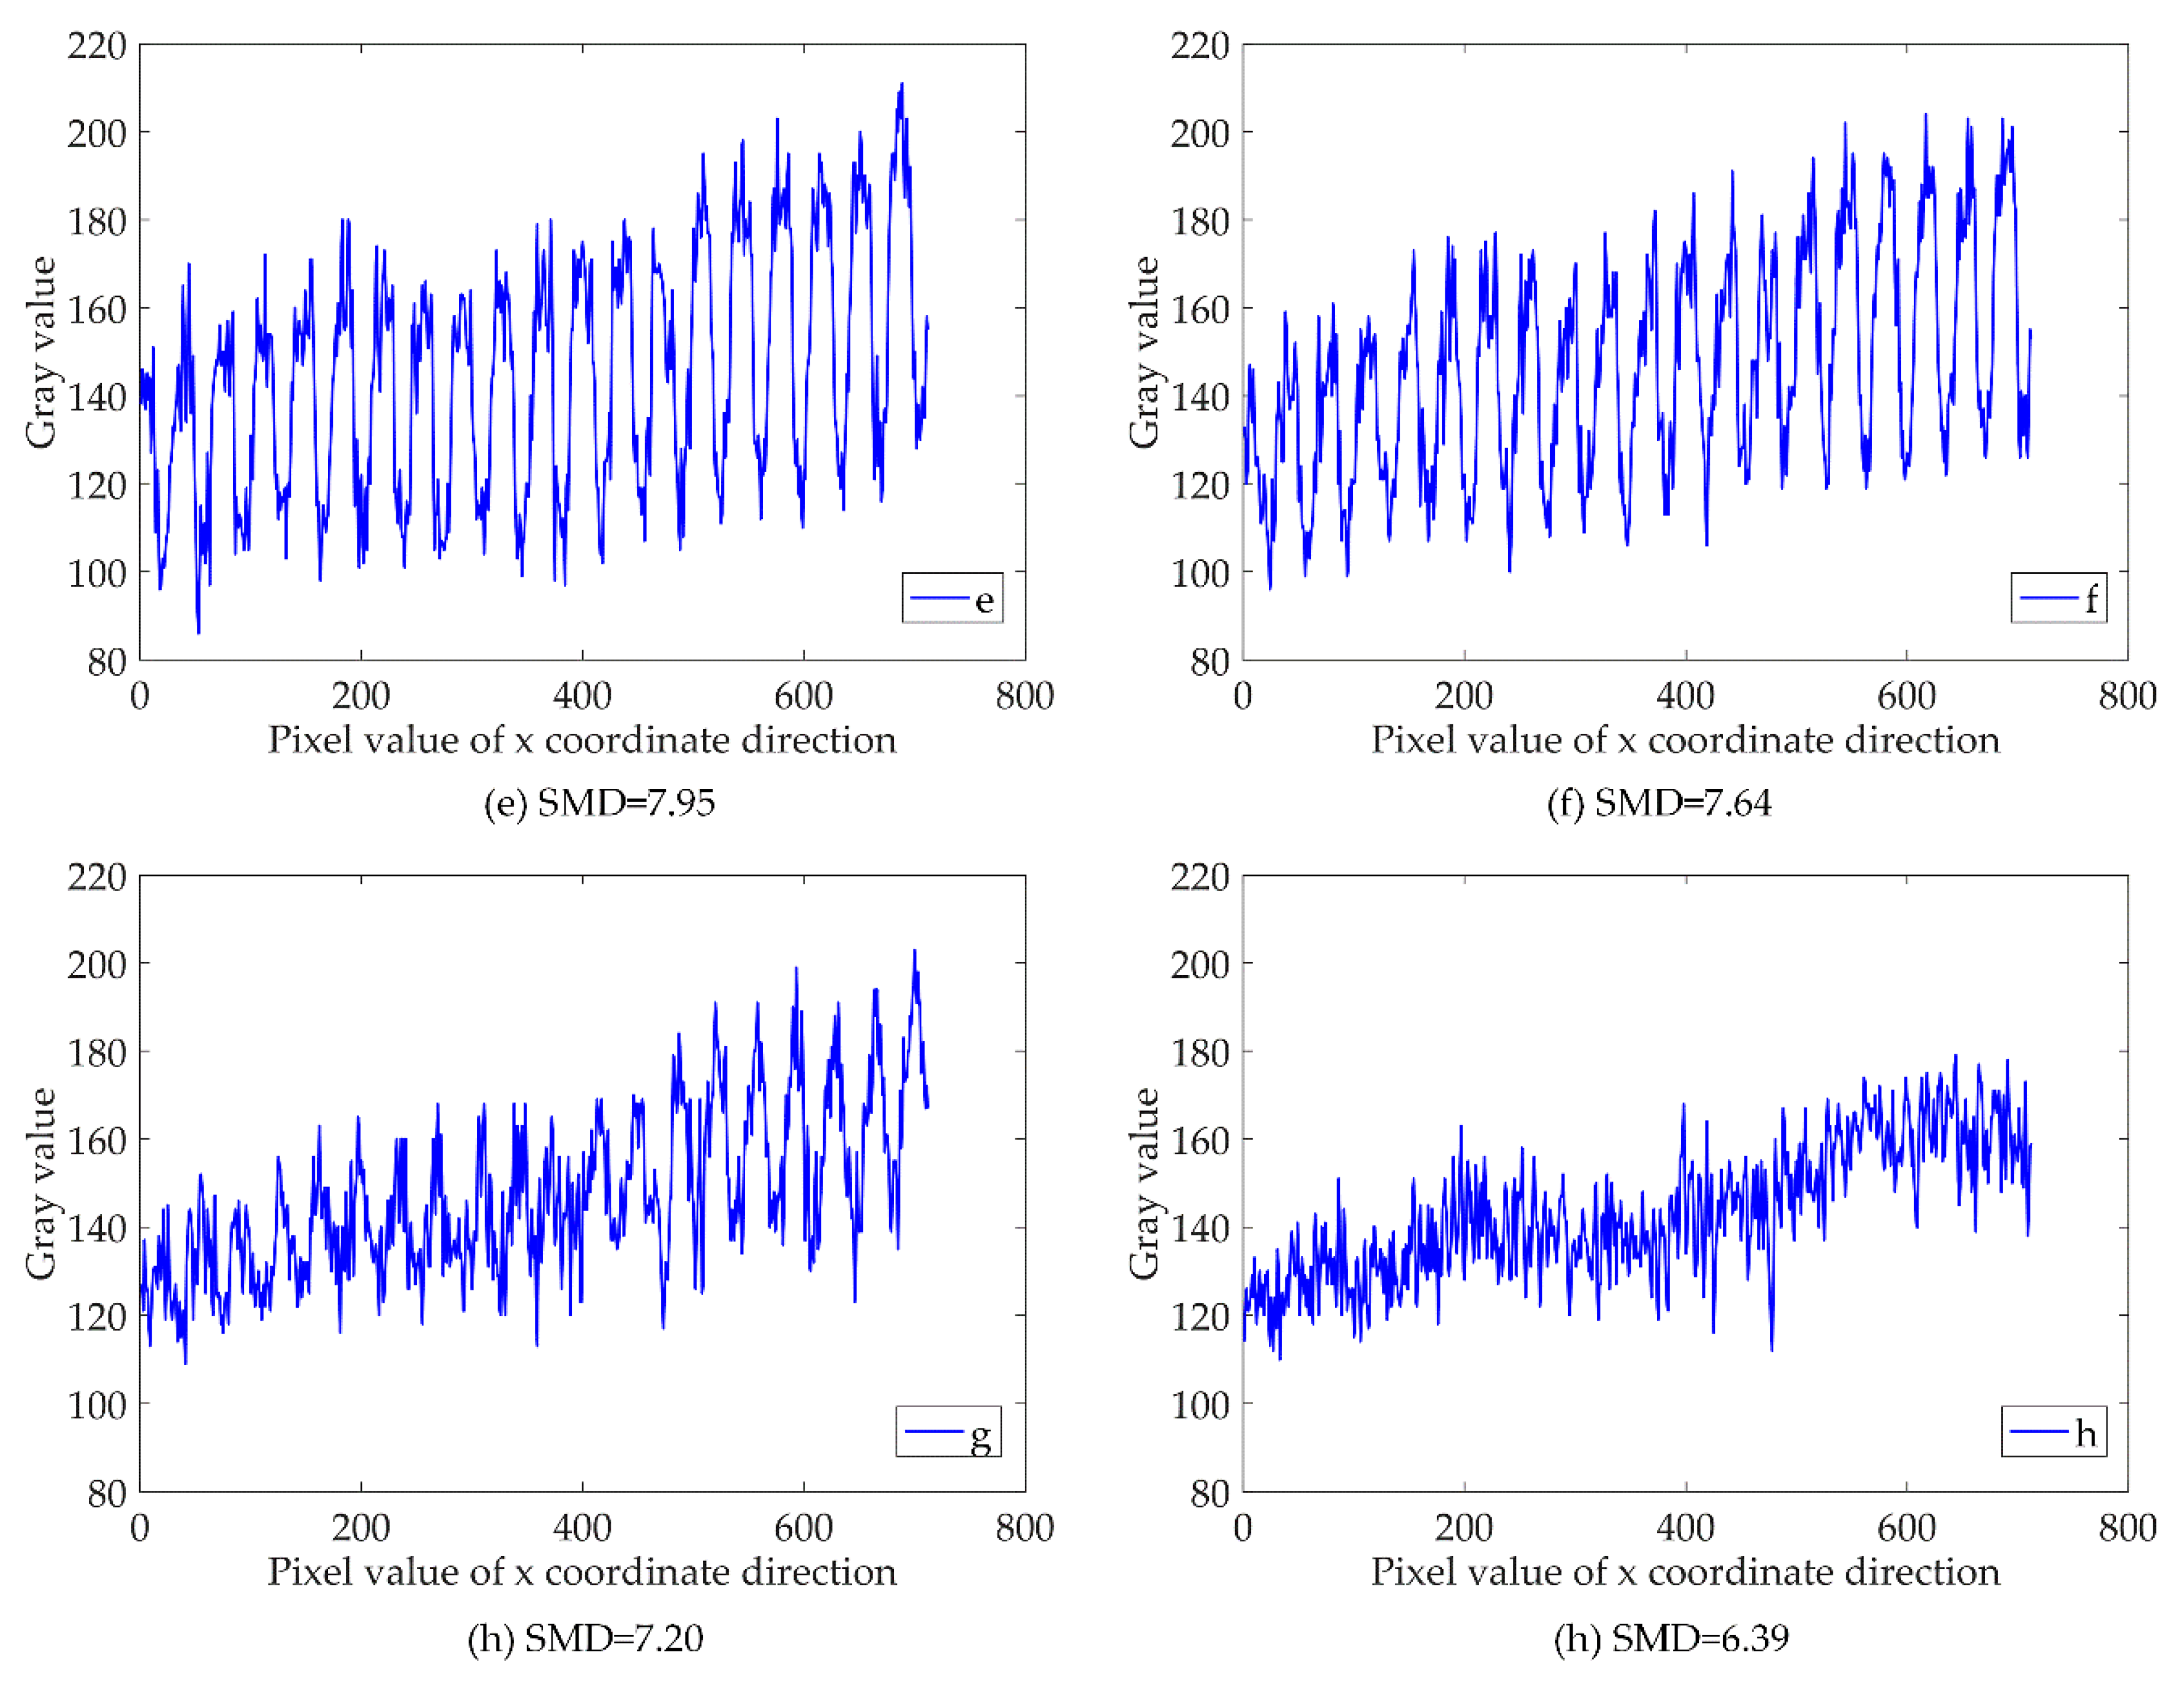
4.1. Align the Focal Plane Based on the CCD Image
4.2. Align Tilt and Rotation Mask with Laser Interferometer
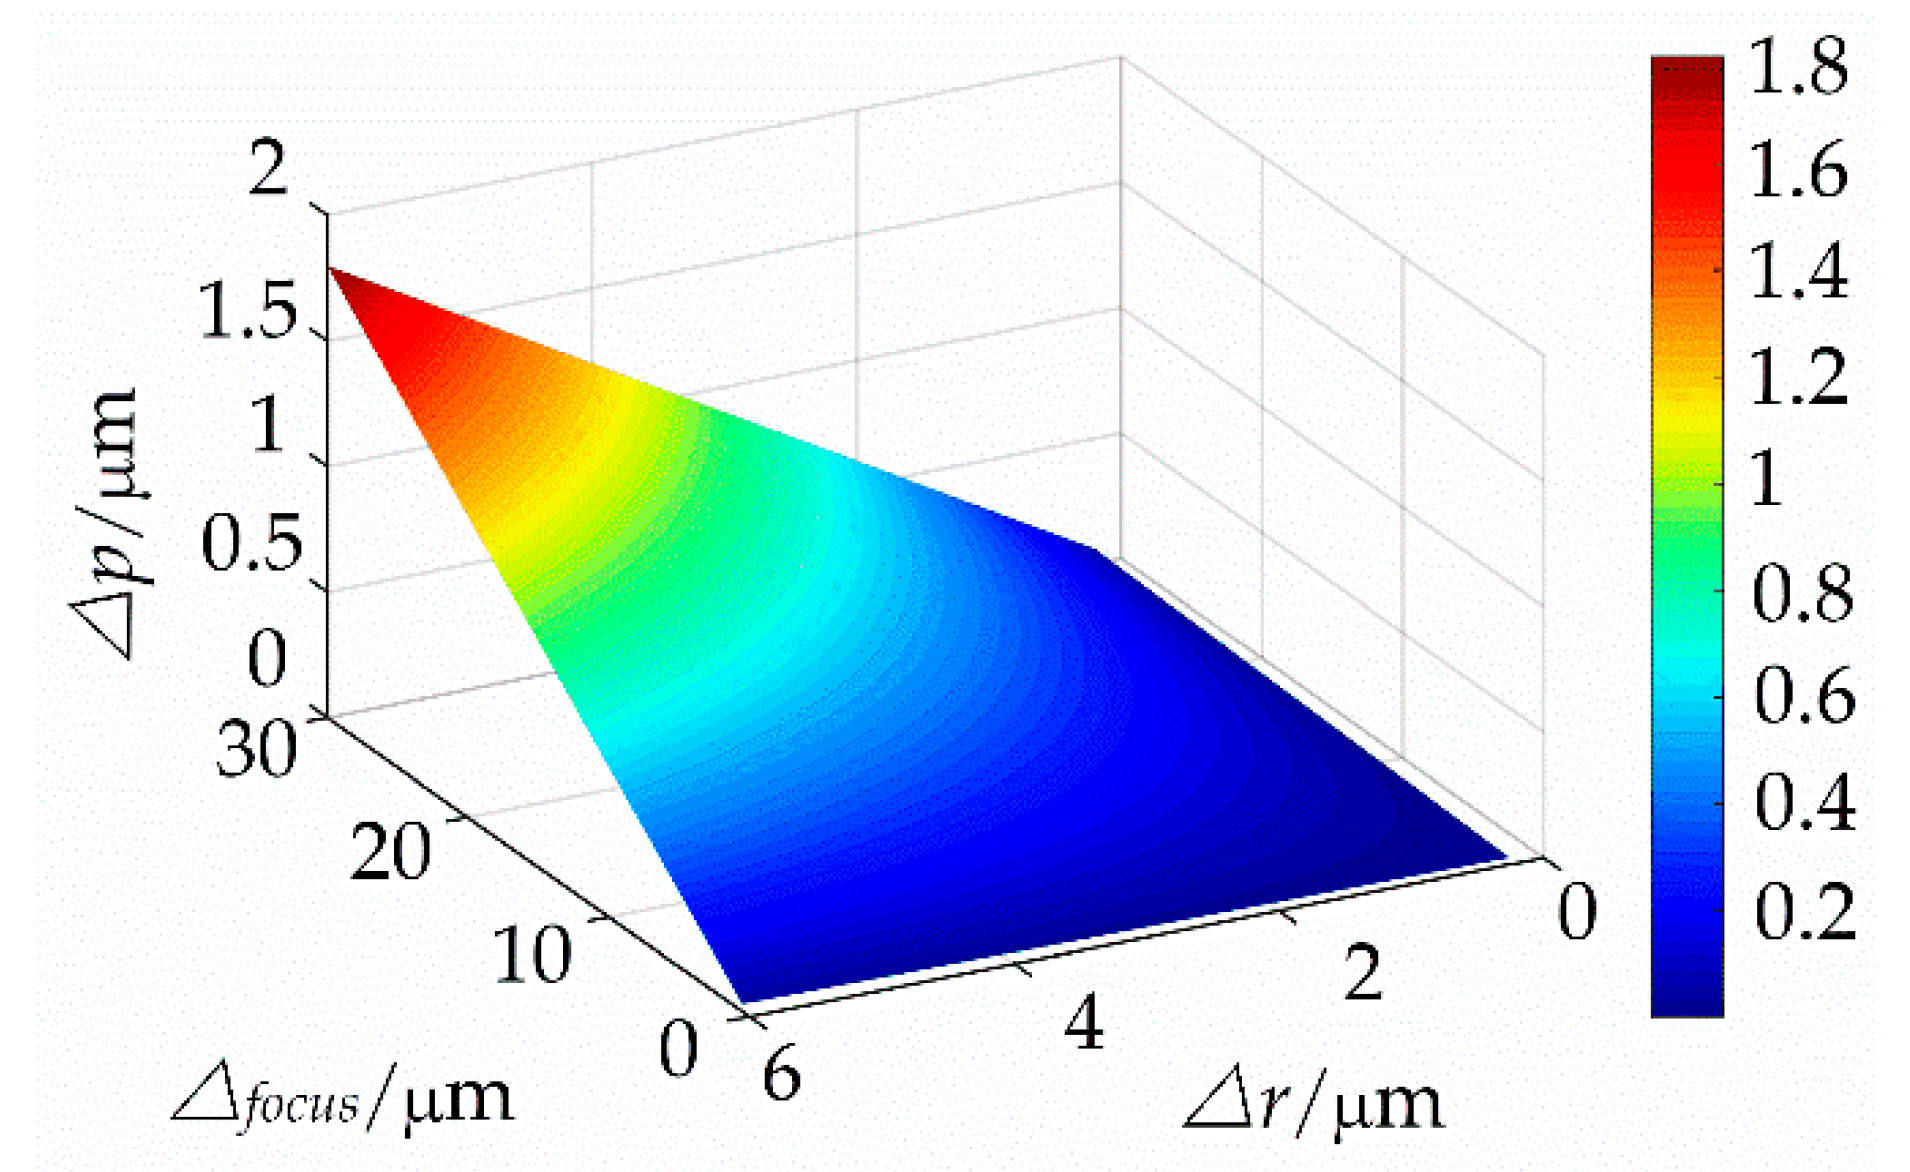
4.3. Influence of the Alignment Error on the Lithography Accuracy
- (1)
- When an alignment plane is away from the focal plane in the alignment process, it will result in the contrast problems, and it is easy to form deviation on the threshold plane.
- (2)
- And when there is a rotation angle error, it will result in an inclination of the energy distribution.where is the alignment error and is the projection error due to angular rotation.
5. Conclusions
- (1)
- The optimal position of the focal plane of the mask is determined by the CCD image, which is used to calculate the sharpness of the image using an image mathematical algorithm. The alignment algorithm is normalized to achieve precise alignment by adjusting the position of the lithography system.
- (2)
- For plane alignment, four types of conventional tilt cases are listed, and a mathematical model is used to interpret the method. The plane tilt tolerance error is described from a theoretical perspective.
- (3)
- For the rotation error alignment, the rectangular wave Fourier fundamental frequency algorithm of the lithography lens system is used to model the rotation errors, and the limit functions of the real and imaginary parts are described. Simultaneously, the frequency and phase are assigned the limit functions. Finally, the alignment accuracy function of the rotation error is characterized by the weighting of the errors.
Author Contributions
Funding
Acknowledgments
Conflicts of Interest
References
- Ren, D.; Xi, J.; Li, Z.; Li, B.; Zhao, Z.; Zhao, H.; Cui, L.; Xu, H. The Alignment Method for Linear Scale Projection Lithography Based on CCD Image Analysis. In Proceedings of the 4th International Electronic Conference on Sensors and Applications, 15–30 November 2017; Available online: https://sciforum.net/manuscripts/4936/manuscript.pdf (accessed on 26 July 2018). [CrossRef]
- Di, C.; Zhu, J.; Yan, W.; Hu, S. A modified alignment method based on four-quadrant-grating moiré for proximity lithography. Opt. Lasers Eng. 2014, 125, 4868–4872. [Google Scholar] [CrossRef]
- Zhu, J.; Hu, S.; Zhou, P.; Yu, J. Experimental study of Talbot imaging moiré-based lithography alignment method. Opt. Lasers Eng. 2014, 58, 54–59. [Google Scholar] [CrossRef]
- Li, N.; Wu, W.; Stephen, Y.C. Sub-20-nm Alignment in Nanoimprint Lithography Using Moiré Fringe. Nano Lett. 2006, 6, 2626–2629. [Google Scholar] [CrossRef] [PubMed]
- Shao, J.; Ding, Y.; Tian, H.; Li, X.; Li, X.; Liu, H. Digital moiré fringe measurement method for alignment in imprint lithography. Opt. Laser Technol. 2012, 44, 446–451. [Google Scholar] [CrossRef]
- Miyashiro, R.; Fukagawa, Y. Optimization of alignment in semiconductor lithography equipment. Precis. Eng. 2009, 33, 327–332. [Google Scholar] [CrossRef]
- Farrow, R.C.; Liddle, J.A.; Berger, S.D.; Huggins, H.A.; Kraus, J.S.; Camarda, R.M. Marks for alignment and registration in projection electron lithography. J. Vac. Sci. Technol. B Microelectron. Nanom. Struct. 1993, 11, 240–246. [Google Scholar] [CrossRef]
- Zhang, L.; Feng, Y.; Dong, L.; Su, X.; Tian, Z.; Fang, C. New alignment mark design structures for higher diffraction order wafer quality enhancement. SPIE Adv. Lithogr. 2017, 10145, 101452C. [Google Scholar]
- Lee, C.W.; Kim, S.W. An ultraprecision stage for alignment of wafers in advanced microlithography. Precis. Eng. 1997, 21, 113–122. [Google Scholar] [CrossRef]
- Sreenivasan, S.V. Thermally controlled alignment for wafer-scale lithography. J. Micro/Nanolithogr. Mems Moems 2013, 12, 031109. [Google Scholar]
- Terasawa, T. Novel alignment technique for 0.1-μm lithography using the wafer rear surface and canceling tilt effect. Opt. Eng. 1993, 32, 2344–2349. [Google Scholar]
- Qian, Q.; Zang, D. A Modified Sharpness-Evaluation Function of Image Based on Sobel. Comput. Digit. Eng. 2015, 43, 1865–1870. [Google Scholar] [CrossRef]
- Ren, D.; Zhao, H.; Zhang, C.; Yuan, D.; Xi, J.; Zhu, X. Multi-repeated projection lithography for high precision linear scale based on average homogenization effect. Sensors 2016, 16, 538. [Google Scholar] [CrossRef] [PubMed]


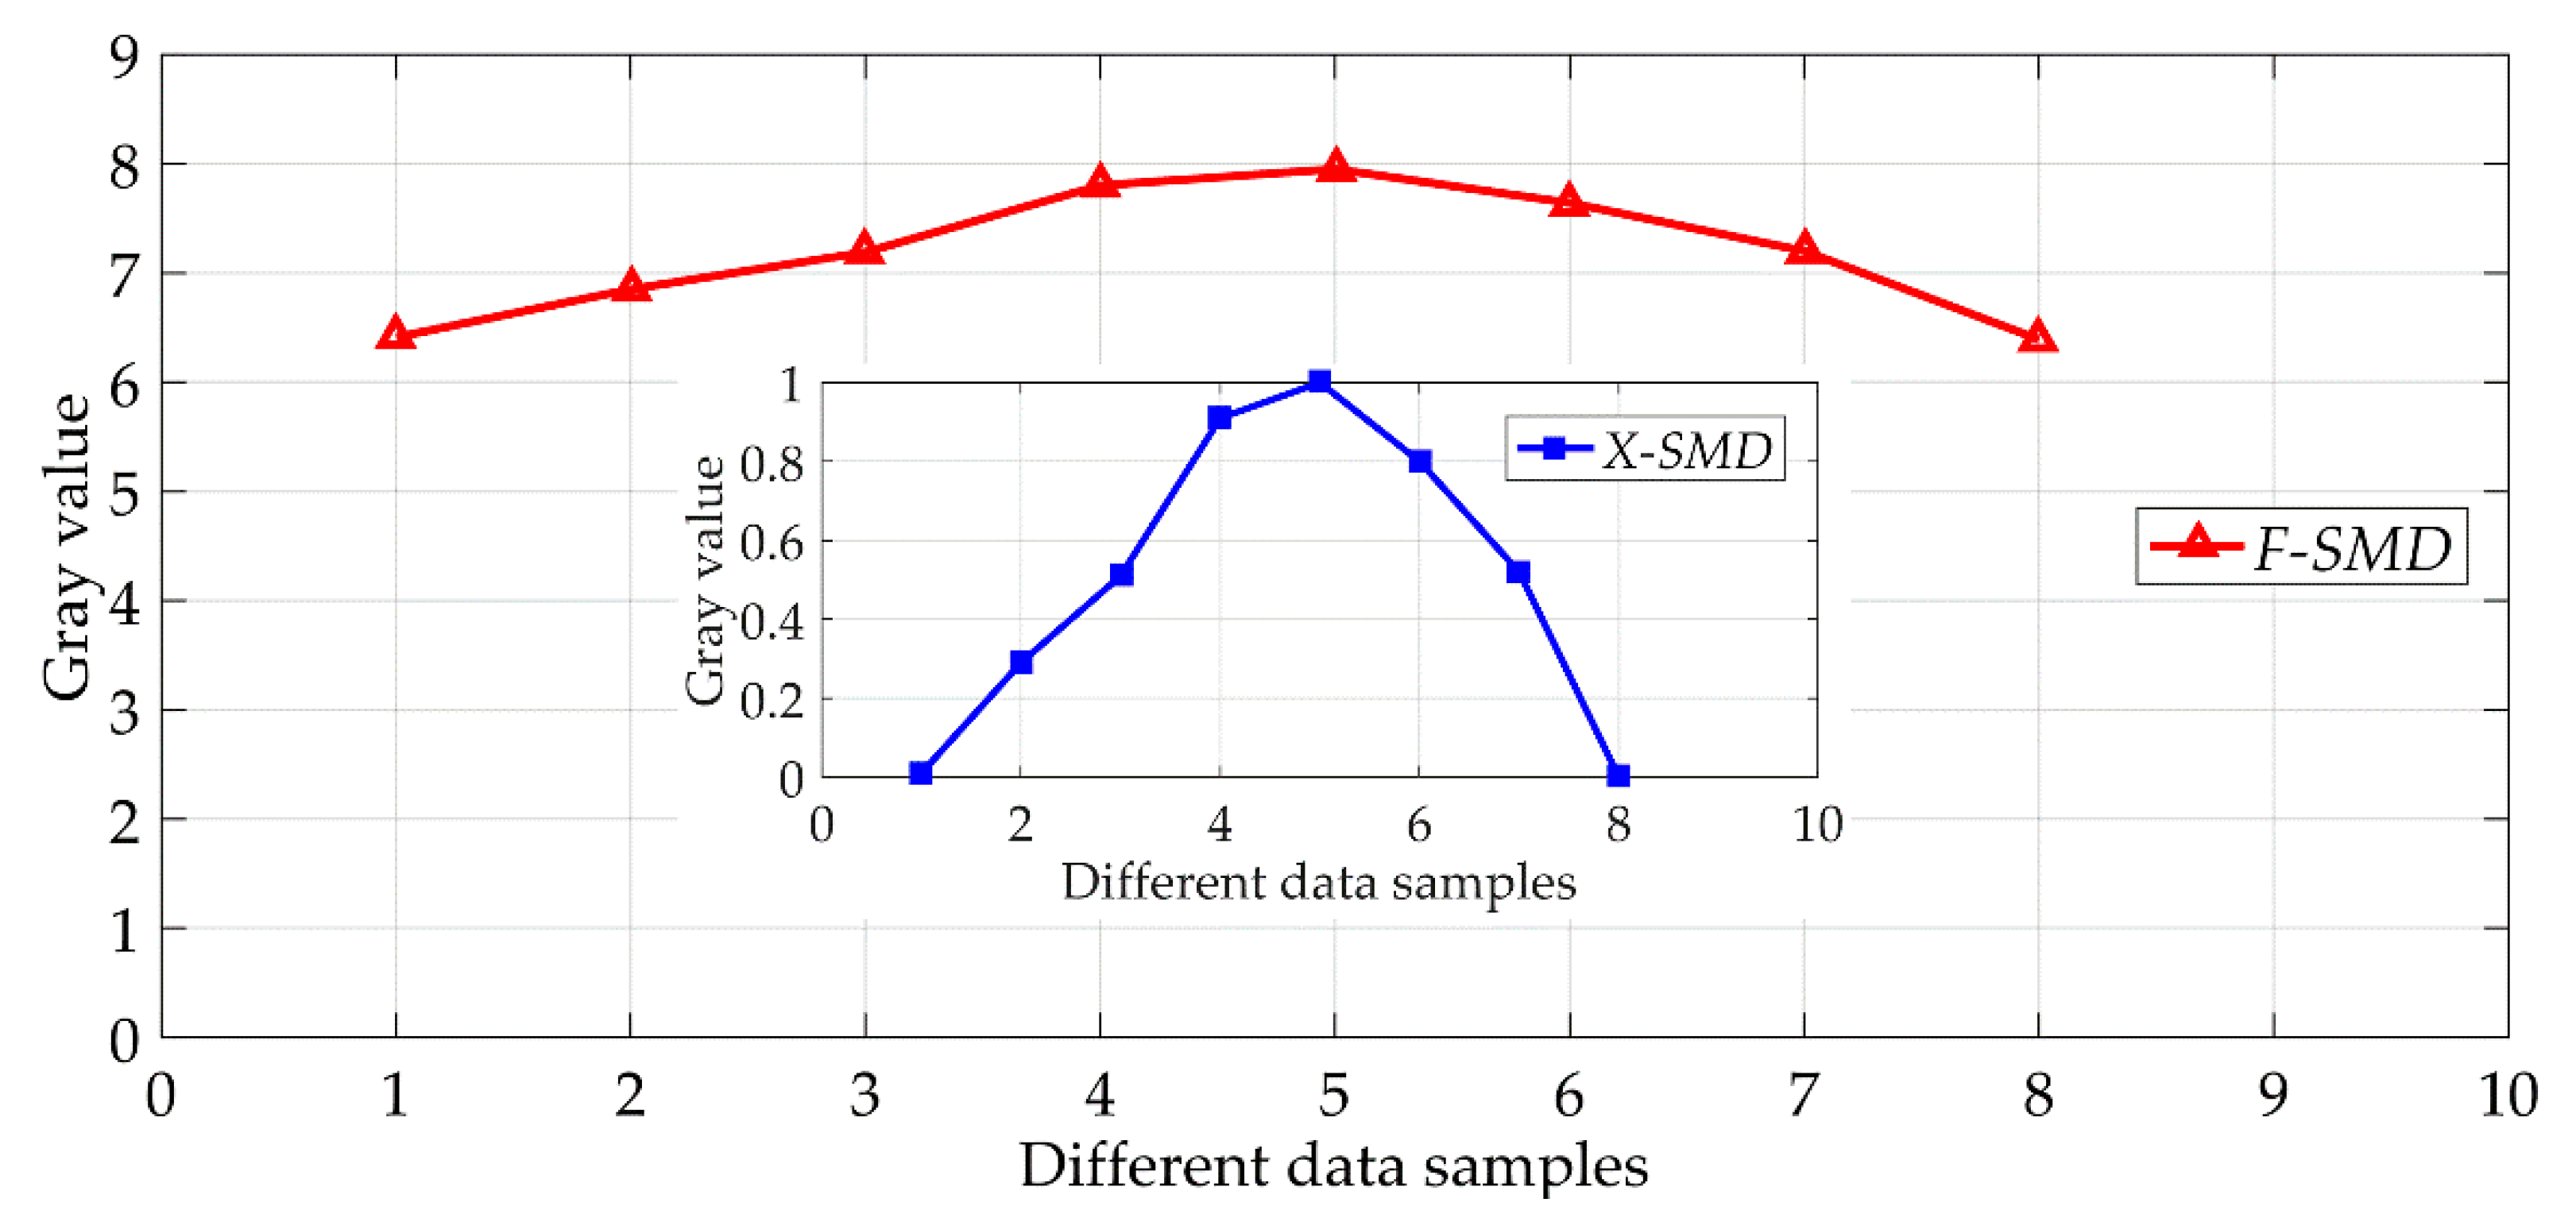
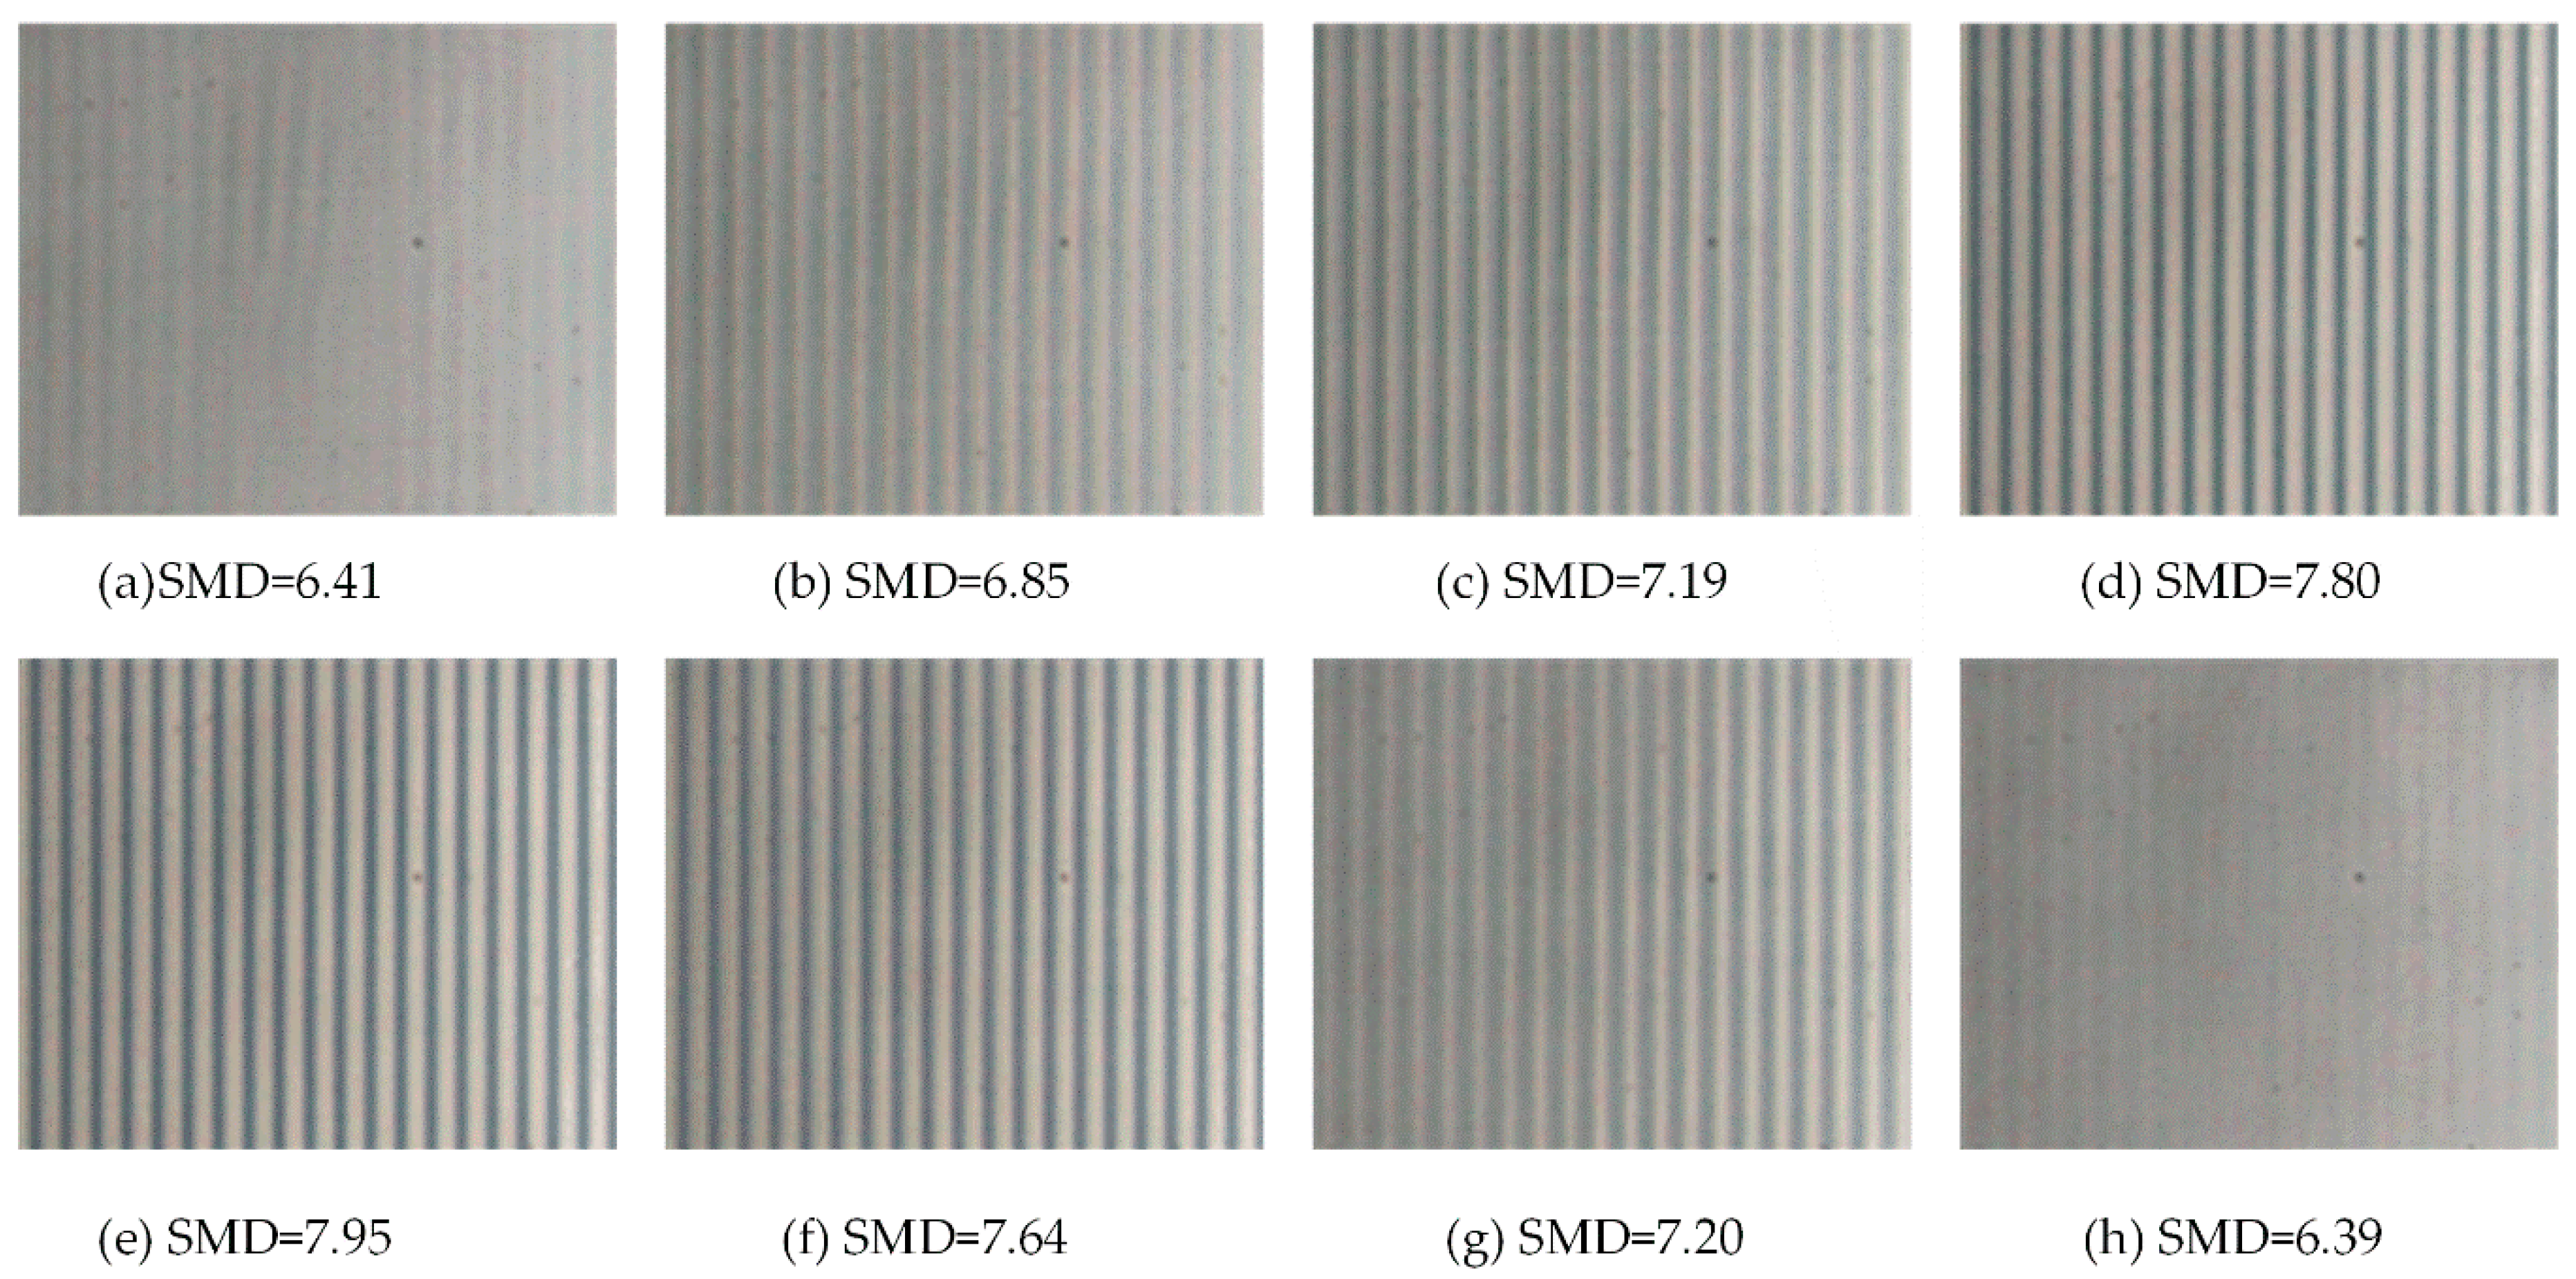
| a | b | c | d | e | f | g | h | |
|---|---|---|---|---|---|---|---|---|
| F-SMD | 6.41 | 6.85 | 7.19 | 7.80 | 7.95 | 7.64 | 7.20 | 6.39 |
| X-SMD | 0.01 | 0.29 | 0.51 | 0.91 | 1.00 | 0.80 | 0.52 | 0.00 |
© 2018 by the authors. Licensee MDPI, Basel, Switzerland. This article is an open access article distributed under the terms and conditions of the Creative Commons Attribution (CC BY) license (http://creativecommons.org/licenses/by/4.0/).
Share and Cite
Ren, D.; Zhao, Z.; Xi, J.; Li, B.; Li, Z.; Zhao, H.; Cui, L.; Xu, H. Alignment Method for Linear-Scale Projection Lithography Based on CCD Image Analysis. Sensors 2018, 18, 2442. https://doi.org/10.3390/s18082442
Ren D, Zhao Z, Xi J, Li B, Li Z, Zhao H, Cui L, Xu H. Alignment Method for Linear-Scale Projection Lithography Based on CCD Image Analysis. Sensors. 2018; 18(8):2442. https://doi.org/10.3390/s18082442
Chicago/Turabian StyleRen, Dongxu, Zexiang Zhao, Jianpu Xi, Bin Li, Zhengfeng Li, Huiying Zhao, Lujun Cui, and Hang Xu. 2018. "Alignment Method for Linear-Scale Projection Lithography Based on CCD Image Analysis" Sensors 18, no. 8: 2442. https://doi.org/10.3390/s18082442
APA StyleRen, D., Zhao, Z., Xi, J., Li, B., Li, Z., Zhao, H., Cui, L., & Xu, H. (2018). Alignment Method for Linear-Scale Projection Lithography Based on CCD Image Analysis. Sensors, 18(8), 2442. https://doi.org/10.3390/s18082442