RES-Q-Trace: A Mobile CEAS-Based Demonstrator for Multi-Component Trace Gas Detection in the MIR

 , ,
, ,
Abstract
:1. Introduction
2. Materials and Methods
2.1. CES Techniques
2.1.1. OA-CEAS
2.1.2. OF-CEAS
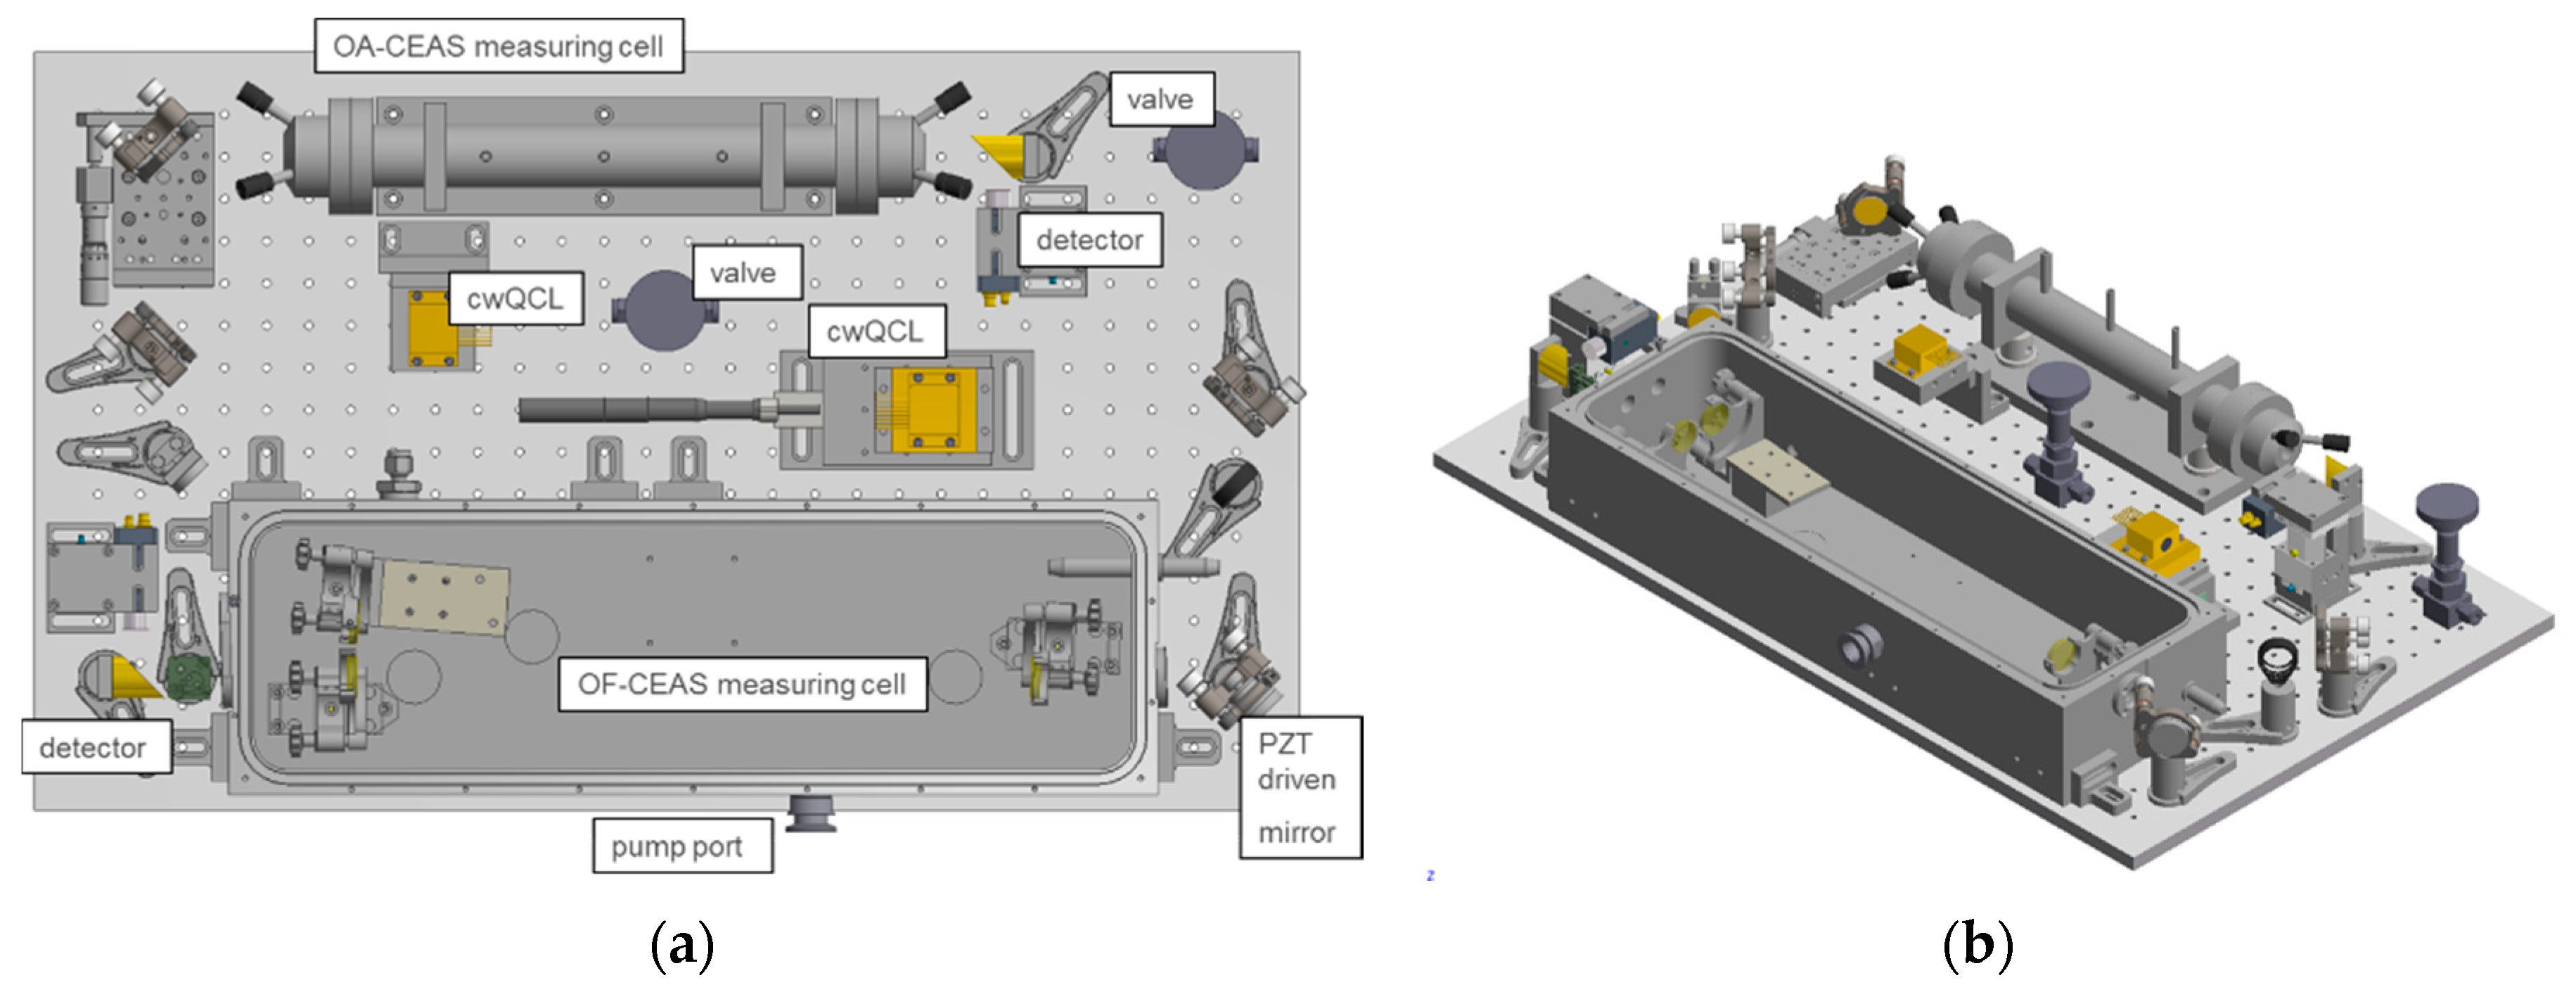
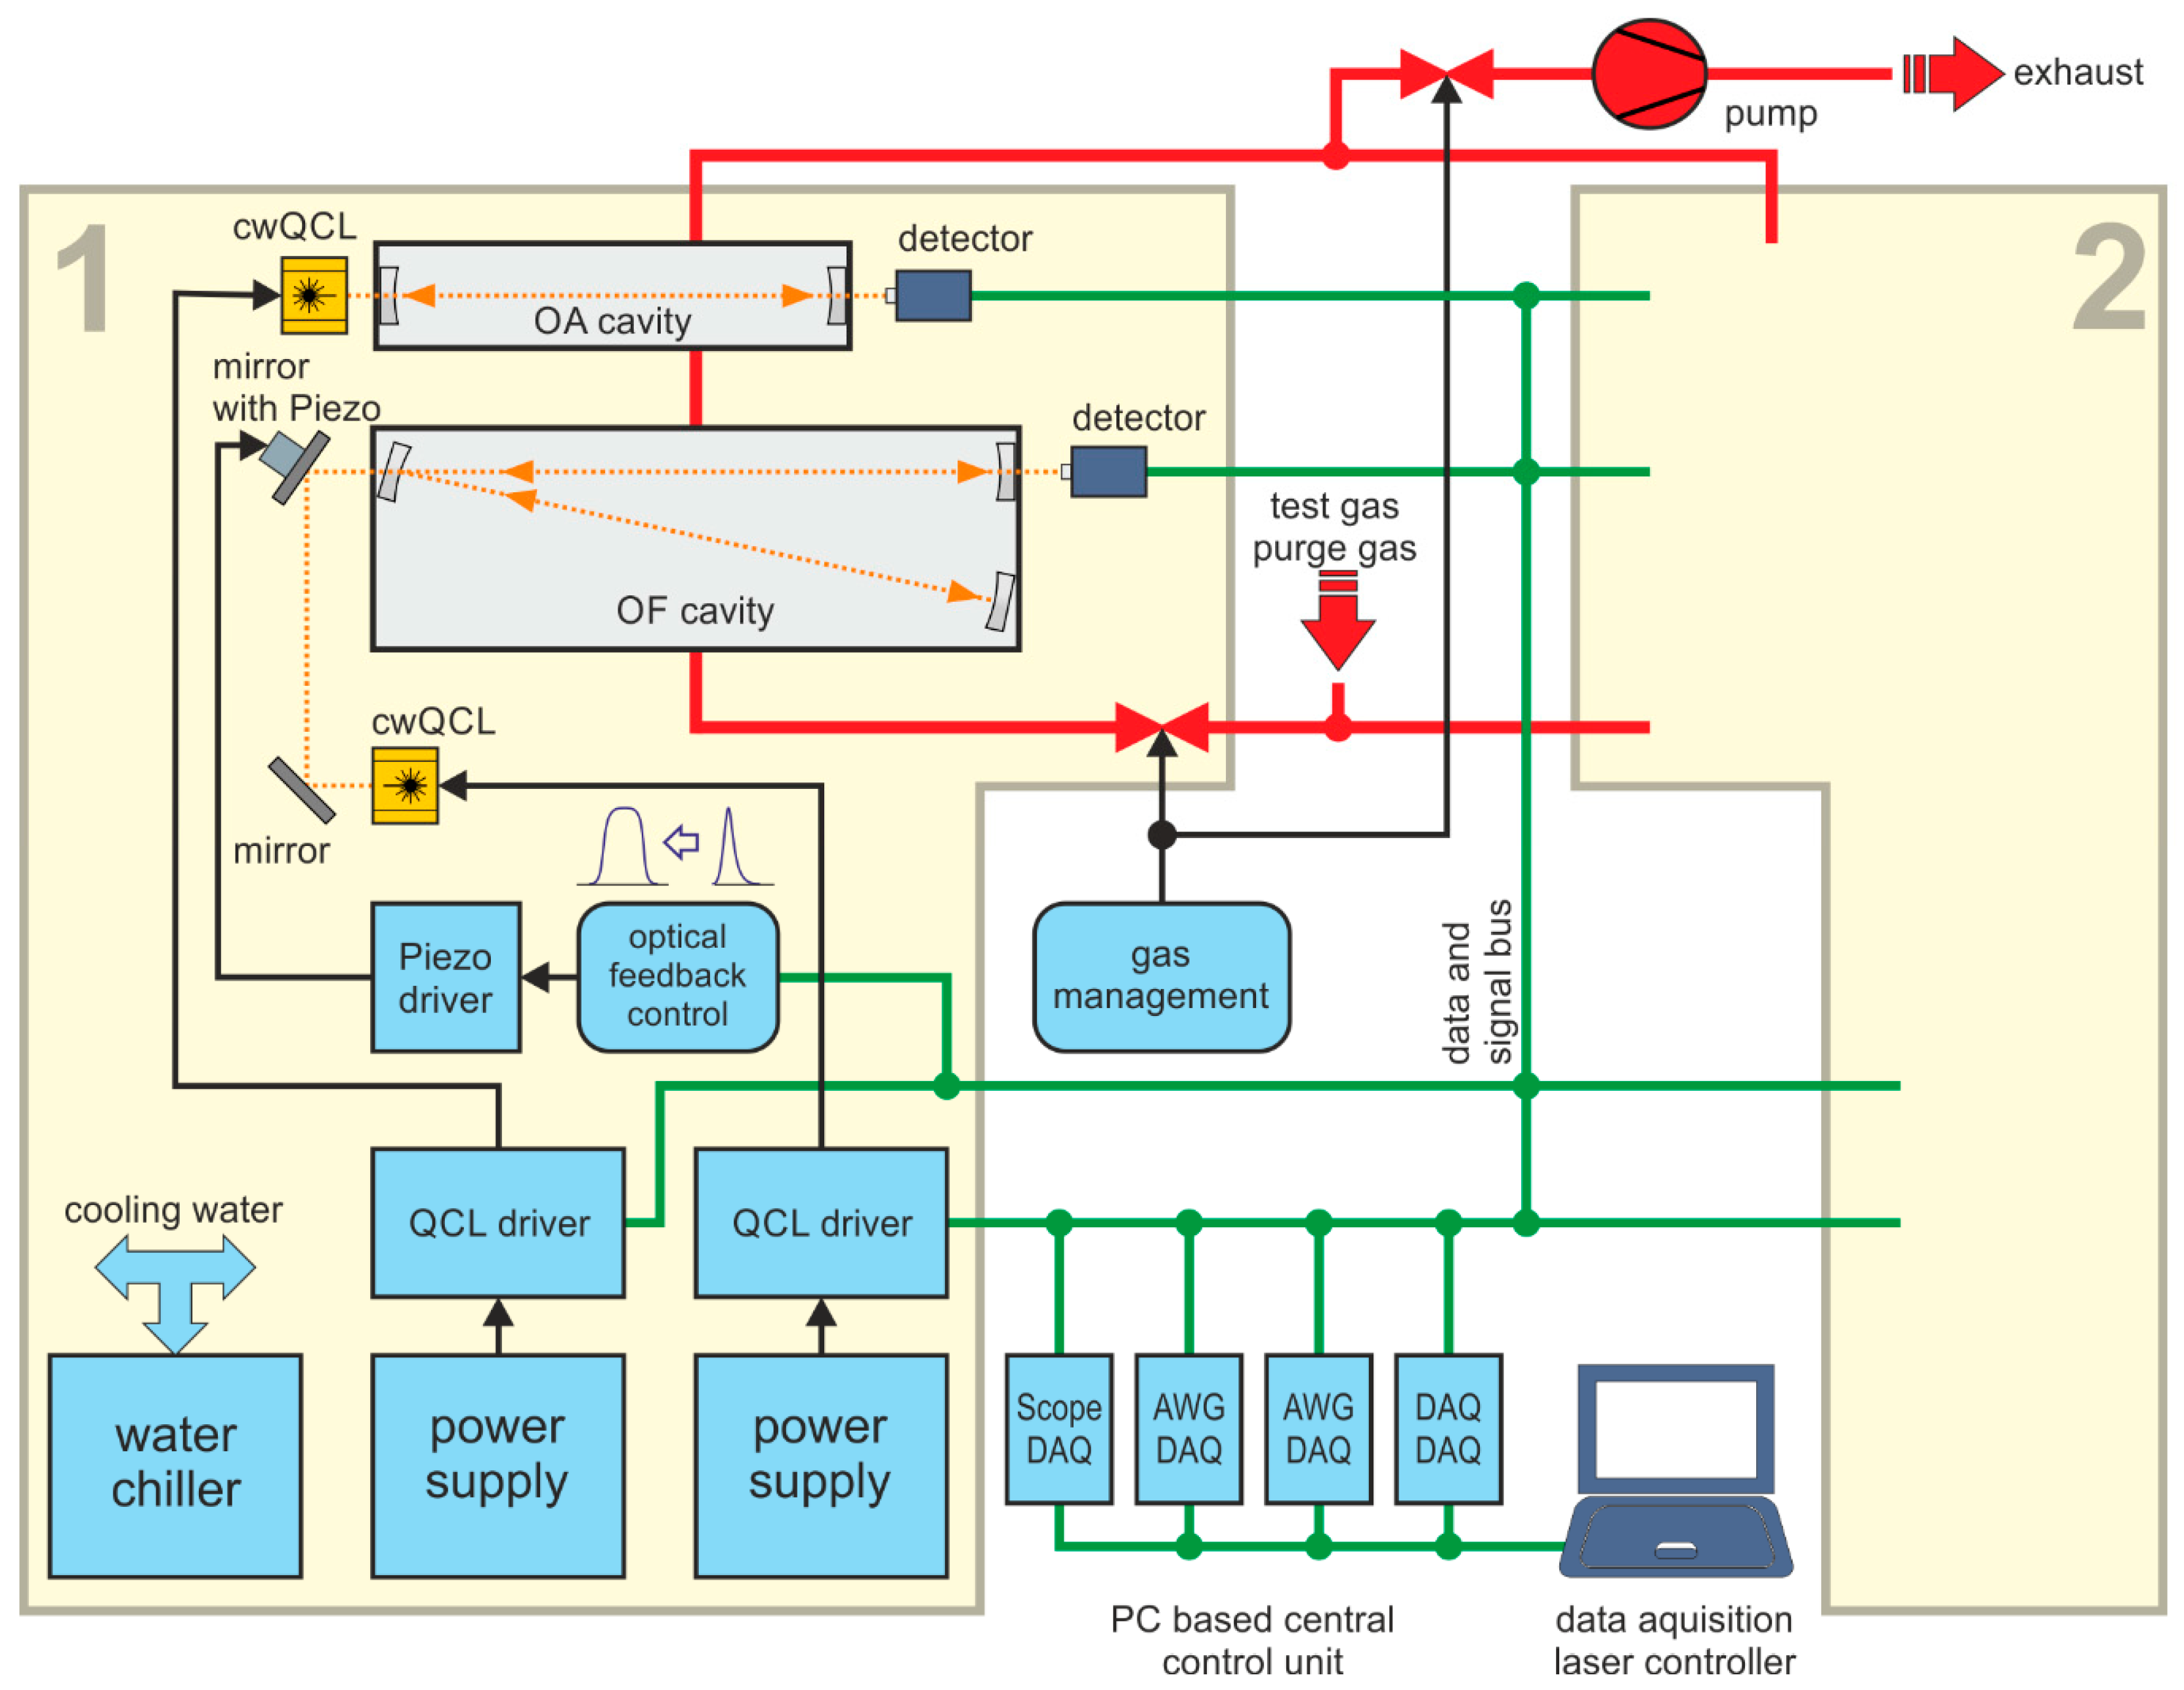
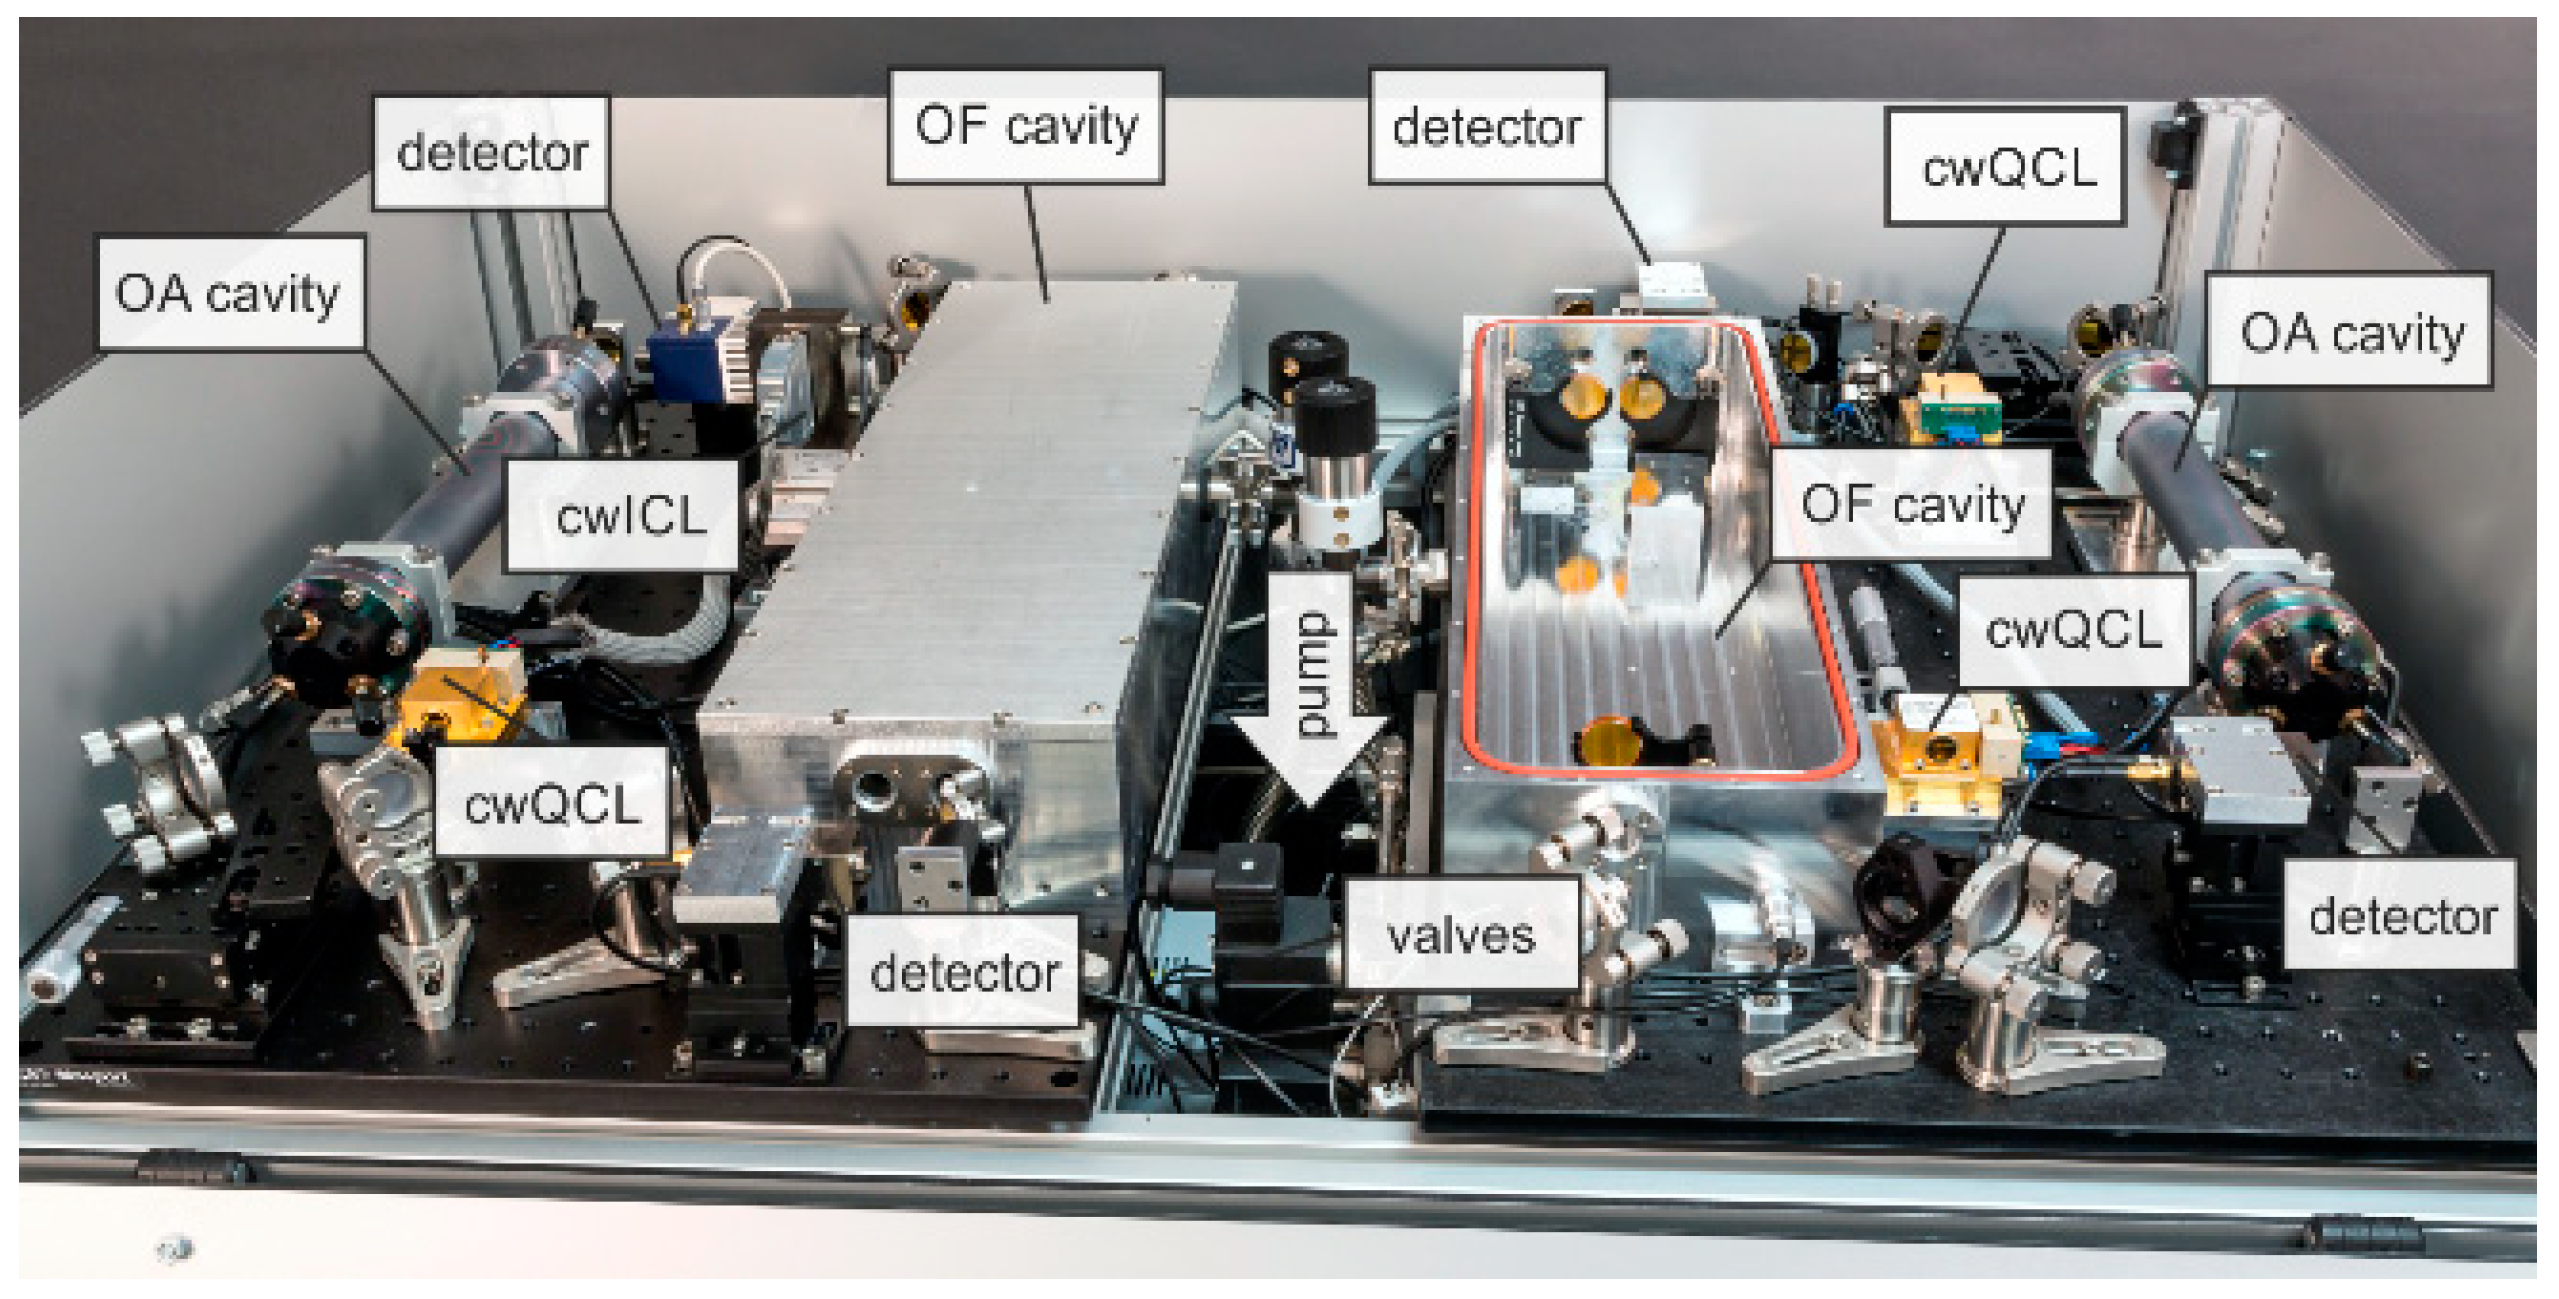
2.2. Optical Unit
2.2.1. OA-CEAS Measurement Cells
2.2.2. OF-CEAS Measurement Cells
2.2.3. Common Driver and Supply Unit
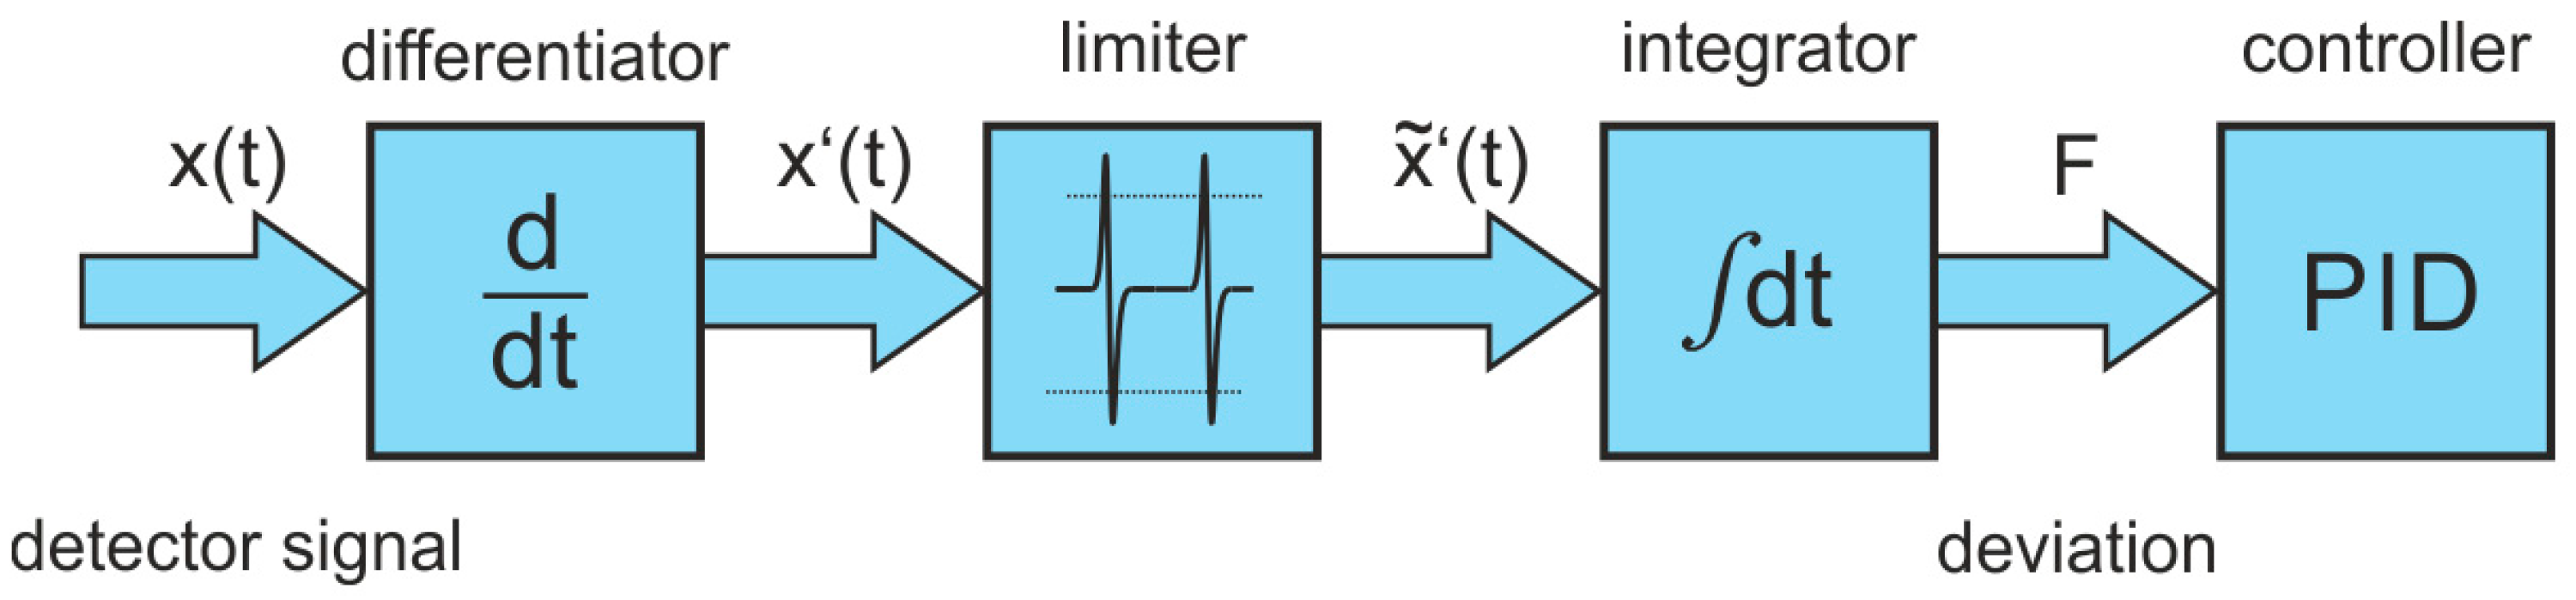
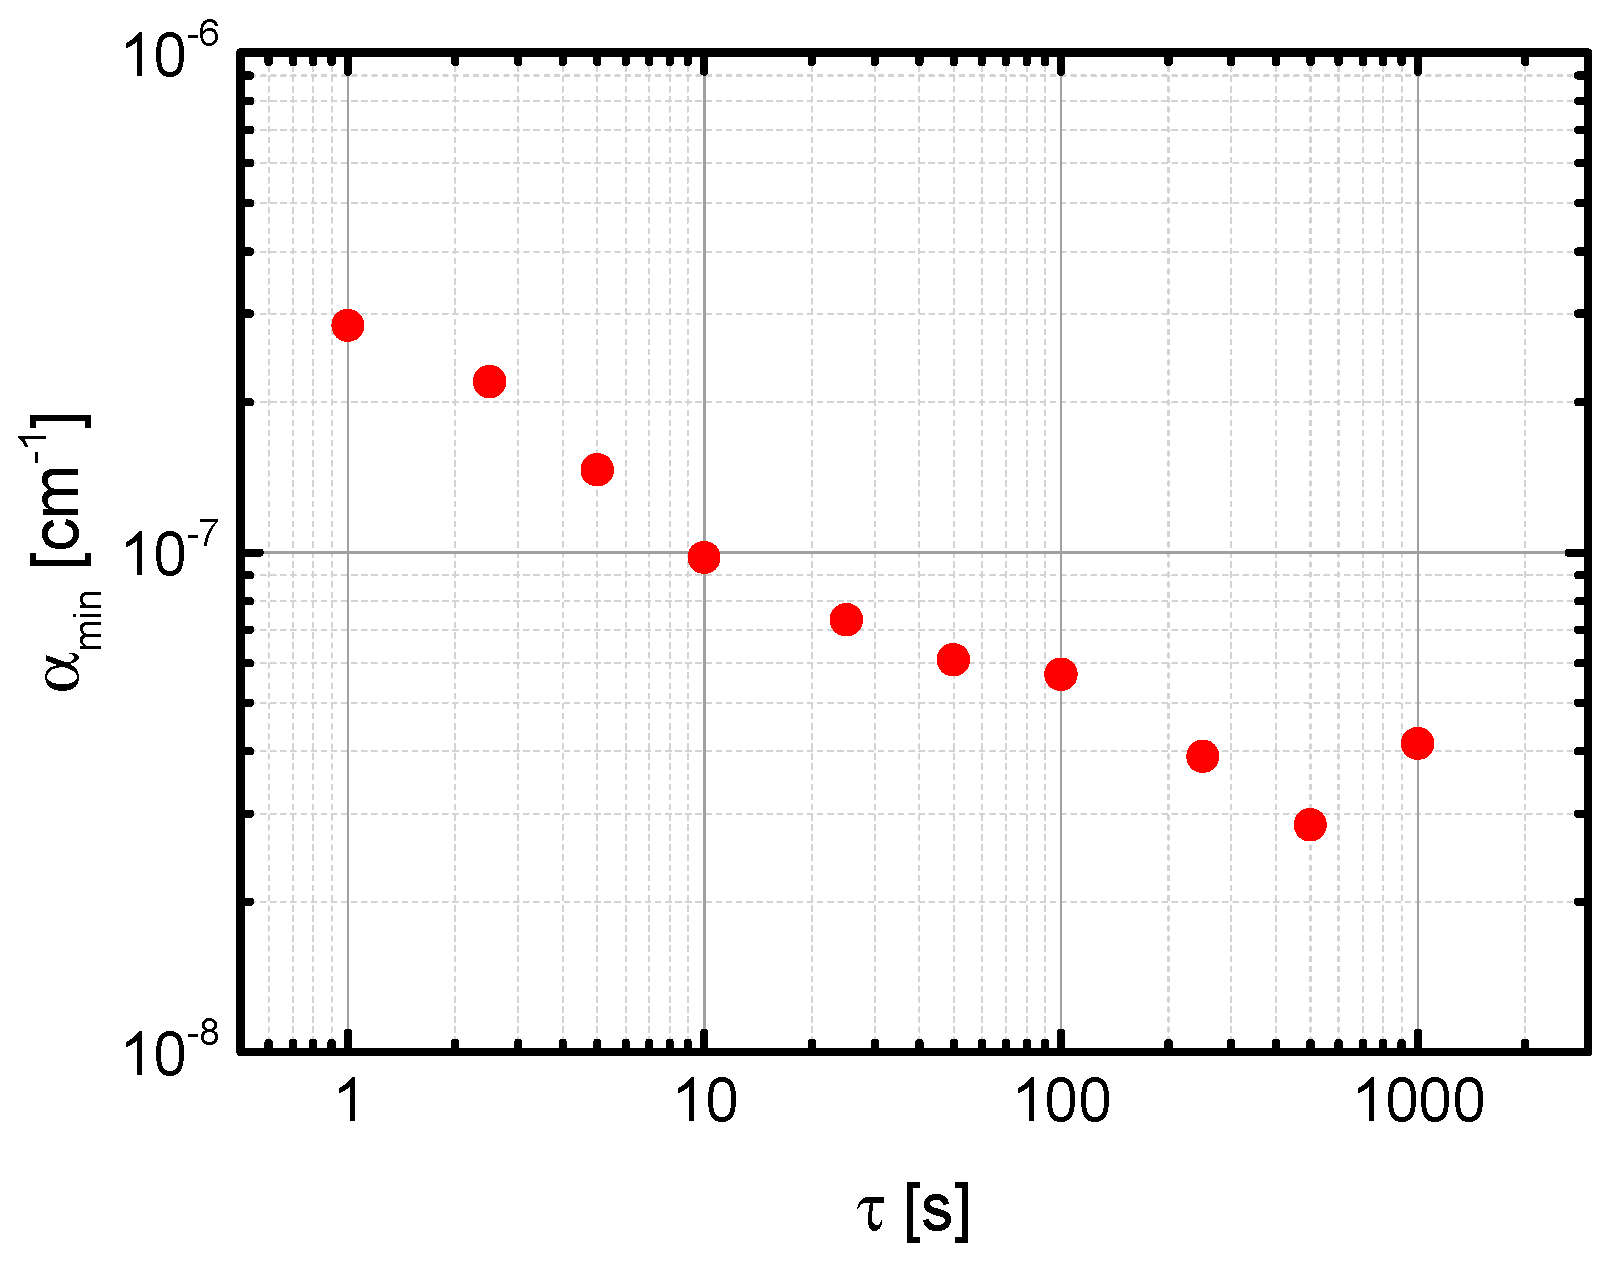
2.3. Data Processing and Analysis Technique
3. Results
3.1. OA-CEAS
3.1.1. Spectrally Resolved Single Absorption Line Profile
3.1.2. Spectrally Unresolved Congested Absorption Spectrum
3.2. OF-CEAS
4. Discussion
Author Contributions
Funding
Conflicts of Interest
References
- Wang, C.; Sahay, P. Breath Analysis Using Laser Spectroscopic Techniques: Breath Biomarkers, Spectral Fingerprints, and Detection Limits. Sensors 2009, 9, 8230. [Google Scholar] [CrossRef] [PubMed]
- Todd, M.W.; Provencal, R.A.; Owano, T.G.; Paldus, B.A.; Kachanov, A.; Vodopyanov, K.L.; Hunter, M.; Coy, S.L.; Steinfeld, J.I.; Arnold, J.T. Application of mid-infrared cavity-ringdown spectroscopy to trace explosives vapor detection using a broadly tunable (6–8 µm) optical parametric oscillator. Appl. Phys. B 2002, 75, 367–376. [Google Scholar] [CrossRef]
- Curl, R.F.; Capasso, F.; Gmachl, C.; Kosterev, A.A.; McManus, B.; Lewicki, R.; Pusharsky, M.; Wysocki, G.; Tittel, F.K. Quantum cascade lasers in chemical physics. Chem. Phys. Lett. 2010, 487, 1–18. [Google Scholar] [CrossRef]
- Li, J.S.; Chen, W.; Fischer, H. Quantum Cascade Laser Spectrometry Techniques: A New Trend in Atmospheric Chemistry. Appl. Spectrosc. Rev. 2013, 48, 523–559. [Google Scholar] [CrossRef]
- Horstjann, M.; Bakhirkin, Y.A.; Kosterev, A.A.; Curl, R.F.; Tittel, F.K.; Wong, C.M.; Hill, C.J.; Yang, R.Q. Formaldehyde sensor using interband cascade laser based quartz-enhanced photoacoustic spectroscopy. Appl. Phys. B 2004, 79, 799–803. [Google Scholar] [CrossRef]
- Röpcke, J.; Davies, P.B.; Hamann, S.; Hannemann, M.; Lang, N.; van Helden, J.H. Applying Quantum Cascade Laser Spectroscopy in Plasma Diagnostics. Photonics 2016, 3, 45. [Google Scholar] [CrossRef]
- Risby, T.H.; Tittel, F.K. Current status of midinfrared quantum and interband cascade lasers for clinical breath analysis. Opt. Eng. 2010, 49, 1123. [Google Scholar] [CrossRef]
- Brumfield, B.E.; Stewart, J.T.; Weaverm, S.L.W.; Excarra, M.D.; Howard, S.S.; Gmachl, C.F.; McCall, B.J. A quantum cascade laser cw cavity ringdown spectrometer coupled to a supersonic expansion source. Rev. Sci. Instrum. 2010, 81, 063102. [Google Scholar] [CrossRef] [PubMed]
- Wysocki, G.; Curl, R.F.; Tittel, F.K.; Maulini, R.; Bulliard, J.M.; Faist, J. Widely tunable mode-hop free external cavity quantum cascade laser for high resolution spectroscopic applications. Appl. Phys. B 2005, 81, 769–777. [Google Scholar] [CrossRef]
- Hübner, M.; Welzel, S.; Marinov, D.; Guaitella, O.; Glitsch, S.; Rousseau, A.; Röpcke, J. TRIPLE Q: A three channel quantum cascade laser absorption spectrometer for fast multiple species concentration measurements. Rev. Sci. Instrum. 2011, 82, 093102. [Google Scholar] [CrossRef] [PubMed] [Green Version]
- Shorter, J.H.; Nelson, D.D.; McManus, J.B.; Zahniser, M.S.; Milton, D.K. Multicomponent Breath Analysis With Infrared Absorption Using Room-Temperature Quantum Cascade Lasers. IEEE Sens. J. 2010, 10, 76–84. [Google Scholar] [CrossRef] [PubMed] [Green Version]
- Wysocki, G.; Bakhirkin, Y.; So, S.; Tittel, F.K.; Hill, C.J.; Yang, R.Q.; Fraser, M.P. Dual interband cascade laser based trace-gas sensor for environmental monitoring. Appl. Opt. 2007, 46, 8202–8210. [Google Scholar] [CrossRef] [PubMed]
- Jagerska, J.; Jouy, P.; Tuzson, B.; Looser, H.; Mangold, M.; Soltic, P.; Hugi, A.; Brönnimann, R.; Faist, J.; Emmenegger, L. Simultaneous measurement of NO and NO2 by dual-wavelength quantum cascade laser spectroscopy. Opt. Express 2015, 23, 1512–1522. [Google Scholar] [CrossRef] [PubMed]
- Berden, G.; Engeln, R. Cavity Ring-Down Spectroscopy: Techniques and Applications, 1st ed.; Wiley-Blackwell: West Sussex, UK, 2009. [Google Scholar]
- Miller, J.H.; Bakhirkin, Y.A.; Ajtai, T.; Tittel, F.K.; Hill, C.J.; Yang, R.Q. Detection of formaldehyde using off-axis integrated cavity output spectroscopy with an interband cascade laser. Appl. Phys. B 2006, 85, 391–396. [Google Scholar] [CrossRef]
- Welzel, S.; Engeln, R.; Röpcke, J. Quantum cascade laser based chemical sensing using optically resonant cavities. In Cavity-Enhanced Spectroscopy and Sensing; Gagliardi, G., Loock, H.-P., Eds.; Springer: Berlin, Germany, 2014; Volume 179, pp. 93–142. [Google Scholar]
- Van Helden, J.H.; Lang, N.; Macherius, U.; Zimmermann, H.; Röpcke, J. Sensitive trace gas detection with cavity enhanced absorption spectroscopy using a continuous wave external-cavity quantum cascade laser. Appl. Phys. Lett. 2013, 104, 131114. [Google Scholar] [CrossRef]
- Hamilton, D.J.; Orr-Ewing, A.J. A quantum cascade laser-based optical feedback cavity-enhanced absorption spectrometer for the simultaneous measurement of CH4 and N2O in air. Appl. Phys. B 2011, 102, 879–890. [Google Scholar] [CrossRef]
- Gorrotxategi-Carbajo, P.; Fasci, E.; Ventrillard, I.; Carras, M.; Maisons, G.; Romanini, D. Optical-feedback cavity-enhanced absorption spectroscopy with a quantum-cascade laser yields the lowest formaldehyde detection limit. Appl. Phys. B 2013, 110, 309–314. [Google Scholar] [CrossRef]
- Bergin, A.G.V.; Hancock, G.; Ritchie, G.A.D.; Weidmann, D. Linear cavity optical-feedback cavity-enhanced absorption spectroscopy with a quantum cascade laser. Opt. Lett. 2013, 38, 2475–2477. [Google Scholar] [CrossRef] [PubMed]
- Manfred, K.M.; Ritchie, G.A.D.; Lang, N.; Röpcke, J.; van Helden, J.H. Optical feedback cavity-enhanced absorption spectroscopy with a 3.24 µm interband cascade laser. Appl. Phys. Lett. 2015, 106, 221106. [Google Scholar] [CrossRef]
- Lang, N.; Macherius, U.; Wiese, M.; Zimmermann, H.; Röpcke, J.; van Helden, J.H. Sensitive CH4 detection applying quantum cascade laser based optical feedback cavity-enhanced absorption spectroscopy. Opt. Express 2016, 24, A536–A543. [Google Scholar] [CrossRef] [PubMed]
- Morville, J.; Kassi, S.; Chenevier, M.; Romanini, D. Fast, low-noise, mode-by-mode, cavity-enhanced absorption spectroscopy by diode-laser self-locking. Appl. Phys. B 2005, 80, 1027–1038. [Google Scholar] [CrossRef]
- Morville, J.; Romanini, D.; Kerstel, E. Cavity enhanced absorption spectroscopy with optical feedback. In Cavity-Enhanced Spectroscopy and Sensing; Gagliardi, G., Loock, H.-P., Eds.; Springer: Berlin, Germany, 2014; Volume 179, pp. 163–209. [Google Scholar]
- McCurdy, M.R.; Bakhirkin, Y.A.; Tittel, F.K. Quantum cascade laser-based integrated cavity output spectroscopy of exhaled nitric oxide. Appl. Phys. B 2006, 85, 445. [Google Scholar] [CrossRef]
- National Research Council of the National Academies. Existing and Potential Standoff Explosives Detection Techniques; The National Academies Press: Washington, DC, USA, 2004. [Google Scholar]
- Nadezhdinskii, A.I.; Ponurovskii, Y.Y.; Stavrovskii, D.B. Non-contact detection of explosives by means of a tunable diode laser spectroscopy. Appl. Phys. B 2008, 90, 361. [Google Scholar] [CrossRef]
- Le Marchand, L.; Wilkens, L.R.; Harwood, P.; Cooney, R.V. Use of Breath Hydrogen and Methane as Markers of Colonic Fermentation in Epidemiologic Studies: Circadian Patterns of Excretion. Environ. Health Perspect. 1992, 98, 199–202. [Google Scholar] [CrossRef] [PubMed]
- Hannemann, M.; Antufjew, A.; Borgmann, K.; Hempel, F.; Itterman, T.; Welzel, S.; Weltmann, K.D.; Völzel, H.; Röpcke, J. Influence of age and sex in exhaled breath samples investigated by means of infrared laser absorption spectroscopy. J. Breath Res. 2011, 5, 027101. [Google Scholar] [CrossRef] [PubMed]
- Harren, F.J.M.; Berkelmans, R.; Kuiper, K.; te Lintel Hekkert, S.; Scheepers, P.; Dekhuijzen, R.; Hollander, P.; Parker, D.H. On-line laser photoacoustic detection of ethene in exhaled air as biomarker of ultraviolet radiation damage of the human skin. Appl. Phys. Lett. 1999, 74, 1761. [Google Scholar] [CrossRef]
- Spanel, P.; Dryahina, K.; Smith, D. Acetone, ammonia and hydrogen cyanide in exhaled breath of several volunteers aged 4–83 years. J. Breath Res. 2007, 1, 011001. [Google Scholar] [CrossRef] [PubMed] [Green Version]
- Oxley, J.C.; Smith, J.L.; Shinde, K.; Moran, J. Determination of the vapor density of triacetone triperoxide (TATP) using a gas chromatography headspace technique. Propellants Explos. Pyrotech. 2005, 30, 127. [Google Scholar] [CrossRef]
- Dunayevskiy, I.; Tsekoun, A.; Prasanna, M.; Go, R.; Patel, C.K.N. High-sensitivity detection of triacetone triperoxide (TATP) and its precursor acetone. Appl. Opt. 2007, 46. [Google Scholar] [CrossRef]
- Gagliardi, G.; Loock, H.-P. Cavity-Enhanced Spectroscopy and Sensing, 1st ed.; Springer: Berlin, Germany, 2014. [Google Scholar]
- Paul, J.B.; Lapson, L.; Anderson, J.G. Ultrasensitive absorption spectroscopy with a high-finesse optical cavity and off-axis alignment. Appl. Opt. 2001, 40, 4904. [Google Scholar] [CrossRef] [PubMed]
- Mazurenka, M.; Orr-Ewing, A.J.; Peverall, R.; Ritchie, G.A.D. Cavity ring-down and cavity enhanced spectroscopy using diode lasers. Annu. Rep. Prog. Chem. Sect. C 2005, 101, 100–142. [Google Scholar] [CrossRef]
- Van Helden, J.H.; Peverall, R.; Ritchie, G.A.D. Cavity Enhanced Techniques Using Continous Wave Lasers. In Cavity Ring-Down Spectroscopy: Techniques and Applications; Berden, G., Engeln, R., Eds.; Wiley-Blackwell: West Sussex, UK, 2009; pp. 27–56. [Google Scholar]
- Centeno, R.; Mandon, J.; Cristescu, S.M.; Harren, F.J.M. Sensitivity enhancement in off-axis integrated cavity output spectroscopy. Opt. Express 2014, 22, 027985. [Google Scholar] [CrossRef] [PubMed] [Green Version]
- Baran, S.G.; Hancock, G.; Peverall, R.; Ritchie, G.A.D.; van Leeuwen, N.J. Optical feedback cavity enhanced absorption spectroscopy with diode lasers. Analyst 2009, 134, 243–249. [Google Scholar] [CrossRef] [PubMed]
- Horstjann, M.; Nenakhov, V.; Burrows, J.P. Frequency stabilization of blue extended cavity diode lasers by external cavity optical feedback. Appl. Phys. B 2012, 106, 261–266. [Google Scholar] [CrossRef]
- Rothman, L.S.; Gordon, I.E.; Babikov, Y.; Barbe, A.; Benner, D.C.; Bernath, P.F.; Birk, M.; Bizzocchi, L.; Boudon, V.; Brown, L.R.; et al. The HITRAN Database 2012. J. Quant. Spectrosc. Radiat. Transf. 2013, 130, 4–50. [Google Scholar] [CrossRef] [Green Version]
- Sharpe, S.W.; Johnson, T.J.; Sams, R.L.; Chu, P.M.; Rhoderick, G.C.; Johnson, P.A. Gas-phase databases for quantitative infrared spectroscopy. Appl. Spectrosc. 2004, 58, 1452–1461. [Google Scholar] [CrossRef] [PubMed]
- Menzel, L.; Kosterev, A.A.; Curl, R.F.; Tittel, F.K.; Gmachl, C.; Capasso, F.; Sivco, D.L.; Baillargeon, J.N.; Hutchinson, A.L.; Cho, A.Y.; et al. Spectroscopic detection of biological NO with a quantum cascade laser. Appl. Phys. B 2001, 72, 859–863. [Google Scholar] [CrossRef] [PubMed]
- Courtillot, I.; Morville, J.; Motto-Ros, V.; Romanini, D. Sub-ppb NO2 detection by optical feedback cavity-enhanced absorption spectroscopy. Appl. Phys. B 2006, 85, 407–412. [Google Scholar] [CrossRef]
- Kassi, S.; Chenevier, M.; Gianfrani, L.; Salhi, A.; Rouillard, Y.; Ouvrard, A.; Romanini, D. Looking into the volcano with a MIR-IR DFB diode laser and Cavity Enhanced Absorption Spectroscopy. Opt. Express 2006, 14, 11442–11452. [Google Scholar] [CrossRef] [PubMed]
- Bell, C.L.; van Helden, J.-P.H.; Blaikie, T.P.J.; Hancock, G.; van Leeuwen, N.J.; Peverall, R.; Ritchie, G.A.D. Noise-immune cavity-enhanced optical heterodyne detection of HO2 in the near-infrared range. J. Phys. Chem. A 2012, 116, 5090–5099. [Google Scholar] [CrossRef] [PubMed]
- Baren, R.E.; Parrish, M.E.; Shafer, K.H.; Harward, C.N.; Shi, Q.; Nelson, D.D.; McManus, J.B.; Zahniser, M.S. Quad quantum cascade laser spectrometer with dual gas cells for the simultaneous analysis of mainstream and sidestream cigarette smoke. Spectrochim. Acta Part A 2004, 60, 3437. [Google Scholar] [CrossRef] [PubMed]
- Schiller, C.L.; Bozem, H.; Gurk, C.; Parchatka, U.; Königstedt, R.; Harris, G.W.; Lelieveld, J.; Fscher, H. Applications of quantum cascade lasers for sensitive trace gas measurements of CO, CH4, N2O and HCHO. Appl. Phys. B 2008, 92, 419. [Google Scholar] [CrossRef]
- Catoire, V.; Robert, C.; Chartier, M.; Jacquet, P.; Guimbaud, C.; Krysztofiak, G. The SPIRIT airborne instrument: A three-channel infrared absorption spectrometer with quantum cascade lasers for in situ atmospheric trace-gas measurements. Appl. Phys. B 2017, 123, 244. [Google Scholar] [CrossRef]
- Richard, L.; Ventrillard, I.; Chau, G.; Jaulin, K.; Kerstel, E.; Romanini, D. Optical-feedback cavity- enhanced absorption spectroscopy with an interband cascade laser: application to SO2 trace analysis. Appl. Phys. B 2016, 122, 247. [Google Scholar] [CrossRef]
- Manfred, K.M.; Hunter, K.M.; Ciaffoni, L.; Ritchie, G.A.D. ICL-Based OF-CEAS: A Sensitive Tool for Analytical Chemistry. Anal. Chem. 2016, 89, 902. [Google Scholar] [CrossRef] [PubMed]


| Gas | Relevance | Required LOD [ppb] | Reference |
|---|---|---|---|
| NO | lung and respiratory diseases | 0.5 | [25] |
| decomposition product of nitrogen-based explosives, such as TNT, AN, PETN, and RDX 1 to name a view | 0.001–1 | [26,27] | |
| N2O | decomposition product of nitrogen-based explosives, such as TNT, AN, PETN, and RDX 1 to name a view | 0.001–1 | [26,27] |
| CH4 | intestinal diseases | 20 | [28,29] |
| C2H4 | oxidative stress | 0.01 | [30] |
| C3H6O | diabetes | 25 | [31] |
| precursor of TATP 2 | 25 | [32,33] |
| Gas | v | Transition | Spectral Position [cm−1] | CEAS Method | Laser | αmin [cm−1] | Measurement time [s] | LOD @ 1013 hPa [ppb] |
|---|---|---|---|---|---|---|---|---|
| NO | 1 | R(5.5) doublet | 1897.0 | OA-CEAS | QCL | 3.5 × 10⁻⁸ | 1 | 2 |
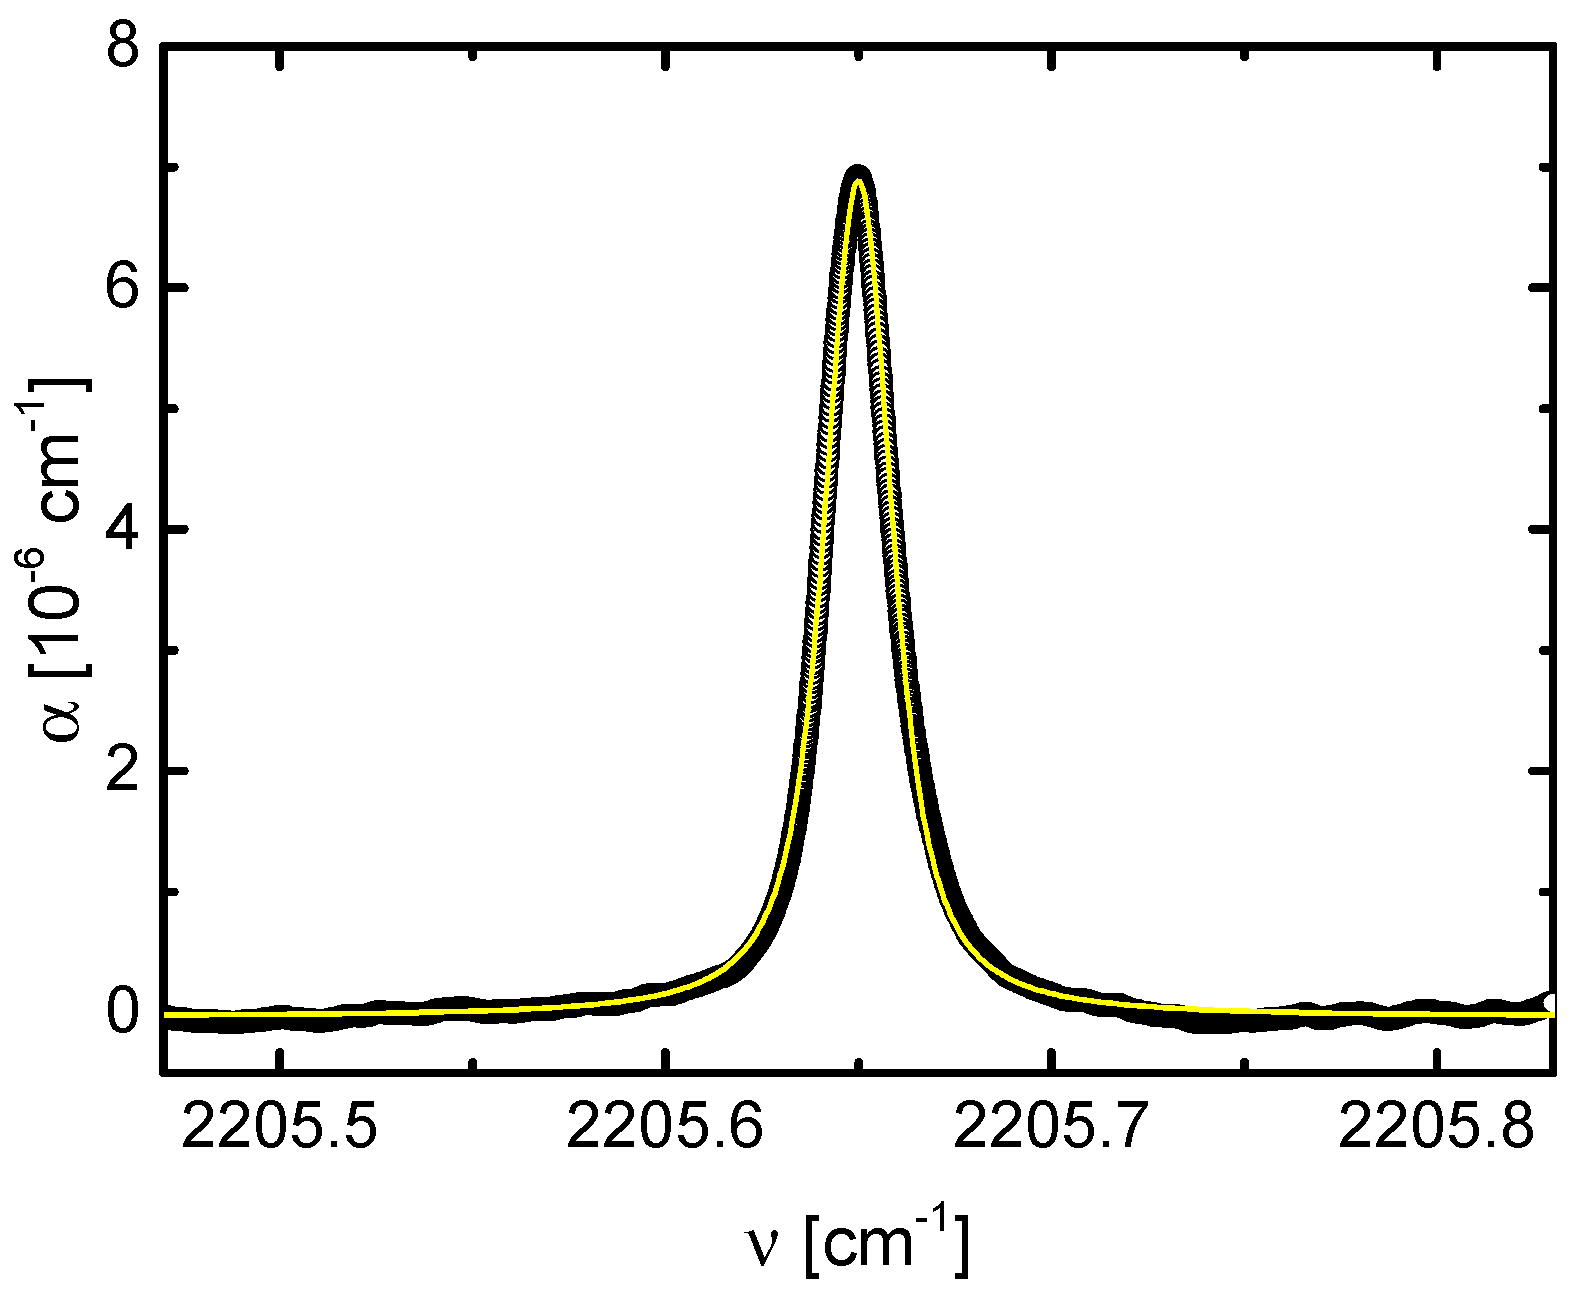
| N2O | 4 | P(20) | 2205.7 | OA-CEAS | QCL | 2.8 × 10⁻⁸ | 500 | 0.3 |
| CH4 | 4 | 11 F1 9 ← 12 F2 1 | 1230.1 | OA-CEAS | QCL | 1.3 × 10⁻⁸ | 1 | 22 |
| 3 | 7 A1 8 ← 6 A2 1 7 F1 27 ← 6 F2 1 7 E 8 ← 6 E 1 | 3086.1 | OF-CEAS | ICL | 7.9 × 10⁻⁷ | 2 | 3 | |
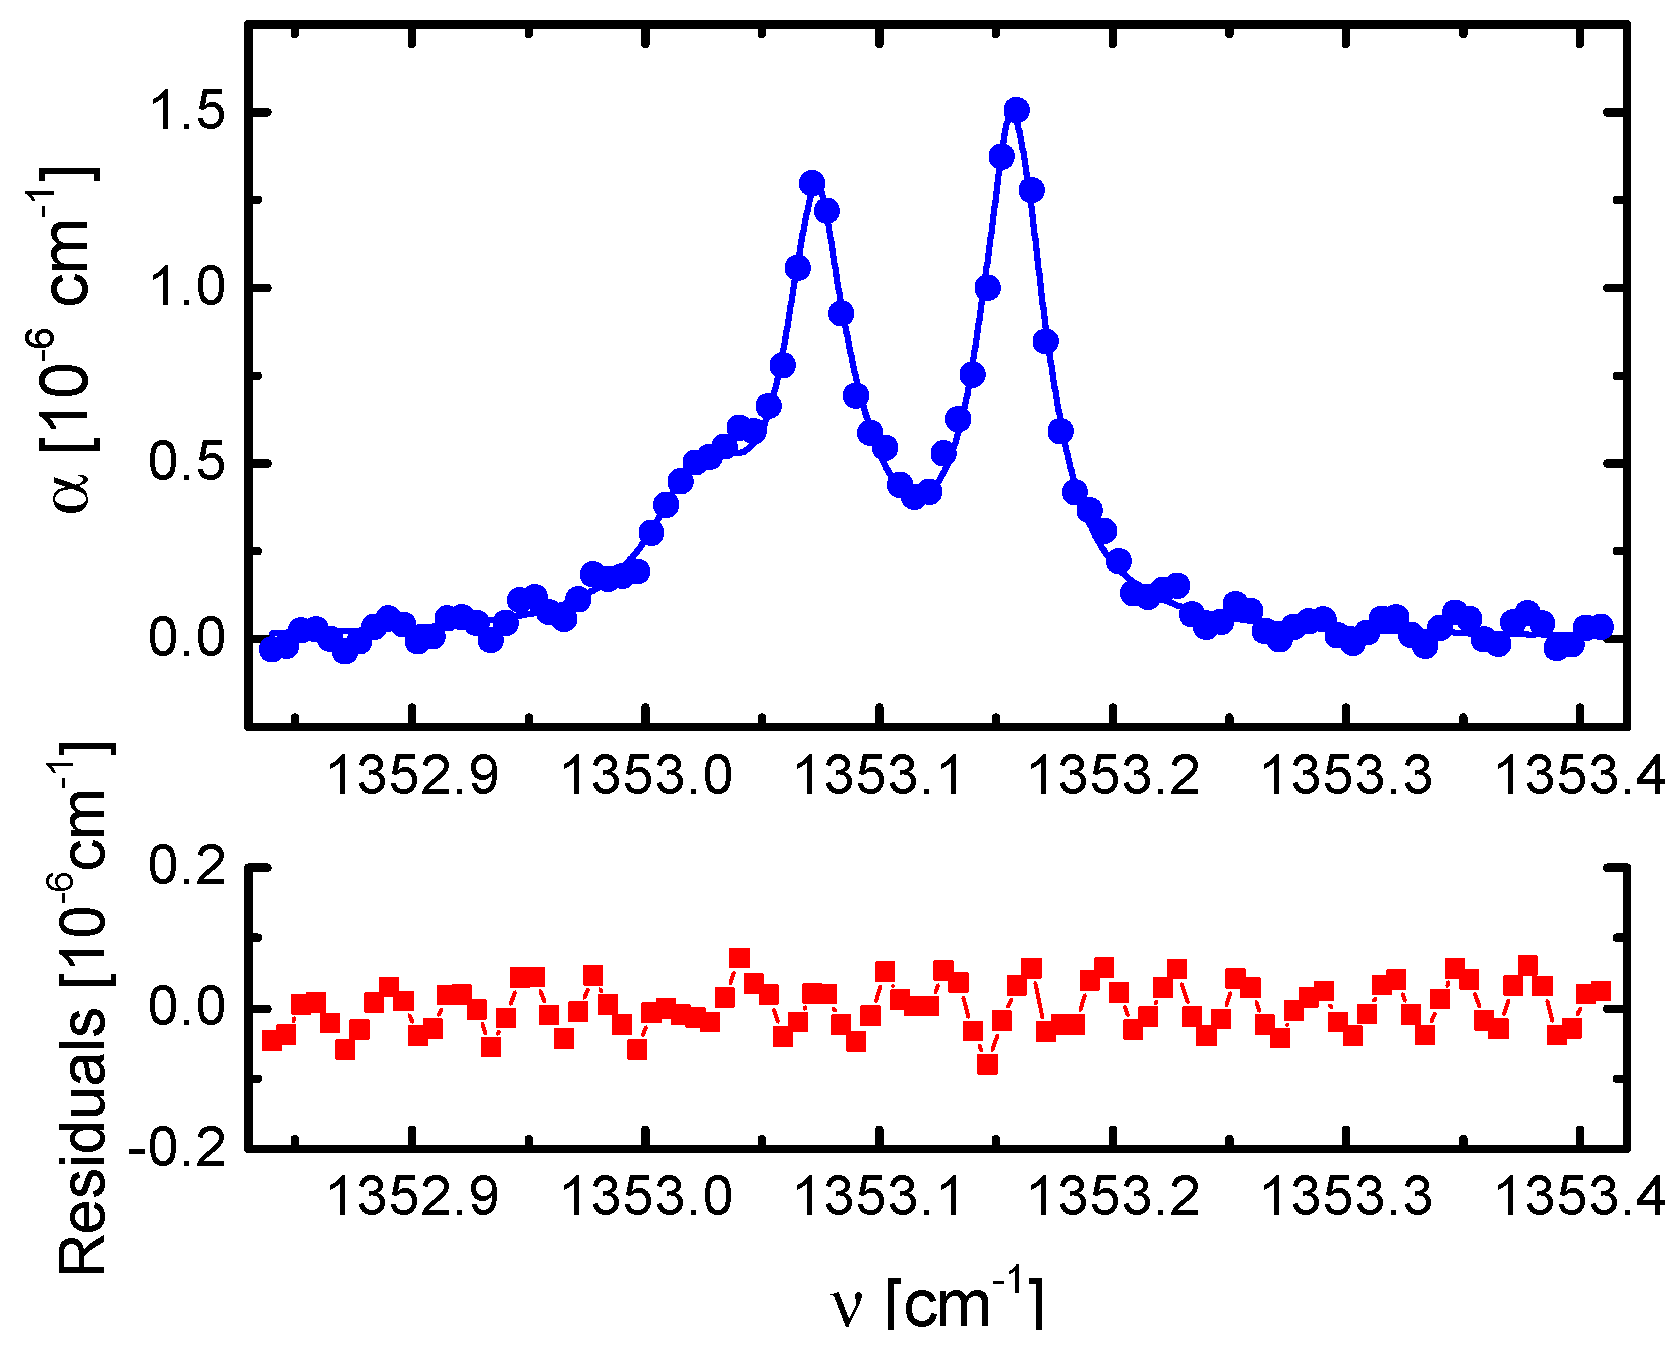
| 4 | 9 A2 1 ← 8 A1 1 9 F2 2 ← 8 F1 1 9 E 1 ← 8 E 2 | 1353.1 | OF-CEAS | QCL | 5.3 × 10⁻¹⁰ | 50 | 0.04 | |
| C2H4 | 7 | Q (18) | 986.0 | OA-CEAS | QCL | 3.9 × 10⁻⁸ | 1 | 39 |
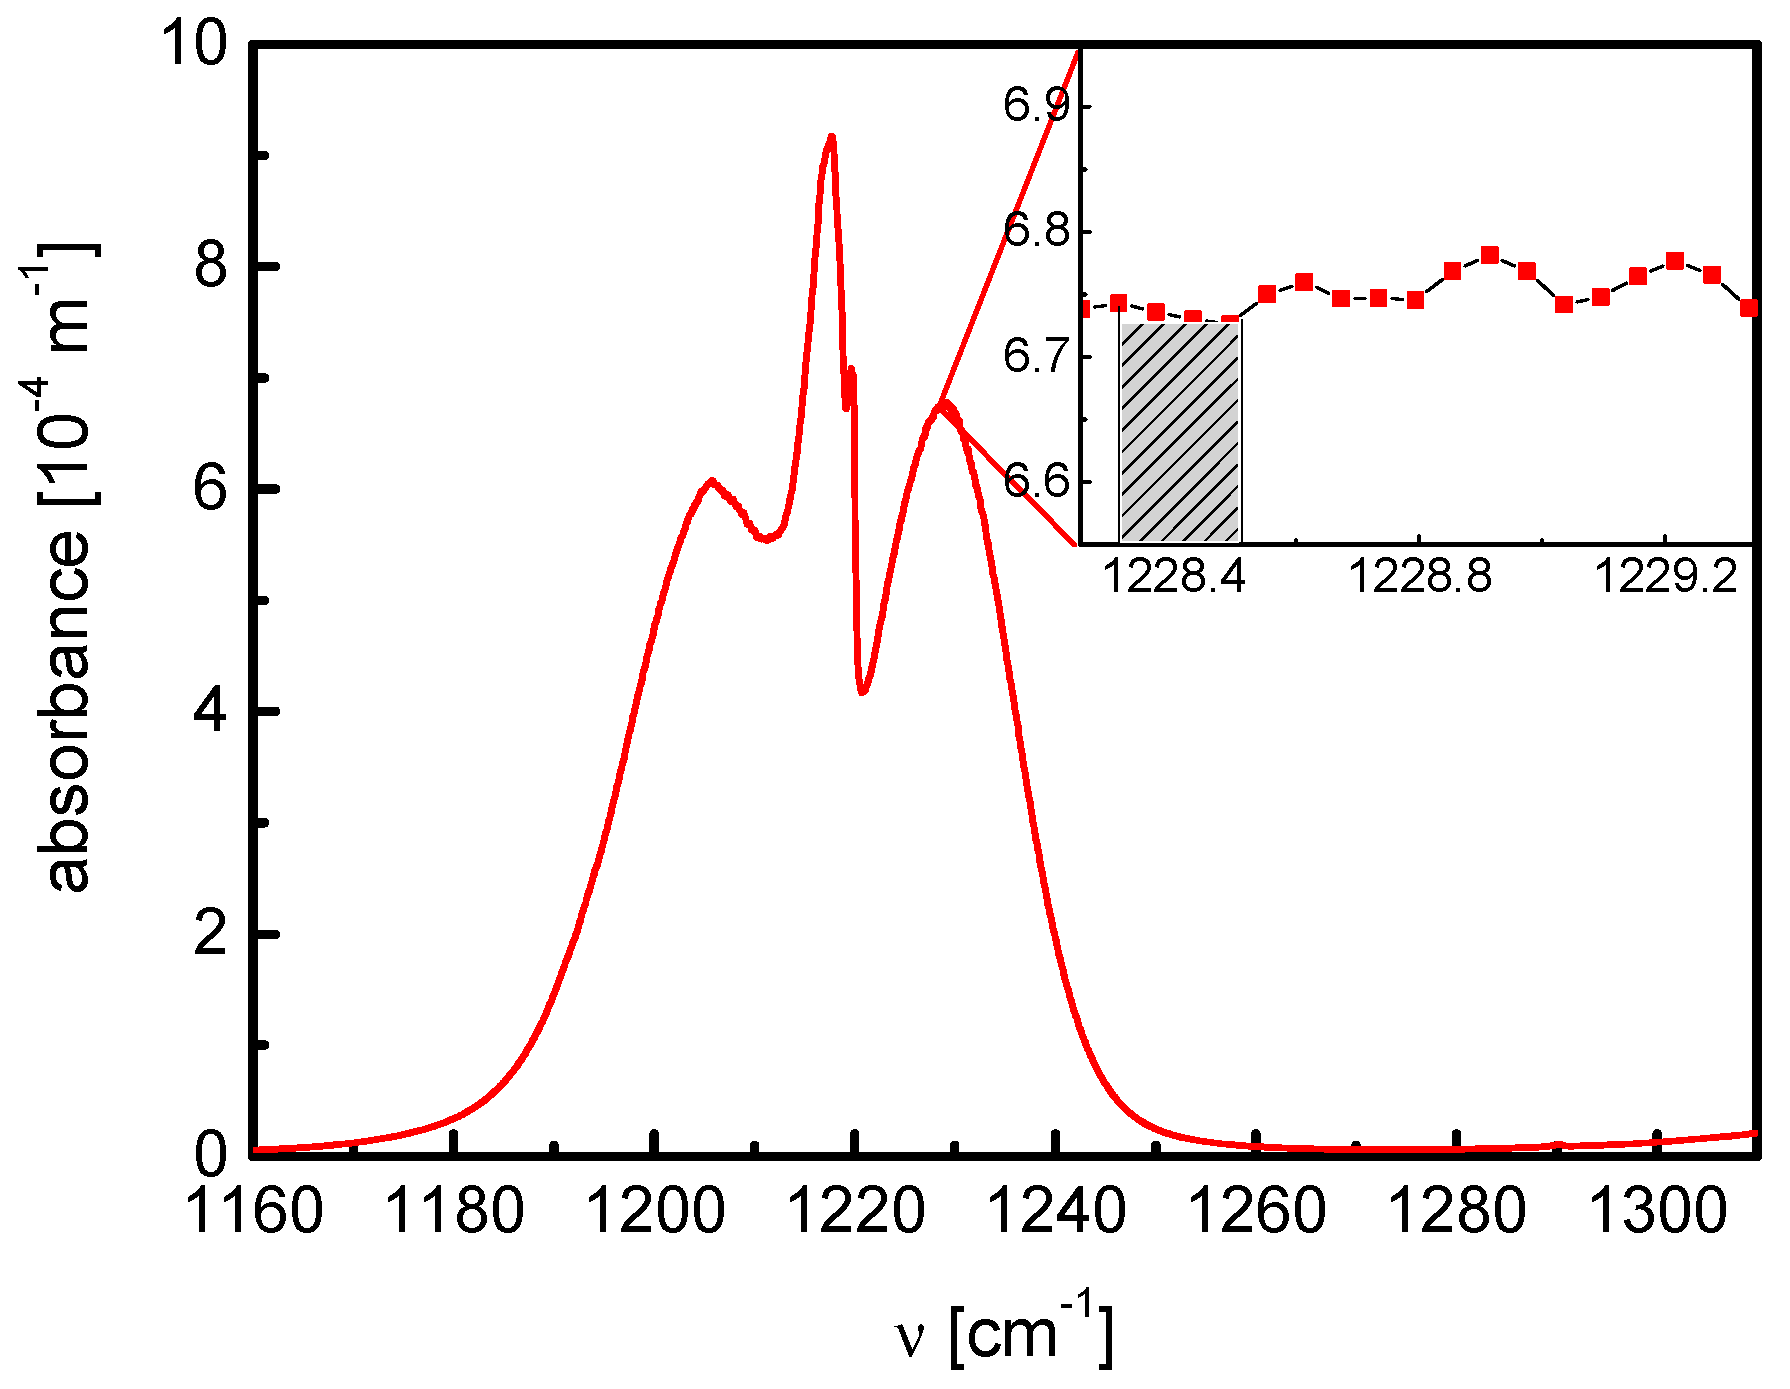
| C3H6O | 17 | C-C stretch unresolved | 1228.3–1228.5 | OA-CEAS | QCL | 3.0 × 10⁻⁸ | 1 | 10 |
© 2018 by the authors. Licensee MDPI, Basel, Switzerland. This article is an open access article distributed under the terms and conditions of the Creative Commons Attribution (CC BY) license (http://creativecommons.org/licenses/by/4.0/).
Share and Cite
Lang, N.; Macherius, U.; Zimmermann, H.; Glitsch, S.; Wiese, M.; Röpcke, J.; Van Helden, J.-P.H. RES-Q-Trace: A Mobile CEAS-Based Demonstrator for Multi-Component Trace Gas Detection in the MIR. Sensors 2018, 18, 2058. https://doi.org/10.3390/s18072058
Lang N, Macherius U, Zimmermann H, Glitsch S, Wiese M, Röpcke J, Van Helden J-PH. RES-Q-Trace: A Mobile CEAS-Based Demonstrator for Multi-Component Trace Gas Detection in the MIR. Sensors. 2018; 18(7):2058. https://doi.org/10.3390/s18072058
Chicago/Turabian StyleLang, Norbert, Uwe Macherius, Henrik Zimmermann, Sven Glitsch, Mathias Wiese, Jürgen Röpcke, and Jean-Pierre H. Van Helden. 2018. "RES-Q-Trace: A Mobile CEAS-Based Demonstrator for Multi-Component Trace Gas Detection in the MIR" Sensors 18, no. 7: 2058. https://doi.org/10.3390/s18072058
APA StyleLang, N., Macherius, U., Zimmermann, H., Glitsch, S., Wiese, M., Röpcke, J., & Van Helden, J.-P. H. (2018). RES-Q-Trace: A Mobile CEAS-Based Demonstrator for Multi-Component Trace Gas Detection in the MIR. Sensors, 18(7), 2058. https://doi.org/10.3390/s18072058