Probe of Alcohol Structures in the Gas and Liquid States Using C–H Stretching Raman Spectroscopy


Abstract
1. Introduction
2. Materials and Methods
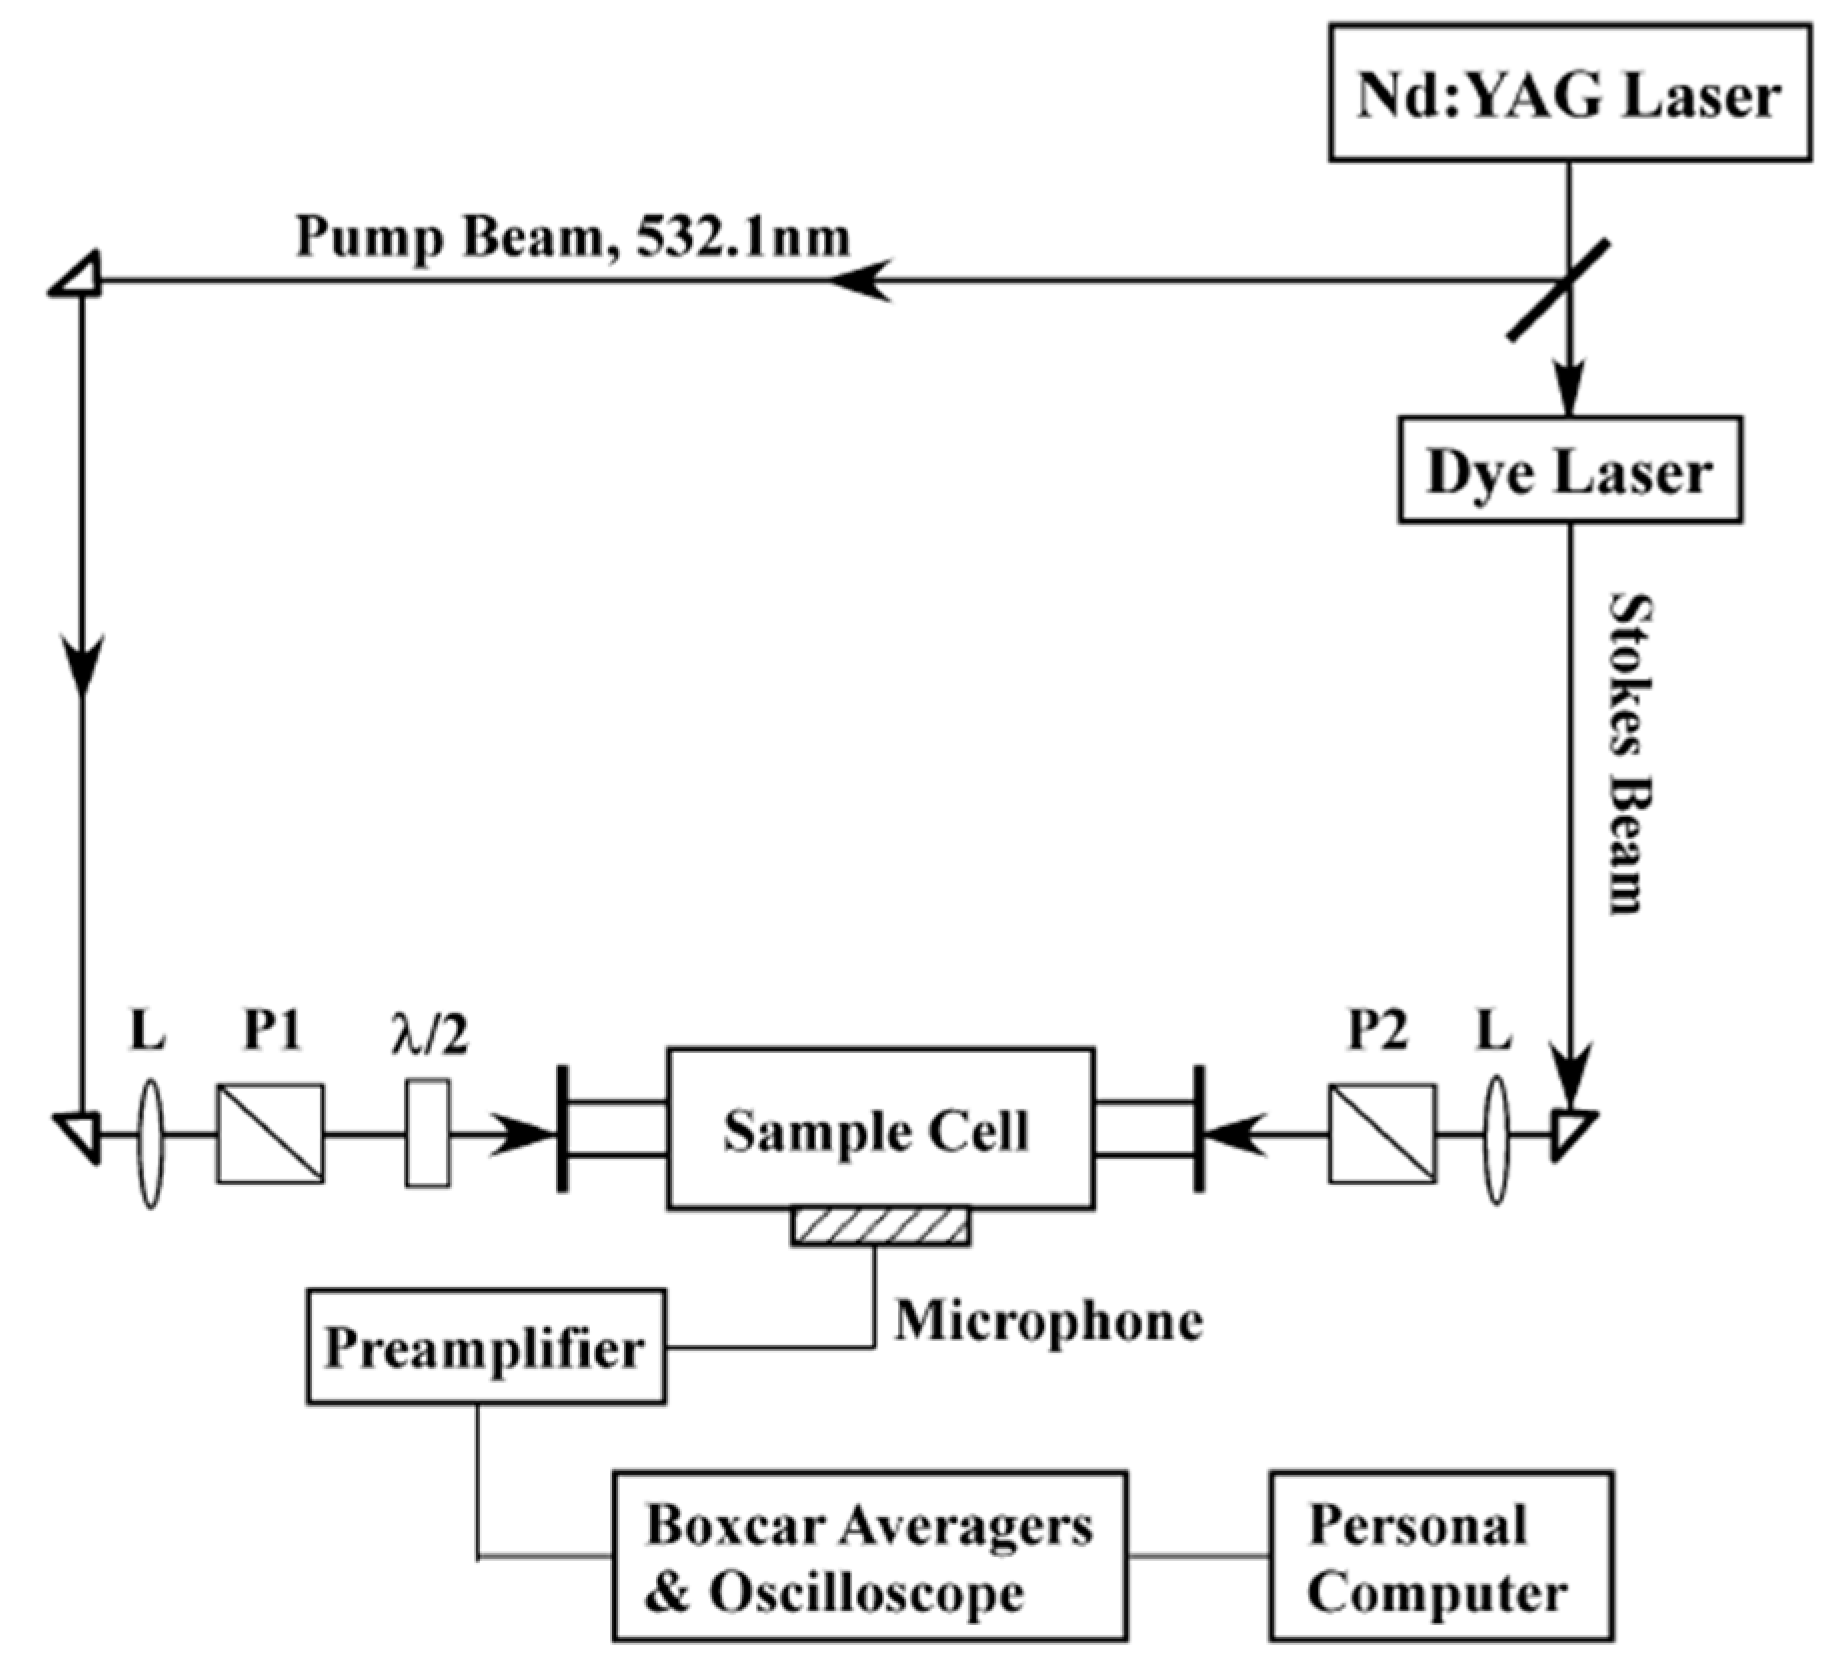
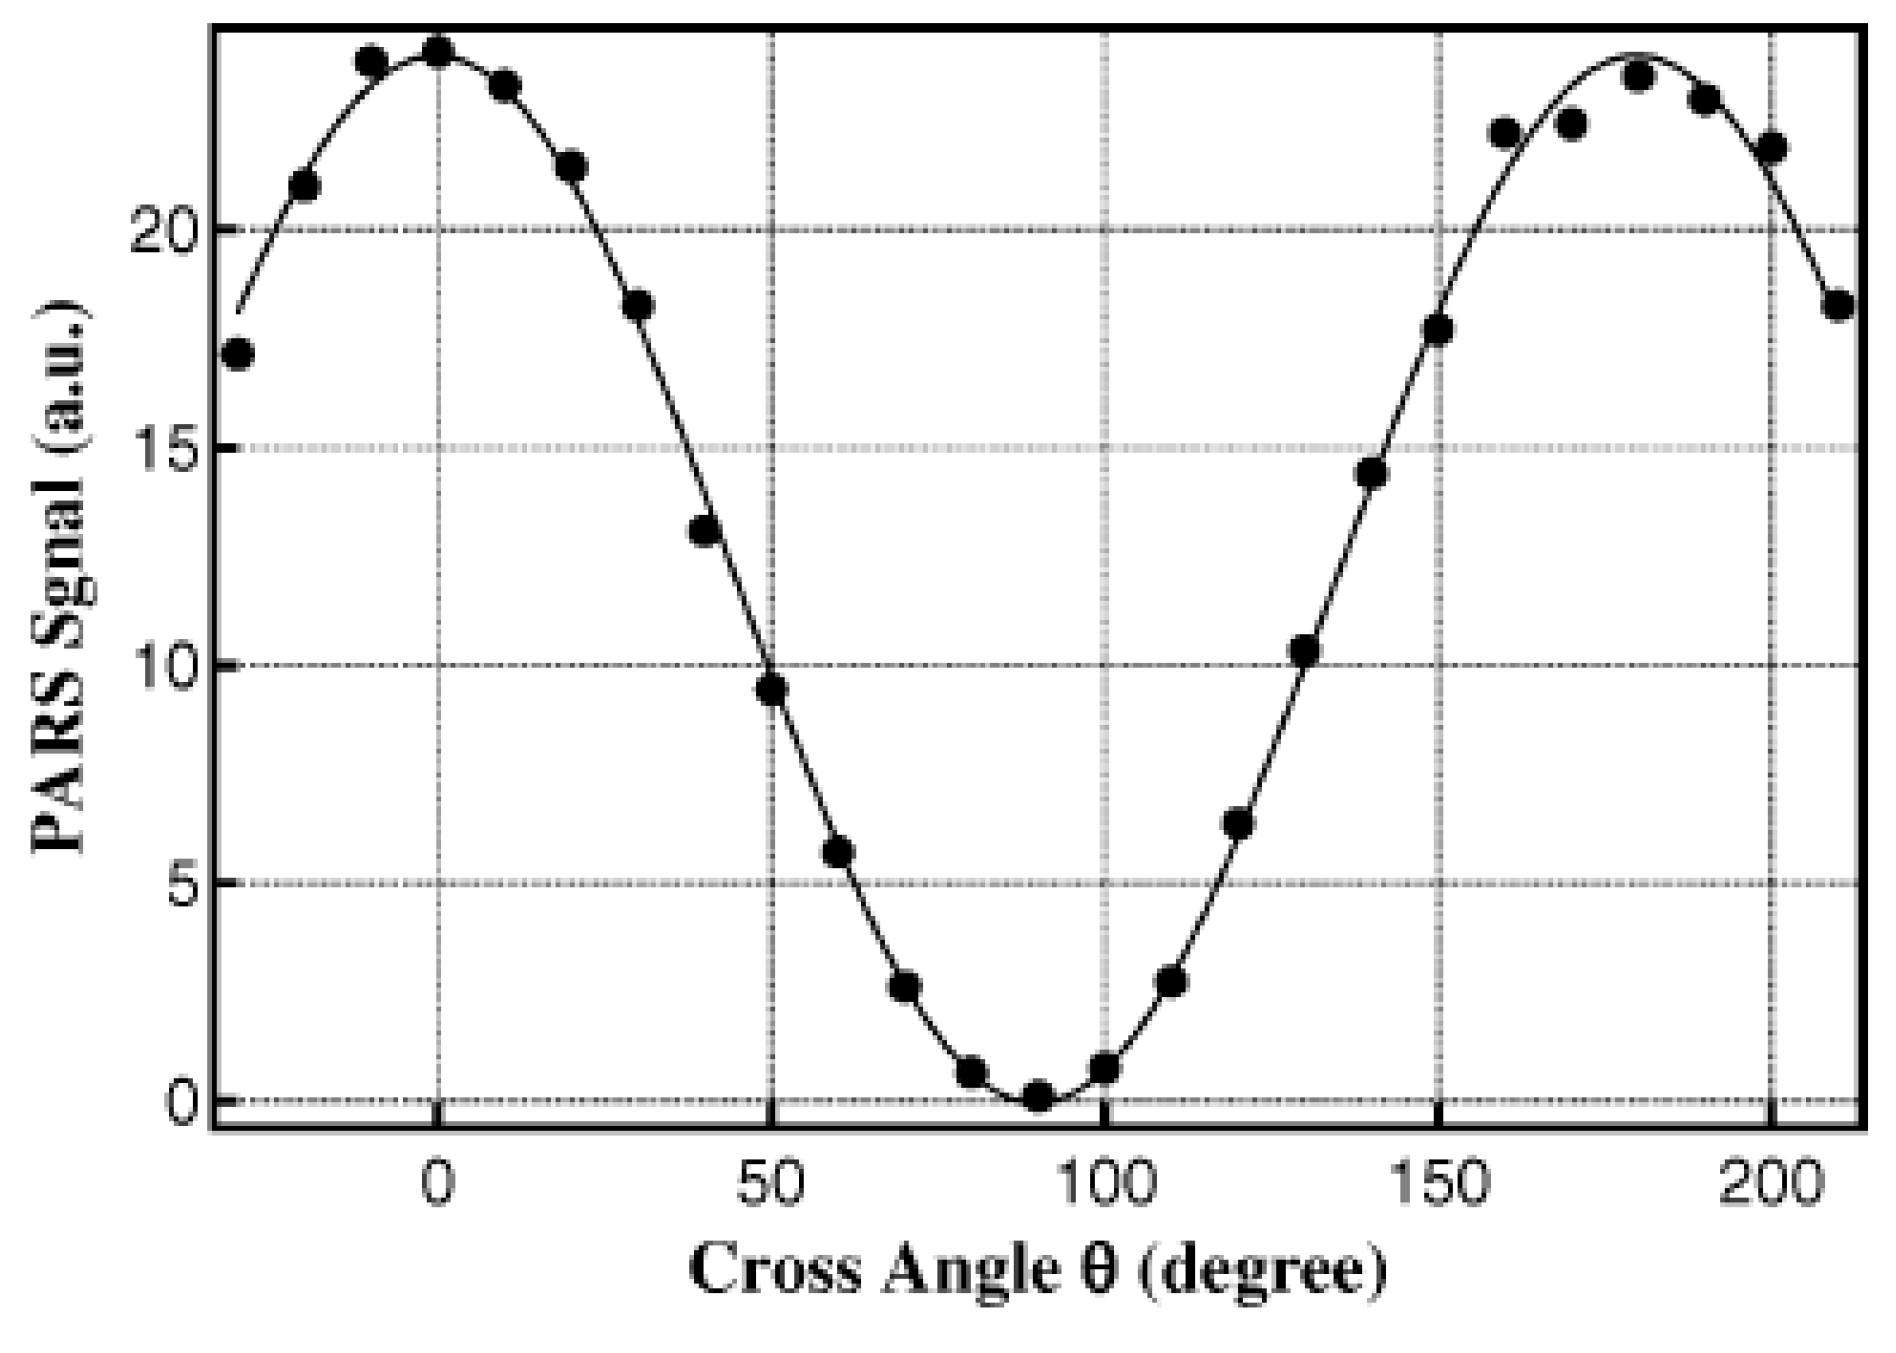
2.1. Photoacoustic Raman Spectroscopy (PARS)
2.2. Liquid Raman Spectroscopy
3. Assignment of C–H Stretching Spectra of Aliphatic Alcohols
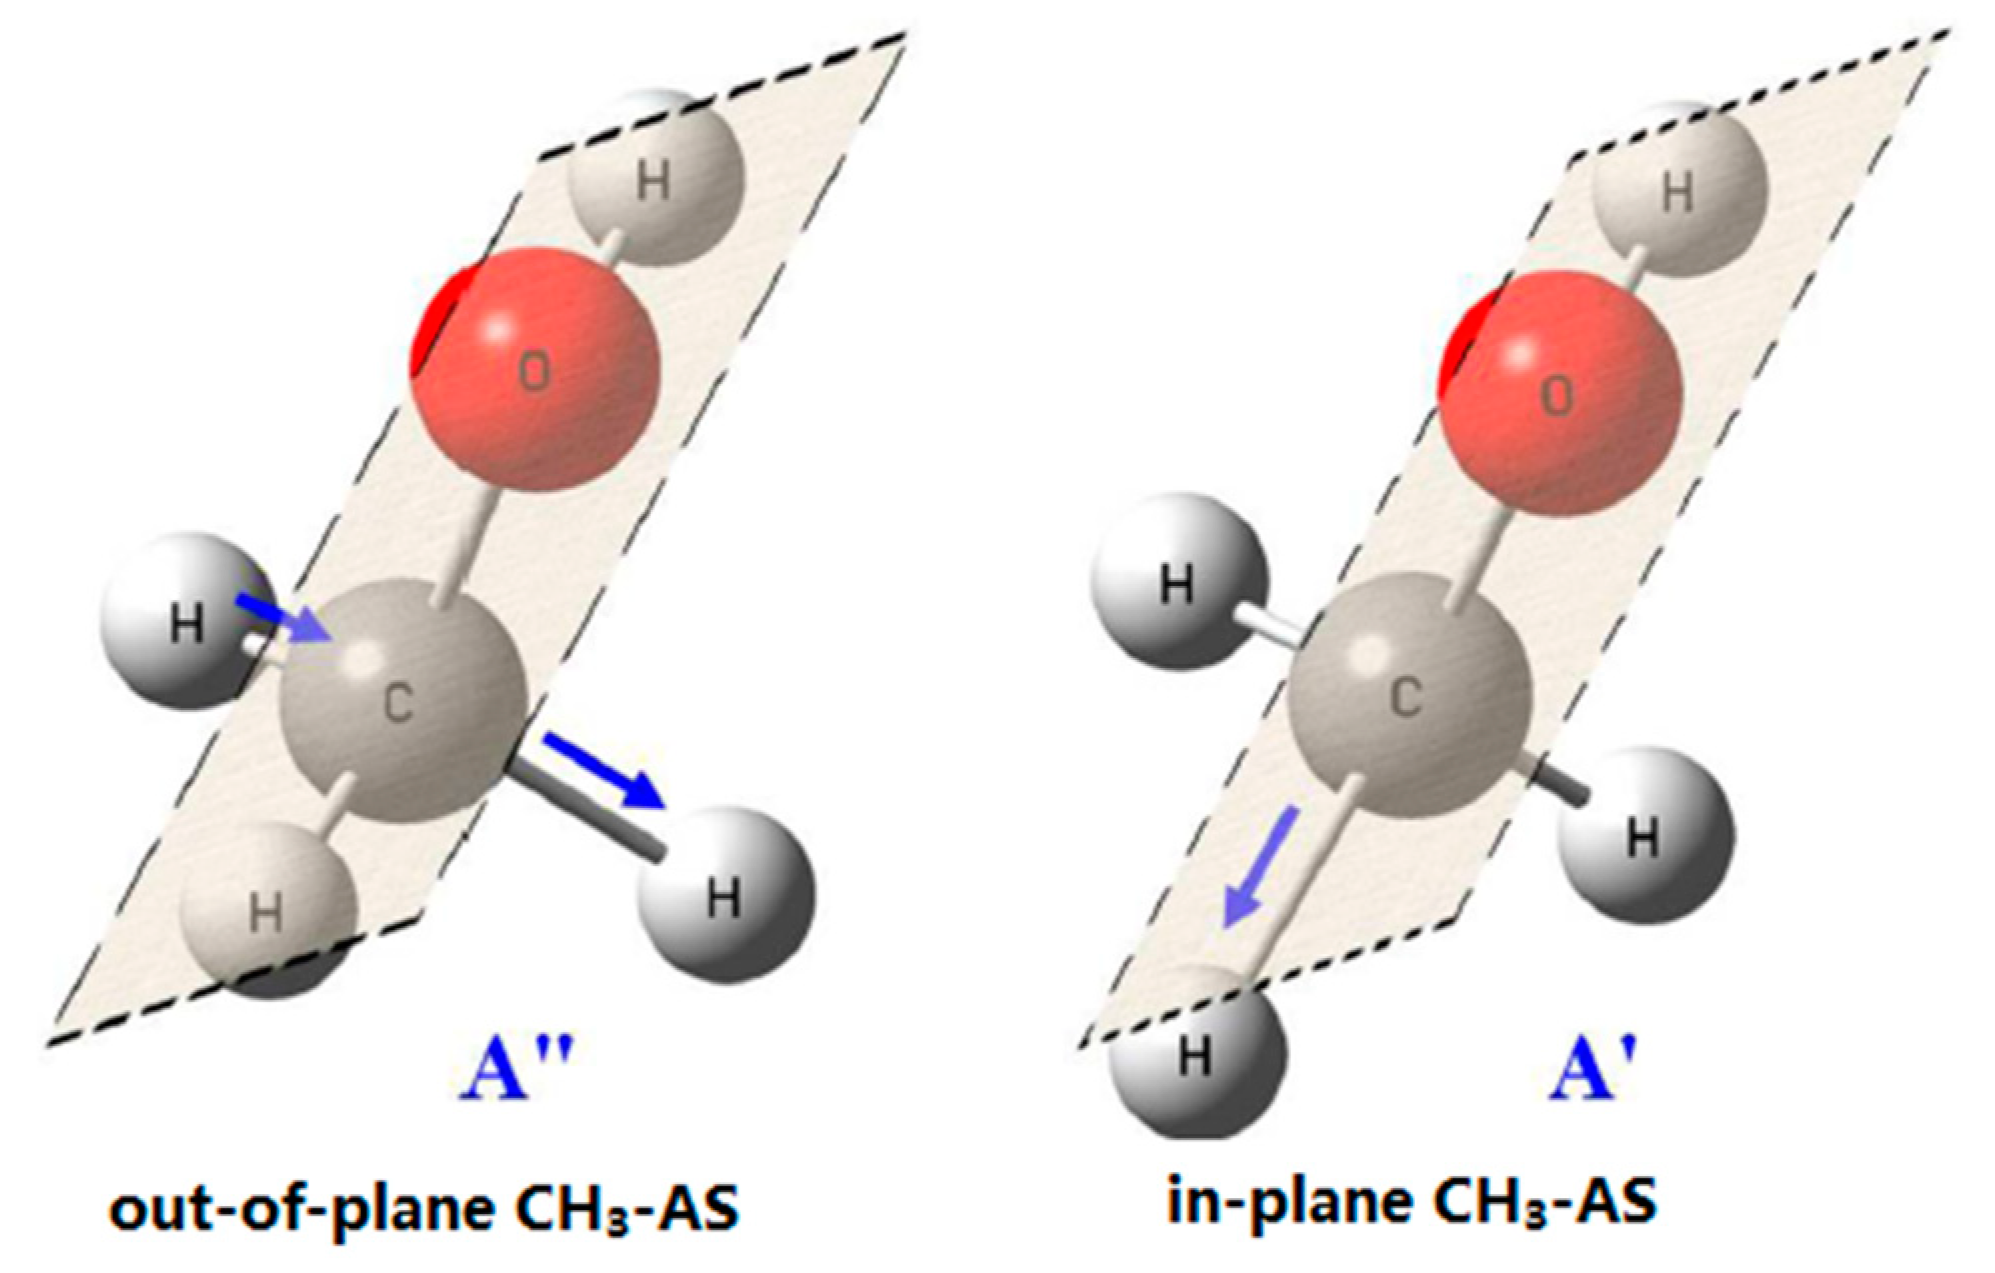
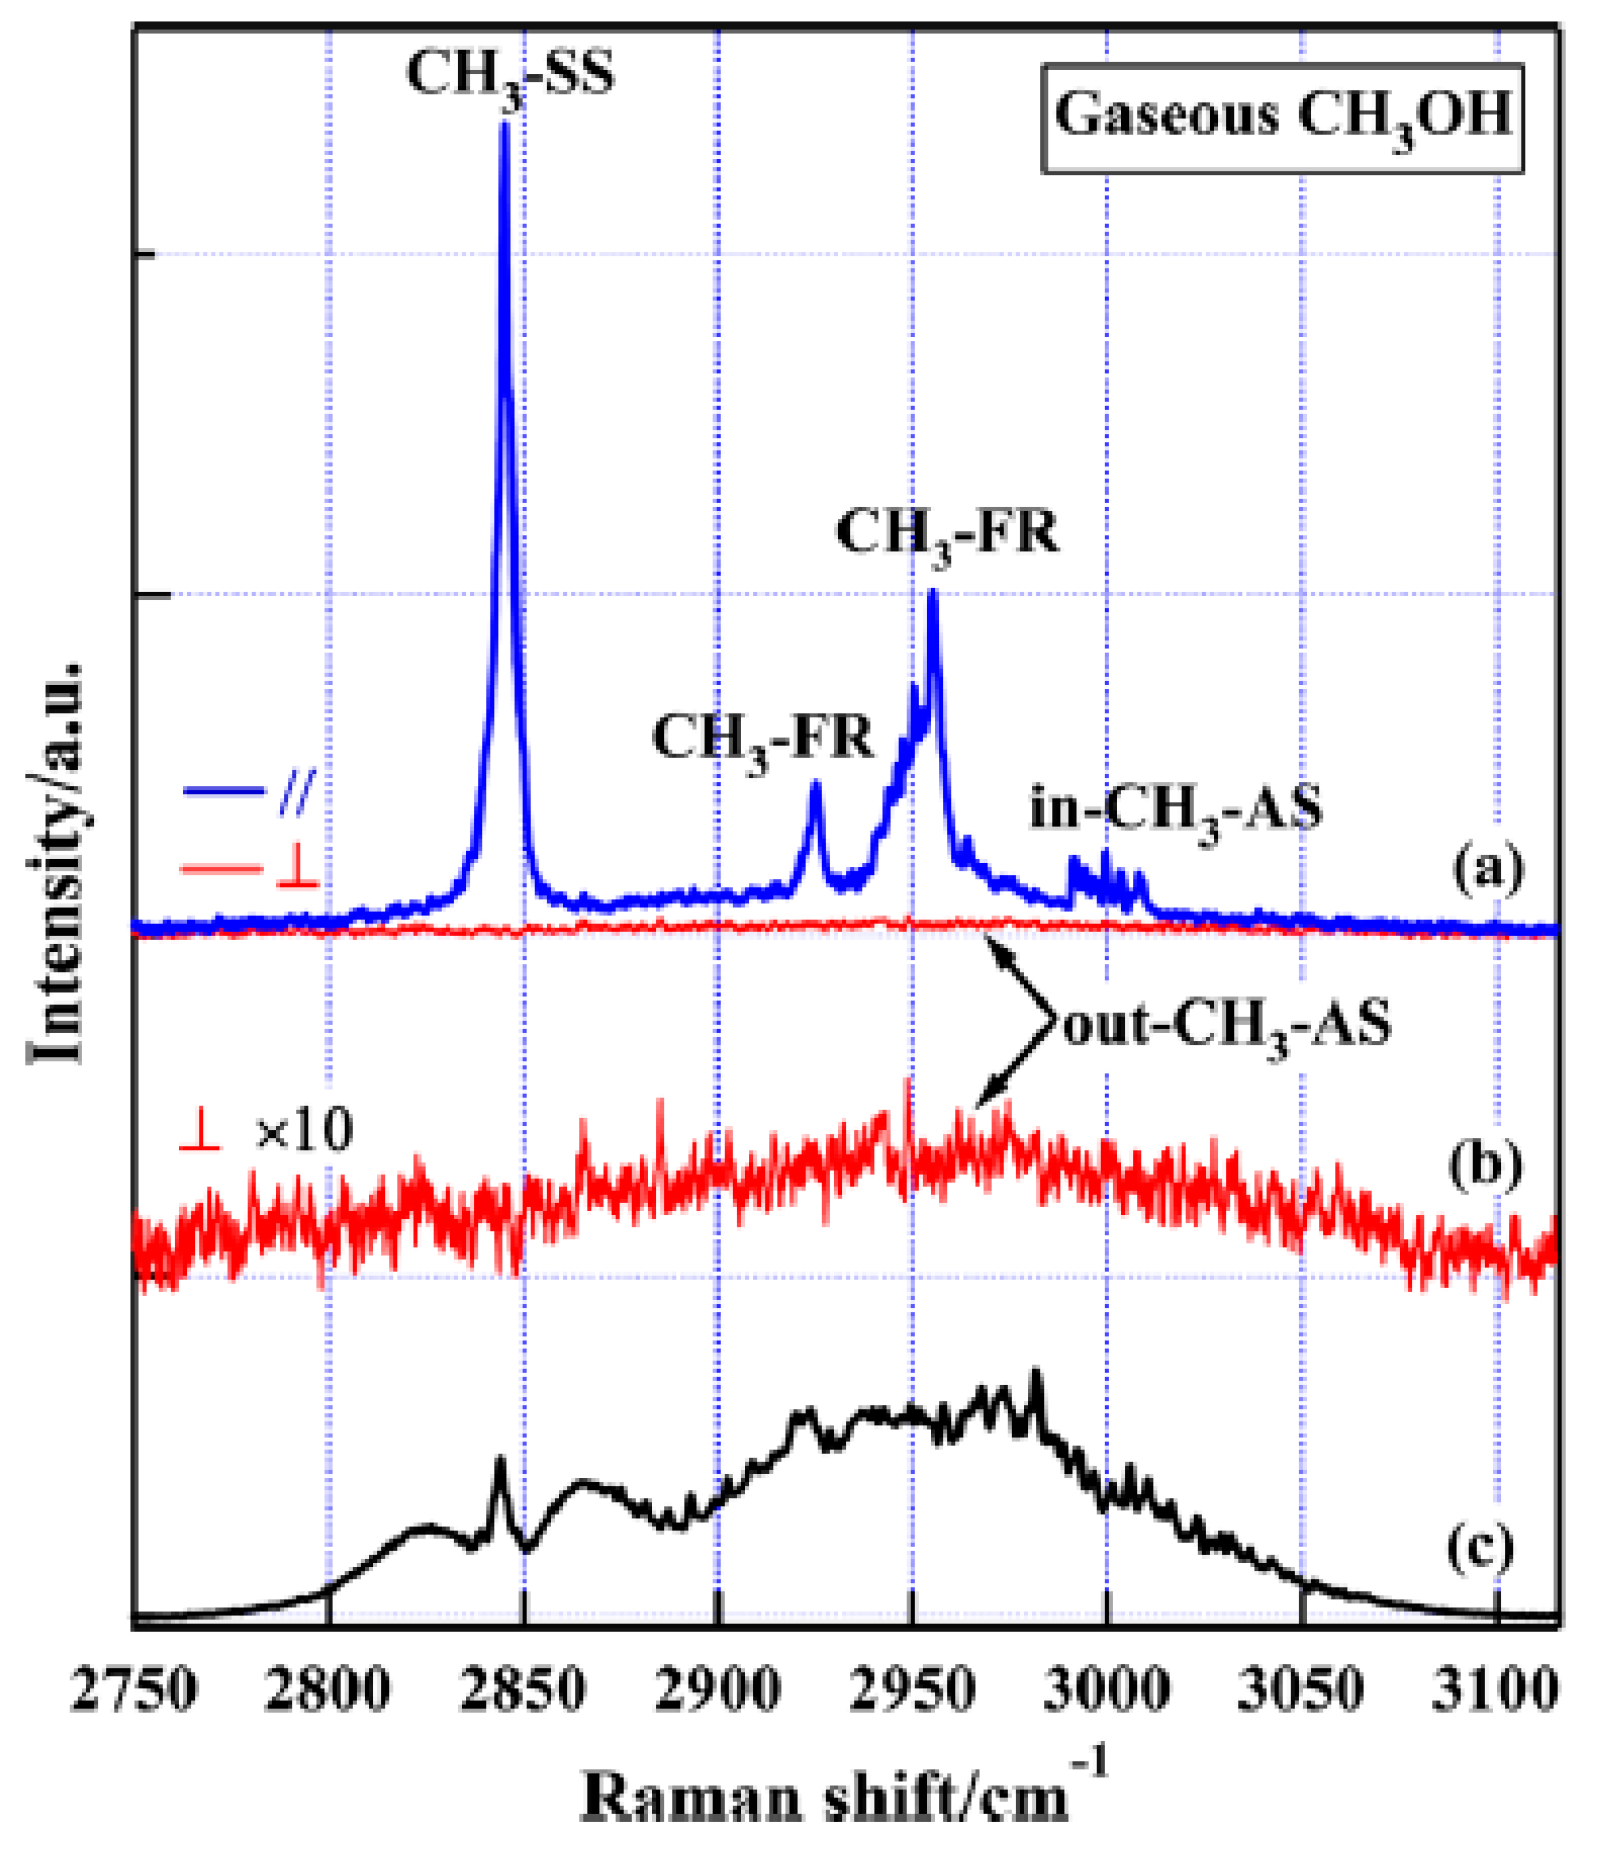
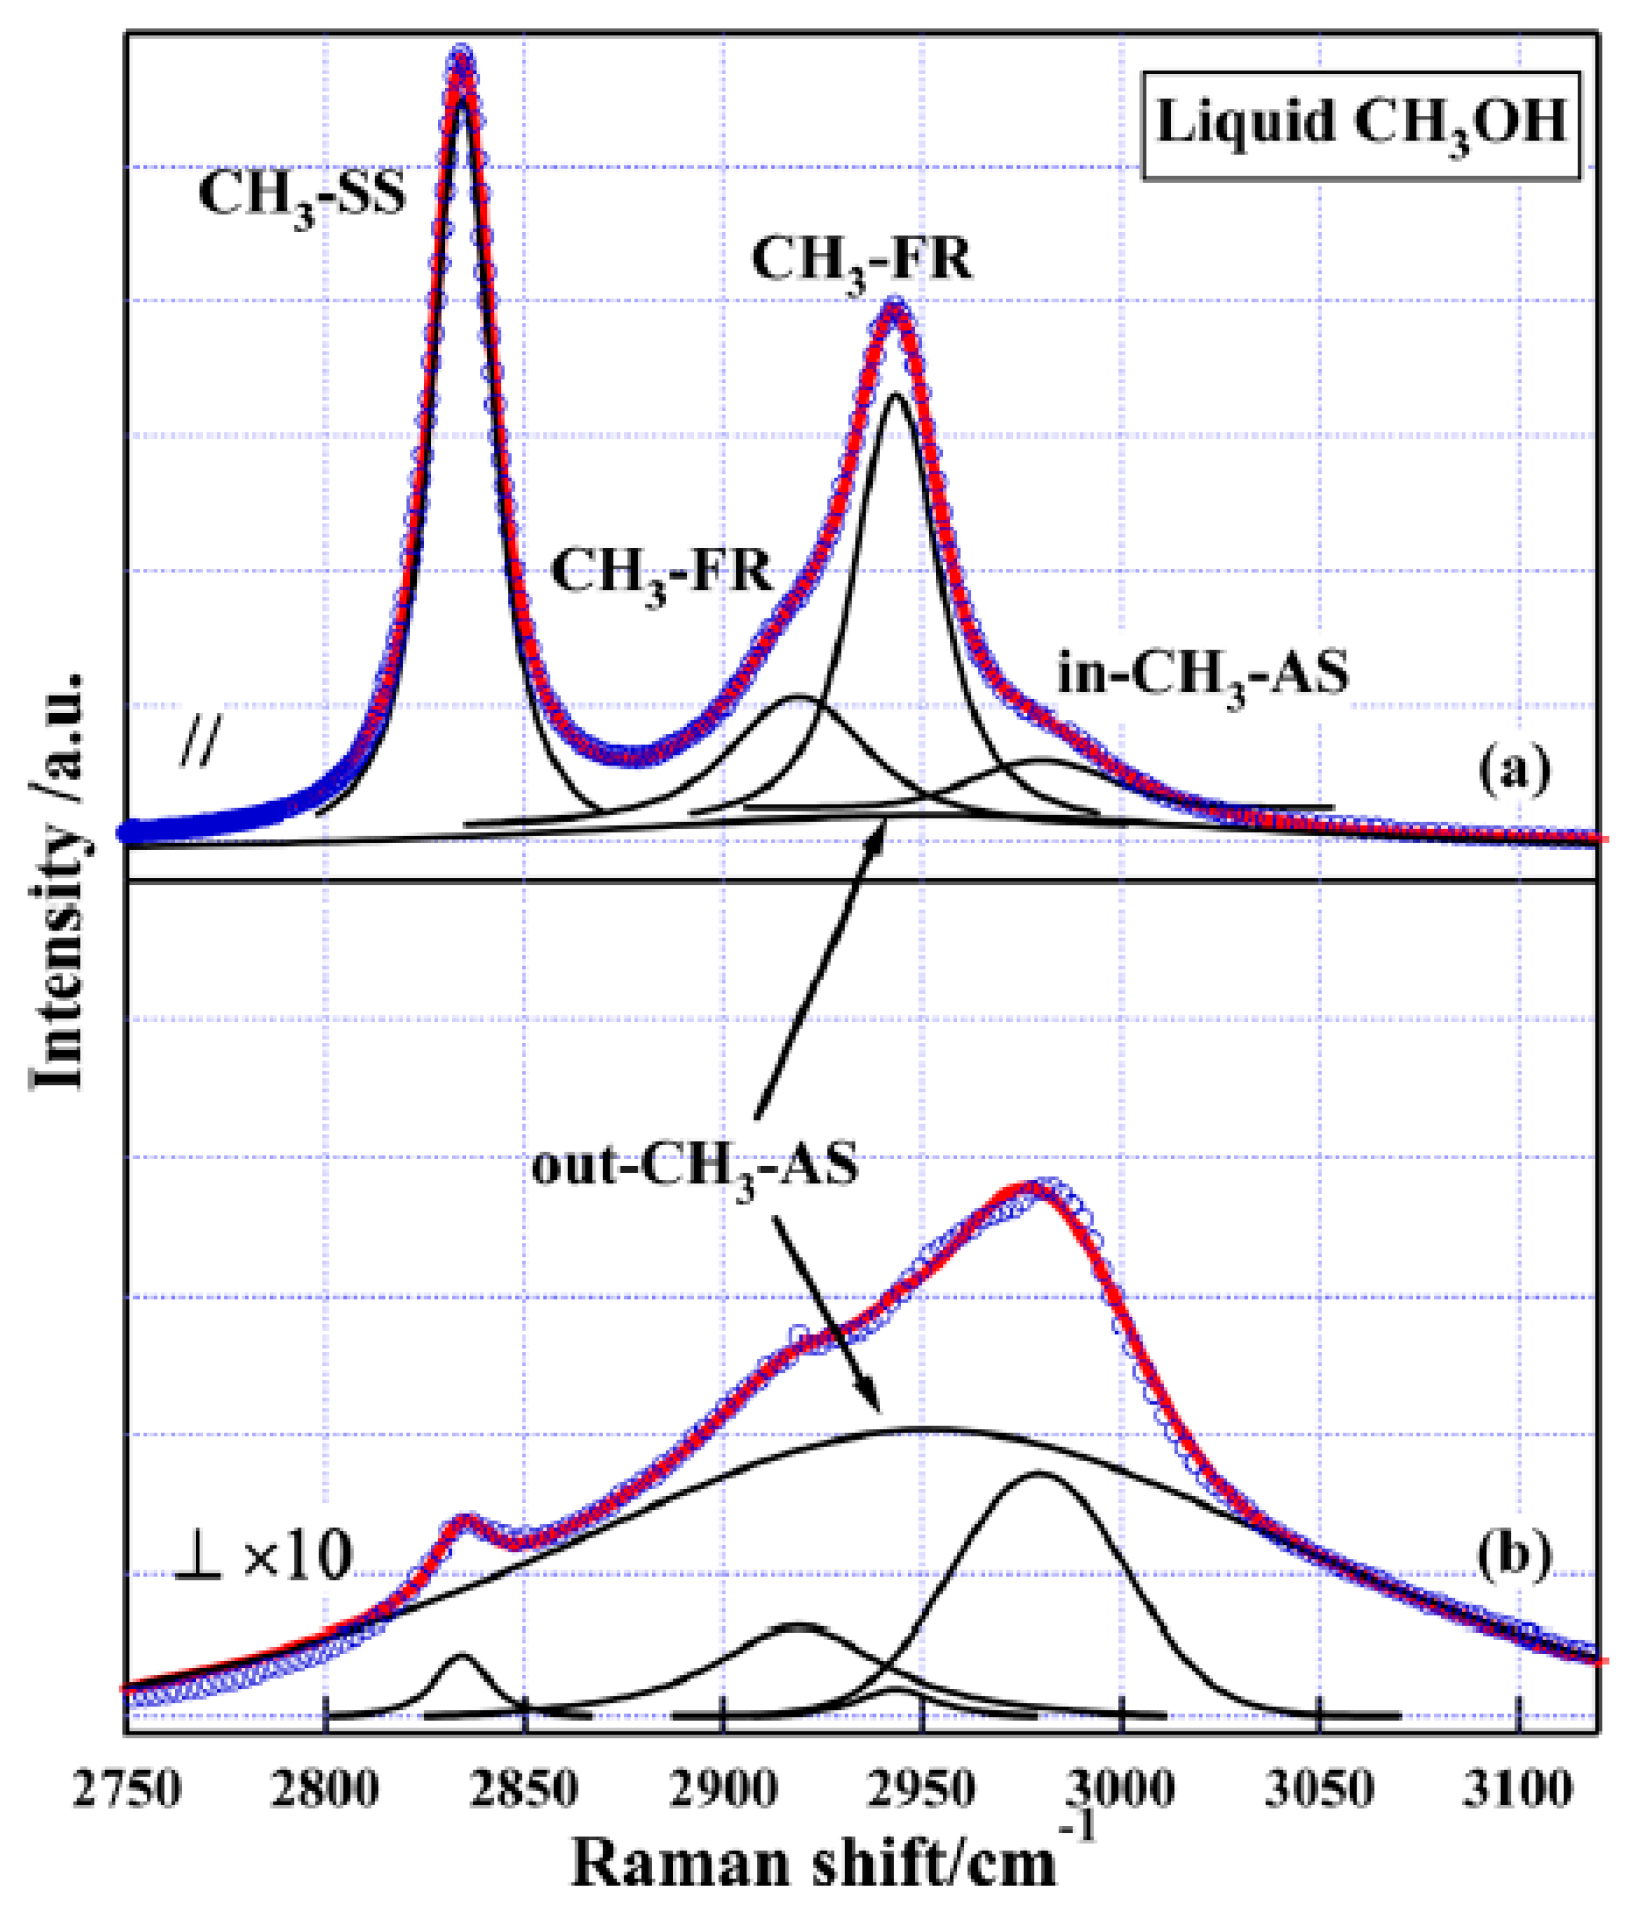
3.1. Methanol
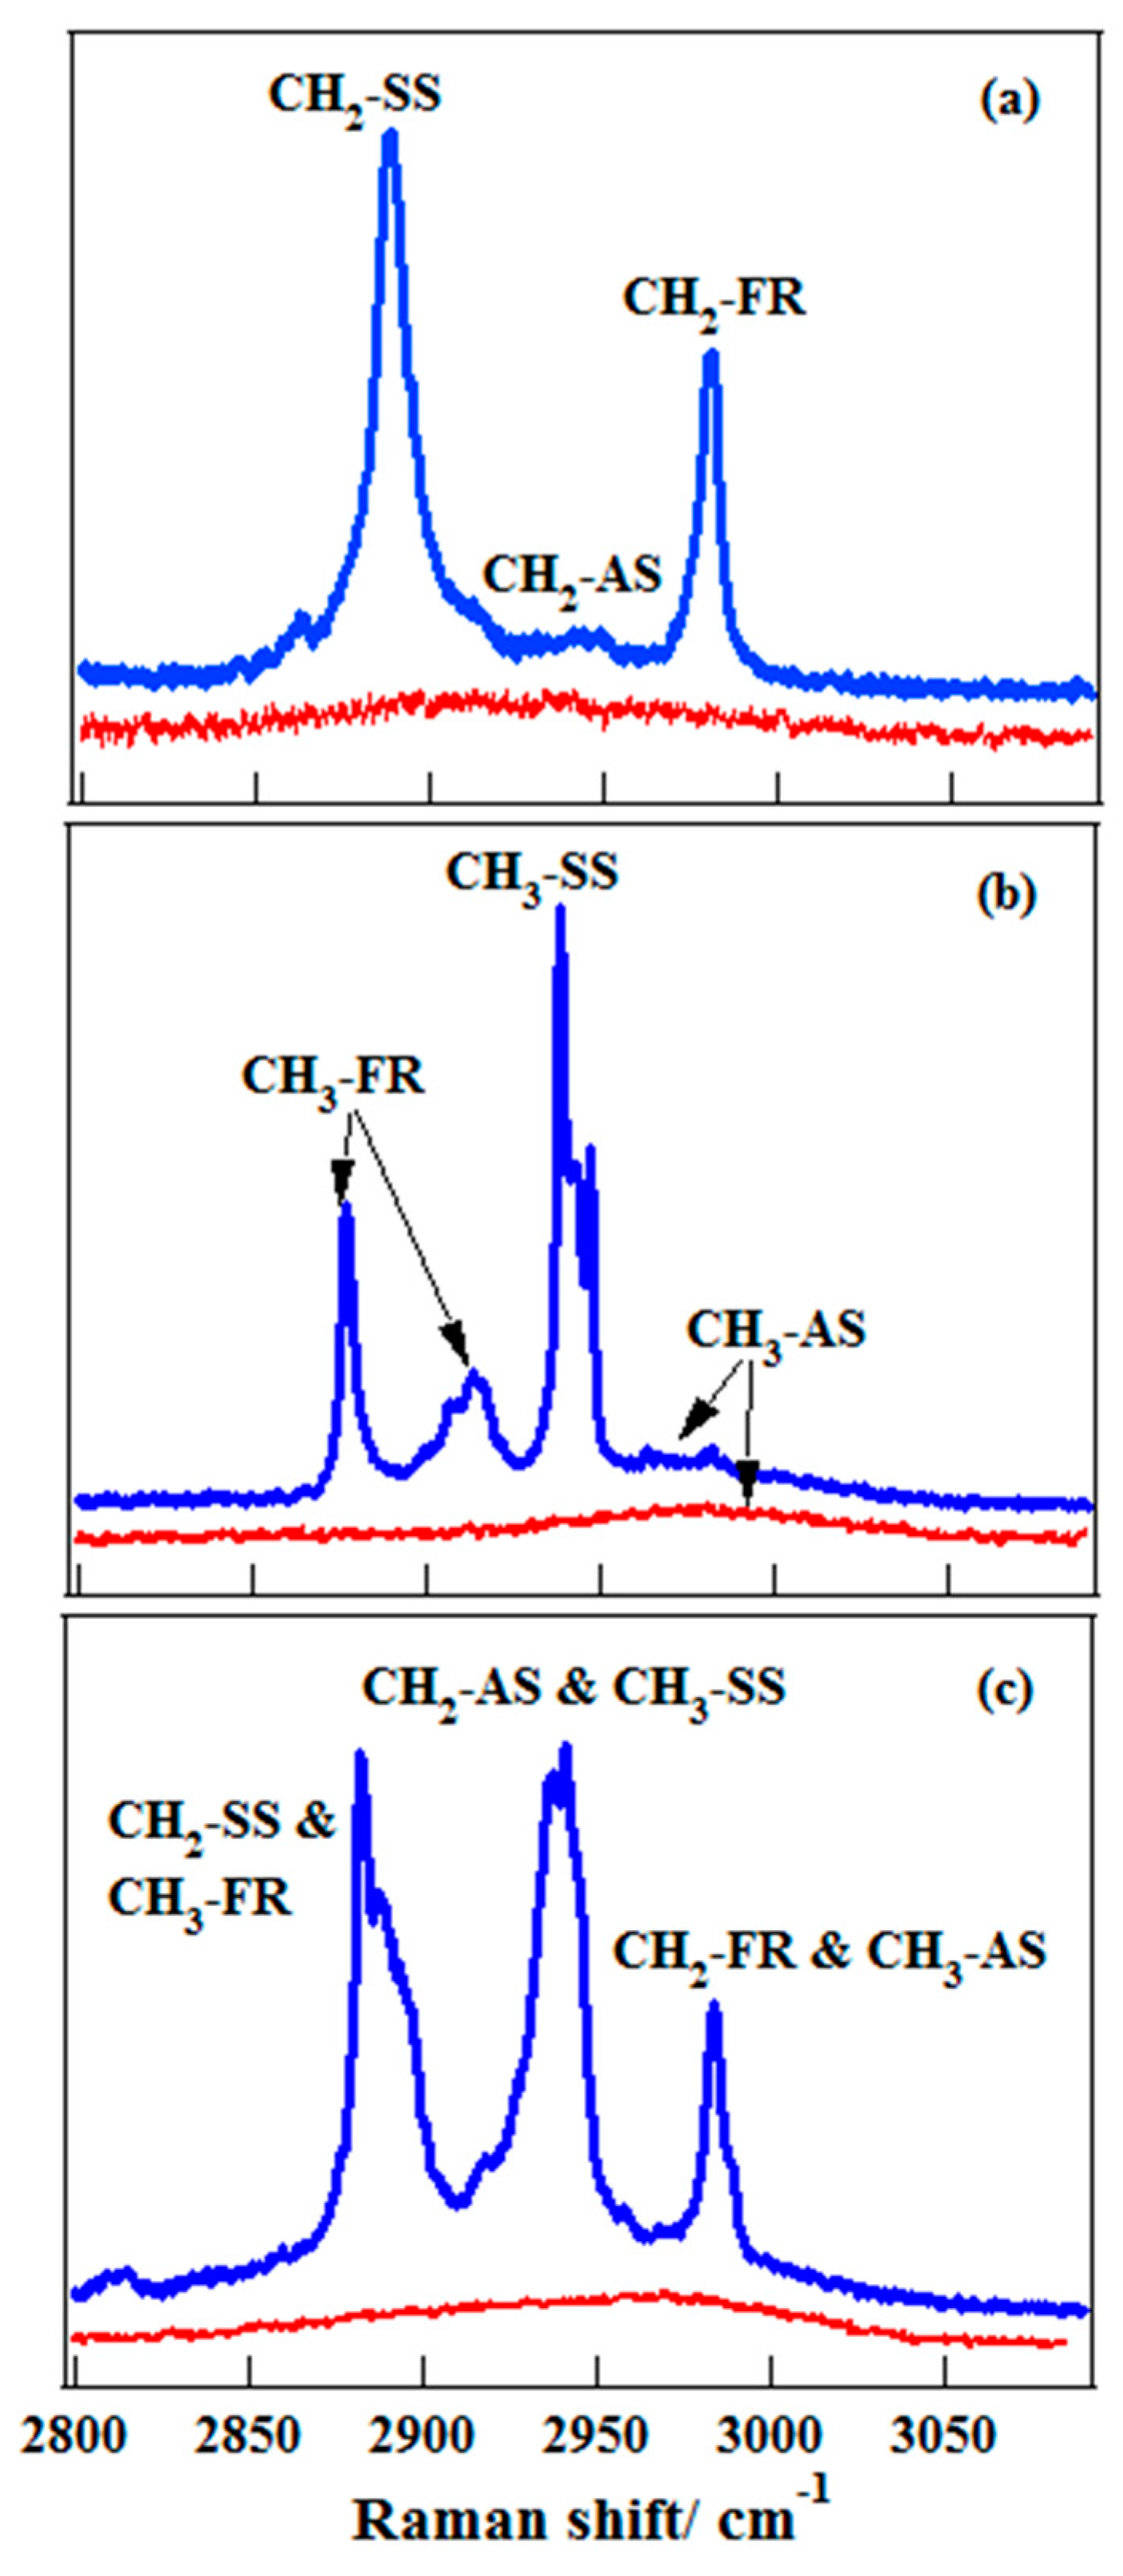
3.2. Ethanol
4. C–H Stretching Vibration as a Conformational Probe
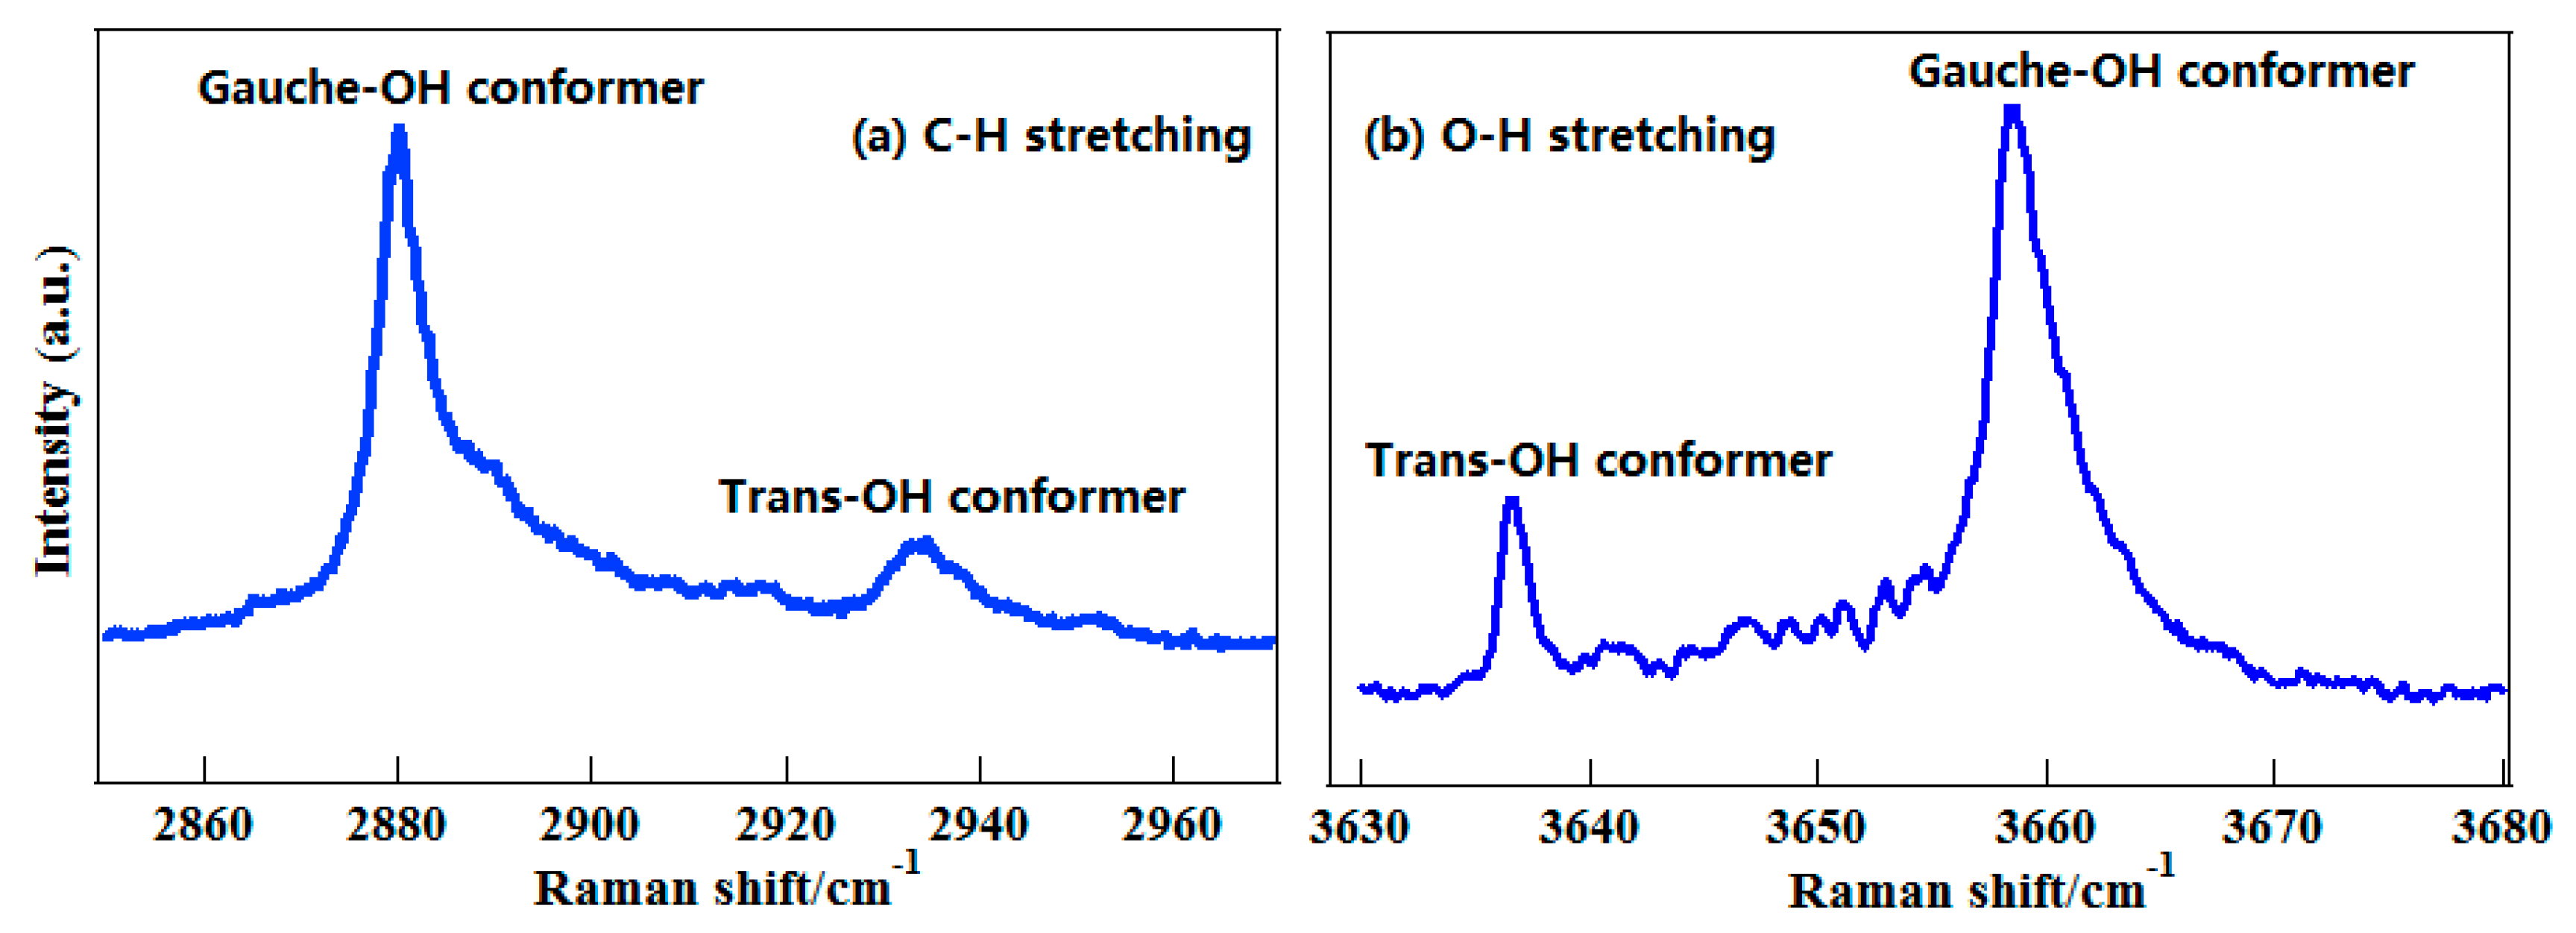
4.1. 2-Propanol
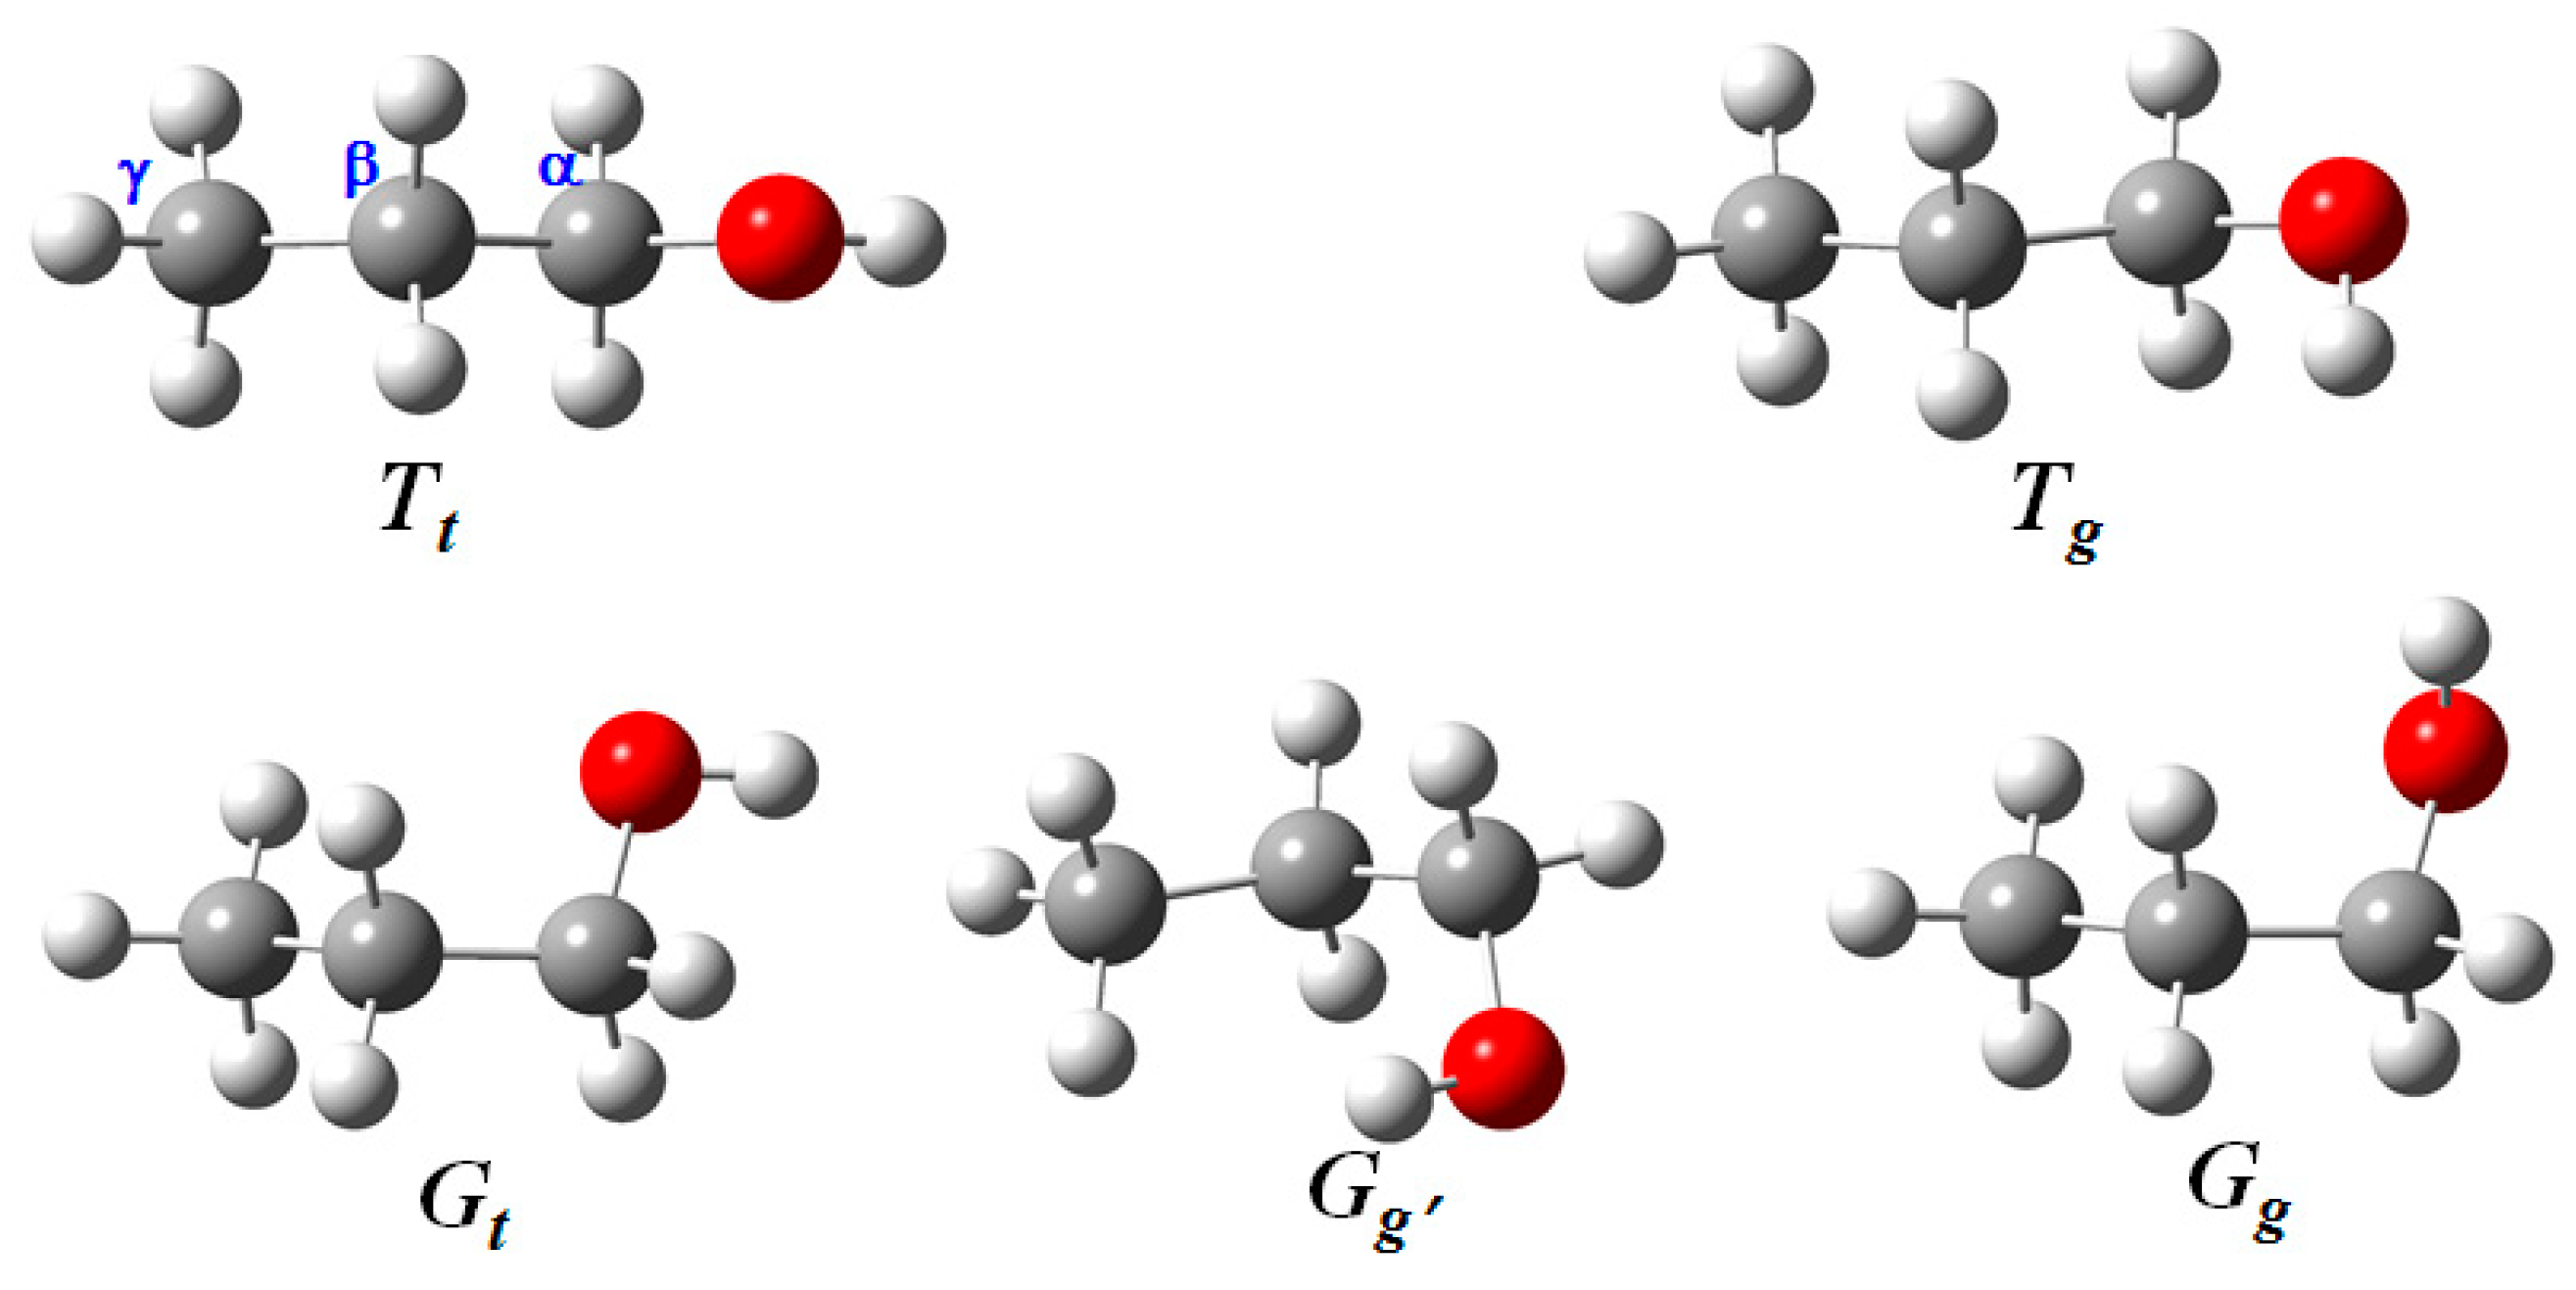
4.2. 1-Propanol
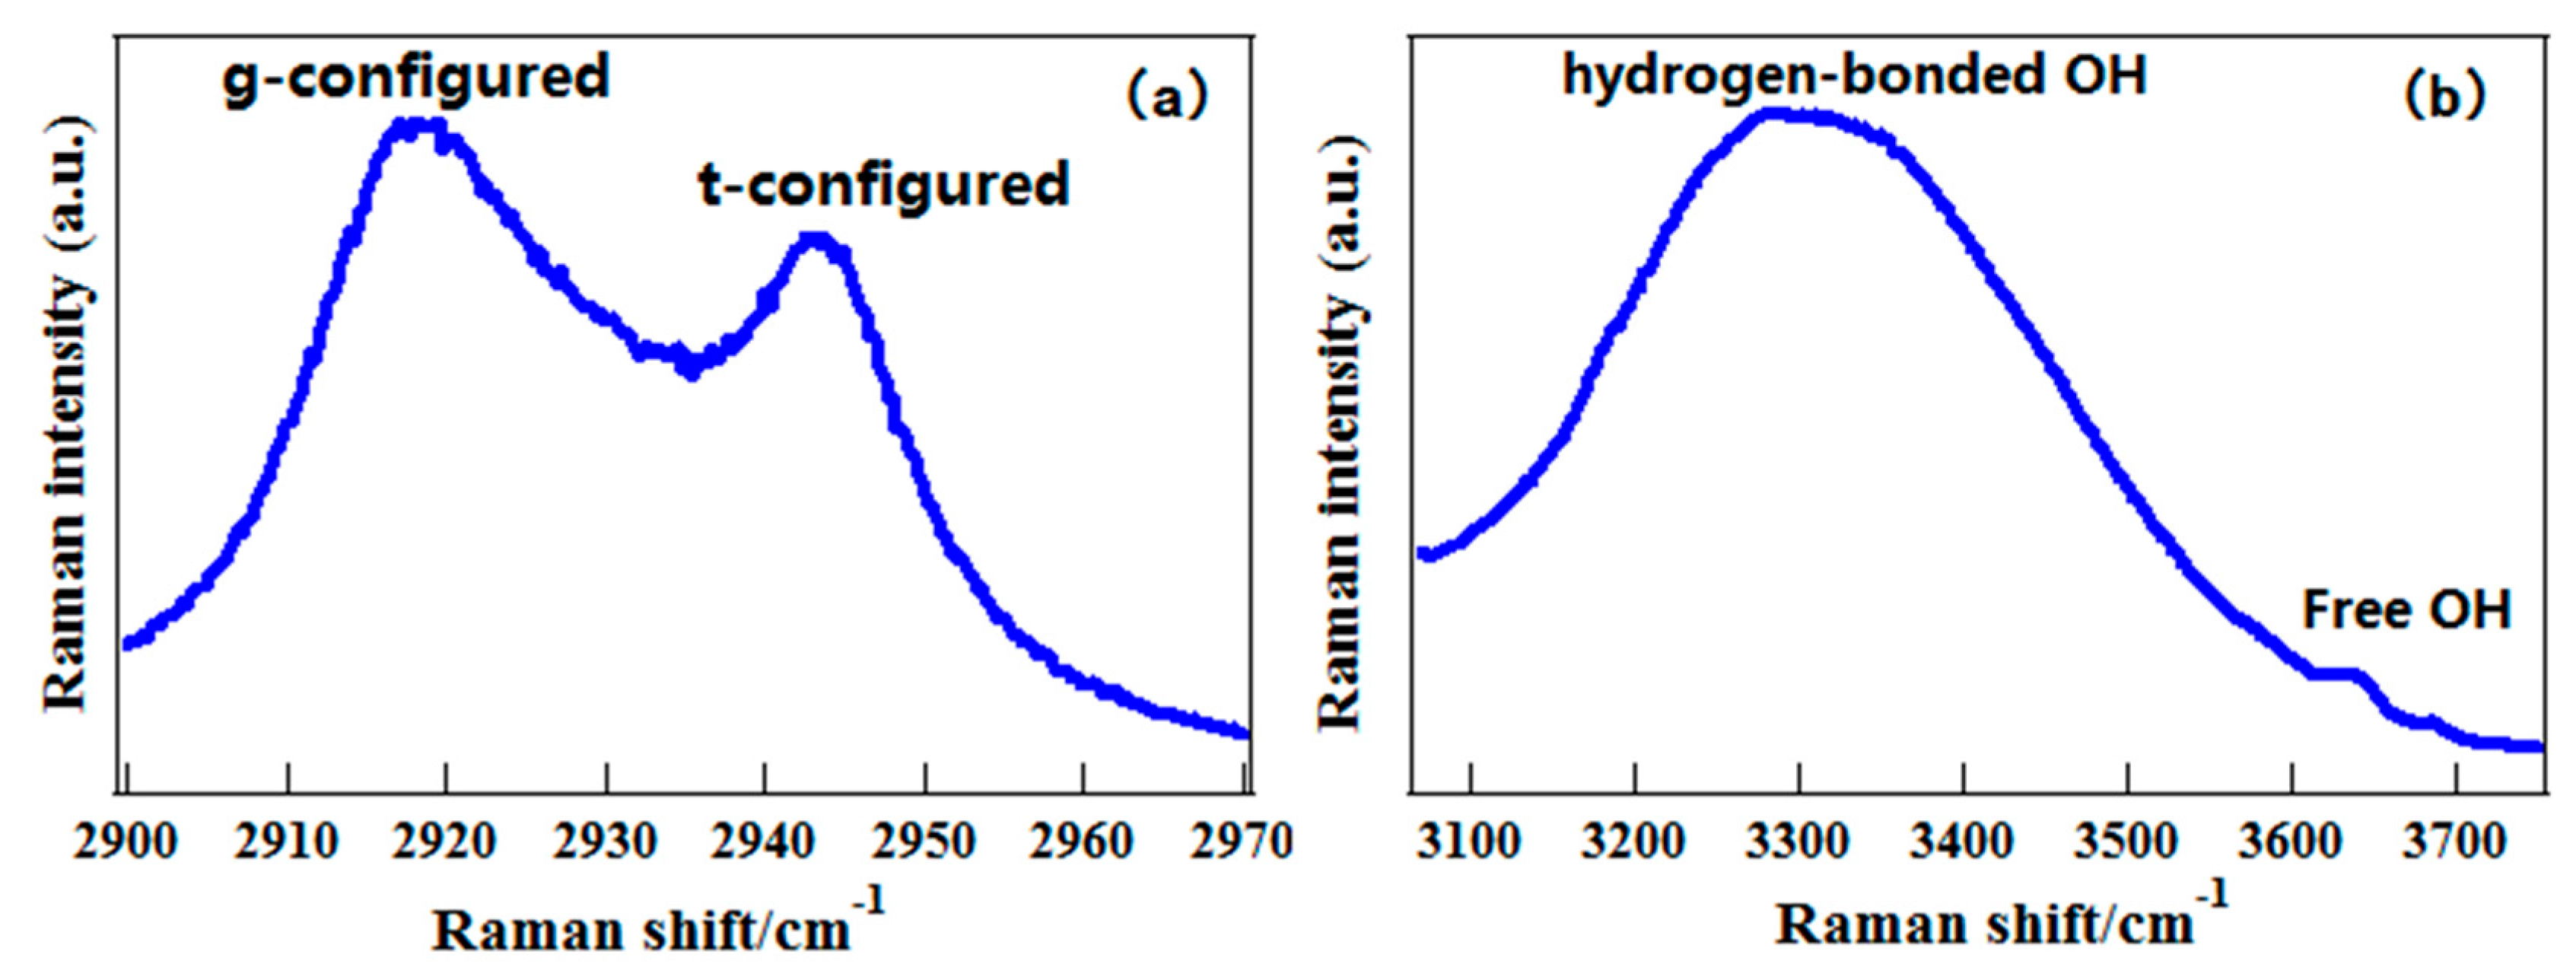
5. Characterization of Weak Hydrogen Bonds in Methanol-Water Solutions
6. Conclusions
Funding
Conflicts of Interest
References
- Chan, J.W.; Lieu, D.K. Label-free biochemical characterization of stem cells using vibrational spectroscopy. J. Biophotonics 2009, 2, 656–668. [Google Scholar] [CrossRef] [PubMed]
- Sandfort, V.; Trabold, B.M.; Abdolvand, A.; Bolwien, C.; Russell, P.S.J.; Wollenstein, J.; Palzer, S. Monitoring the Wobbe Index of Natural Gas Using Fiber-Enhanced Raman Spectroscopy. Sensors 2017, 17, 2714. [Google Scholar] [CrossRef] [PubMed]
- Das, R.S.; Agrawal, Y.K. Raman spectroscopy: Recent advancements, techniques and applications. Vib. Spectrosc. 2011, 57, 163–176. [Google Scholar] [CrossRef]
- Mars, K.; Lioe, D.X.; Kawahito, S.; Yasutomi, K.; Kagawa, K.; Yamada, T.; Hashimoto, M. Label-Free Biomedical Imaging Using High-Speed Lock-In Pixel Sensor for Stimulated Raman Scattering. Sensors 2017, 17, 2581. [Google Scholar] [CrossRef] [PubMed]
- Wang, C.; Zeng, L.H.; Li, Z.; Li, D.L. Review of optical fibre probes for enhanced Raman sensing. J. Raman Spectrosc. 2017, 48, 1040–1055. [Google Scholar] [CrossRef]
- Dhakal, S.; Chao, K.L.; Huang, Q.; Kim, M.; Schmidt, W.; Qin, J.W.; Broadhurst, C.L. A Simple Surface-Enhanced Raman Spectroscopic Method for on-Site Screening of Tetracycline Residue in Whole Milk. Sensors 2018, 18, 424. [Google Scholar] [CrossRef] [PubMed]
- Tran, M.; Whale, A.; Padalkar, S. Exploring the Efficacy of Platinum and Palladium Nanostructures for Organic Molecule Detection via Raman Spectroscopy. Sensors 2018, 18, 147. [Google Scholar] [CrossRef] [PubMed]
- Gautam, R.; Samuel, A.; Sil, S.; Chaturvedi, D.; Dutta, A.; Ariese, F.; Umapathy, S. Raman and mid-infrared spectroscopic imaging: Applications and advancements. Curr. Sci. 2015, 108, 341–356. [Google Scholar]
- Mirkin, N.G.; Krimm, S. Peptide CαDα Stretch Frequencies in a Hydrated Conformation Are Perturbed Mainly by Cα-Dα···O Hydrogen Bonding. J. Phys. Chem. B 2008, 112, 15267–15268. [Google Scholar] [CrossRef] [PubMed]
- Miller, C.S.; Ploetz, E.A.; Cremeens, M.E.; Corcelli, S.A. Carbon-deuterium vibrational probes of peptide conformation: Alanine dipeptide and glycine dipeptide. J. Chem. Phys. 2009, 130, 125103. [Google Scholar] [CrossRef] [PubMed]
- Miller, C.S.; Corcelli, S.A. Carbon-Deuterium Vibrational Probes of the Protonation State of Histidine in the Gas-Phase and in Aqueous Solution. J. Phys. Chem. B 2010, 114, 8565–8573. [Google Scholar] [CrossRef] [PubMed]
- Mirkin, N.G.; Krimm, S. Conformation Dependence of the (CD alpha)-D-alpha Stretch Mode in Peptides: Side-Chain Influence in Dipeptide Structures. Biopolymers 2010, 93, 1065–1071. [Google Scholar] [CrossRef] [PubMed]
- Zimmermann, J.; Gundogdu, K.; Cremeens, M.E.; Bandaria, J.N.; Hwang, G.T.; Thielges, M.C.; Cheatum, C.M.; Romesberg, F.E. Efforts toward Developing Probes of Protein Dynamics: Vibrational Dephasing and Relaxation of Carbon-Deuterium Stretching Modes in Deuterated Leucine. J. Phys. Chem. B 2009, 113, 7991–7994. [Google Scholar] [CrossRef] [PubMed]
- Lindquist, B.A.; Furse, K.E.; Corcelli, S.A. Nitrile groups as vibrational probes of biomolecular structure and dynamics: An overview. Phys. Chem. Chem. Phys. 2009, 11, 8119–8132. [Google Scholar] [CrossRef] [PubMed]
- Nydegger, M.W.; Rock, W.; Cheatum, C.M. 2D IR Spectroscopy of the C-D stretching vibration of the deuterated formic acid dimer. Phys. Chem. Chem. Phys. 2011, 13, 6098–6104. [Google Scholar] [CrossRef] [PubMed]
- Waegele, M.M.; Culik, R.M.; Gai, F. Site-Specific Spectroscopic Reporters of the Local Electric Field, Hydration, Structure, and Dynamics of Biomolecules. J. Phys. Chem. Lett. 2011, 2, 2598–2609. [Google Scholar] [CrossRef] [PubMed]
- Hong, S.L.; Chen, T.; Zhu, Y.T.; Li, A.; Huang, Y.Y.; Chen, X. Live-Cell Stimulated Raman Scattering Imaging of Alkyne-Tagged Biomolecules. Angew. Chem. Int. Ed. 2014, 53, 5827–5831. [Google Scholar] [CrossRef] [PubMed]
- Wei, L.; Hu, F.H.; Shen, Y.H.; Chen, Z.X.; Yu, Y.; Lin, C.C.; Wang, M.C.; Min, W. Live-cell imaging of alkyne-tagged small biomolecules by stimulated Raman scattering. Nat. Methods 2014, 11, 410–412. [Google Scholar] [CrossRef] [PubMed]
- Maj, M.; Ahn, C.; Blasiak, B.; Kwak, K.; Han, H.; Cho, M. Isonitrile as an Ultrasensitive Infrared Reporter of Hydrogen-Bonding Structure and Dynamics. J. Phys. Chem. B 2016, 120, 10167–10180. [Google Scholar] [CrossRef] [PubMed]
- Adhikary, R.; Zimmermann, J.; Romesberg, F.E. Transparent Window Vibrational Probes for the Characterization of Proteins with High Structural and Temporal Resolution. Chem. Rev. 2017, 117, 1927–1969. [Google Scholar] [CrossRef] [PubMed]
- Blasiak, B.; Londergan, C.H.; Webb, L.J.; Cho, M. Vibrational Probes: From Small Molecule Solvatochromism Theory and Experiments to Applications in Complex Systems. Acc. Chem. Res. 2017, 50, 968–976. [Google Scholar] [CrossRef] [PubMed]
- Brazhe, N.A.; Nikelshparg, E.I.; Prats, C.; Dela, F.; Sosnovtseva, O. Raman probing of lipids, proteins, and mitochondria in skeletal myocytes: A case study on obesity. J. Raman Spectrosc. 2017, 48, 1158–1165. [Google Scholar] [CrossRef]
- Lindquist, B.A.; Haws, R.T.; Corcelli, S.A. Optimized Quantum Mechanics/Molecular Mechanics Strategies for Nitrile Vibrational Probes: Acetonitrile and para-Tolunitrile in Water and Tetrahydrofuran. J. Phys. Chem. B 2008, 112, 13991–14001. [Google Scholar] [CrossRef] [PubMed]
- You, M.; Liu, L.Y.; Zhang, W.K. The covalently bound diazo group as an infrared probe for hydrogen bonding environments. Phys. Chem. Chem. Phys. 2017, 19, 19420–19426. [Google Scholar] [CrossRef] [PubMed]
- Mukherjee, D.; Rodriguez, L.I.O.; Hilaire, M.R.; Troxler, T.; Gai, F. 7-Cyanoindole fluorescence as a local hydration reporter: Application to probe the microheterogeneity of nine water-organic binary mixtures. Phys. Chem. Chem. Phys. 2018, 20, 2527–2535. [Google Scholar] [CrossRef] [PubMed]
- Zhang, W.K.; Markiewicz, B.N.; Doerksen, R.S.; Smith, A.B.; Gai, F. C equivalent to N stretching vibration of 5-cyanotryptophan as an infrared probe of protein local environment: What determines its frequency? Phys. Chem. Chem. Phys. 2016, 18, 7027–7034. [Google Scholar] [CrossRef] [PubMed]
- Blasiak, B.; Ritchie, A.W.; Webb, L.J.; Cho, M. Vibrational solvatochromism of nitrile infrared probes: Beyond the vibrational Stark dipole approach. Phys. Chem. Chem. Phys. 2016, 18, 18094–18111. [Google Scholar] [CrossRef] [PubMed]
- Wang, Z.H.; Pakoulev, A.; Dlott, D.D. Watching vibrational energy transfer in liquids with atomic spatial resolution. Science 2002, 296, 2201–2203. [Google Scholar] [CrossRef] [PubMed]
- Gan, W.; Wu, B.H.; Zhang, Z.; Guo, Y.; Wang, H.F. Vibrational spectra and molecular orientation with experimental configuration analysis in surface sum frequency generation (SFG). J. Phys. Chem. C 2007, 111, 8716–8725. [Google Scholar] [CrossRef]
- Wang, H.F.; Velarde, L.; Gan, W.; Fu, L. Quantitative Sum-Frequency Generation Vibrational Spectroscopy of Molecular Surfaces and Interfaces: Lineshape, Polarization, and Orientation. In Annual Review of Physical Chemistry; Johnson, M.A., Martinez, T.J., Eds.; Annual Reviews: Palo Alto, CA, USA, 2015; Volume 66, pp. 189–216. [Google Scholar]
- Feng, R.R.; Liu, A.A.; Liu, S.; Shi, J.J.; Zhang, R.D.; Ren, Z.F. In Situ Studies on the Dissociation and Photocatalytic Reactions of CH3OH on TiO2 Thin Film by Sum Frequency Generation Vibrational Spectroscopy. J. Phys. Chem. C 2015, 119, 9798–9804. [Google Scholar] [CrossRef]
- Liu, A.A.; Liu, S.; Zhang, R.D.; Ren, Z.F. Spectral Identification of Methanol on TiO2 Surfaces with Sum Frequency Generation in the C–H Stretching Region. J. Phys. Chem. C 2015, 119, 23486–23494. [Google Scholar] [CrossRef]
- Kataoka, S.; Cremer, P.S. Probing molecular structure at interfaces for comparison with bulk solution behavior: Water/2-propanol mixtures monitored by vibrational sum frequency spectroscopy. J. Am. Chem. Soc. 2006, 128, 5516–5522. [Google Scholar] [CrossRef] [PubMed]
- Liu, S.L.; Fourkas, J.T. Orientational Time Correlation Functions for Vibrational Sum-Frequency Generation. 3. Methanol. J. Phys. Chem. C 2015, 119, 5542–5550. [Google Scholar] [CrossRef]
- Gan, W.; Wu, W.; Yang, F.Y.; Hu, D.P.; Fang, H.; Lan, Z.G.; Yuan, Q.H. The behavior of hydroxide and hydronium ions at the hexadecane-water interface studied with second harmonic generation and zeta potential measurements. Soft Matter 2017, 13, 7962–7968. [Google Scholar] [CrossRef] [PubMed]
- Feng, R.J.; Lin, L.; Li, Y.Y.; Liu, M.H.; Guo, Y.; Zhang, Z. Effect of Ca2+ to Sphingomyelin Investigated by Sum Frequency Generation Vibrational Spectroscopy. Biophys. J. 2017, 112, 2173–2183. [Google Scholar] [CrossRef] [PubMed]
- Feng, R.J.; Li, X.; Zhang, Z.; Lu, Z.; Guo, Y. Spectral assignment and orientational analysis in a vibrational sum frequency generation study of DPPC monolayers at the air/water interface. J. Chem. Phys. 2016, 145, 244707. [Google Scholar] [CrossRef] [PubMed]
- Wang, W.T.; Ye, S.J. Molecular interactions of organic molecules at the air/water interface investigated by sum frequency generation vibrational spectroscopy. Phys. Chem. Chem. Phys. 2017, 19, 4488–4493. [Google Scholar] [CrossRef] [PubMed]
- Yang, D.H.; Li, Y.D.; Liu, X.Y.; Cao, Y.; Gao, Y.; Shen, Y.R.; Liu, W.T. Facet-specific interaction between methanol and TiO2 probed by sum-frequency vibrational spectroscopy. Proc. Natl. Acad. Sci. USA 2018, 115, E3888–E3894. [Google Scholar] [CrossRef] [PubMed]
- Pearson, W.L.; Contreras, C.C.; Powell, D.; Berden, G.; Oomens, J.; Bendiak, B.; Eyler, J.R. Differentiation of Rubidiated Methyl-d-Glycoside Stereoisomers by Infrared Multiple-Photon Dissociation Spectroscopy in the O–H and C–H Stretching Regions. J. Phys. Chem. B 2015, 119, 12970–12981. [Google Scholar] [CrossRef] [PubMed]
- Yang, X.J.; Li, A.G.; Glaser, R.; Zhong, J.X. Polycyclic Aromatic Hydrocarbons with Aliphatic Sidegroups: Intensity Scaling for the C–H Stretching Modes and Astrophysical Implications. Astrophys. J. 2017, 837, 171. [Google Scholar] [CrossRef]
- Sibert, E.L.; Kidwell, N.M.; Zwier, T.S. A First-Principles Model of Fermi Resonance in the Alkyl CH Stretch Region: Application to Hydronaphthalenes, Indanes, and Cyclohexane. J. Phys. Chem. B 2014, 118, 8236–8245. [Google Scholar] [CrossRef] [PubMed]
- Hewett, D.M.; Bocklitz, S.; Tabor, D.P.; Sibert, E.L.; Suhm, M.A.; Zwier, T.S. Identifying the first folded alkylbenzene via ultraviolet, infrared, and Raman spectroscopy of pentylbenzene through decylbenzene. Chem. Sci. 2017, 8, 5305–5318. [Google Scholar] [CrossRef]
- Hewett, D.M.; Tabor, D.P.; Fischer, J.L.; Sibert, E.L.; Zwier, T.S. Infrared-Enhanced Fluorescence-Gain Spectroscopy: Conformation-Specific Excited-State Infrared Spectra of Alkylbenzenes. J. Phys. Chem. Lett. 2017, 8, 5296–5300. [Google Scholar] [CrossRef] [PubMed]
- Wang, L.; Ishiyama, T.; Morita, A. Theoretical Investigation of C–H Vibrational Spectroscopy. 1. Modeling of Methyl and Methylene Groups of Ethanol with Different Conformers. J. Phys. Chem. A 2017, 121, 6687–6700. [Google Scholar] [CrossRef] [PubMed]
- Fischer, S.A.; Ueltschi, T.W.; El-Khoury, P.Z.; Mifflin, A.L.; Hess, W.P.; Wang, H.F.; Cramer, C.J.; Govind, N. Infrared and Raman Spectroscopy from Ab Initio Molecular Dynamics and Static Normal Mode Analysis: The C–H Region of DMSO as a Case Study. J. Phys. Chem. B 2016, 120, 1429–1436. [Google Scholar] [CrossRef] [PubMed]
- Sebek, J.; Knaanie, R.; Albee, B.; Potma, E.O.; Gerber, R.B. Spectroscopy of the C–H Stretching Vibrational Band in Selected Organic Molecules. J. Phys. Chem. A 2013, 117, 7442–7452. [Google Scholar] [CrossRef] [PubMed]
- Hu, Y.J.; Fu, H.B.; Bernstein, E.R. Infrared plus vacuum ultraviolet spectroscopy of neutral and ionic methanol monomers and clusters: New experimental results. J. Chem. Phys. 2006, 125, 154306. [Google Scholar] [CrossRef] [PubMed]
- Gan, W.; Zhang, Z.; Feng, R.R.; Wang, H.F. Identification of overlapping features in the sum frequency generation vibrational spectra of air/ethanol interface. Chem. Phys. Lett. 2006, 423, 261–265. [Google Scholar] [CrossRef]
- Yu, Y.Q.; Lin, K.; Zhou, X.G.; Wang, H.; Liu, S.L.; Ma, X.X. New C–H stretching vibrational spectral features in the Raman spectra of gaseous and liquid ethanol. J. Phys. Chem. C 2007, 111, 8971–8978. [Google Scholar] [CrossRef]
- Yu, Y.Q.; Wang, Y.X.; Hu, N.Y.; Lin, K.; Zhou, X.G.; Liu, S.L. Overlapping spectral features and new assignment of 2-propanol in the C–H stretching region. J. Raman Spectrosc. 2014, 45, 259–265. [Google Scholar] [CrossRef]
- Yu, Y.Q.; Wang, Y.X.; Lin, K.; Hu, N.Y.; Zhou, X.G.; Liu, S.L. Complete Raman Spectral Assignment of Methanol in the C–H Stretching Region. J. Phys. Chem. A 2013, 117, 4377–4384. [Google Scholar] [CrossRef] [PubMed]
- Yu, Y.Q.; Wang, Y.X.; Lin, K.; Zhou, X.G.; Liu, S.L.; Sun, J. New spectral assignment of n-propanol in the C–H stretching region. J. Raman Spectrosc. 2016, 47, 1385–1393. [Google Scholar] [CrossRef]
- Wang, C.Y.; Groenzin, H.; Shultz, M.J. Surface characterization of nanoscale TiO2 film by sum frequency generation using methanol as a molecular probe. J. Phys. Chem. B 2004, 108, 265–272. [Google Scholar] [CrossRef]
- Atamas, N.A.; Yaremko, A.M.; Bulavin, L.A.; Pogorelov, V.E.; Berski, S.; Latajka, Z.; Ratajczak, H.; Abkowicz-Bienko, A. Anharmonic Interactions and Fermi Resonance in the Vibrational Spectra of Alcohols. J. Mol. Struct. 2002, 605, 187–198. [Google Scholar] [CrossRef]
- Ma, G.; Allen, H.C. Surface studies of aqueous methanol solutions by vibrational broad bandwidth sum frequency generation spectroscopy. J. Phys. Chem. B 2003, 107, 6343–6349. [Google Scholar] [CrossRef]
- Barrett, J.J.; Berry, M.J. Photoacoustic Raman-Spectroscopy (PARS) Using cw Laser Sources. Appl. Phys. Lett. 1979, 34, 144–146. [Google Scholar] [CrossRef]
- Yu, Y.Q.; Lin, K.; Zhou, X.G.; Wang, H.; Liu, S.L.; Ma, X.X. Precise measurement of the depolarization ratio from photoacoustic Raman spectroscopy. J. Raman Spectrosc. 2007, 38, 1206–1211. [Google Scholar] [CrossRef]
- Xing, L.; Lin, K.; Zhou, X.G.; Liu, S.L.; Luo, Y. Multistate Mechanism of Lysozyme Denaturation through Synchronous Analysis of Raman Spectra. J. Phys. Chem. B 2016, 120, 10660–10667. [Google Scholar] [CrossRef] [PubMed]
- Wang, Y.X.; Zhu, W.D.; Lin, K.; Yuan, L.F.; Zhou, X.G.; Liu, S.L. Ratiometric detection of Raman hydration shell spectra. J. Raman Spectrosc. 2016, 47, 1231–1238. [Google Scholar] [CrossRef]
- Lin, K.; Hu, N.Y.; Zhou, X.G.; Liu, S.L.; Luo, Y. Reorientation dynamics in liquid alcohols from Raman spectroscopy. J. Raman Spectrosc. 2012, 43, 82–88. [Google Scholar] [CrossRef]
- Macphail, R.A.; Snyder, R.G.; Strauss, H.L. The Motional Collapse of the Methyl C–H Stretching Vibration Bands. J. Chem. Phys. 1982, 77, 1118–1137. [Google Scholar] [CrossRef]
- Gruenloh, C.J.; Florio, G.M.; Carney, J.R.; Hagemeister, F.C.; Zwier, T.S. C–H stretch modes as a probe of H-bonding in methanol-containing clusters. J. Phys. Chem. A 1999, 103, 496–502. [Google Scholar] [CrossRef]
- Keefe, C.D.; Gillis, E.A.L.; MacDonald, L. Improper Hydrogen-Bonding CH·Y Interactions in Binary Methanol Systems as Studied by FTIR and Raman Spectroscopy. J. Phys. Chem. A 2009, 113, 2544–2550. [Google Scholar] [CrossRef] [PubMed]
- Arencibia, A.; Taravillo, M.; Caceres, M.; Nunez, J.; Baonza, V.G. Pressure tuning of the Fermi resonance in liquid methanol: Implications for the analysis of high-pressure vibrational spectroscopy experiments. J. Chem. Phys. 2005, 123, 214502. [Google Scholar] [CrossRef] [PubMed]
- Torbeev, V.Y.; Hilvert, D. Both the cis-trans equilibrium and isomerization dynamics of a single proline amide modulate β2-microglobulin amyloid assembly. Proc. Natl. Acad. Sci. USA 2013, 110, 20051–20056. [Google Scholar] [CrossRef] [PubMed]
- Yu, Y.Q.; Wang, Y.X.; Hu, N.Y.; Lin, K.; Zhou, X.G.; Liu, S.L. Cβ-H stretching vibration as a new probe for conformation of n-propanol in gaseous and liquid states. Phys. Chem. Chem. Phys. 2016, 18, 10563–10572. [Google Scholar] [CrossRef] [PubMed]
- Scheiner, S.; Kar, T. Red- versus blue-shifting hydrogen bonds: Are there fundamental distinctions? J. Phys. Chem. A 2002, 106, 1784–1789. [Google Scholar] [CrossRef]
- Wang, C.W.; Danovich, D.; Shaik, S.; Mo, Y.R. A Unified Theory for the Blue- and Red-Shifting Phenomena in Hydrogen and Halogen Bonds. J. Chem. Theory Comput. 2017, 13, 1626–1637. [Google Scholar] [CrossRef] [PubMed]
- Van der Veken, B.J.; Herrebout, W.A.; Szostak, R.; Shchepkin, D.N.; Havlas, Z.; Hobza, P. The nature of improper, blue-shifting hydrogen bonding verified experimentally. J. Am. Chem. Soc. 2001, 123, 12290–12293. [Google Scholar] [CrossRef] [PubMed]
- Yu, Y.Q.; Fan, W.; Wang, Y.X.; Zhou, X.G.; Sun, J.; Liu, S.L. C–H···O Interaction in Methanol-Water Solution Revealed from Raman Spectroscopy and Theoretical Calculations. J. Phys. Chem. B 2017, 121, 8179–8187. [Google Scholar] [CrossRef] [PubMed]


| Molecules | Band Position/cm−1 | ρ | Assignment |
|---|---|---|---|
| CH3OH | 2845 | 0.01 | CH3-SS |
| 2925 | 0.09 | CH3-FR | |
| 2955 | 0.038 | CH3-FR | |
| 3000 | 0.150 | in-CH3-AS | |
| CH3CD2OH | 2878 | 0.007 | CH3-FR |
| 2913 | 0.051 | CH3-FR | |
| 2938 | 0.015 | CH3-SS | |
| CD3CH2OH | 2888 | 0.038 | CH2-SS |
| 2981 | 0.045 | CH2-FR | |
| CH3CH2OH | 2882 | 0.051 | CH3-FR & CH2-SS |
| 2938 | 0.083 | CH3-SS & CH2-AS | |
| 2983 | 0.151 | CH2-FR & CH3-AS | |
| CD3CH2CD2OH | 2915 | 0.230 | Tt-β-CH2-SS |
| 2926 | 0.108 | Gt-β-CH2-SS | |
| 2932 | 0.113 | Gg′-β-CH2-SS | |
| 2942 | 0.210 | Tg-β-CH2-SS | |
| 2952 | 0.096 | Gg-β-CH2-SS |
© 2018 by the authors. Licensee MDPI, Basel, Switzerland. This article is an open access article distributed under the terms and conditions of the Creative Commons Attribution (CC BY) license (http://creativecommons.org/licenses/by/4.0/).
Share and Cite
Yu, Y.; Fan, W.; Wang, Y.; Zhou, X.; Sun, J.; Liu, S. Probe of Alcohol Structures in the Gas and Liquid States Using C–H Stretching Raman Spectroscopy. Sensors 2018, 18, 2061. https://doi.org/10.3390/s18072061
Yu Y, Fan W, Wang Y, Zhou X, Sun J, Liu S. Probe of Alcohol Structures in the Gas and Liquid States Using C–H Stretching Raman Spectroscopy. Sensors. 2018; 18(7):2061. https://doi.org/10.3390/s18072061
Chicago/Turabian StyleYu, Yuanqin, Wei Fan, Yuxi Wang, Xiaoguo Zhou, Jin Sun, and Shilin Liu. 2018. "Probe of Alcohol Structures in the Gas and Liquid States Using C–H Stretching Raman Spectroscopy" Sensors 18, no. 7: 2061. https://doi.org/10.3390/s18072061
APA StyleYu, Y., Fan, W., Wang, Y., Zhou, X., Sun, J., & Liu, S. (2018). Probe of Alcohol Structures in the Gas and Liquid States Using C–H Stretching Raman Spectroscopy. Sensors, 18(7), 2061. https://doi.org/10.3390/s18072061