Agreement Technologies for Energy Optimization at Home

 ,
,  ,
,  ,
,  and
and 
Abstract
:1. Introduction
2. Related Work
2.1. Traditional Home Energy Optimization Systems
2.2. Agreement Technologies and Negotiation Systems
2.3. Lighting and Temperature Automation
2.4. Multi-Agent Systems
3. System Overview
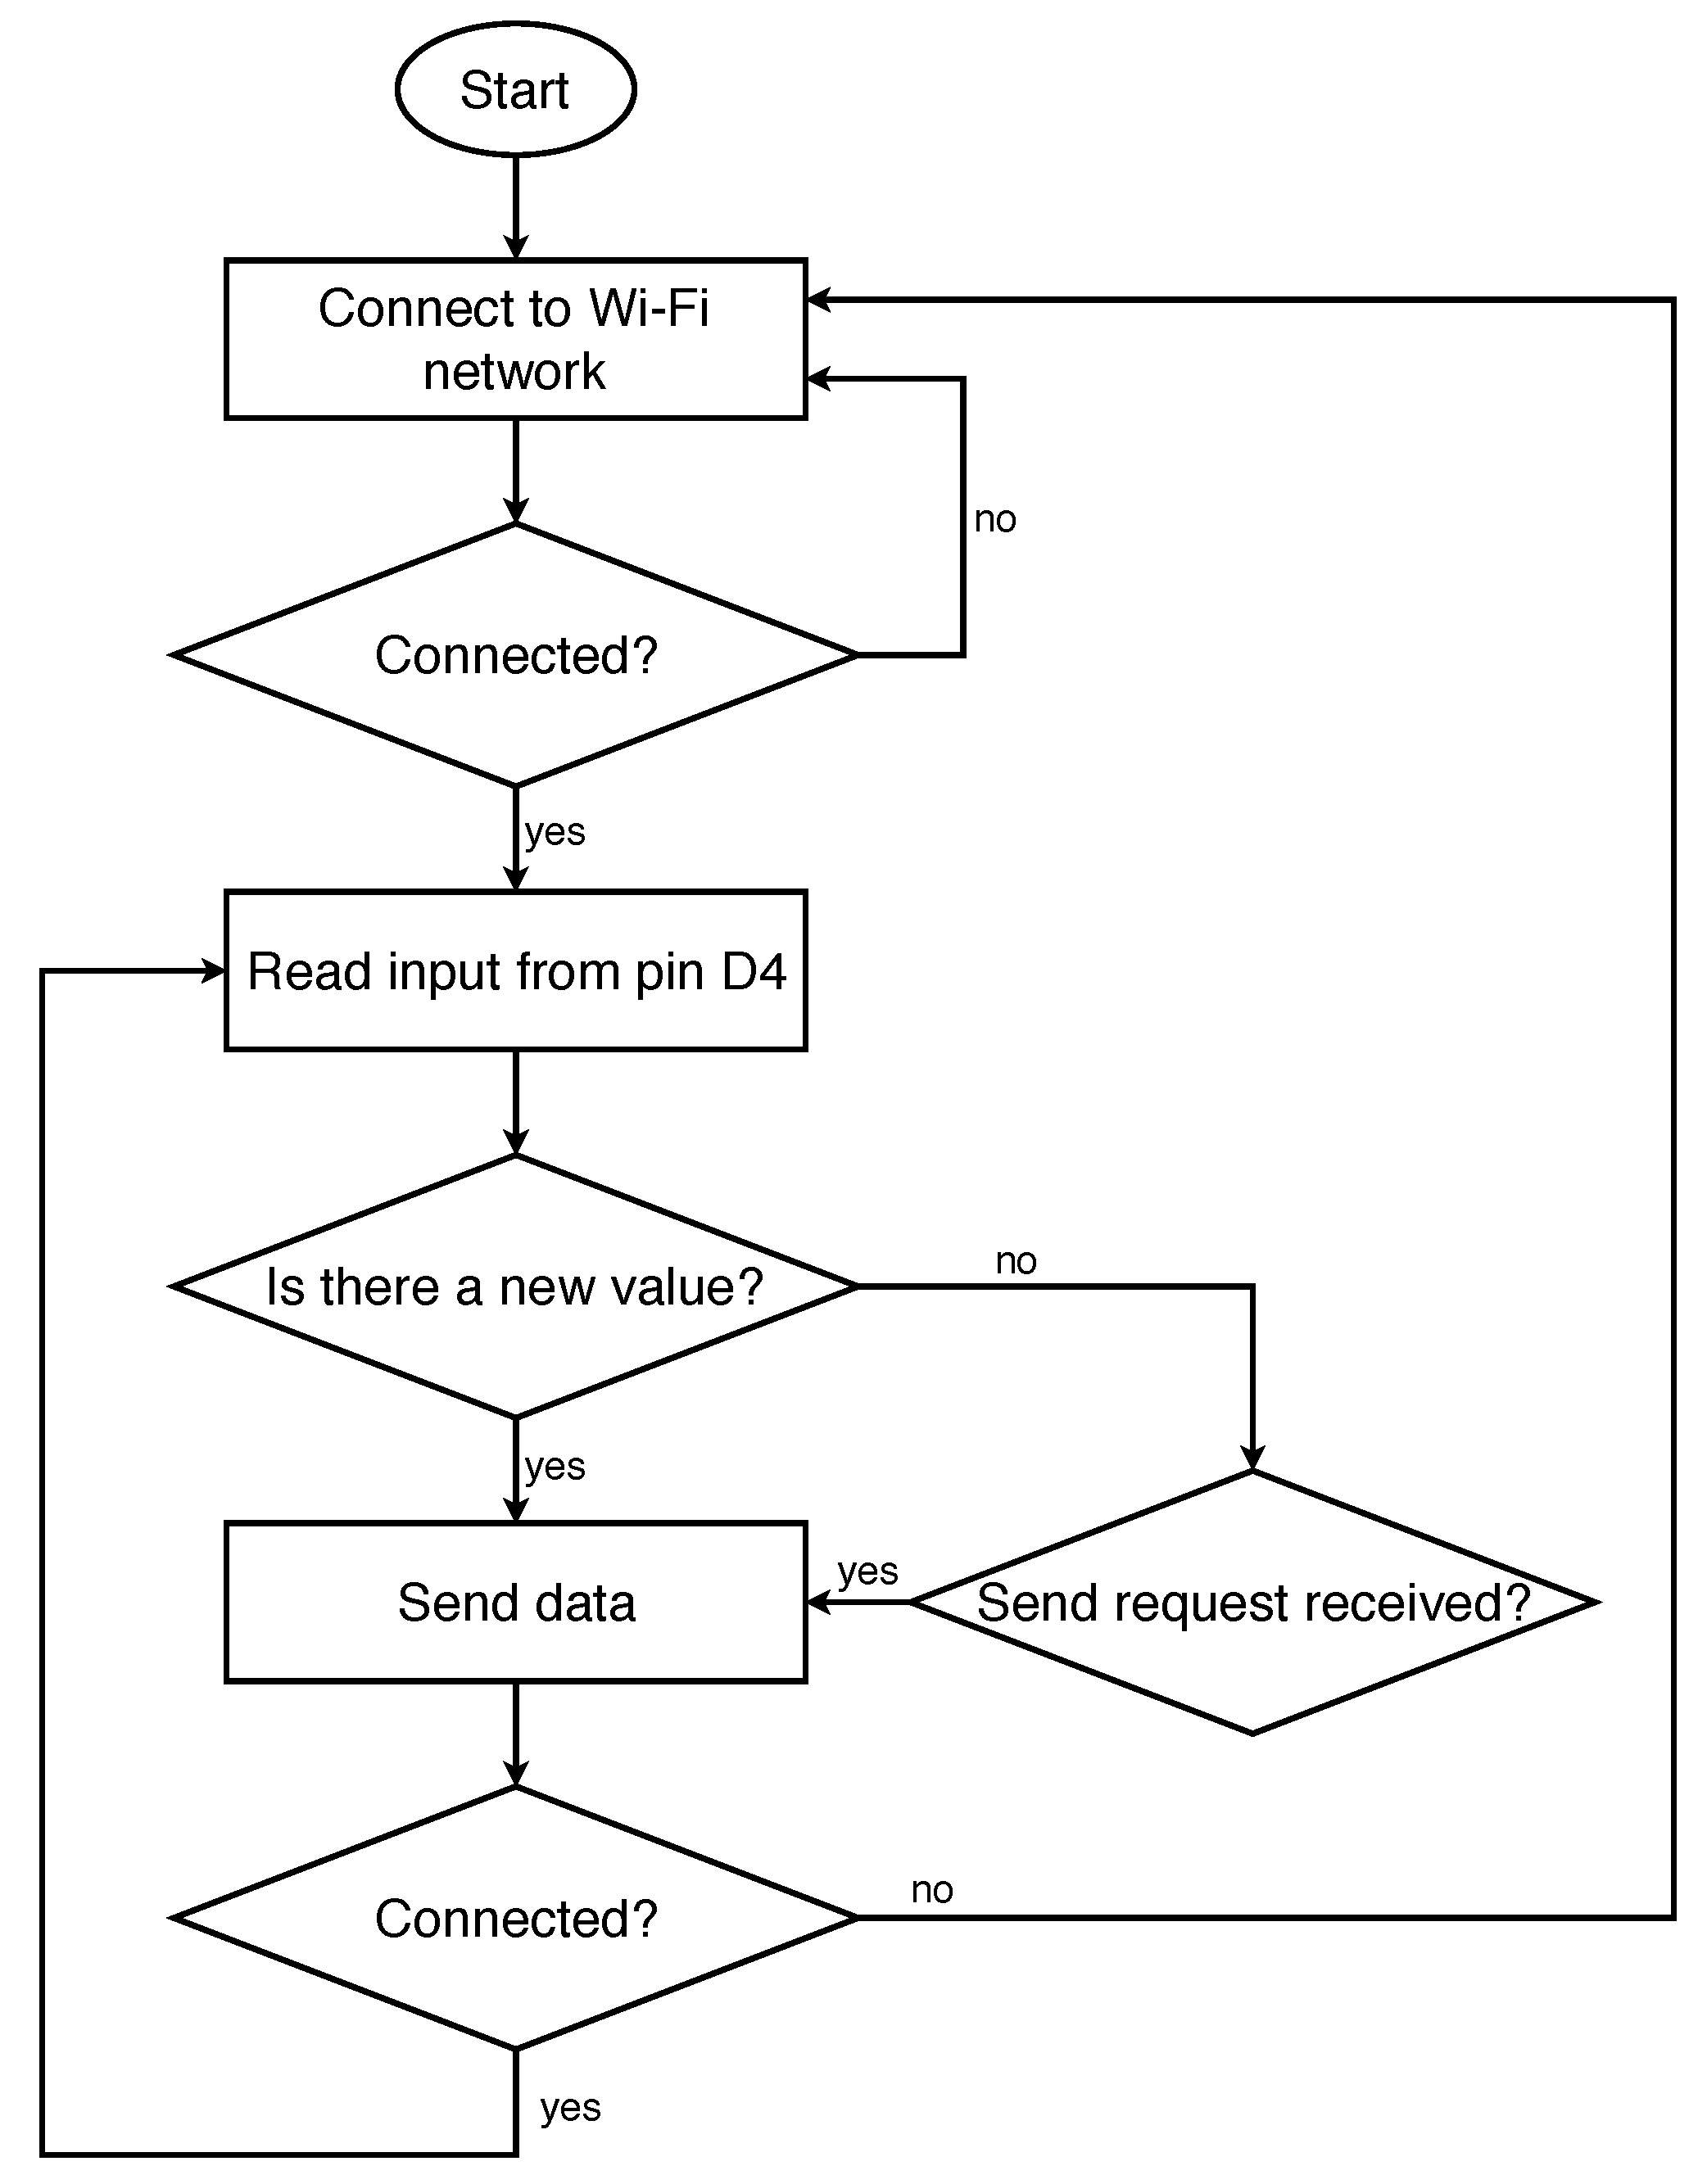
3.1. Obtaining Context Data
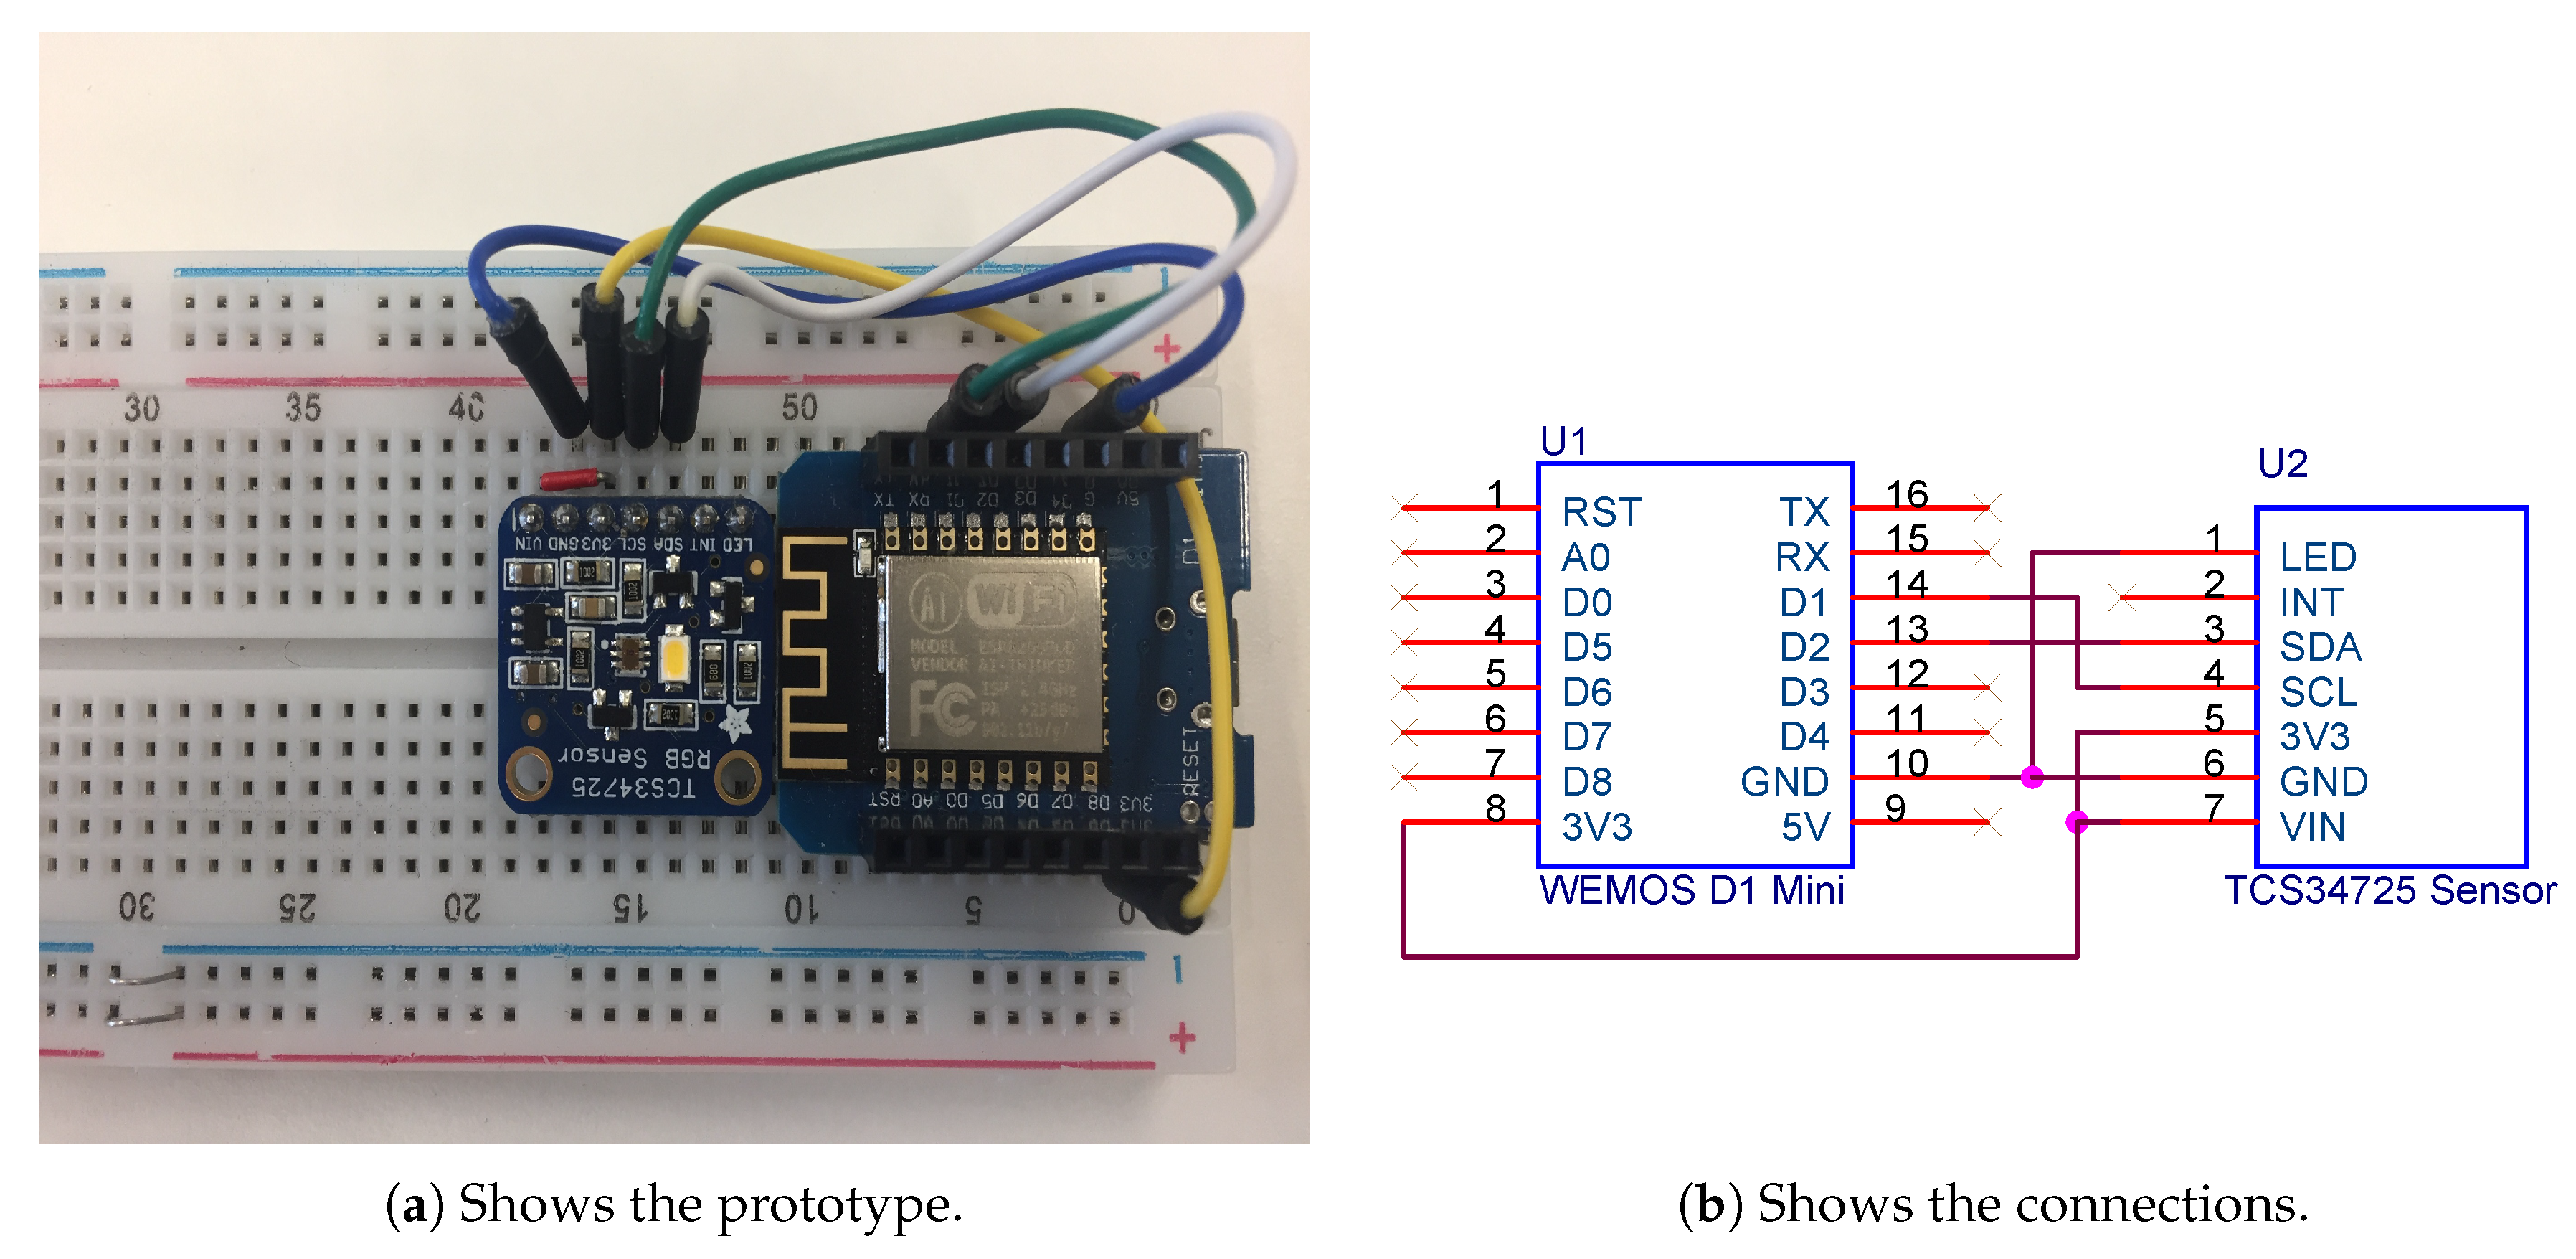
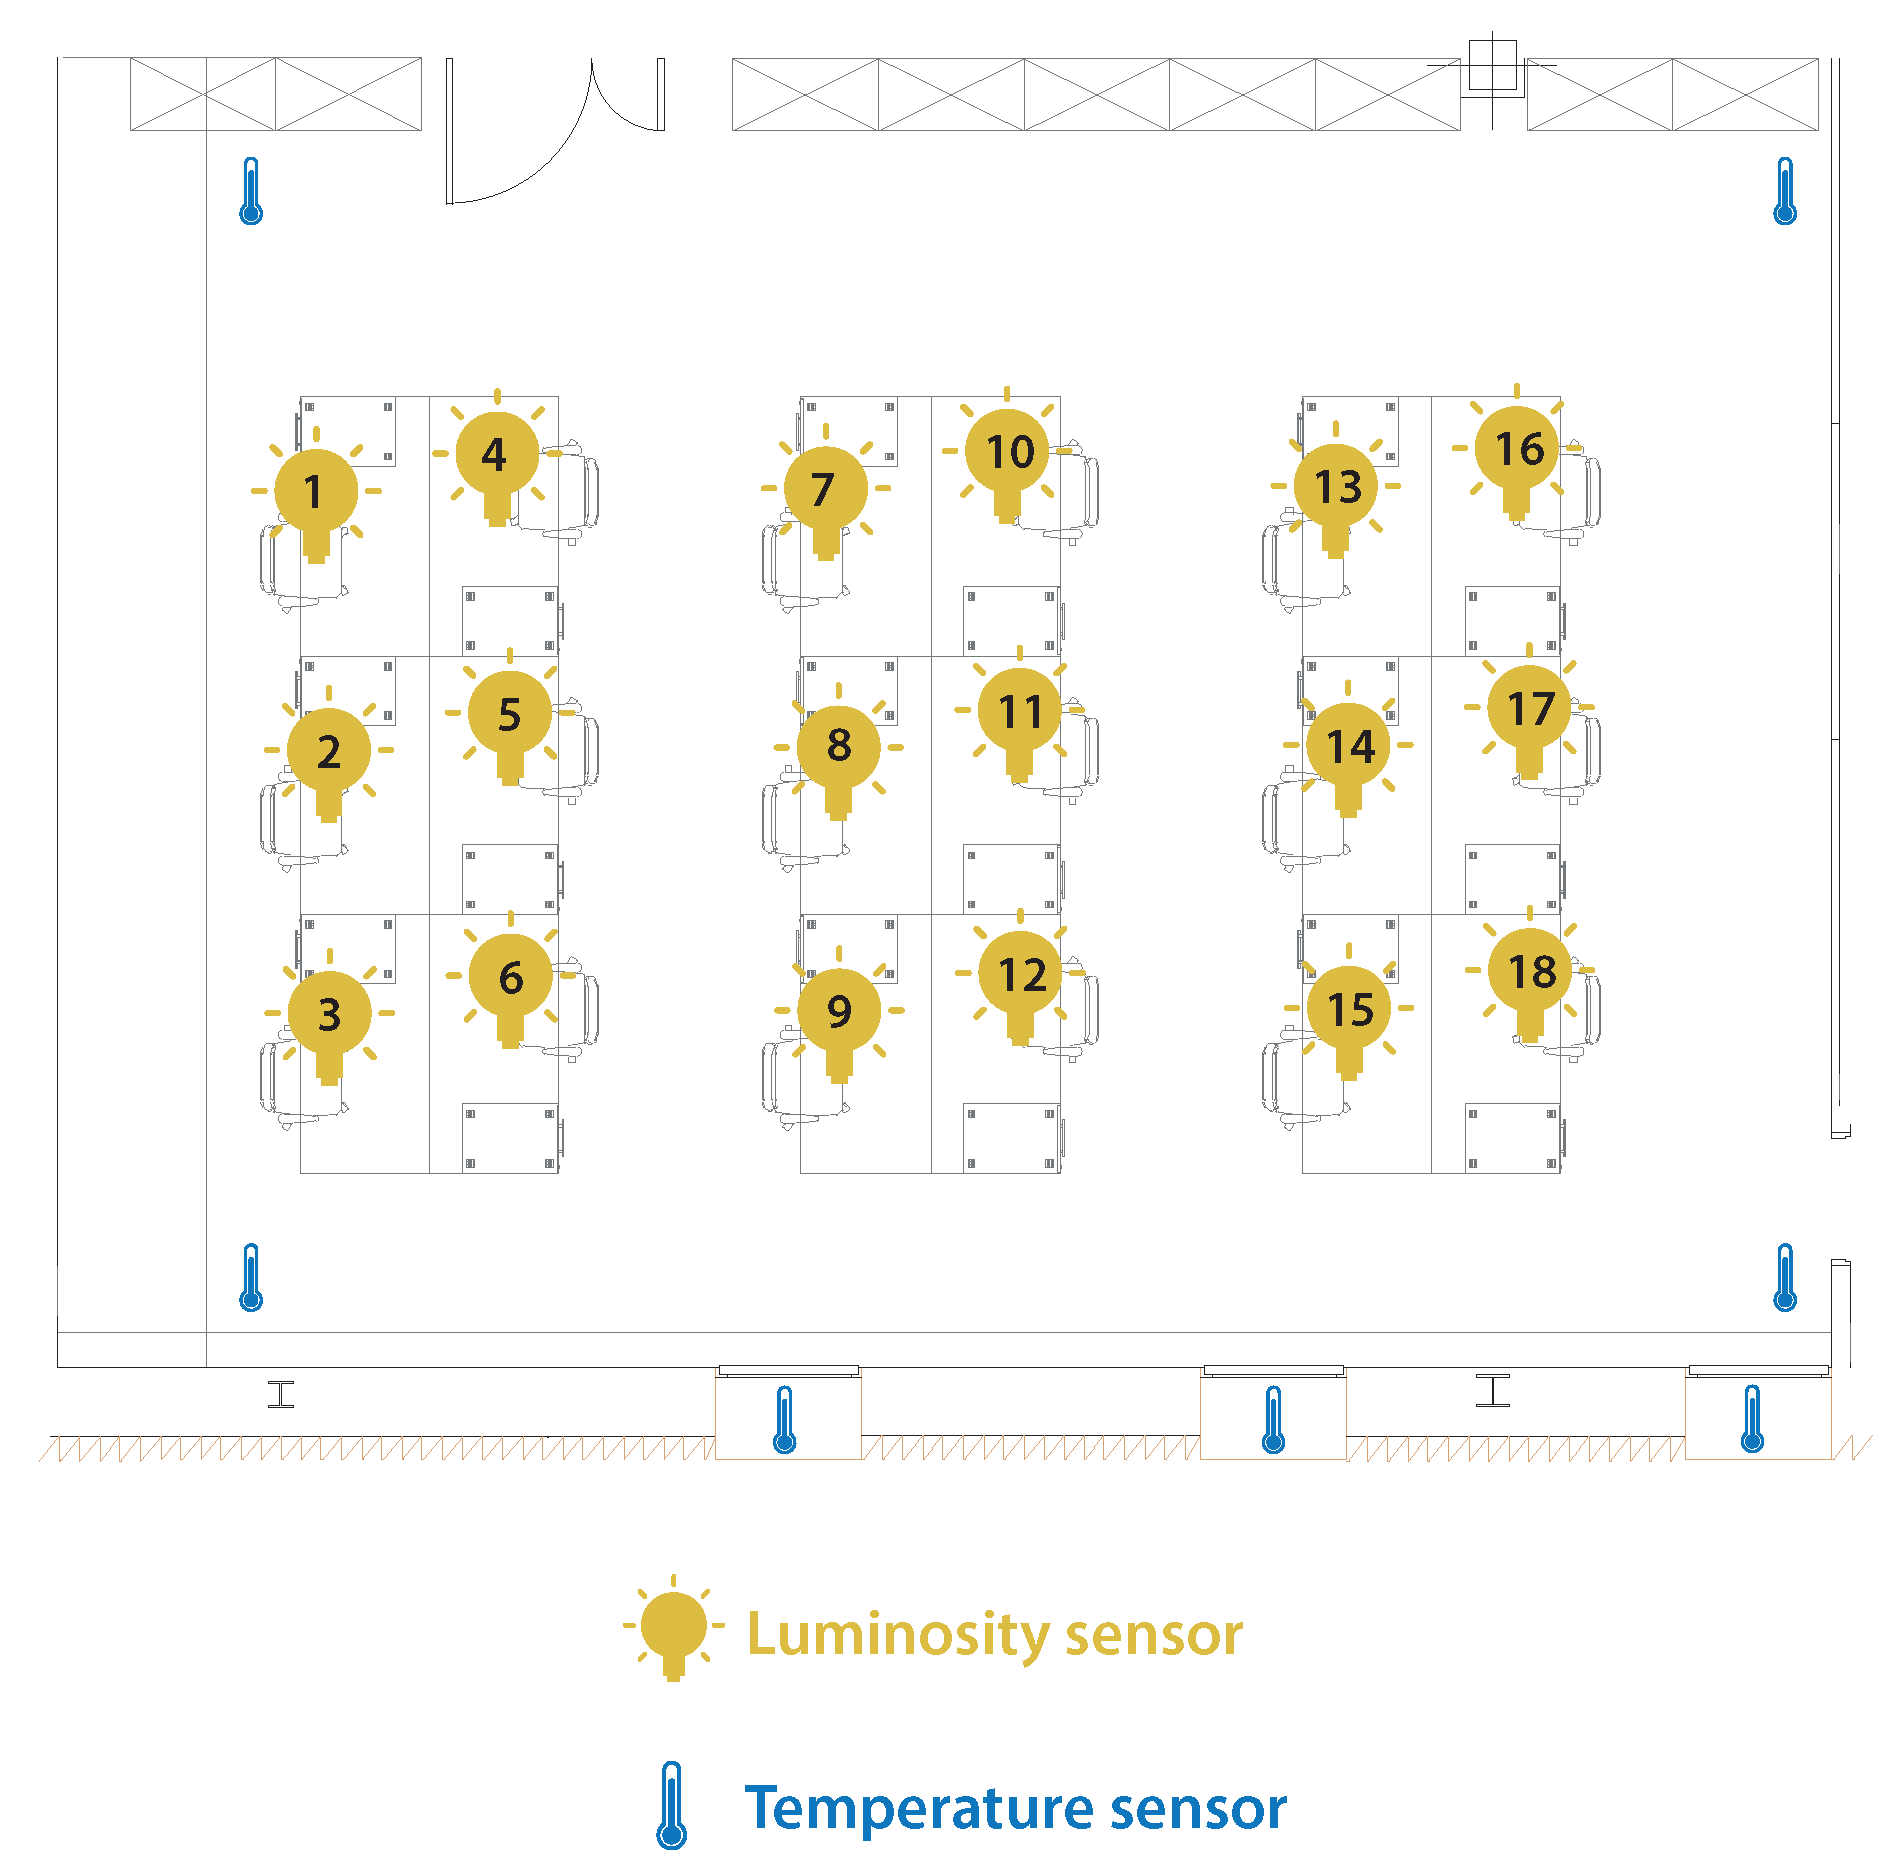
- Color light-to-digital converter with IR (Infrared Radiation) filter connected to a We-Mos D1 mini module (WEMOS, China) (ESP8266-based): This sensor allows for measuring the amount of lux in an office (1 lx = 1 lm/m), and it determines if the light is clear and the color in RGB format is obtained (Figure 1). This sensor has the IR blocking filter that minimizes the IR spectral component of the incoming light, providing much more accurate color measurements than those read by most sensors. The sensor also has an incredible 3,800,000:1 dynamic range with adjustable integration time and gain so it is suited for use behind darkened glass. This sensor works when connected to any microcontroller with IC and it can obtain four channel readings (red, green, blue and clear).
- Temperature sensors: Temperature is an important factor that is included in the agreement algorithm; therefore, it is necessary for the system to obtain the temperature values inside the rooms. This is done thanks to the DHT22 sensor that is used to obtain temperature and humidity values, this sensor can be seen in Figure 2. In cases where the walls of the offices face the outside, the system must also collect outdoor temperature. The importance of obtaining outdoor temperature data lies in the fact that the temperature is one of the key factors in the optimization of energy in households. This sensor allows us to measure temperatures between C and 125 C with an accuracy of 0.5 C, humidity measurement between 0% and 100% with an accuracy of 2–5% and a sampling frequency of 0.5 Hz.
3.2. Multi-Agent System Schema
- Environment Agent: the role of these agents is to provide information on the status of a single environment. A new Environment Agent is created for every environment that is introduced into the system.
- Sensor Agent(s): the amount of sensor agents created in the system depends on the characteristics of the environments registered in the system. These agents are responsible for providing information on the state of the brightness and temperature of the environment. Moreover, they detect when a user enters or leaves the environment (through the connection of their mobile device with the access point). There must be at least three Sensor Agents in every environment: one for measuring brightness, one for temperature and one for the identification of users in the environment.
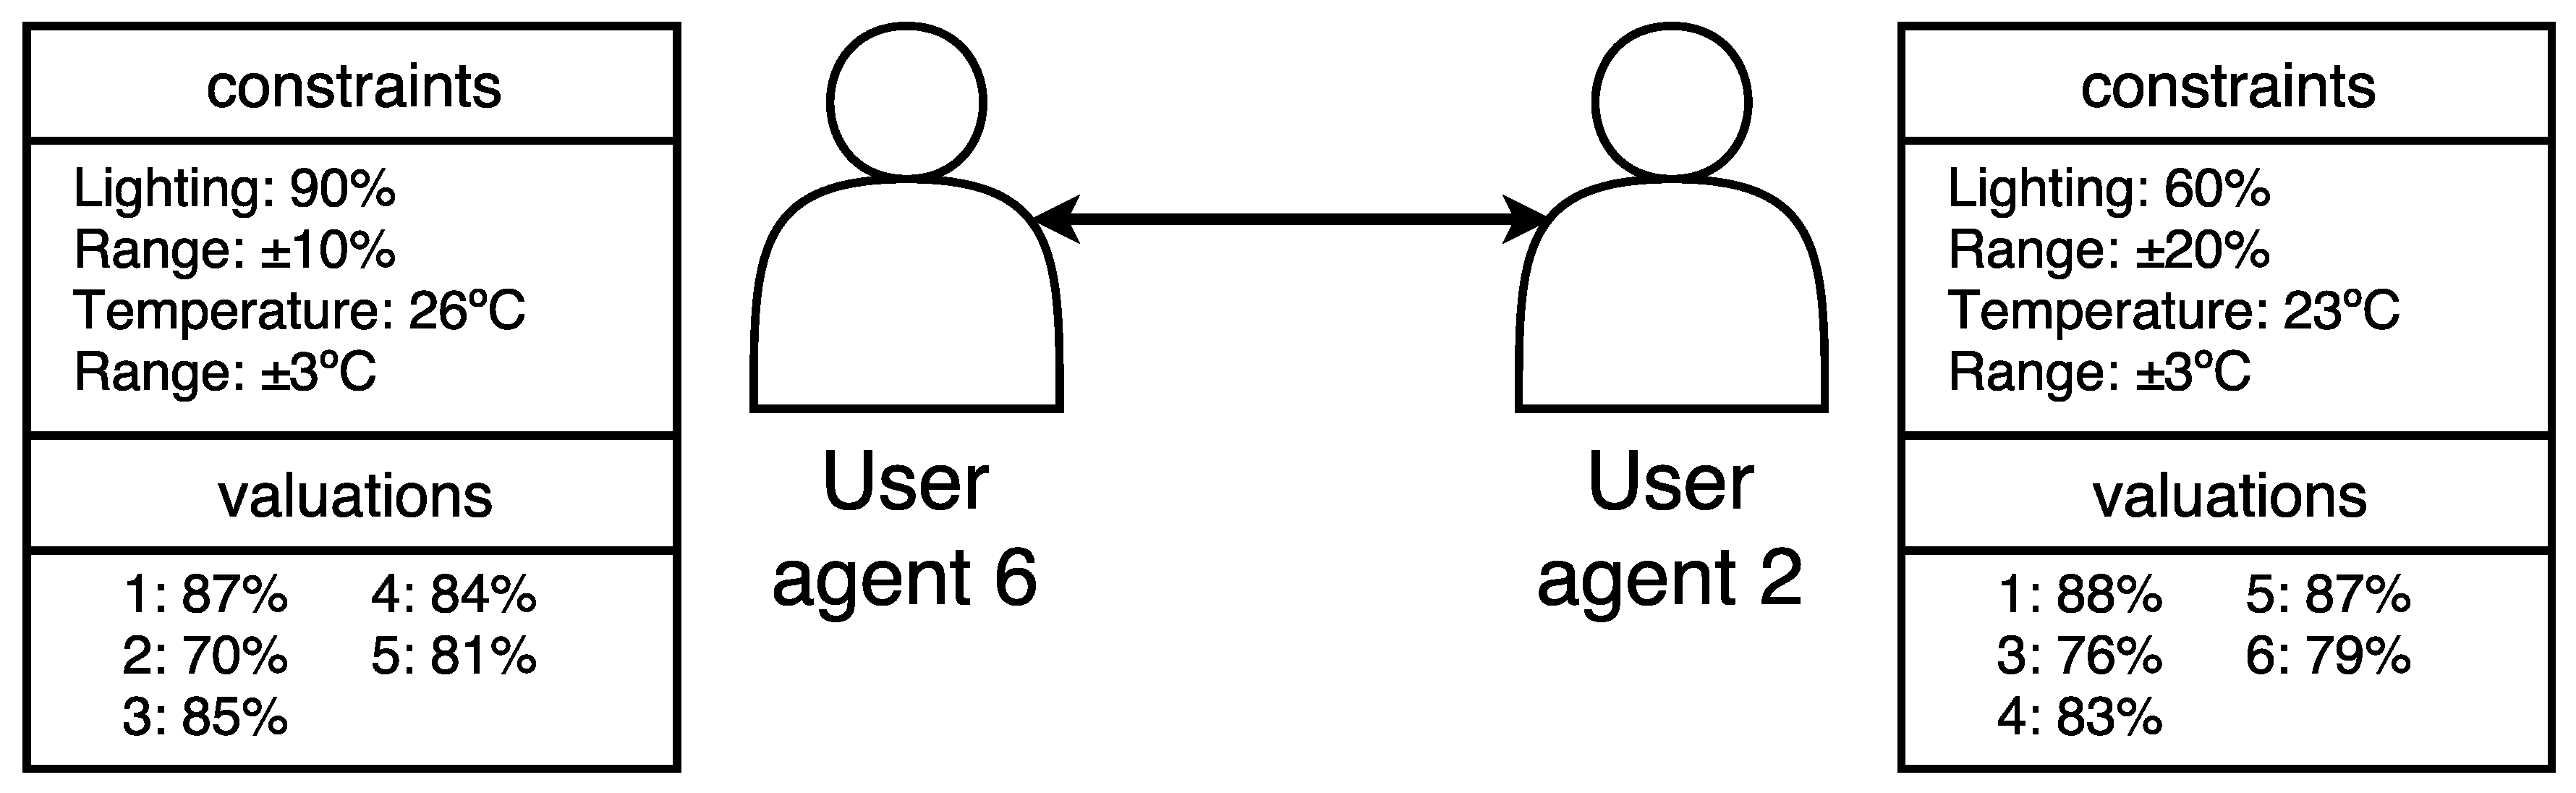
- Preference Agent: inhabitants use a mobile application to establish their preferences, the preference agent is in charge of keeping track of these preferences. The application is described further on in this paper. The users’ lighting and temperature preferences are specified, along with a comfort range.
- User Agent(s): these agents are responsible for the negotiation process described below. Each user agent is associated with a single user in the environment.
- Negotiation manager Agent: a Negotiation manager Agent is created in each environment in order to manage the negotiation process between User Agents.
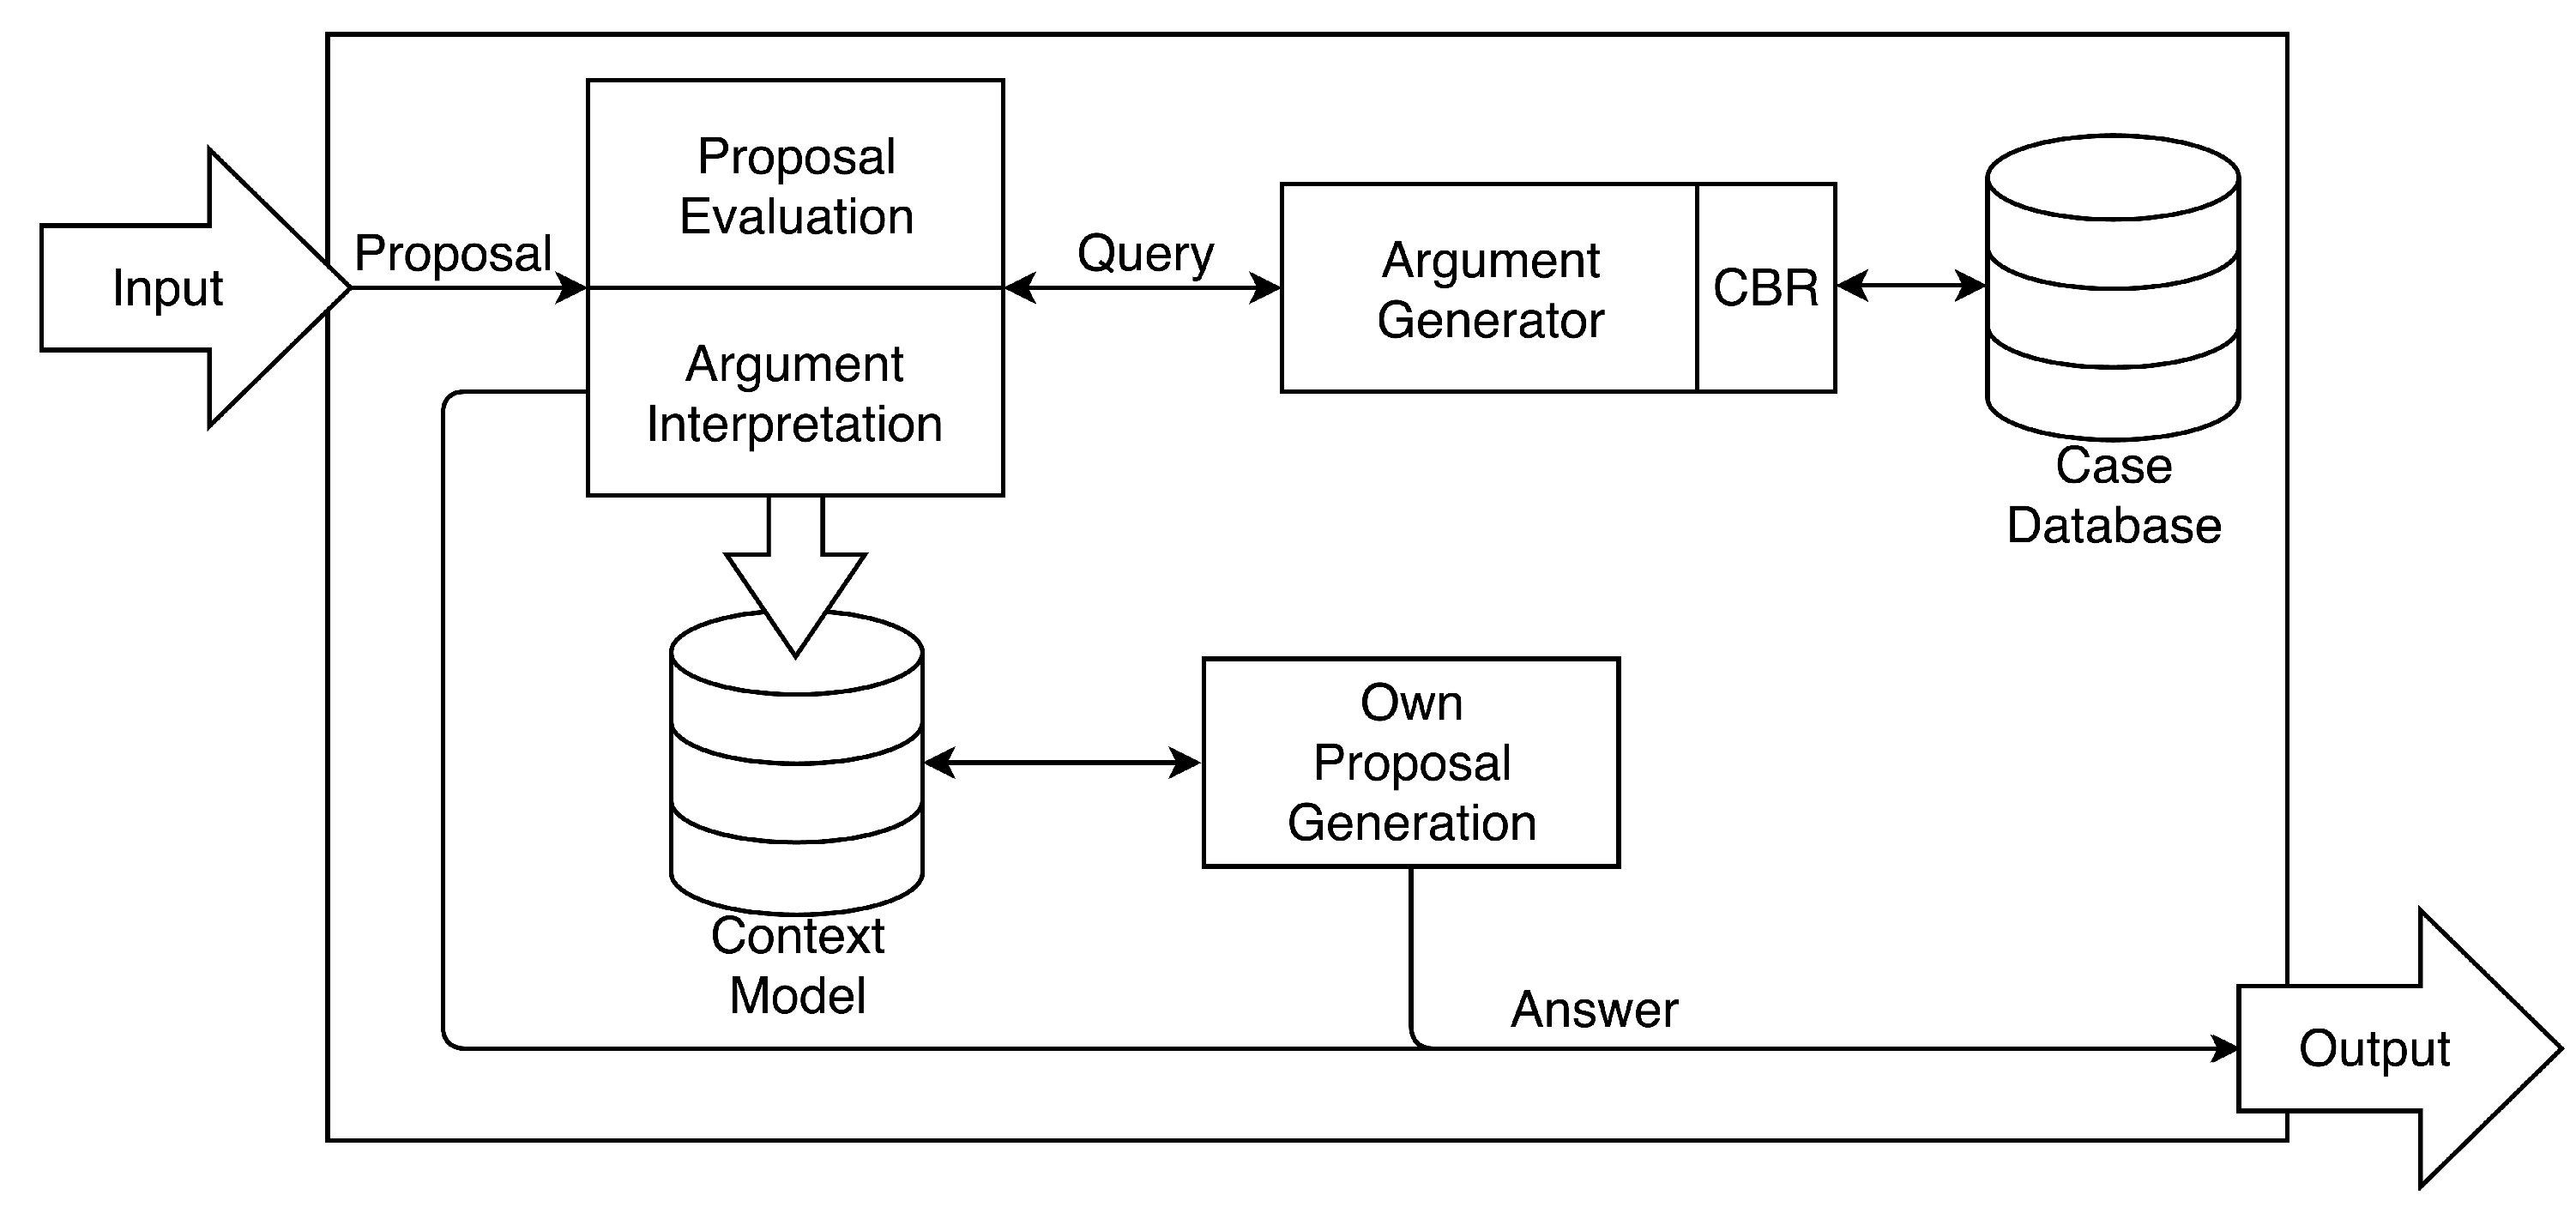
3.2.1. Negotiator Agent Model
3.2.2. Negotiation Description
3.2.3. Negotiation Mechanism
3.2.4. Use of Dialogue Model Locutions
- L1: open_dialogue(.): propose (AgentAction (Open_dialogue: environment “241”)).
- L2: enter_dialogue(.): accept-proposal (AgentAction (Open_dialogue: area “241”)).
- L3: desire_to_change(.): inform (Desire_to_change (Environment: attributes “83, 21; 80, 15, 22, 2; 60, 20, 23, 3; 95, 5, 20, 1; 82, 5, 20, 1; 75, 10, 20, 2”: constraints “90, 10, 26, 3”)).
- L4: desire_not_to_change(.): inform (Desire_not_to_change (Environment: attributes “83, 21; 80, 15, 22, 2; 60, 20, 23, 3; 95, 5, 20, 1; 82, 5, 20, 1; 75, 10, 20, 2”: constraints “60, 20, 23, 3”)).
- L5: prefer_to_change(.): inform (Prefer_to_change (Environment: attributes “83, 21; 80, 15, 22, 2; 60, 20, 23, 3; 95, 5, 20, 1; 82, 5, 20, 1; 75, 10, 20, 2”: constraints “90, 10, 26, 3”: valuation “(0.87, 0.79, 0.85, 0.84, 0.81)”)).
- L6: prefer_not_to_change(.): inform (Prefer_not_to_change (Environment: attributes ““83, 21; 80, 15, 22, 2; 60, 20, 23, 3; 95, 5, 20, 1; 82, 5, 20, 1; 75, 10, 20, 2”: constraints “60, 20, 23, 3”: valuation “0.88, 0.76, 0.83, 0.87, 0.79”)).
- L7: refuse_to_change(.): refuse (AgentAction (Change (Environment: attributes “83, 21; 80, 15, 22, 2; 60, 20, 23, 3; 95, 5, 20, 1; 82, 5, 20, 1; 75, 10, 20, 2”))).
- L8: refuse_not_to_change(.): refuse (AgentAction (Not_change (Environment: attributes “83, 21; 80, 15, 22, 2; 60, 20, 23, 3; 95, 5, 20, 1; 82, 5, 20, 1; 75, 10, 20, 2”))).
- L9: agree_to_change(.): propose (AgentAction (Agree_to_change (Environment: attributes “83, 21; 80, 15, 22, 2; 60, 20, 23, 3; 95, 5, 20, 1; 82, 5, 20, 1; 75, 10, 20, 2”))).
- L10: agree_not_to_change(.): accept-propose (AgentAction (Agree_not_to_change (Environment: attributes “83, 21; 80, 15, 22, 2; 60, 20, 23, 3; 95, 5, 20, 1; 82, 5, 20, 1; 75, 10, 20, 2”))).
- L11: withdraw_dialogue(.): inform (Withdraw_dialogue: environment “241”).
4. Case Study
4.1. Experimental Set-Up
4.2. Empirical Results
4.3. Statistical Validation
5. Conclusions
Author Contributions
Funding
Conflicts of Interest
References
- Stocker, T.F.; Qin, D.; Plattner, G.K.; Alexander, L.V.; Allen, S.K.; Bindoff, N.L.; Bréon, F.M.; Church, J.A.; Cubasch, U.; Emori, S.; et al. Technical summary. In Climate Change 2013: The Physical Science Basis. Contribution of Working Group I to the Fifth Assessment Report of the Intergovernmental Panel on Climate Change; Cambridge University Press: Cambridge, UK, 2013; pp. 33–115. [Google Scholar]
- Barbu, A.D.; Griffiths, N.; Morton, G. Achieving Energy Efficiency Through Behaviour Change: What Does It Take; European Environment Agency (EEA): Copenhagen, Denmark, 2013. [Google Scholar]
- European Commission. Communication from the Commission to the European Parliament, the Council, the European Economic and Social Committee and the Committee of the Regions; A Roadmap for Moving to a Competitive Low Carbon Economy in 2050, Impact Assessment, COM (2011) 112 Final; European Commission: Brussels, Belgium, 2011. [Google Scholar]
- EU2015.LV—Submission by Latvia and the European Commision on behalf of the European Union and its member states. [ebook] Latvian Presidency of the Council of the European Union. 2018. Available online: http://www4.unfccc.int/submissions/Lists/OSPSubmissionUpload/39_111_130723611366500236-LV-02-26-EU%20SubmissionCBannual.pdf (accessed on 22 February 2018).
- Council, E. European Council Conclusions, 4 February 2011. EUCO 2111 REV 1, 8 March 2011, Brussels. 2011. [Google Scholar]
- Kroposki, B.; Johnson, B.; Zhang, Y.; Gevorgian, V.; Denholm, P.; Hodge, B.M.; Hannegan, B. Achieving a 100% renewable grid: Operating electric power systems with extremely high levels of variable renewable energy. IEEE Power Energy Mag. 2017, 15, 61–73. [Google Scholar] [CrossRef]
- Pérez-Lombard, L.; Ortiz, J.; Pout, C. A review on buildings energy consumption information. Energy Build. 2008, 40, 394–398. [Google Scholar] [CrossRef]
- Sezgen, O.; Koomey, J.G. Interactions between lighting and space conditioning energy use in US commercial buildings. Energy 2000, 25, 793–805. [Google Scholar] [CrossRef]
- Nguyen, T.A.; Aiello, M. Energy intelligent buildings based on user activity: A survey. Energy Build. 2013, 56, 244–257. [Google Scholar] [CrossRef]
- Harle, R.K.; Hopper, A. The potential for location-aware power management. In Proceedings of the 10th International Conference on Ubiquitous Computing, Seoul, Korea, 21–24 September 2008; pp. 302–311. [Google Scholar]
- Padmanabh, K.; Malikarjuna, V.A.; Sen, S.; Katru, S.P.; Kumar, A.; Vuppala, S.K.; Paul, S. iSense: A wireless sensor network based conference room management system. In Proceedings of the First ACM Workshop on Embedded Sensing Systems for Energy-Efficiency in Buildings, Berkeley, CA, USA, 3 November 2009; pp. 37–42. [Google Scholar]
- García, O.; Chamoso, P.; Prieto, J.; Rodríguez, S.; de la Prieta, F. A Serious Game to Reduce Consumption in Smart Buildings. In International Conference on Practical Applications of Agents and Multi-Agent Systems; Springer: Cham, Switzerland, 2017; pp. 481–493. [Google Scholar]
- García, Ó.; Prieto, J.; Alonso, R.S.; Corchado, J.M. A Framework to Improve Energy Efficient Behaviour at Home through Activity and Context Monitoring. Sensors 2017, 17, 1749. [Google Scholar] [CrossRef] [PubMed]
- Dodier, R.H.; Henze, G.P.; Tiller, D.K.; Guo, X. Building occupancy detection through sensor belief networks. Energy Build. 2006, 38, 1033–1043. [Google Scholar] [CrossRef]
- Dong, B.; Lam, K.P. Building energy and comfort management through occupant behaviour pattern detection based on a large-scale environmental sensor network. J. Build. Perform. Simul. 2011, 4, 359–369. [Google Scholar] [CrossRef]
- Alonso, R.S.; Tapia, D.I.; Bajo, J.; García, Ó.; de Paz, J.F.; Corchado, J.M. Implementing a hardware-embedded reactive agents platform based on a service-oriented architecture over heterogeneous wireless sensor networks. Ad Hoc Netw. 2013, 11, 151–166. [Google Scholar] [CrossRef]
- Darakdjian, Q.; Billé, S.; Inard, C. Data mining of building performance simulations comprising occupant behaviour modelling. Adv. Build. Energy Res. 2017, 1–17. [Google Scholar] [CrossRef]
- Chapman, J.; Siebers, P.O.; Robinson, D. Multi-agent stochastic simulation of occupants for building simulation. In Proceedings of the Building Simulation 2017, 15th IBPSA Conference, San Francisco, CA, USA, 7–9 August 2017. [Google Scholar]
- Saba, D.; Degha, H.E.; Berbaoui, B.; Laallam, F.Z.; Maouedj, R. Contribution to the modeling and simulation of multiagent systems for energy saving in the habitat. In Proceedings of the IEEE 2017 International Conference on Mathematics and Information Technology (ICMIT), Adrar, Algeria, 4–5 December 2017; pp. 204–208. [Google Scholar]
- Klein, L.; Kavulya, G.; Jazizadeh, F.; Kwak, J.Y.; Becerik-Gerber, B.; Varakantham, P.; Tambe, M. Towards optimization of building energy and occupant comfort using multi-agent simulation. In Proceedings of the 28th International Symposium on Automation and Robotics in Construction, Seoul, Korea, 29 June–2 July 2011; pp. 251–256. [Google Scholar]
- Yang, R.; Wang, L. Development of multi-agent system for building energy and comfort management based on occupant behaviors. Energy Build. 2013, 56, 1–7. [Google Scholar] [CrossRef]
- Luck, M.; McBurney, P. Computing as interaction: Agent and agreement technologies. In IEEE international conference on distributed human-machine systems; IEEE Press: New York, NY, USA, 2008. [Google Scholar]
- Heras, S.; De la Prieta, F.; Julian, V.; Rodríguez, S.; Botti, V.; Bajo, J.; Corchado, J.M. Agreement technologies and their use in cloud computing environments. Prog. Artif. Intell. 2012, 1, 277–290. [Google Scholar] [CrossRef]
- Jennings, N.R.; Faratin, P.; Lomuscio, A.R.; Parsons, S.; Wooldridge, M.J.; Sierra, C. Automated negotiation: prospects, methods and challenges. Group Decis. Negot. 2001, 10, 199–215. [Google Scholar] [CrossRef]
- Villavicencio, C.; Schiaffino, S.; Diaz-Pace, J.A.; Monteserin, A.; Demazeau, Y.; Adam, C.A.; Monteserin, A.; Demazeau, Y.; Adam, C. A MAS approach for group recommendation based on negotiation techniques. In Advances in Practical Applications of Scalable Multi-Agent Systems. The PAAMS Collection; Springer: Cham, Switzerland, 2016; pp. 219–231. [Google Scholar]
- Ricci, F. Recommender systems: Models and techniques. In Encyclopedia of Social Network Analysis and Mining; Springer: New York, NY, USA, 2014; pp. 1511–1522. [Google Scholar]
- Bellido-Outeirino, F.J.; Flores-Arias, J.M.; Domingo-Perez, F.; Gil-de Castro, A.; Moreno-Munoz, A. Building lighting automation through the integration of DALI with wireless sensor networks. IEEE Trans. Consum. Electron. 2012, 58. [Google Scholar] [CrossRef]
- Moeck, M. Developments in digital addressable lighting control. J. Light Vis. Environ. 2004, 28, 104–106. [Google Scholar] [CrossRef]
- Nacer, A.; Marhic, B.; Delahoche, L. Smart Home, Smart HEMS, Smart heating: An overview of the latest products and trends. In Proceeding of the 2017 6th International Conference on IEEE Systems and Control (ICSC), Batna, Algeria, 7–9 May 2017; pp. 90–95. [Google Scholar]
- Samad, T.; Frank, B. Leveraging the web: A universal framework for building automation. In Proceeding of the 2007 American Control Conference (ACC’07. IEEE), New York, NY, USA, 9–13 July 2007; pp. 4382–4387. [Google Scholar]
- Dong, C.; Liu, X.; Hui, X. Study of Building Automation and Control Network Protocol BACnet Implementation Model. Comput. Eng. Appl. 2003, 5, 52. [Google Scholar]
- Demazeau, Y.; Muller, J.P. Decentralized AI: Proceedings of the 1st European Workshop on Modelling Autonomous Agents in a Multi-Agent World, Cambridge, UK, 16–18 August 1989; Elsevier Science Publishers BV: Amsterdam, The Netherlands, 1990. [Google Scholar]
- González-Briones, A.; Villarrubia, G.; De Paz, J.F.; Corchado, J.M. A multi-agent system for the classification of gender and age from images. Comput. Vis. Image Underst. 2018. [Google Scholar] [CrossRef]
- Rodríguez, S.; De Paz, J.F.; Villarrubia, G.; Zato, C.; Bajo, J.; Corchado, J.M. Multi-agent information fusion system to manage data from a WSN in a residential home. Inf. Fusion 2015, 23, 43–57. [Google Scholar] [CrossRef]
- González-Briones, A.; Chamoso, P.; Yoe, H.; Corchado, J.M. GreenVMAS: Virtual Organization Based Platform for Heating Greenhouses Using Waste Energy from Power Plants. Sensors 2018, 18, 861. [Google Scholar] [CrossRef] [PubMed]
- Ramos, J.; Castellanos-Garzón, J.A.; González-Briones, A.; de Paz, J.F.; Corchado, J.M. An agent-based clustering approach for gene selection in gene expression microarray. Interdiscip. Sci. Comput. Life Sci. 2017, 9, 1–13. [Google Scholar] [CrossRef] [PubMed]
- González-Briones, A.; Ramos, J.; De Paz, J.F.; Corchado, J.M. Multi-agent System for Obtaining Relevant Genes in Expression Analysis between Young and Older Women with Triple Negative Breast Cancer. J. Integr. Bioinform. 2015, 12, 1–14. [Google Scholar] [CrossRef] [PubMed]
- Corchado, J.M.; Bajo, J.; Tapia, D.I.; Abraham, A. Using heterogeneous wireless sensor networks in a telemonitoring system for healthcare. IEEE Trans. Inf. Technol. Biomed. 2010, 14, 234–240. [Google Scholar] [CrossRef] [PubMed]
- Wang, Z.; Yang, R.; Wang, L. Multi-agent control system with intelligent optimization for smart and energy-efficient buildings. In Proceedings of the IEEE IECON 2010—36th Annual Conference on IEEE Industrial Electronics Society, Glendale, AZ, USA, 7–10 November 2010; pp. 1144–1149. [Google Scholar]
- Cai, J.; Kim, D.; Putta, V.K.; Braun, J.E.; Hu, J. Multi-agent control for centralized air conditioning systems serving multi-zone buildings. In Proceedings of the 2015 IEEE American Control Conference (ACC), Chicago, IL, USA, 1–3 July 2015; pp. 986–993. [Google Scholar]
- Al-Daraiseh, A.; El-Qawasmeh, E.; Shah, N. Multi-agent system for energy consumption optimisation in higher education institutions. J. Comput. Syst. Sci. 2015, 81, 958–965. [Google Scholar] [CrossRef]
- Klein, L.; Kwak, J.Y.; Kavulya, G.; Jazizadeh, F.; Becerik-Gerber, B.; Varakantham, P.; Tambe, M. Coordinating occupant behavior for building energy and comfort management using multi-agent systems. Autom. Constr. 2012, 22, 525–536. [Google Scholar] [CrossRef]
- De Paz, J.F.; Bajo, J.; Rodríguez, S.; Villarrubia, G.; Corchado, J.M. Intelligent system for lighting control in smart cities. Inf. Sci. 2016, 372, 241–255. [Google Scholar] [CrossRef]
- González-Briones, A.; Prieto, J.; De La Prieta, F.; Herrera-Viedma, E.; Corchado, J.M. Energy Optimization Using a Case-Based Reasoning Strategy. Sensors 2018, 18, 865. [Google Scholar] [CrossRef] [PubMed]
- Bellifemine, F.; Poggi, A.; Rimassa, G. JADE: A FIPA2000 compliant agent development environment. In Proceedings of the Fifth International Conference on Autonomous Agents, Montreal, QC, Canada, 28 May–1 June 2001; pp. 216–217. [Google Scholar]
- Fipa, A. Fipa Acl Message Structure Specification. Foundation for Intelligent Physical Agents, 2002. Available online: http://www.fipa.org/specs/fipa00061/SC00061G.html (accessed on 30 June 2004).
- Zato, C.; Villarrubia, G.; Sánchez, A.; Barri, I.; Rubión, E.; Fernández, A.; Rebate, C.; Cabo, J.A.; Álamos, T.; Sanz, J.; et al. PANGEA–Platform for Automatic construction of organizations of intelligent Agents. In Distributed Computing and Artificial Intelligence; Springer: Berlin/Heidelberg, Germany, 2012; pp. 229–239. [Google Scholar]
- Sánchez, A.; Villarrubia, G.; Zato, C.; Rodríguez, S.; Chamoso, P. A gateway protocol based on FIPA-ACL for the new agent platform PANGEA. In Trends in Practical Applications of Agents and Multiagent Systems; Springer: Cham, Switzerland, 2013; pp. 41–51. [Google Scholar]
- IPMVP Committee. International Performance Measurement and Verification Protocol: Concepts and Options for Determining Energy and Water Savings, Volume I; Technical Report; National Renewable Energy Lab.: Golden, CO, USA, 2001. [Google Scholar]
- Guerrisi, A.; Martino, M.; Tartaglia, M. Energy saving in social housing: An innovative ICT service to improve the occupant behaviour. In Proceedings of the 2012 IEEE International Conference on Renewable Energy Research and Applications (ICRERA), Nagasaki, Japan, 11–14 November 2012; pp. 1–6. [Google Scholar]


| Concept |
| AgentAction - Open_dialogue: environmentID (Integer) - Agree_to_change: proposal (Environment instance) - Change: proposal (Environment instance) - Not_change: proposal (Environment instance) |
| Environment: attributes (String) |
| Change Requirement: constraints (String) |
| Change Requirement Valuation: constraints (String): valuation (String) |
| Predicate |
| Desire_to_change: environment (Environment instance): change requirement (Change Requirement instance) |
| Desire_not_to_change: environment (Environment instance): change requirement (Change Requirement instance) |
| Prefer_to_change: environment (Environment instance): change requirement valuation (Change Requirement Valuation instance) |
| Prefer_not_to_change: environment (Environment instance): change requirement valuation (Change Requirement Valuation instance) |
| Withdraw_dialogue: area (String) |
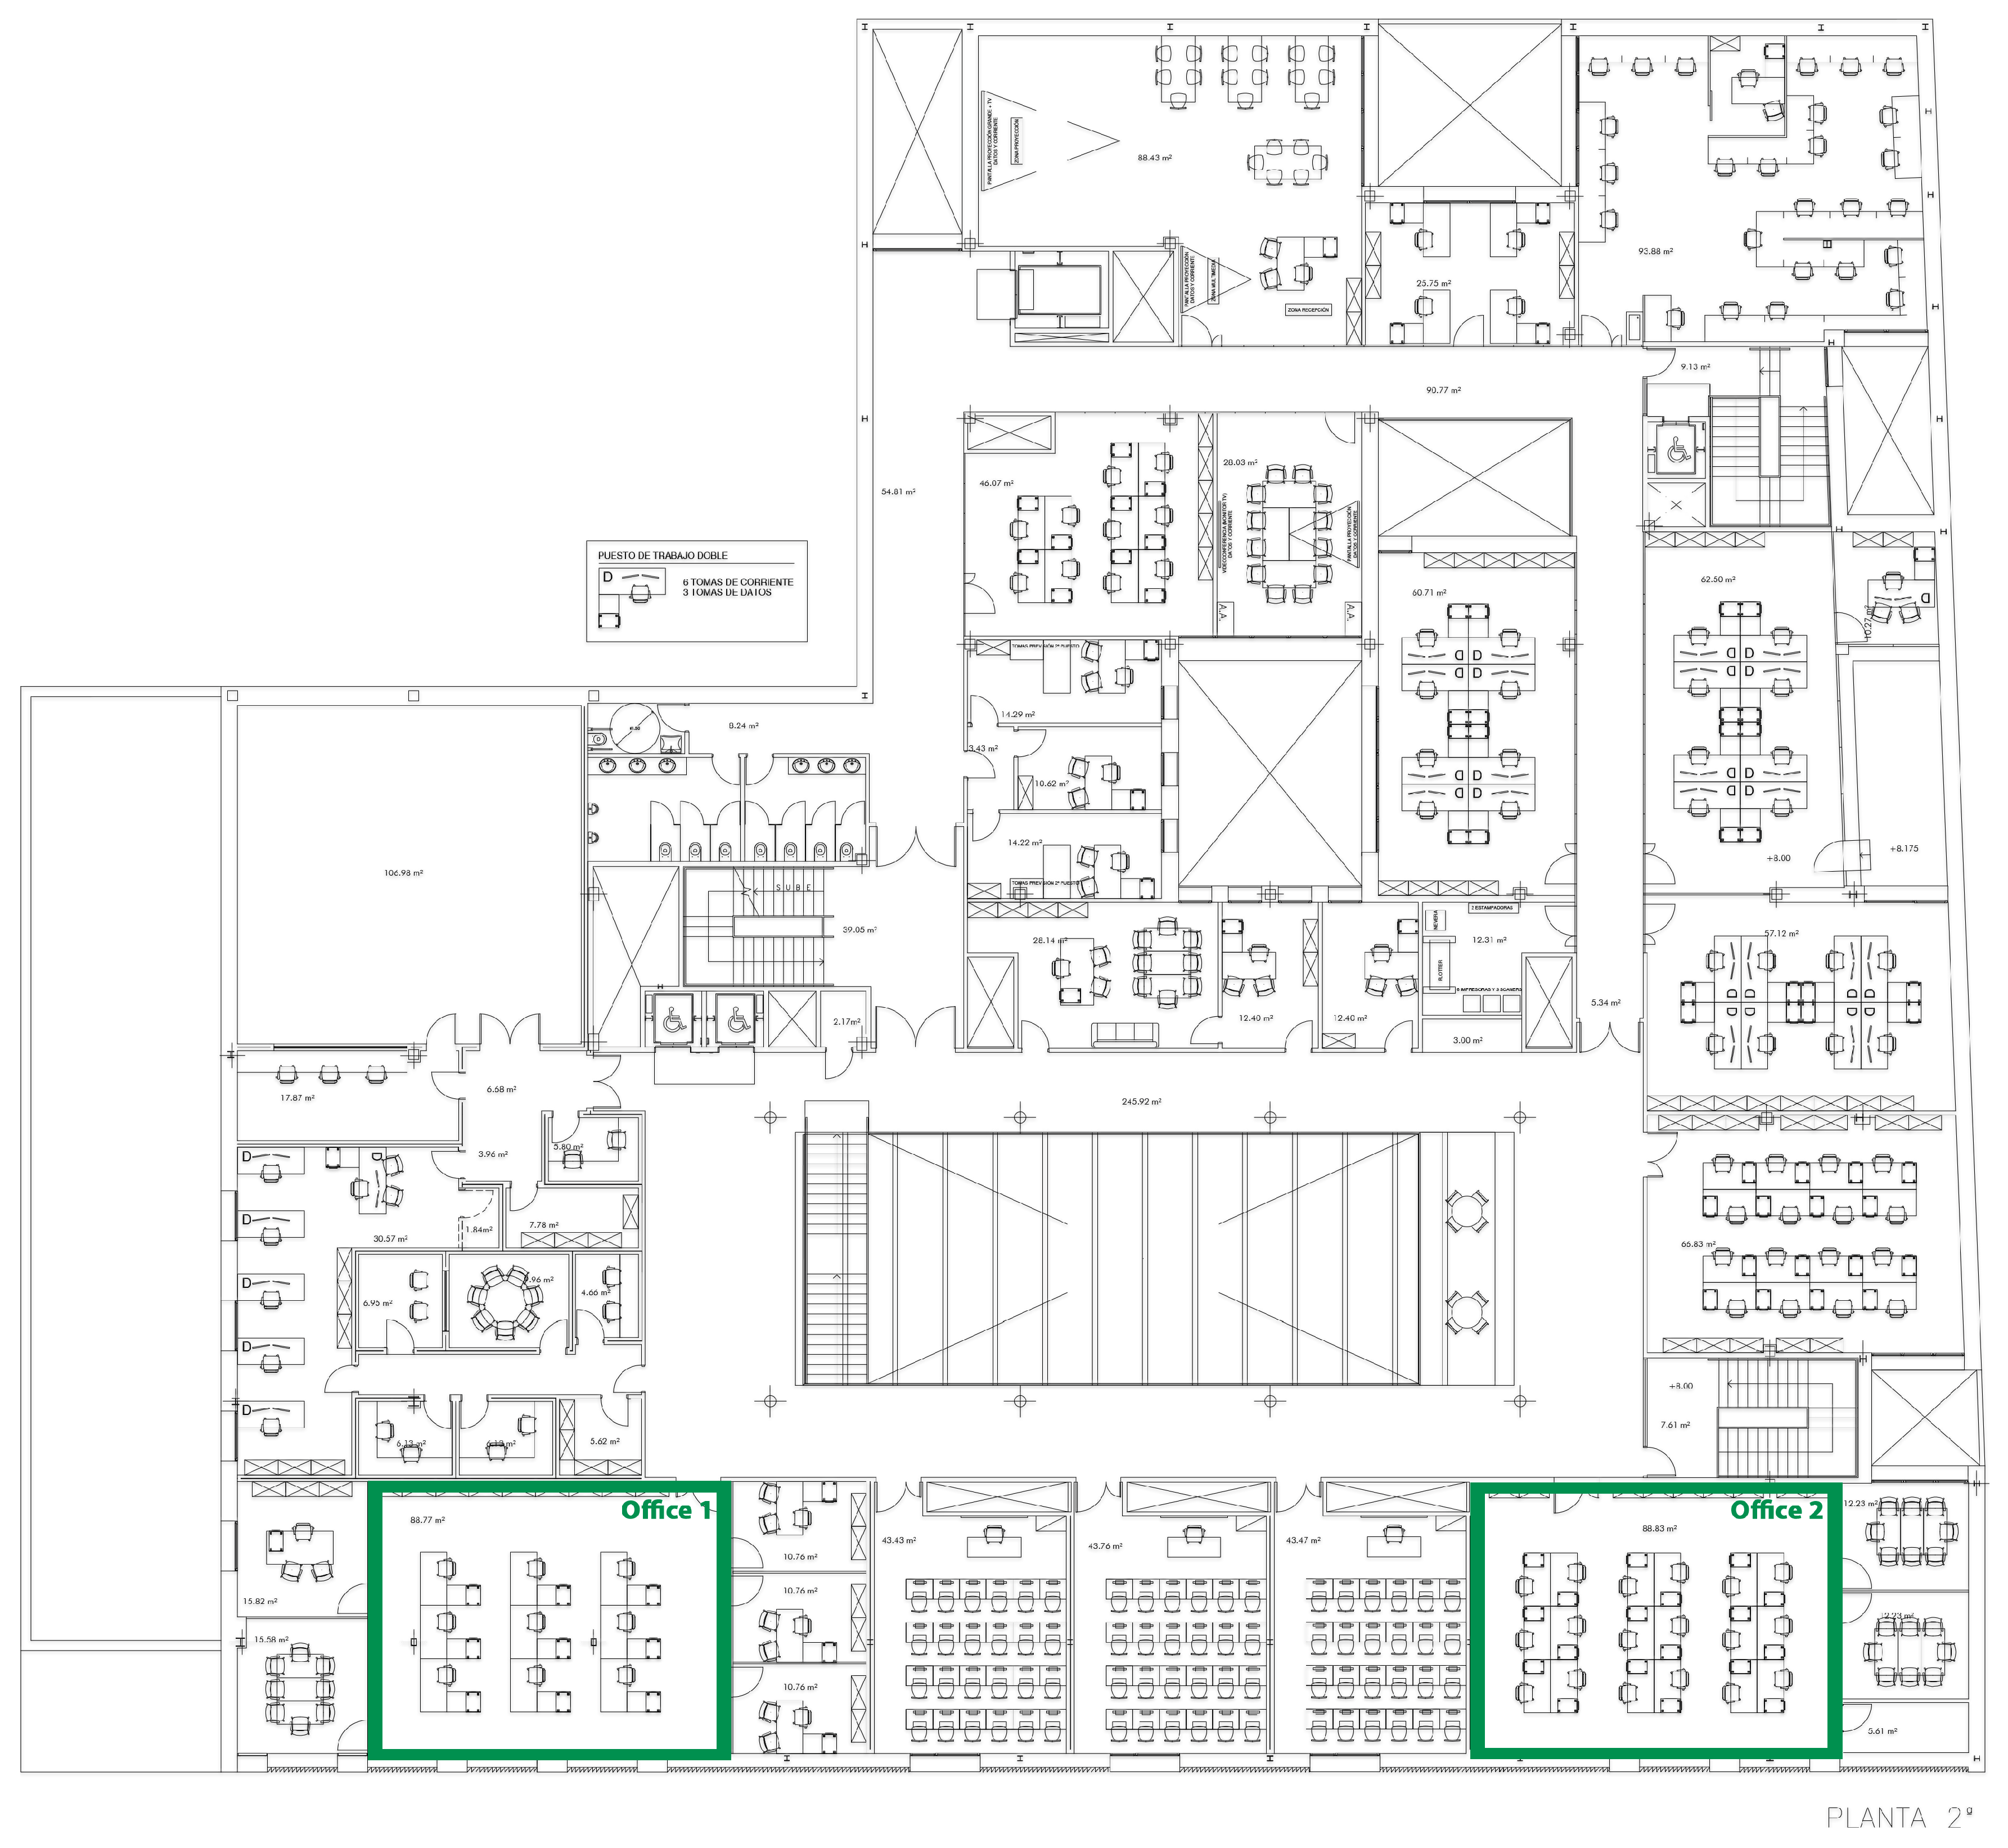
| Office 1 | Office 2 | |
|---|---|---|
| Cardinal situation | SE | SE |
| Office dimensions | 88.83 m | 88.83 m |
| Number of workplaces | 18 | 25 |
| Number of windows | 1 | 1 |
| m2 of window surface | 6.3 m | 6.3 m |
| Office 1 (Control Group) | Office 2 (Experimental Group) | ||
|---|---|---|---|
| Baseline period | Avg. Outdoor Temp (C) | 2.52 | 3.54 |
| Avg. Indoor Temp (C) | 22.29 | 22.75 | |
| Avg. Luminous flux (lx) | 689 | 673 | |
| Energy Consumption (Wh) | 43.69 | 44.00 | |
| Intervention period | Avg. Outdoor Temp (C) | 7.48 | 7.48 |
| Avg. Indoor Temp (C) | 19.98 | 21.64 | |
| Avg. Luminous flux (lx) | 747 | 575 | |
| Energy Consumption (Wh) | 40.19 | 36.45 |
| Office 1 (Control Group) | Office 2 (Experimental Group) | |
|---|---|---|
| Baseline period–Consumption (Wh) | 43.6929 | 44.0033 |
| Intervention period—Consumption (Wh) | 40.1943 | 36.4548 |
| Difference (Wh) | 3.4986 | 7.5485 |
| Savings (%) | 8.00 | 17.15 |
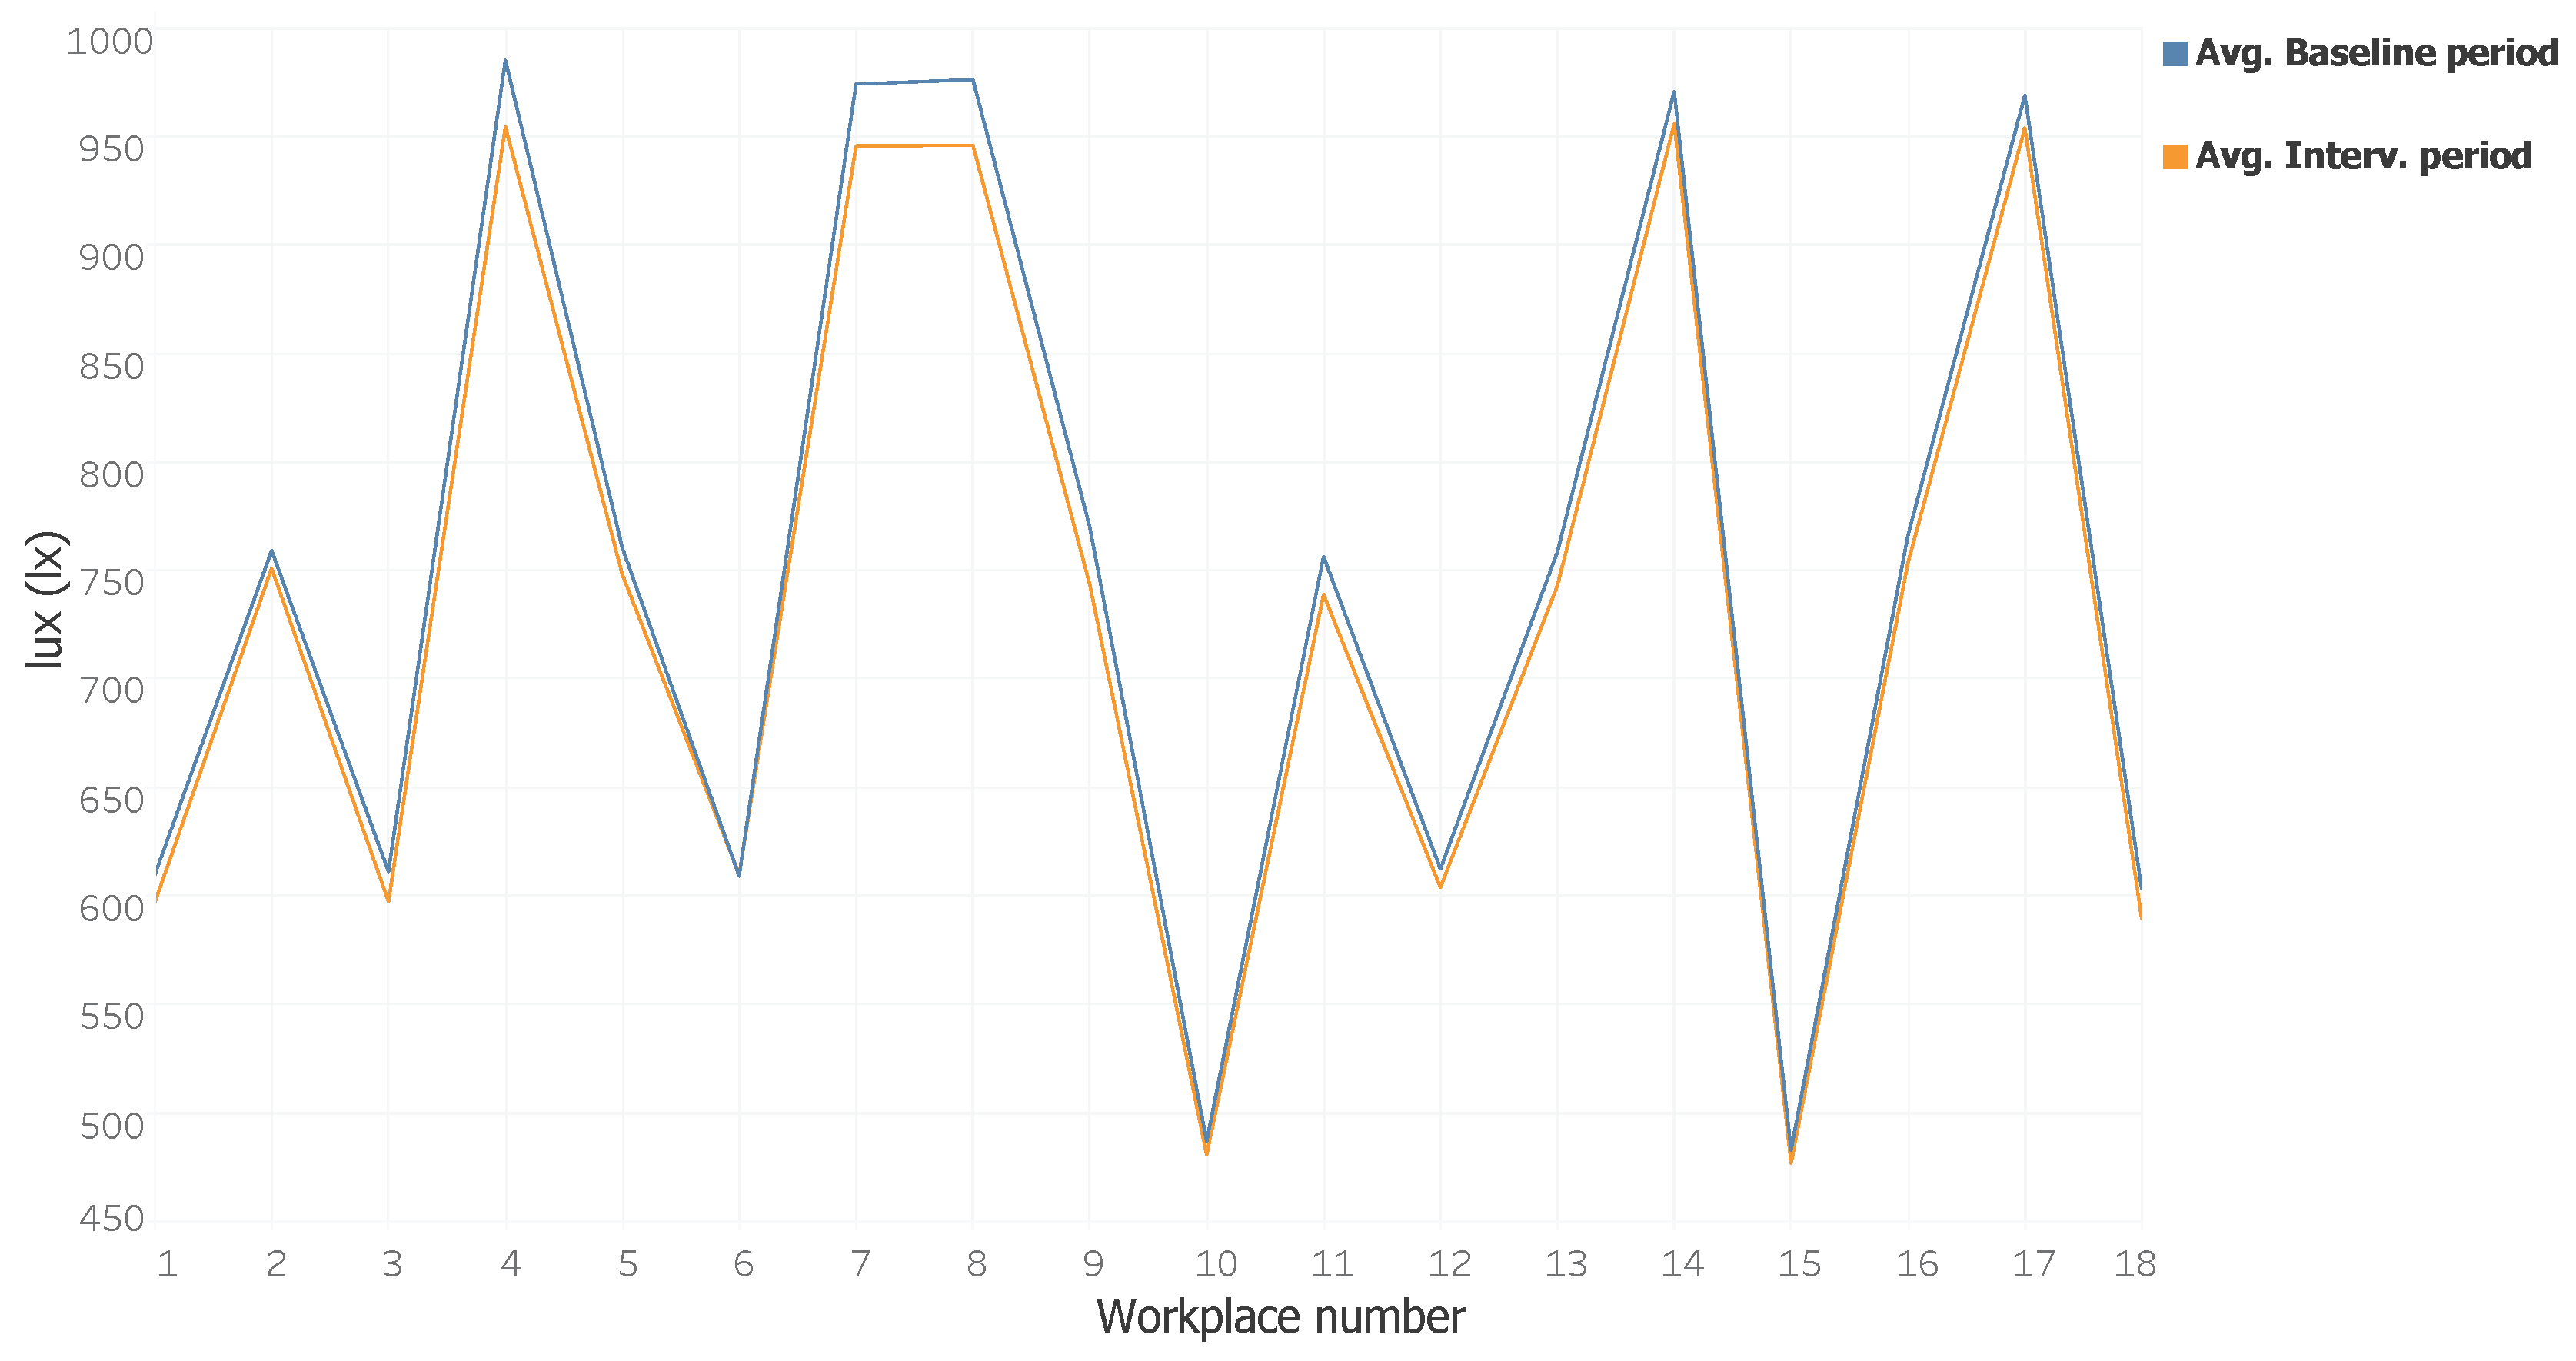
| Workplace | ||||||||||||||||||||
|---|---|---|---|---|---|---|---|---|---|---|---|---|---|---|---|---|---|---|---|---|
| 1 | 2 | 3 | 4 | 5 | 6 | 7 | 8 | 9 | 10 | 11 | 12 | 13 | 14 | 15 | 16 | 17 | 18 | Avg. | ||
| Baseline Period | Week 1 | 596 | 747 | 596 | 959 | 747 | 596 | 956 | 959 | 747 | 475 | 747 | 596 | 742 | 959 | 475 | 747 | 959 | 596 | 733.28 |
| Week 2 | 632 | 771 | 621 | 1001 | 779 | 620 | 1002 | 999 | 809 | 500 | 768 | 631 | 771 | 990 | 493 | 791 | 982 | 612 | 765,11 | |
| Week 3 | 612 | 765 | 615 | 978 | 763 | 612 | 972 | 978 | 766 | 491 | 756 | 624 | 765 | 974 | 482 | 777 | 970 | 610 | 750.56 | |
| Week 4 | 598 | 753 | 612 | 1002 | 752 | 608 | 966 | 968 | 757 | 481 | 754 | 598 | 755 | 959 | 481 | 749 | 964 | 594 | 741.72 | |
| Interv. Period | Week 1 | 588 | 732 | 575 | 948 | 741 | 596 | 934 | 942 | 725 | 481 | 736 | 578 | 739 | 963 | 480 | 736 | 847 | 577 | 723.22 |
| Week 2 | 625 | 761 | 604 | 950 | 765 | 611 | 957 | 957 | 760 | 502 | 754 | 624 | 745 | 948 | 484 | 744 | 942 | 615 | 741.56 | |
| Week 3 | 596 | 765 | 602 | 960 | 736 | 636 | 955 | 948 | 745 | 477 | 732 | 611 | 745 | 968 | 471 | 780 | 970 | 601 | 738.78 | |
| Week 4 | 578 | 745 | 608 | 959 | 750 | 596 | 936 | 936 | 743 | 462 | 733 | 602 | 742 | 944 | 472 | 753 | 956 | 564 | 726.61 | |
| Baseline Period | Intervention Period | |||||||
|---|---|---|---|---|---|---|---|---|
| Mean (kWh) | Stdr. Deviation (kWh) | Mean (kWh) | Stdr. Deviation (kWh) | t | Sig. (2-tailed) | F | Sig. | |
| Office 1 (Control Group) | 43.6929 | 1.15606 | 40.1943 | 3.68999 | 4.146 | 0.000 | 38.635 | 0.000 |
| Office 2 (Experimental Group) | 44.0033 | 0.58033 | 36.4548 | 1.65132 | 19.763 | 0.000 | 20.027 | 0.000 |
© 2018 by the authors. Licensee MDPI, Basel, Switzerland. This article is an open access article distributed under the terms and conditions of the Creative Commons Attribution (CC BY) license (http://creativecommons.org/licenses/by/4.0/).
Share and Cite
González-Briones, A.; Chamoso, P.; De La Prieta, F.; Demazeau, Y.; Corchado, J.M. Agreement Technologies for Energy Optimization at Home. Sensors 2018, 18, 1633. https://doi.org/10.3390/s18051633
González-Briones A, Chamoso P, De La Prieta F, Demazeau Y, Corchado JM. Agreement Technologies for Energy Optimization at Home. Sensors. 2018; 18(5):1633. https://doi.org/10.3390/s18051633
Chicago/Turabian StyleGonzález-Briones, Alfonso, Pablo Chamoso, Fernando De La Prieta, Yves Demazeau, and Juan M. Corchado. 2018. "Agreement Technologies for Energy Optimization at Home" Sensors 18, no. 5: 1633. https://doi.org/10.3390/s18051633
APA StyleGonzález-Briones, A., Chamoso, P., De La Prieta, F., Demazeau, Y., & Corchado, J. M. (2018). Agreement Technologies for Energy Optimization at Home. Sensors, 18(5), 1633. https://doi.org/10.3390/s18051633