Integrated Method for Personal Thermal Comfort Assessment and Optimization through Users’ Feedback, IoT and Machine Learning: A Case Study † †

 ,
,  ,
,
Abstract
:1. Introduction
2. Description of the Framework
- a monitoring system composed by:
- ○
- a nearable device (a term composed by the words “near” and “wearable”) for the monitoring of the environmental parameters nearby the user;
- ○
- a wearable device for the monitoring of subjective variables;
- a web-based survey for the detection of users feedback in terms of TSV;
- a parametric model to assess the real TC conditions.
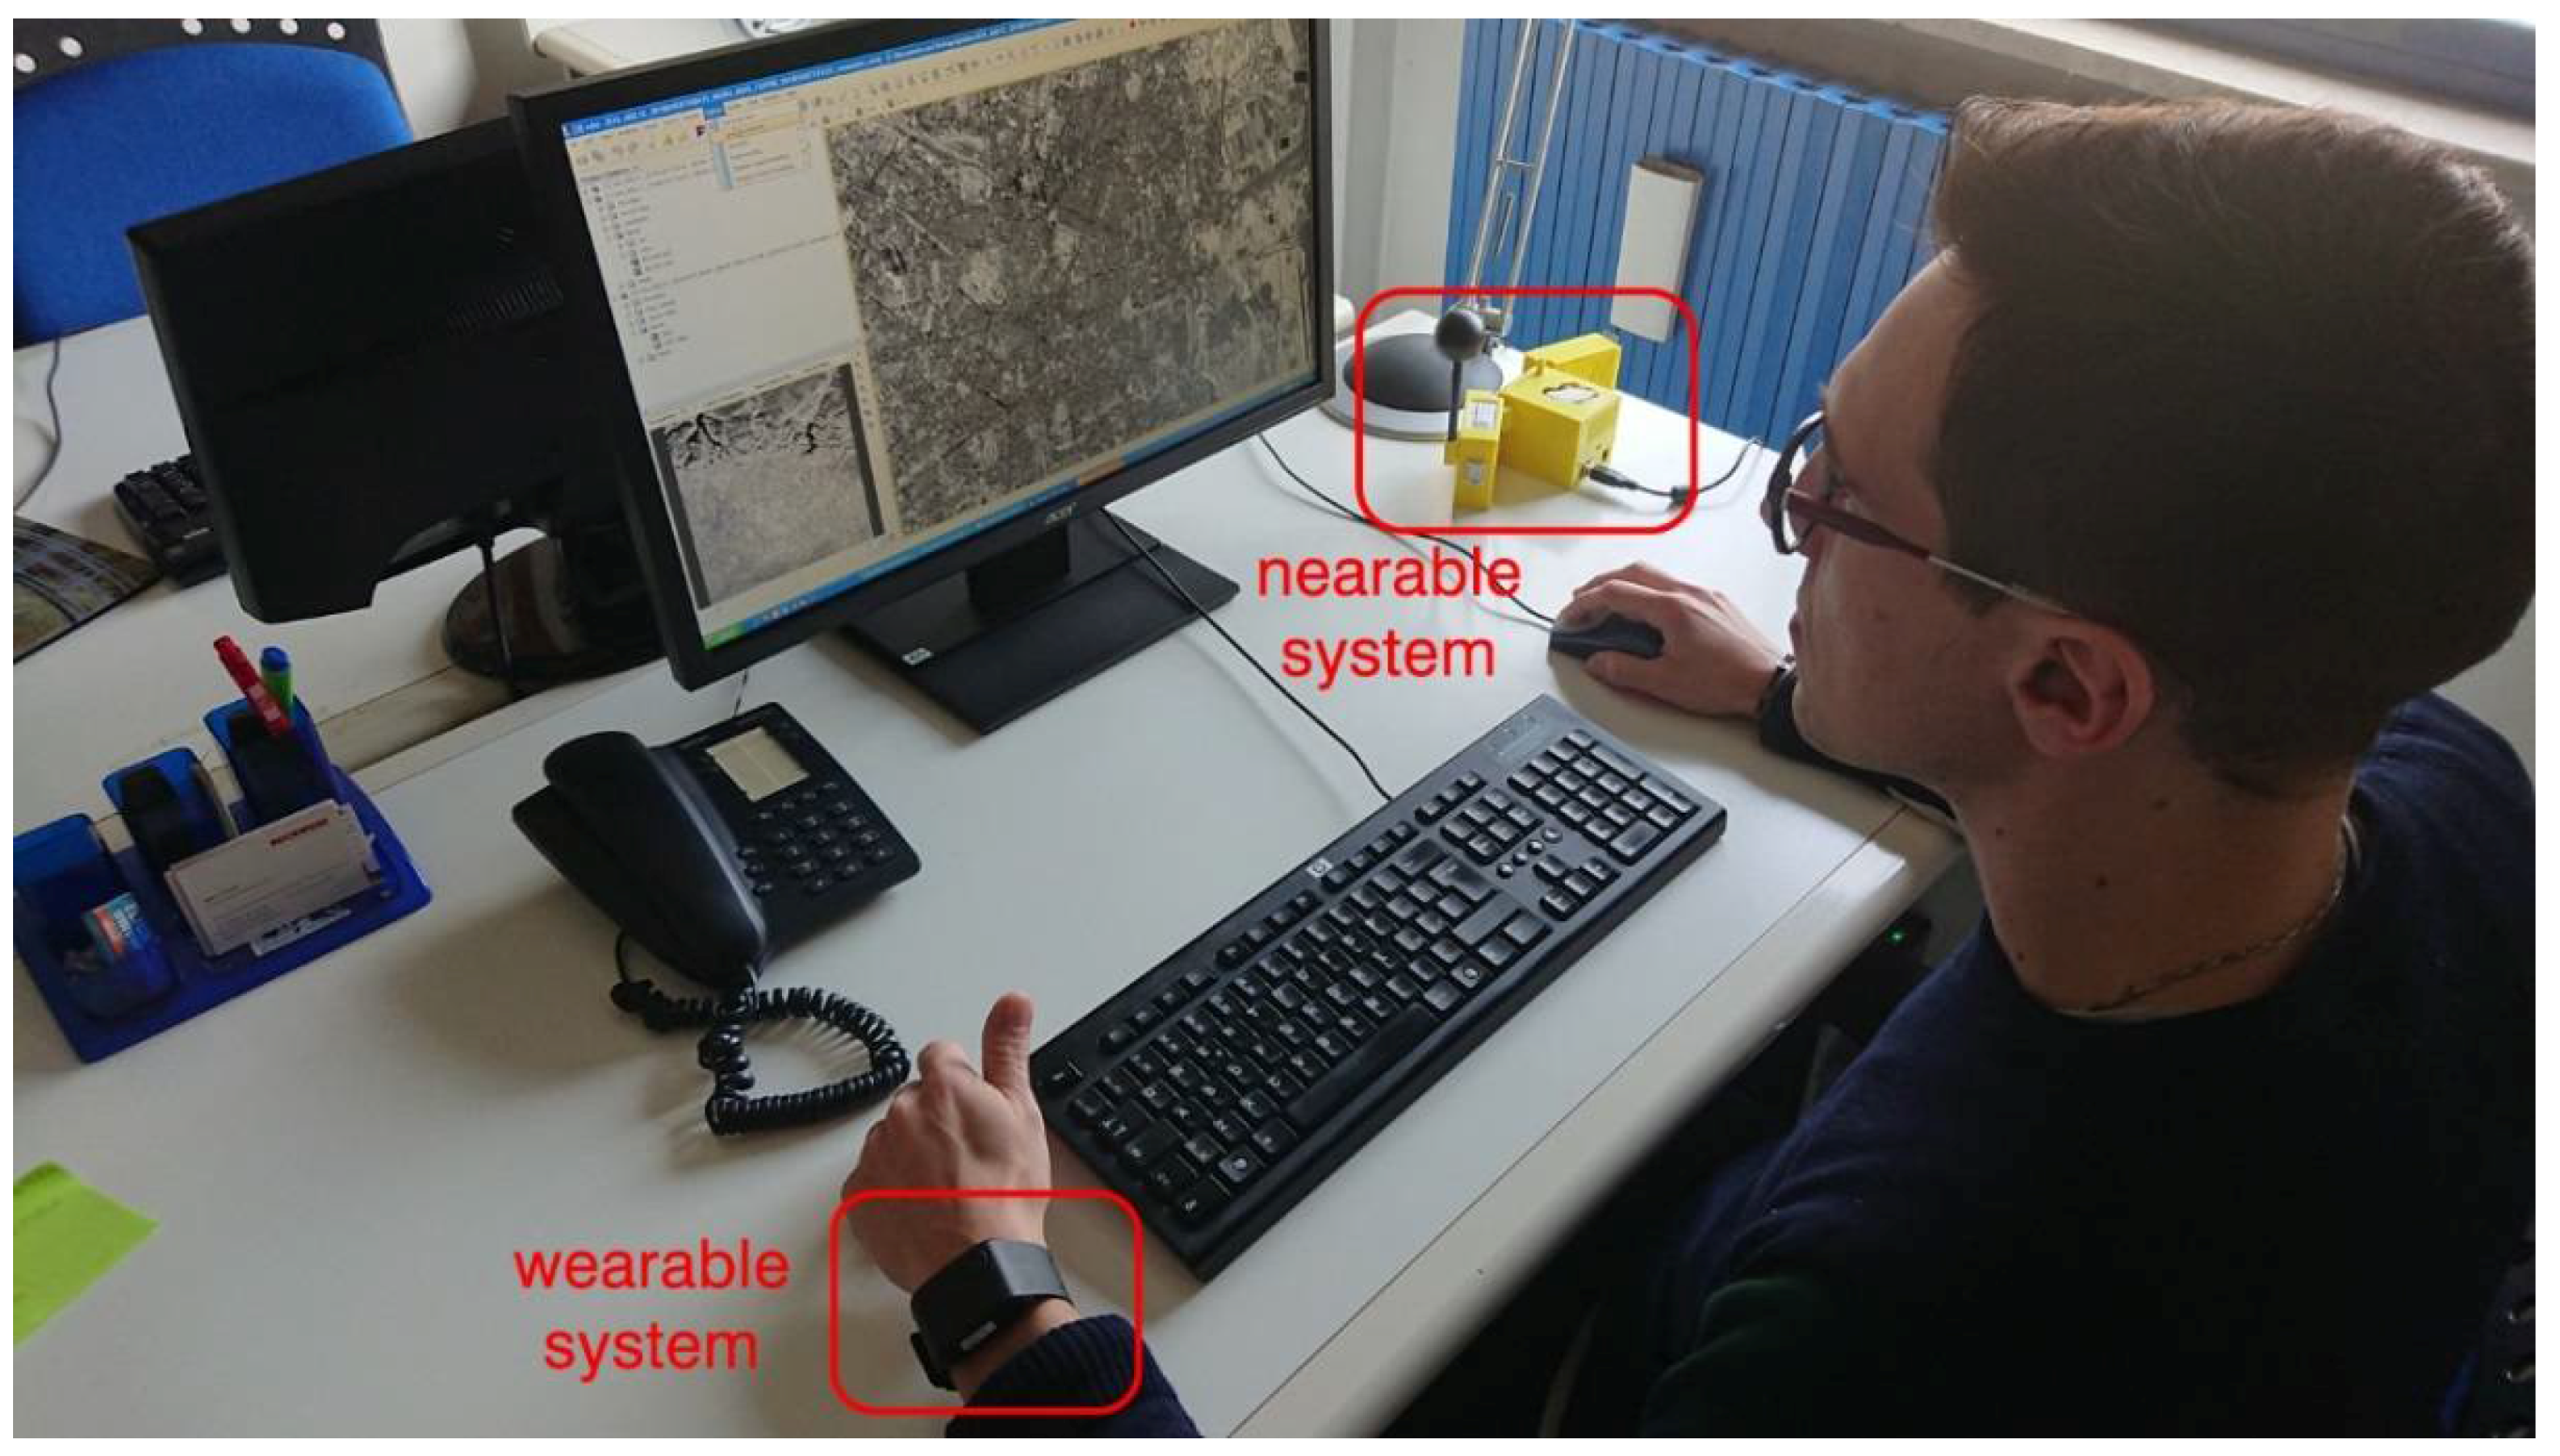
2.1. Monitoring Systems
2.1.1. Nearable System
2.1.2. Wearable System
- a photoplethysmography (PPG) sensor for the detection of the heart rate (HR) [35];
- an electrodermal activity (EDA) sensor;
- an infrared thermopile;
- a 3-axis accelerometer.
2.2. Web Based Survey
2.3. Parametric Model
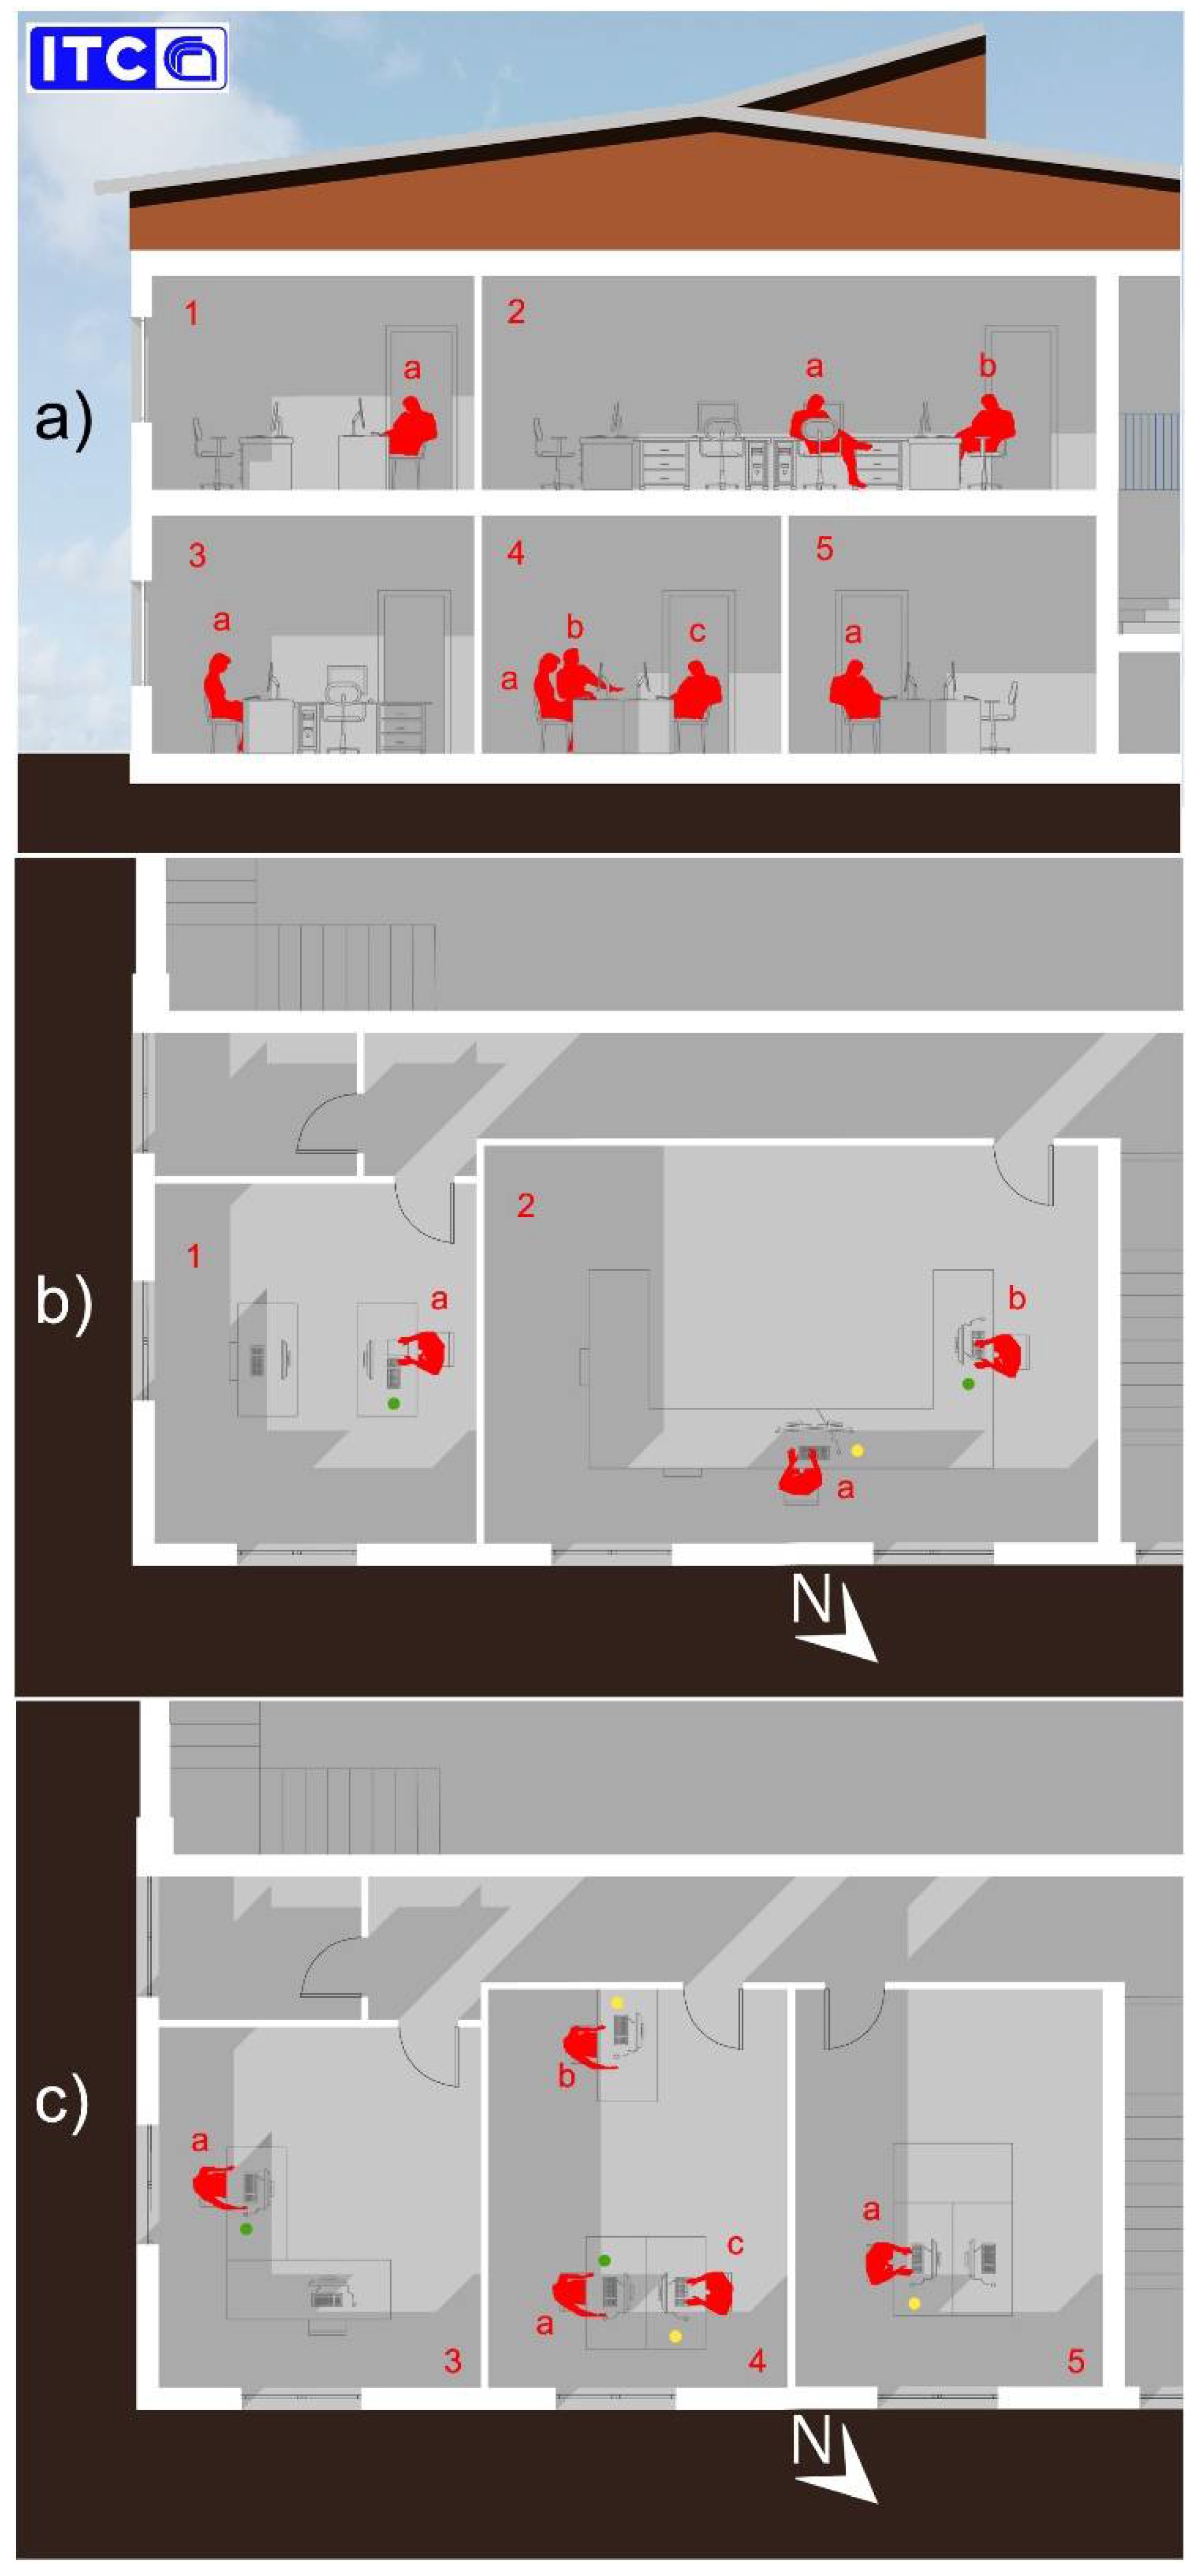
3. Application of the Framework
3.1. First Application and General Data
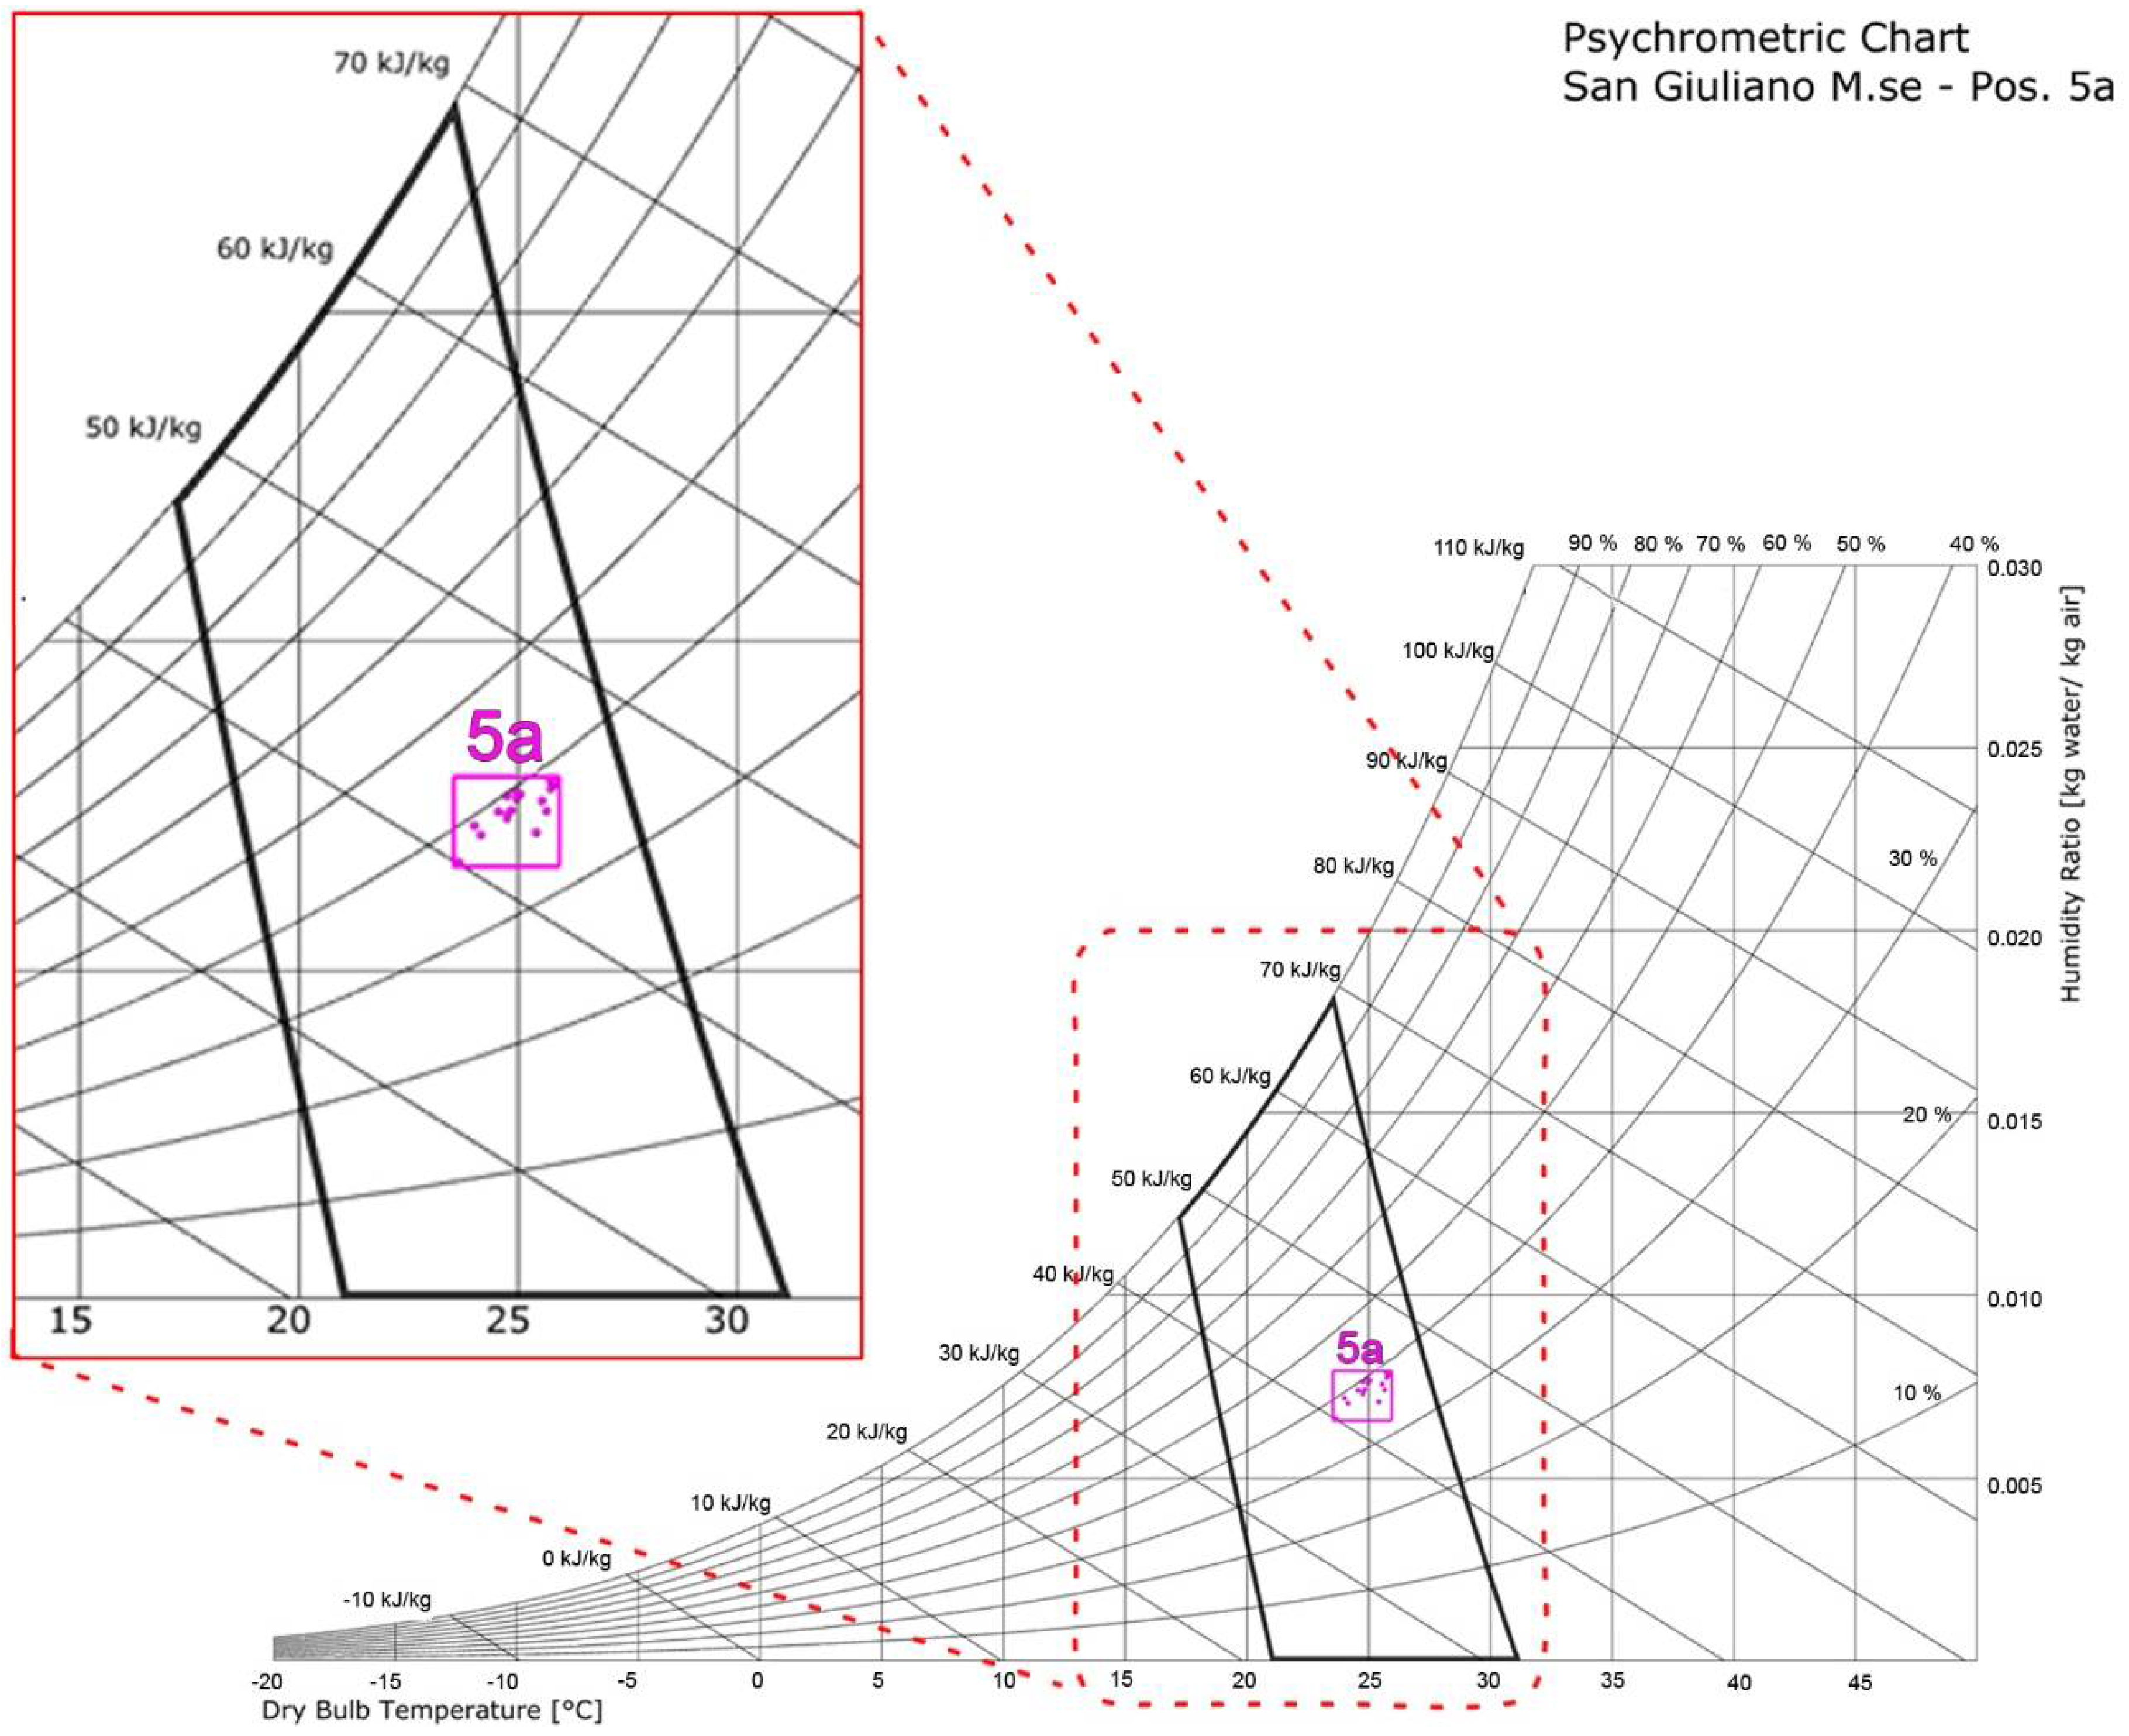
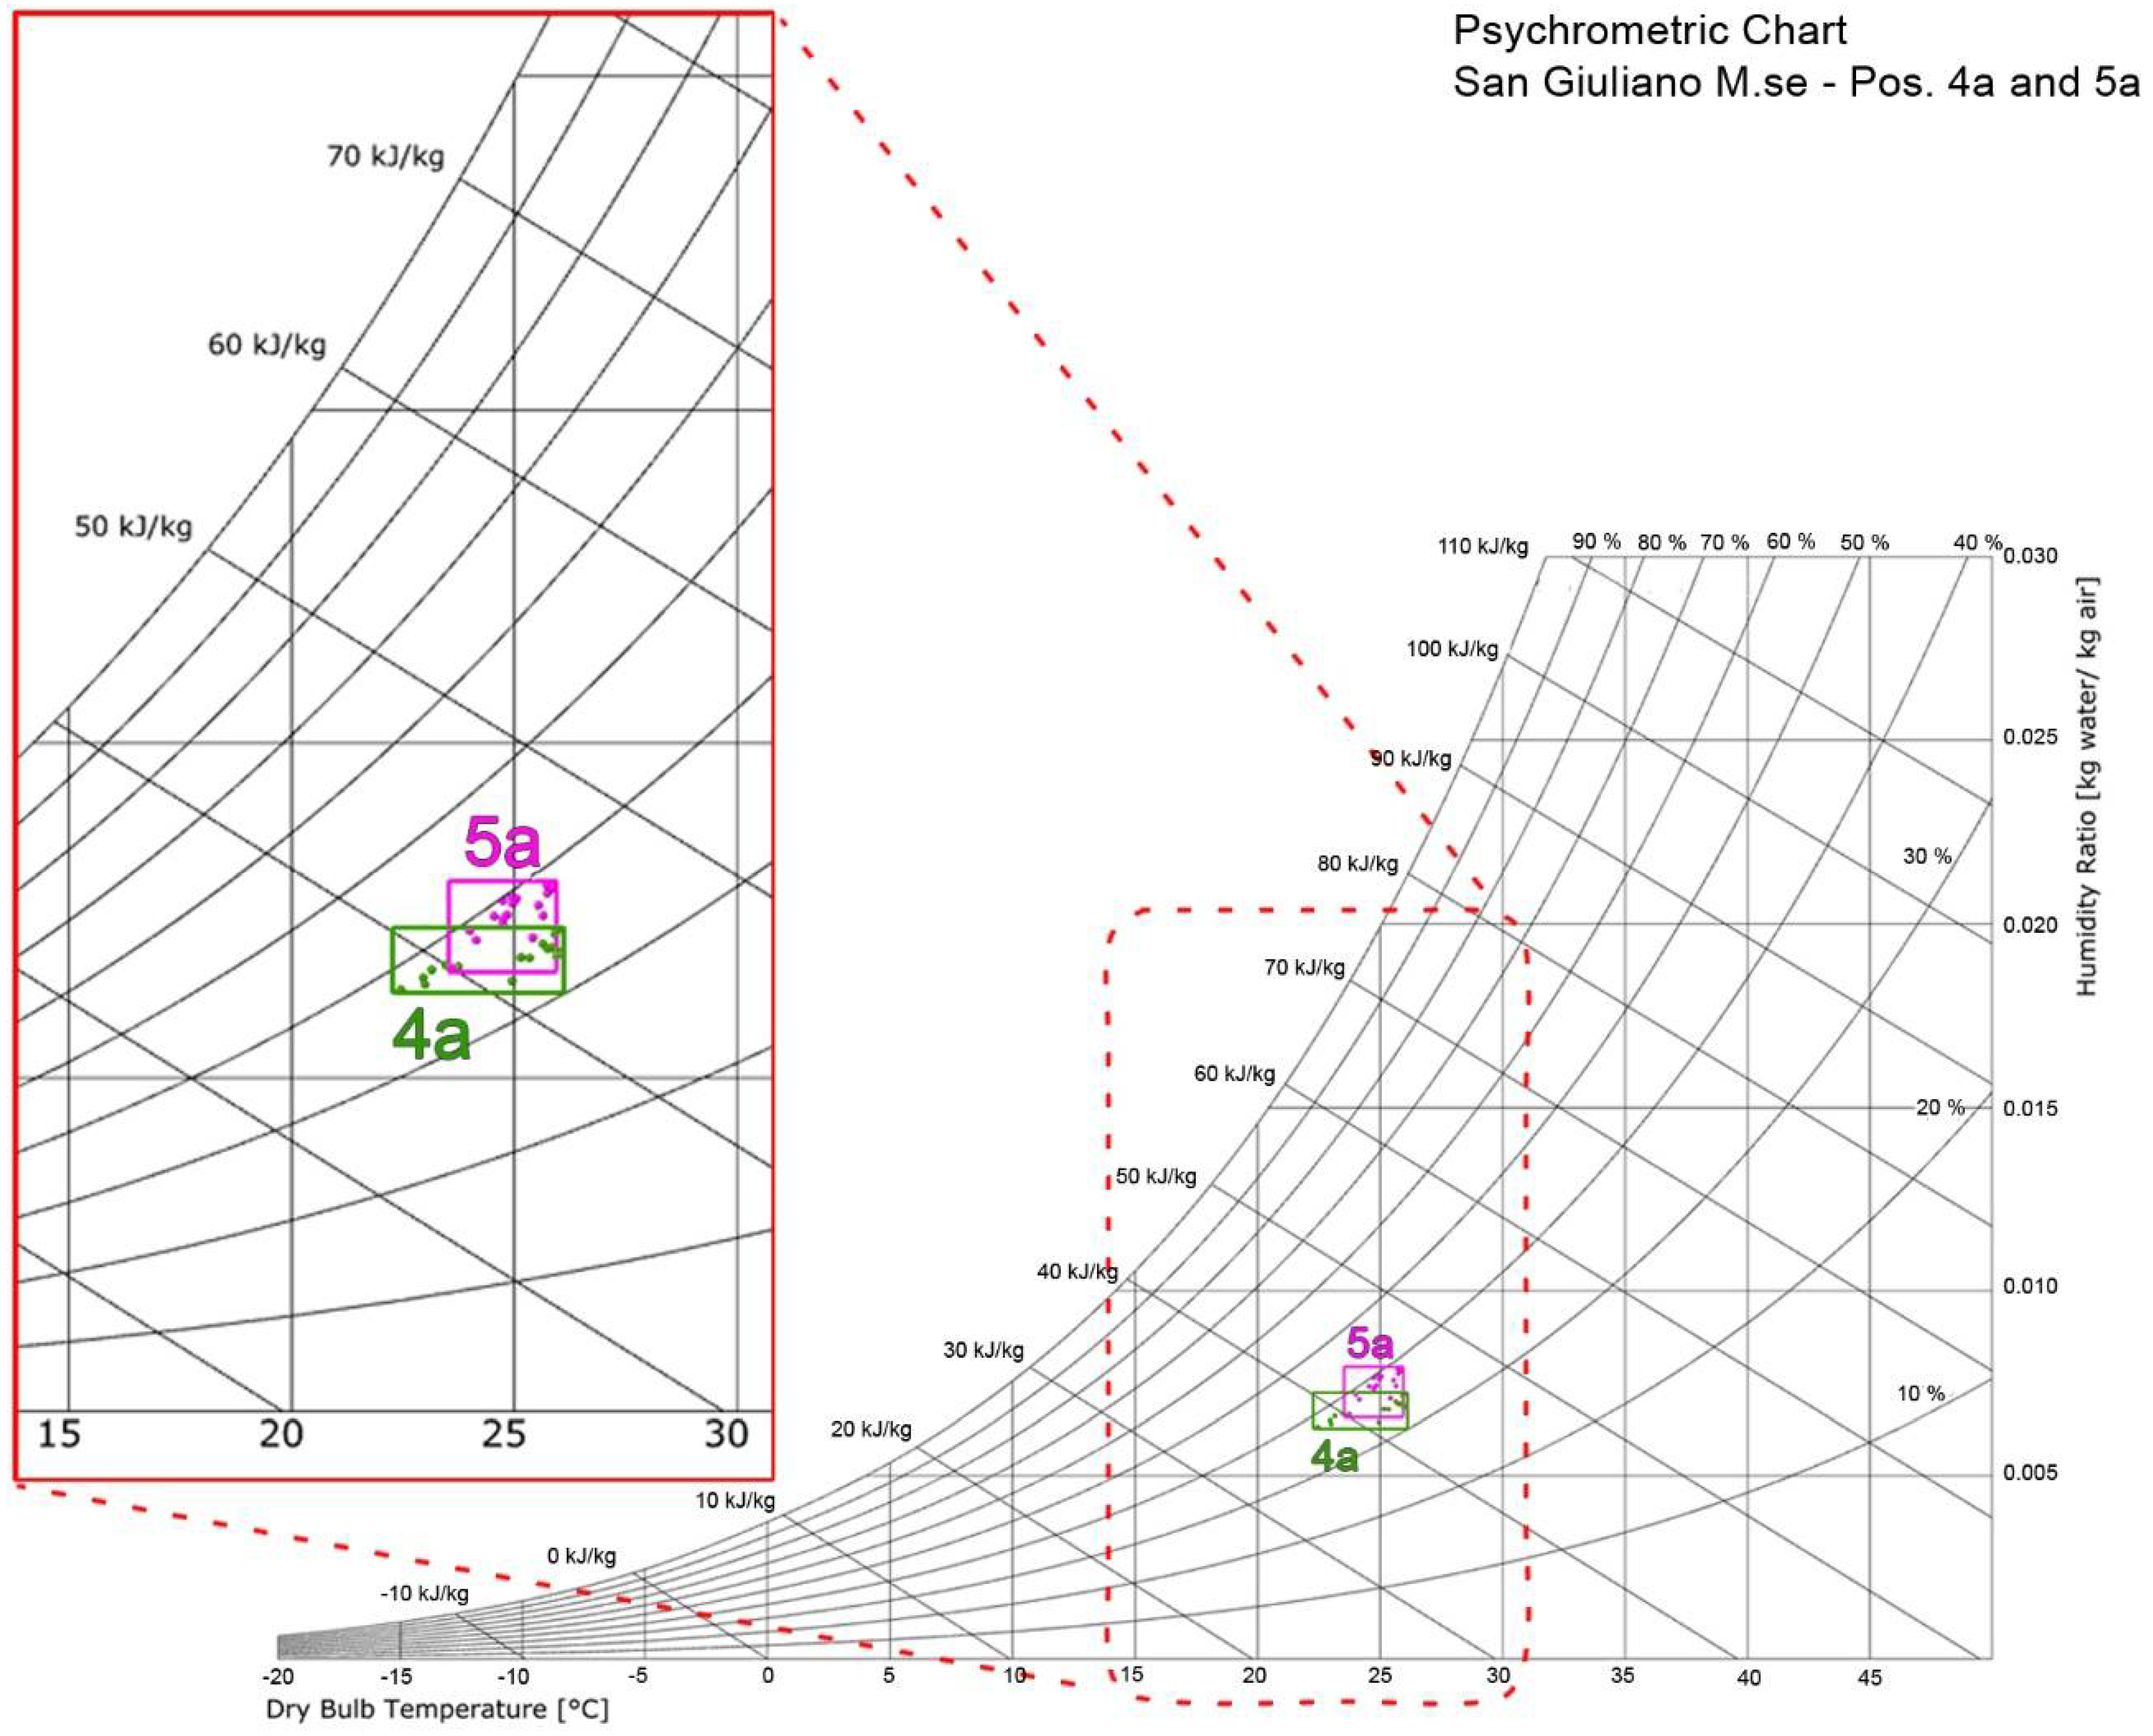
3.2. Objective Assessment of Thermal Comfort
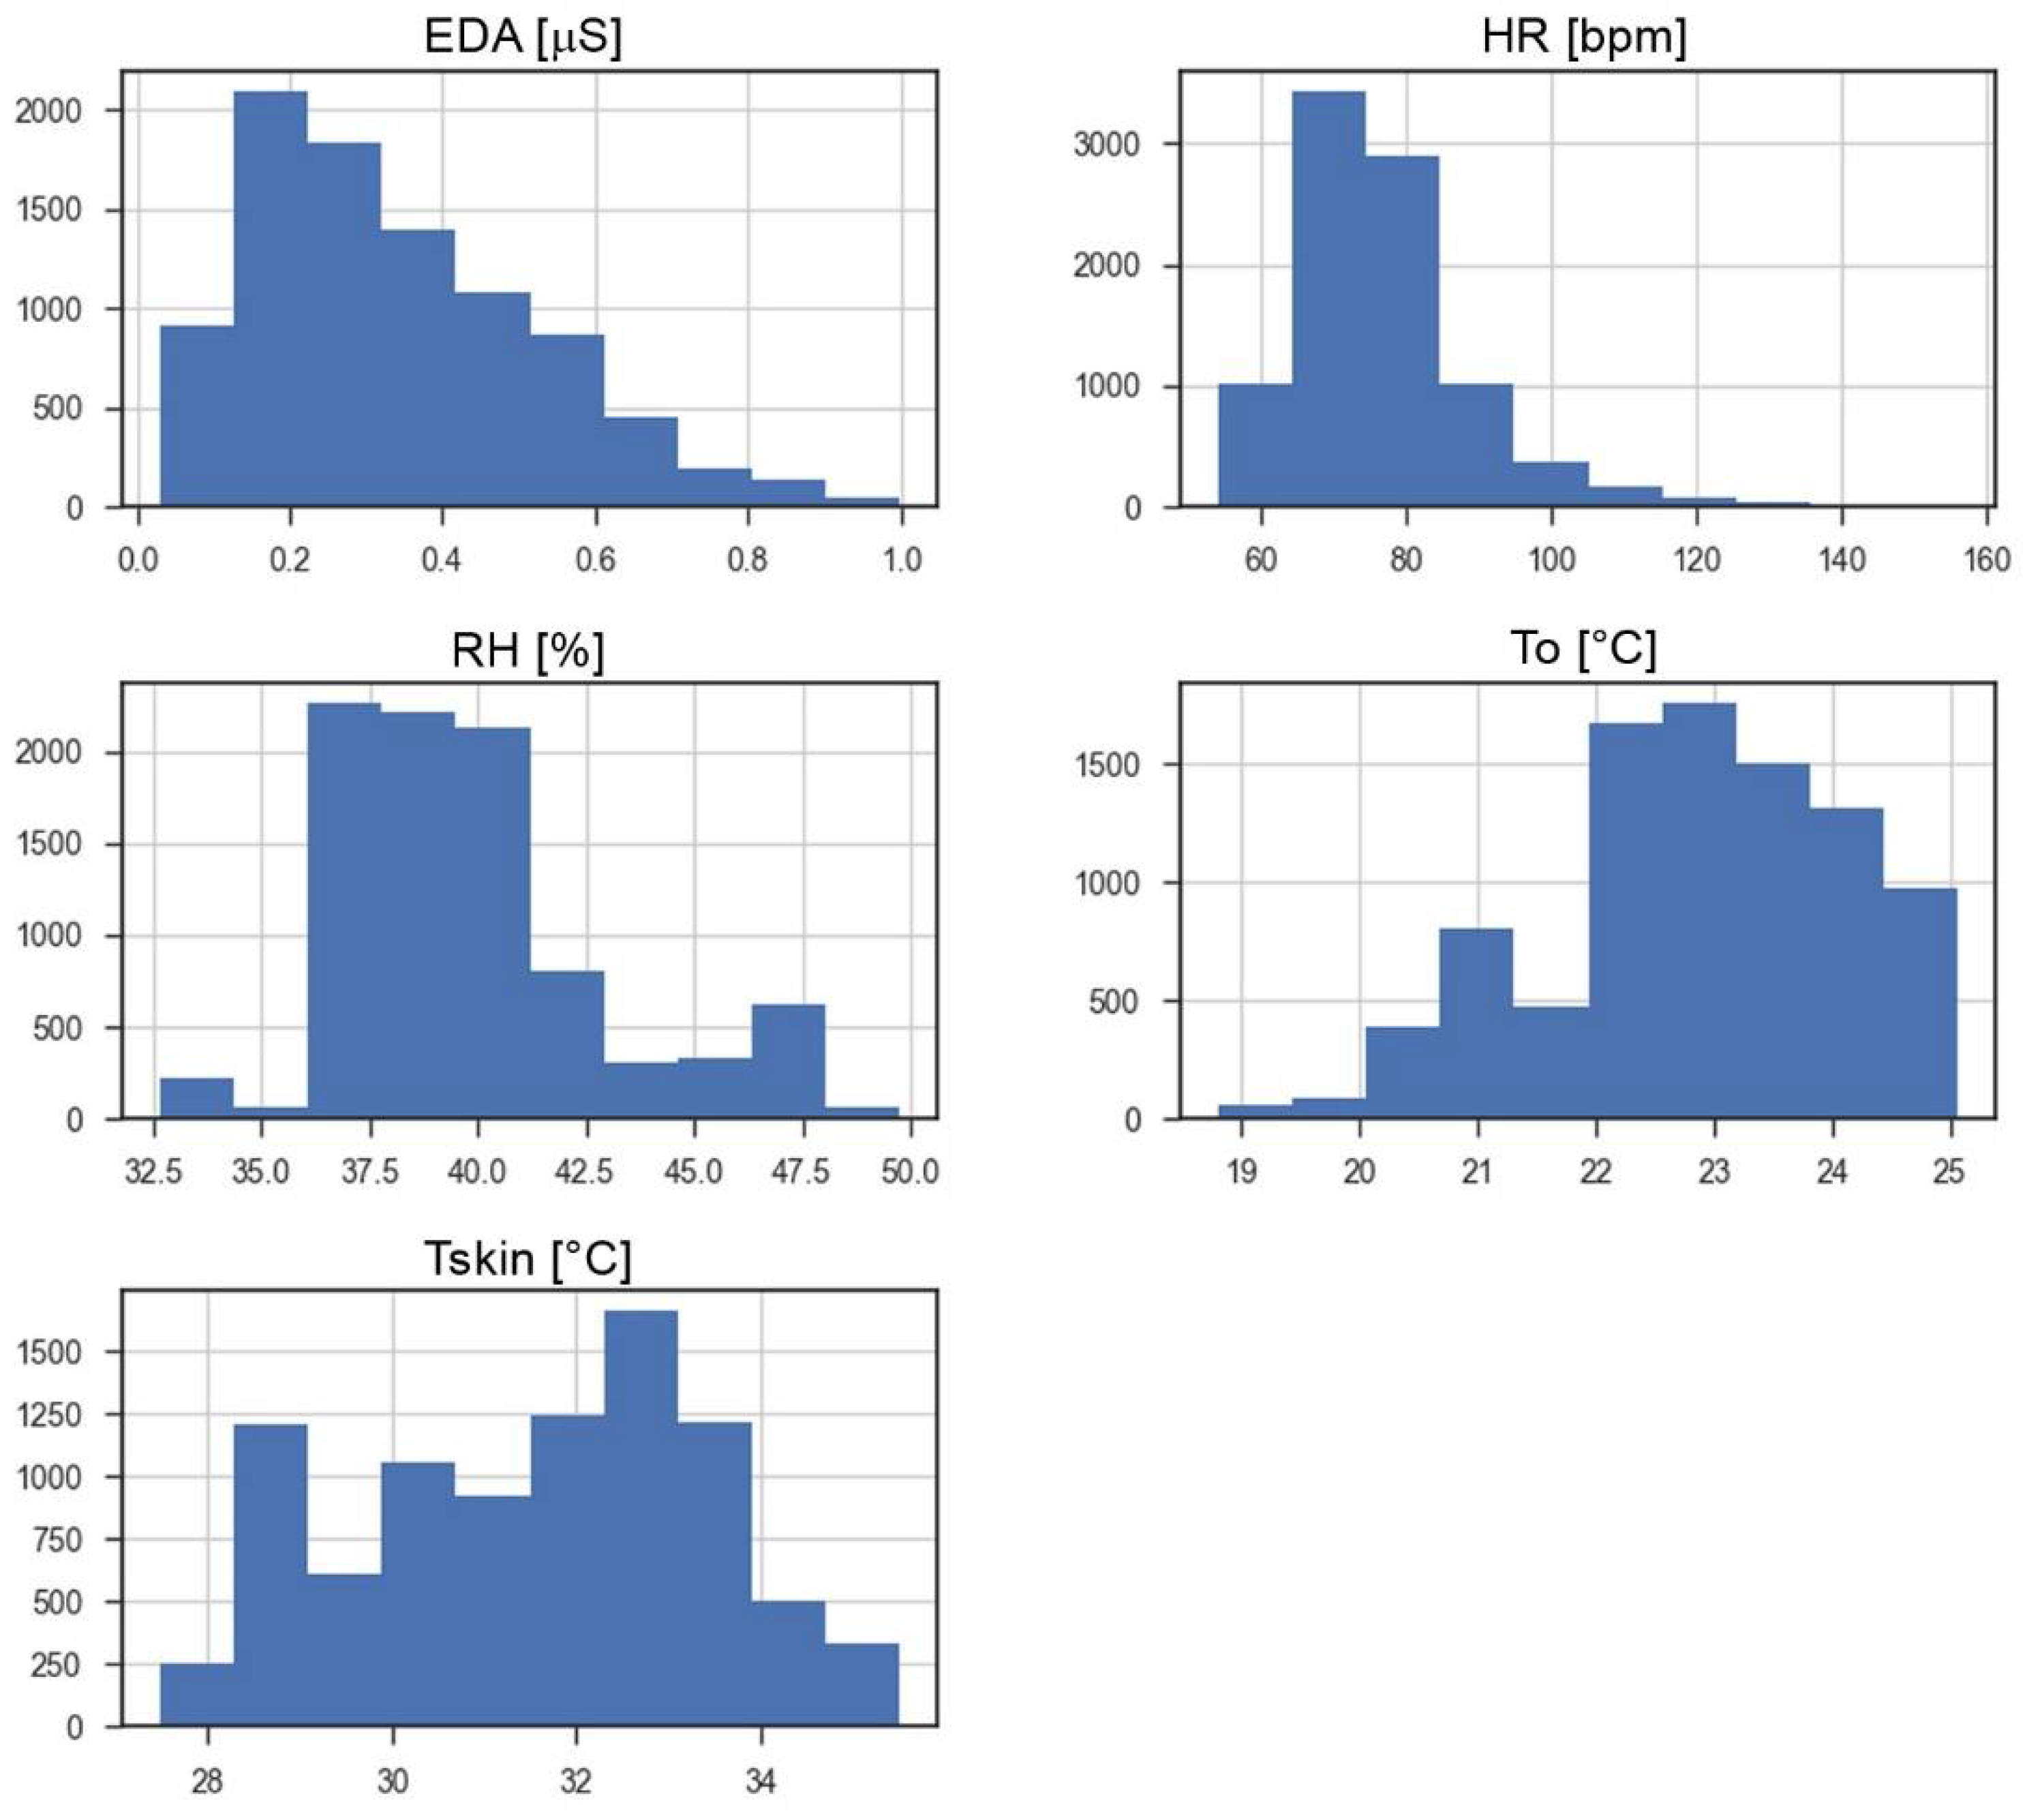
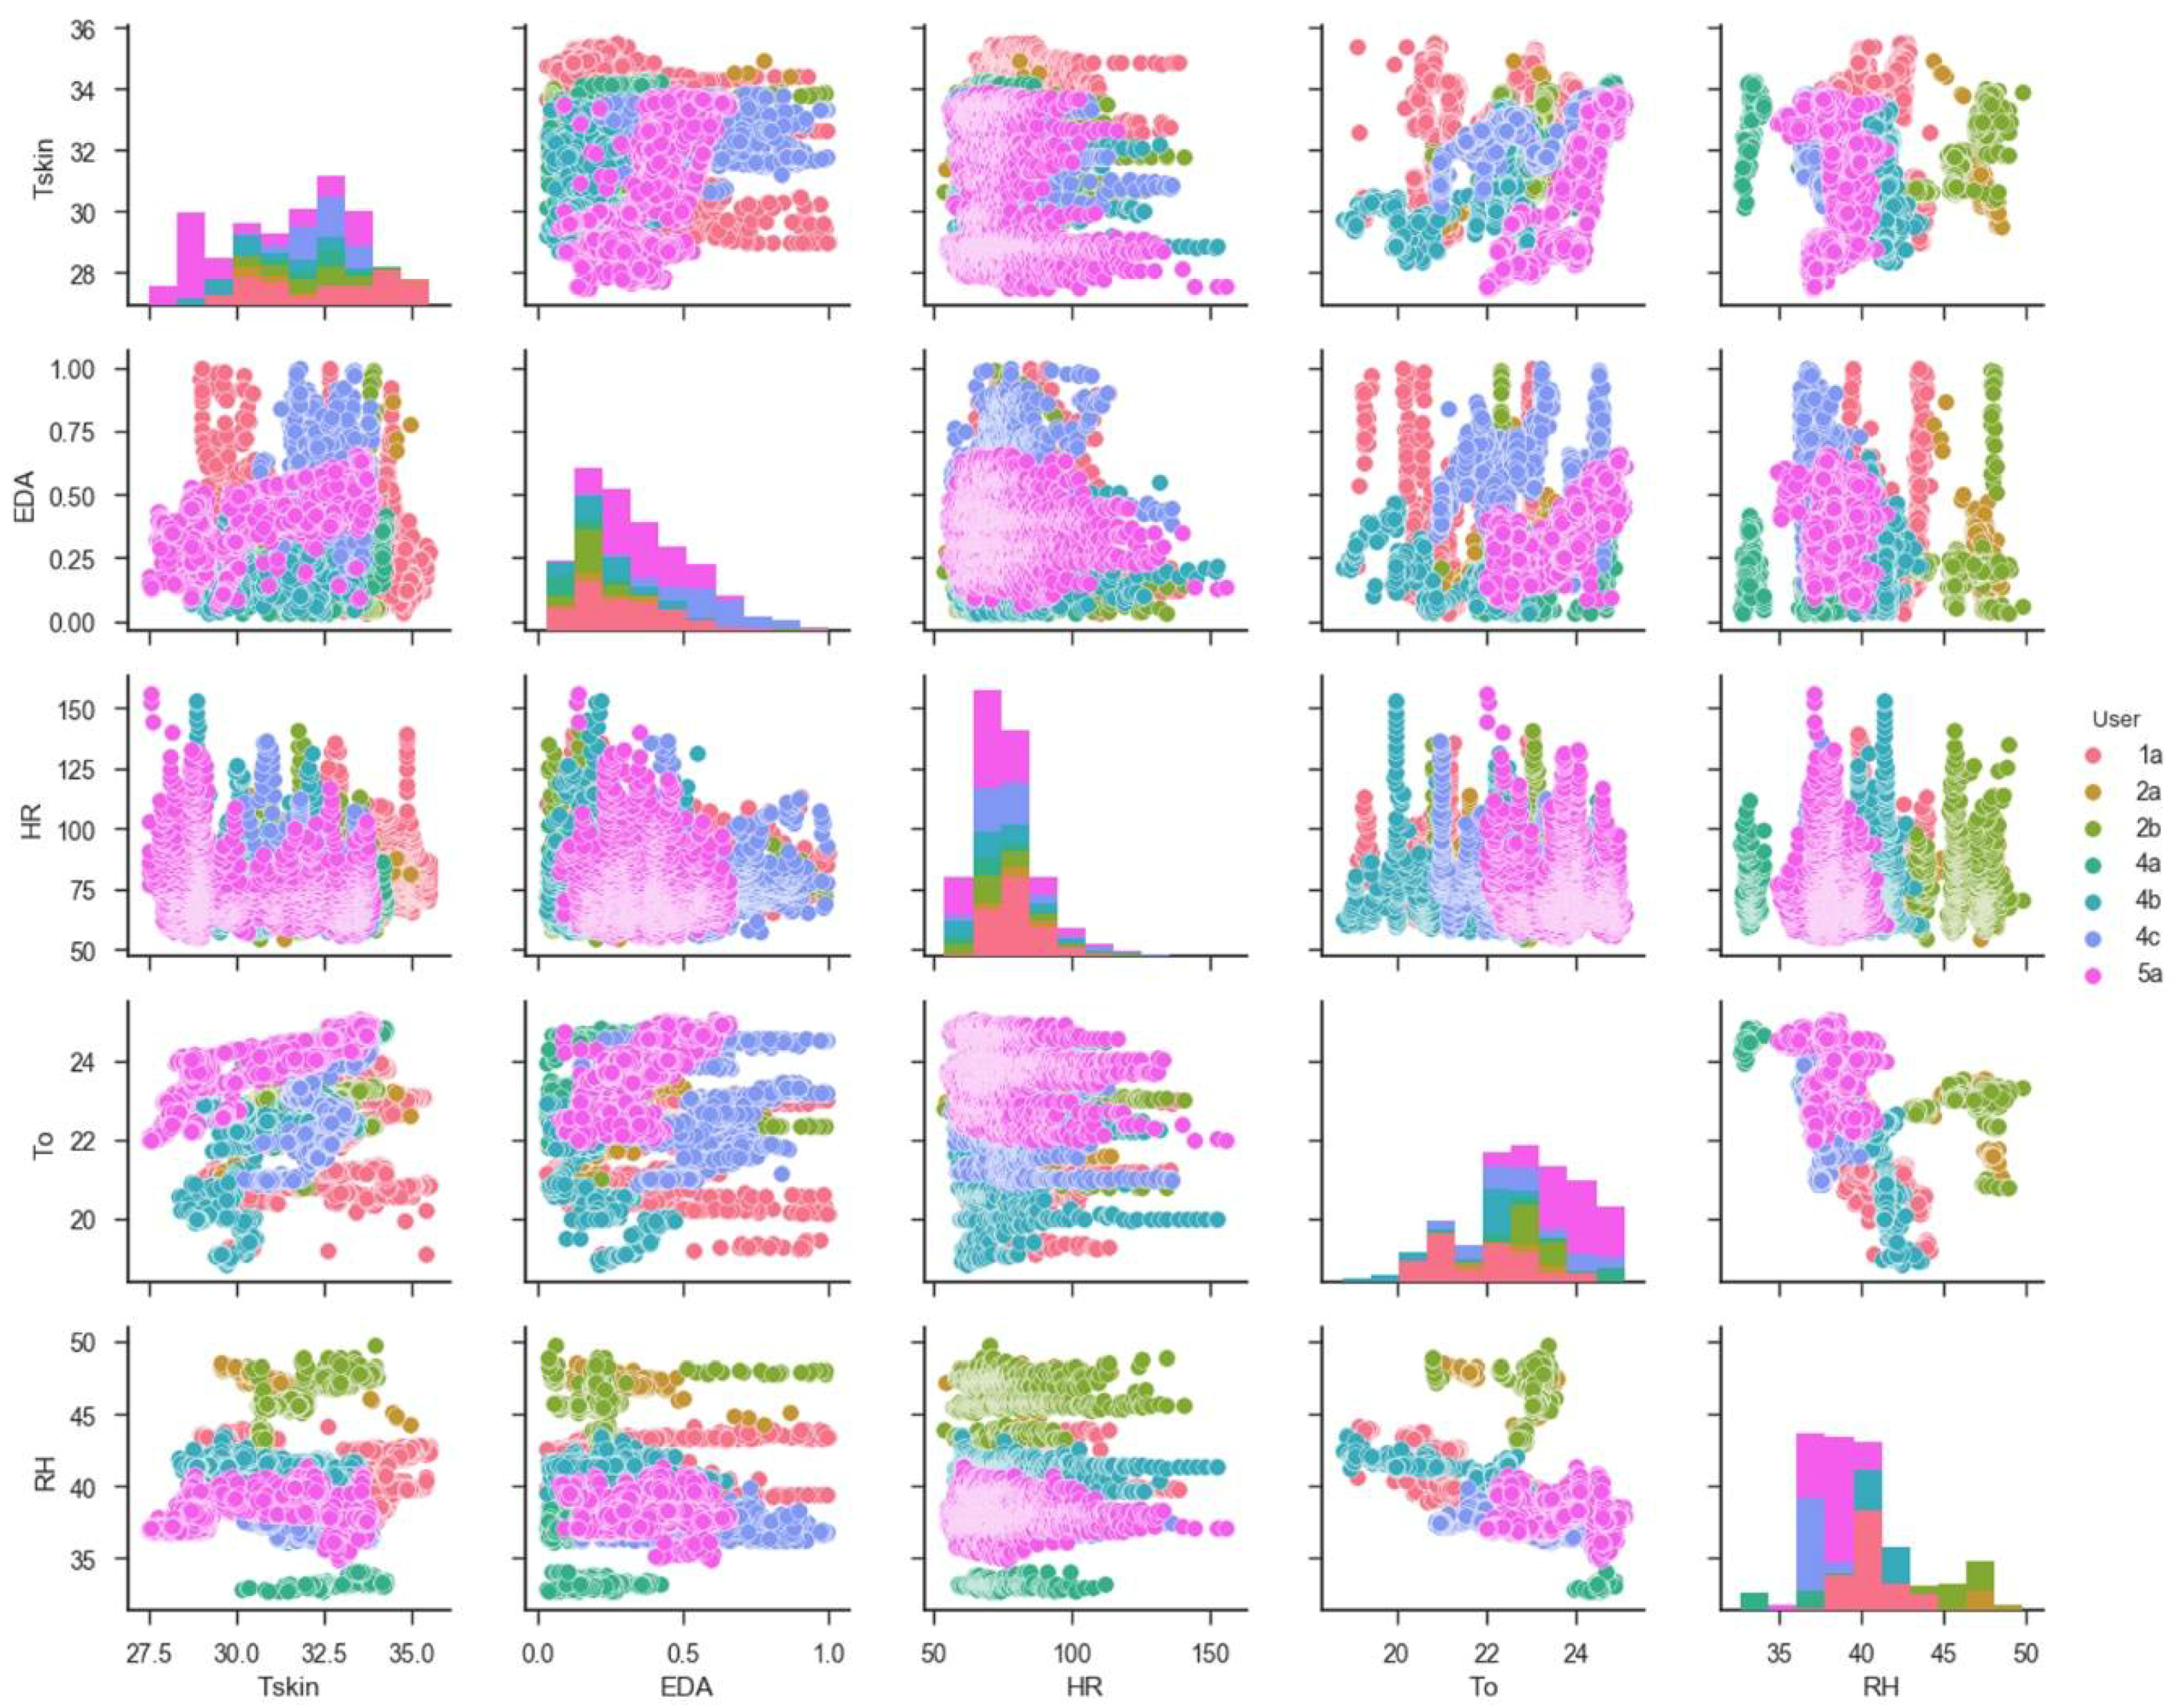
3.3. Dataset Definition and Machine Learning Approach
- Precision defined as a measure of a classifiers exactness;
- Recall considered as the completeness of the classifier;
- F1-score, a weighted average of precision and recall;
- Support, the number of occurrences of each label in y true.
4. Conclusions and Future Work
- highlight differences among users and TC perception;
- define individual GCZa based on users’ feedback in order to optimize the TC control strategy;
- identify the most relevant parameters for users recognition and, consequently for their personal TC optimal perception identification;
Author Contributions
Acknowledgments
Conflicts of Interest
Nomenclature
| AM | Adaptive method |
| CART | Classification and Regression Trees |
| EDA | Electrodermal Activity |
| GCZa | adapted Graphic Comfort Zone |
| GCZM | Graphic Comfort Zone Method |
| HR | Heart Rate [bpm] |
| IAQ | Indoor Air Quality |
| IEQ | Indoor Environmental Quality |
| ILQ | Indoor Lighting Quality |
| ML | Machine Learning |
| PMV | Predicted Mean Vote [-] |
| PPD | Predicted Percentage of Dissatisfied [%] |
| RH | Relative humidity [%] |
| Tair | Air Temperature [°C] |
| TC | Thermal Comfort |
| To | Operative Temperature [°C] |
| Trad | Radiant Temperature [°C] |
| Tskin | Skin surface Temperature [°C] |
| TSV | Thermal Sensation Vote [-] |
| Vair | Air Velocity [m/s] |
References
- Fanger, P.O. Thermal Comfort: Analysis and Applications in Environmental Engineering; Danish Technical Press: Copenhagen, Denmark, 1970. [Google Scholar]
- Technical Committee ISO/TC 159 and Technical Committee CEN/TC 122 ISO 7730: 2005. In Ergonomics of the Thermal Environment—Analytical Determination and Interpretation of Thermal Comfort Using Calculation of the PMV and PPD Indices and Local Thermal Comfort Criteria; European Committee for Standardization: Brussels, Belgium, 2006.
- Macpherson, R.K. The assessment of the thermal environment. A review. Br. J. Ind. Med. 1962, 19, 151–164. [Google Scholar] [CrossRef] [PubMed]
- Lai, A.C.K.; Mui, K.W.; Wong, L.T.; Law, L.Y. An evaluation model for indoor environmental quality (IEQ) acceptance in residential buildings. Energy Build. 2009, 41, 930–936. [Google Scholar] [CrossRef]
- Frontczak, M.; Wargocki, P. Literature survey on how different factors influence human comfort in indoor environments. Build. Environ. 2011, 46, 922–937. [Google Scholar] [CrossRef]
- Kim, J.; de Dear, R.; Candido, C.; Zhang, H.; Arens, E. Gender differences in office occupant perception of indoor environmental quality (IEQ). Build. Environ. 2013, 70, 245–256. [Google Scholar] [CrossRef]
- Del Ferraro, S.; Iavicoli, S.; Russo, S.; Molinaro, V. A field study on thermal comfort in an Italian hospital considering differences in gender and age. Appl. Ergon. 2015, 50, 177–184. [Google Scholar] [CrossRef] [PubMed]
- Fabbri, K. Thermal comfort evaluation in kindergarten: PMV and PPD measurement through datalogger and questionnaire. Build. Environ. 2013, 68, 202–214. [Google Scholar] [CrossRef]
- Arif, M.; Katafygiotou, M.; Mazroei, A.; Kaushik, A.; Elsarrag, E. Impact of indoor environmental quality on occupant well-being and comfort: A review of the literature. Int. J. Sustain. Built Environ. 2016, 5, 1–11. [Google Scholar] [CrossRef]
- Alfano, F.D.A.; Bellia, L.; Boerstra, A.; Van Dijken, F.; Ianniello, E.; Lopardo, G.; Minichiello, F.; Romagnoni, P.; da Silva, M.G. REHVA—Indoor Environment and Energy Efficiency in Schools—Part 1; REHVA: Brussels, Belgium, 2010; pp. 1–121. [Google Scholar]
- Alfano, F.R.D.A.; Ianniello, E.; Palella, B.I. PMV–PPD and acceptability in naturally ventilated schools. Build. Environ. 2013, 67, 129–137. [Google Scholar] [CrossRef]
- Djongyang, N.; Tchinda, R.; Njomo, D. Thermal comfort: A review paper. Renew. Sustain. Energy Rev. 2010, 14, 2626–2640. [Google Scholar] [CrossRef]
- Rupp, R.F.; Vásquez, N.G.; Lamberts, R. A review of human thermal comfort in the built environment. Energy Build. 2015, 105, 178–205. [Google Scholar] [CrossRef]
- Fanger, P.O. Calculation of thermal comfort, Introduction of a basic comfort equation. ASHRAE Trans. 1967, 73, III4.1–III4.20. [Google Scholar]
- Alfano, F.R.D.A.; Olesen, B.W.; Palella, B.I. Povl Ole Fanger’s impact ten years later. Energy Build. 2017, 152, 243–249. [Google Scholar] [CrossRef]
- Fanger, P.O.; Toftum, J. Extension of the PMV model to non-air-conditioned buildings in warm climates. Energy Build. 2002, 34, 533–536. [Google Scholar] [CrossRef]
- British Standards Institution. Indoor Environmental Input Parameters for Design and Assessment of Energy Performance of Buildings Addressing Indoor Air Quality, Thermal Environment, Lighting and Acoustics; European Committee for Standardization: Brussels, Belgium, 2007. [Google Scholar]
- American Society of Heating, Refrigerating, Air-Conditioning Engineers, and American National Standards Institute. Thermal Environmental Conditions for Human Occupancy; ASHRAE 55; ASHRAE: Atlanta, GA, USA, 2017. [Google Scholar]
- De Dear, R.; Brager, G.S. Developing an Adaptive Model of Thermal Comfort and Preference; Center for the Built Environment: Berkeley, CA, USA, 1998. [Google Scholar]
- Humphreys, M.A.; Nicol, J.F. Understanding the adaptive approach to thermal comfort. ASHRAE Trans. 1998, 104, 991–1004. [Google Scholar]
- Dear, R.J.; Akimoto, T.; Arens, E.A.; Brager, G.; Candido, C.; Cheong, K.W.D.; Li, B.; Nishihara, N.; Sekhar, S.C.; Tanabe, S.; et al. Progress in thermal comfort research over the last twenty years. Indoor Air 2013, 23, 442–461. [Google Scholar] [CrossRef] [PubMed]
- Halawa, E.; van Hoof, J. The adaptive approach to thermal comfort: A critical overview. Energy Build. 2012, 51, 101–110. [Google Scholar] [CrossRef]
- Nicol, J.F.; Roaf, S. Rethinking thermal comfort. Build. Res. Inf. 2017. [Google Scholar] [CrossRef]
- Revel, G.M.; Arnesano, M.; Pietroni, F. Integration of real-time metabolic rate measurement in a low-cost tool for the thermal comfort monitoring in AAL environments. In Ambient Assisted Living Italian Forum 2014; Springer: Berlin, Germany, 2014; Volume 11, pp. 101–110. ISBN 978-3-319-18373-2. [Google Scholar]
- Revel, G.M.; Arnesano, M. Perception of the thermal environment in sports facilities through subjective approach. Build. Environ. 2014, 77, 12–19. [Google Scholar] [CrossRef]
- Chaudhuri, T.; Soh, Y.C.; Li, H.; Xie, L. Machine learning based prediction of thermal comfort in buildings of equatorial Singapore. In Proceedings of the 2017 IEEE International Conference on Smart Grid and Smart Cities (ICSGSC), Singapore, 23–26 July 2017; pp. 72–77. [Google Scholar]
- Kim, J.; Zhou, Y.; Schiavon, S.; Raftery, P.; Brager, G. Personal comfort models: Predicting individuals’ thermal preference using occupant heating and cooling behavior and machine learning. Build. Environ. 2018, 129, 96–106. [Google Scholar] [CrossRef]
- ISO 8996—Ergonomics of the Thermal Environment—Determination of Metabolic Rate; International Organization for Standardization: Geneva, Switzerland, 2004.
- Salamone, F.; Belussi, L.; Danza, L.; Meroni, I. An integrated framework for users’ well-being. In Proceedings of the 4th International Electronic Conference on Sensors and Applications; MDPI AG: Basel, Switzerland, 2017. [Google Scholar] [CrossRef]
- Mackey, C.C.W. Pan Climatic Humans: Shaping Thermal Habits in an Unconditioned Society. Ph.D. Thesis, Massachusetts Institute of Technology, Cambridge, MA, USA, 2015. [Google Scholar]
- Salamone, F.; Belussi, L.; Danza, L.; Ghellere, M.; Meroni, I. Design and Development of nEMoS, an All-in-One, Low-Cost, Web-Connected and 3D-Printed Device for Environmental Analysis. Sensors 2015, 15, 13012–13027. [Google Scholar] [CrossRef] [PubMed]
- Salamone, F.; Danza, L.; Meroni, I.; Pollastro, M.C. A Low-Cost Environmental Monitoring System: How to Prevent Systematic Errors in the Design Phase through the Combined Use of Additive Manufacturing and Thermographic Techniques. Sensors 2017, 17, 828. [Google Scholar] [CrossRef] [PubMed]
- ISO 7726—Ergonomics of the Thermal Environment, Instruments for Measuring Physical Quantities; International Standard Organization: Geneva, Switzerland, 1998.
- Dunn, P.F.; Davis, M.P. Measurement and Data Analysis for Engineering and Science; CRC Press: Boca Raton, FL, USA, 2017. [Google Scholar]
- Saquib, N.; Papon, M.T.I.; Ahmad, I.; Rahman, A. Measurement of heart rate using photoplethysmography. In Proceedings of the 2015 International Conference on Networking Systems and Security (NSysS), Dhaka, Bangladesh, 5–7 January 2015; pp. 1–6. [Google Scholar]
- Pietilä, J.; Mehrang, S.; Tolonen, J.; Helander, E.; Jimison, H.; Pavel, M.; Korhonen, I. Evaluation of the accuracy and reliability for photoplethysmography based heart rate and beat-to-beat detection during daily activities. In EMBEC & NBC; Springer: Singapore, 2017; pp. 145–148. [Google Scholar]
- Malchaire, J.; Alfano, F.R.D.A.; Palella, B.I. Evaluation of the metabolic rate based on the recording of the heart rate. Ind. Health 2017, 55, 219–232. [Google Scholar] [CrossRef] [PubMed]
- Luo, M.; Wang, Z.; Ke, K.; Cao, B.; Zhai, Y.; Zhou, X. Human metabolic rate and thermal comfort in buildings: The problem and challenge. Build. Environ. 2018, 131, 41–52. [Google Scholar] [CrossRef]
- Hasan, M.H.; Alsaleem, F.; Rafaie, M. Sensitivity study for the PMV thermal comfort model and the use of wearable devices biometric data for metabolic rate estimation. Build. Environ. 2016, 110, 173–183. [Google Scholar] [CrossRef]
- Havenith, G.; Holmér, I.; Parsons, K. Personal factors in thermal comfort assessment: Clothing properties and metabolic heat production. Energy Build. 2002, 34, 581–591. [Google Scholar] [CrossRef]
- ISO 9920—Ergonomics of the Thermal Environment—Estimation of the Thermal Insulation and Evaporative Resistance of a Clothing Ensemble; International Standardization Organization: Geneva, Switzerland, 2009.
- Wu, T.; Cui, W.; Cao, B.; Zhu, Y.; Ouyang, Q. Measurements of the additional thermal insulation of aircraft seat with clothing ensembles of different seasons. Build. Environ. 2016, 108, 23–29. [Google Scholar] [CrossRef]
- D’Ambrosio Alfano, F.R.; Olesen, B.W.; Palella, B.I.; Riccio, G. Thermal Comfort: Design and Assessment for Energy Saving. Energy Build. 2014, 81, 326–336. [Google Scholar] [CrossRef]
- D’Ambrosio Alfano, F.R.; Palella, B.I.; Riccio, G. Notes on the Calculation of the PMV index by means of Apps. Energy Procedia 2016, 101, 249–256. [Google Scholar] [CrossRef]
- Grasshopper. Available online: http://www.grasshopper3d.com (accessed on 18 March 2018).
- Ladybug Tools. Available online: http://www.ladybug.tools (accessed on 18 March 2018).
- Roudsari, M.S.; Pak, M.; Smith, A. Ladybug: A parametric environmental plugin for grasshopper to help designers create an environmentally-conscious design. In Proceedings of the 13th International IBPSA Conference, Lyon, France, 25–30 August 2013. [Google Scholar]
- TT Toolbox. Available online: http://core.thorntontomasetti.com/tt-toolbox-for-grasshopper (accessed on 18 March 2018).
- Danza, L.; Barozzi, B.; Belussi, L.; Meroni, I.; Salamone, F. Assessment of the performance of a ventilated window coupled with a heat recovery unit through the co-heating test. Buildings 2016, 6, 3. [Google Scholar] [CrossRef]
- Salamone, F.; Belussi, L.; Danza, L.; Ghellere, M.; Meroni, I. An Open Source “Smart Lamp” for the Optimization of Plant Systems and Thermal Comfort of Offices. Sensors 2016, 16, 338. [Google Scholar] [CrossRef] [PubMed]
- Taylor, S.; Jaques, N.; Chen, W.; Fedor, S.; Sano, A.; Picard, R. Automatic Identification of Artifacts in Electrodermal Activity Data. In Proceedings of the International Conference of the IEEE Engineering in Medicine and Biology Society (EMBC), Milan, Italy, 25–29 August 2015. [Google Scholar]
- EDA-Explorer. Available online: http://eda-explorer.media.mit.edu/ (accessed on 18 March 2018).
- Sklearn Logistic Regression Algorithm. Available online: http://scikit-learn.org/stable/modules/generated/sklearn.linear_model.LogisticRegression.html (accessed on 24 April 2018).
- Sklearn Linear Discriminant Analysis Algorithm. Available online: http://scikit-learn.org/stable/modules/lda_qda.html (accessed on 24 April 2018).
- Sklearn K-Nearest Neighbors. Available online: http://scikit-learn.org/stable/modules/neighbors.html (accessed on 24 April 2018).
- Sklearn Classification and Regression Trees. Available online: http://scikit-learn.org/stable/modules/tree.html (accessed on 24 April 2018).
- Sklearn Gaussian Naive Bayes. Available online: http://scikit-learn.org/stable/modules/naive_bayes.html (accessed on 24 April 2018).
- Sklearn Support Vector Machines. Available online: http://scikit-learn.org/stable/modules/svm.html (accessed on 24 April 2018).
- Sklearn Accuracy Score. Available online: http://scikit-learn.org/stable/modules/model_evaluation.html#accuracy-score (accessed on 24 April 2018).
- Sklearn K-Folds Cross-Validator. Available online: http://scikit-learn.org/stable/modules/generated/sklearn.model_selection.KFold.html (accessed on 24 April 2018).
- Breiman, L.; Friedman, J.; Olshen, R.; Stone, C. Classification and Regression Trees; Wadsworth: Belmont, CA, USA, 1984. [Google Scholar]
- Complete Classification Tree. Available online: http://www.docet.itc.cnr.it/ML_cart.png (accessed on 24 April 2018).
- Sklearn.metrics. Available online: http://scikit-learn.org/stable/modules/generated/sklearn.metrics.precision_recall_fscore_support.html (accessed on 18 March 2018).
- Sevilgen, G.; Kilic, M. Numerical analysis of air flow, heat transfer, moisture transport and thermal comfort in a room heated by two-panel radiators. Energy Build. 2011, 43, 137–146. [Google Scholar] [CrossRef]
- Myhren, J.A.; Holmberg, S. Design considerations with ventilation-radiators: Comparisons to traditional two-panel radiators. Energy Build. 2009, 41, 92–100. [Google Scholar] [CrossRef]
- Salamone, F.; Belussi, L.; Danza, L.; Galanos, T.; Ghellere, M.; Meroni, I. Design and Development of a Nearable Wireless System to Control Indoor Air Quality and Indoor Lighting Quality. Sensors 2017, 17, 1021. [Google Scholar] [CrossRef] [PubMed]
- Salamone, F.; Belussi, L.; Danza, L.; Ghellere, M.; Meroni, I. Integration of a do it yourself Hardware in a Lighting Device for the Management of Thermal Comfort and Energy Use. Energy Procedia 2016, 101, 161–168. [Google Scholar] [CrossRef]
- Salamone, F.; Belussi, L.; Danza, L.; Ghellere, M.; Meroni, I. How to control the Indoor Environmental Quality through the use of the Do-It-Yourself approach and new pervasive technologies. Energy Procedia 2017, 140, 351–360. [Google Scholar] [CrossRef]
- Torchia, F.; Ricciardi, P.; Scrosati, C.; Scamoni, F. Improvement of Façades’ Sound Insulation of Schools near the Bergamo—Orio al Serio International Airport: Case Study. Build. Acoust. 2015, 22, 123–142. [Google Scholar] [CrossRef]
- Casini, D.; Cellai, G.; Fogola, J.; Scamoni, F.; Secchi, S. Correlation between facade sound insulation and urban noise: A contribution to the acoustic classification of existing buildings. Build. Acoust. 2016, 23, 145–158. [Google Scholar] [CrossRef]
- Secchi, S.; Astolfi, A.; Calosso, G.; Casini, D.; Cellai, G.; Scamoni, F.; Scrosati, C.; Shtrepi, L. Effect of outdoor noise and façade sound insulation on indoor acoustic environment of Italian schools. Appl. Acoust. 2017, 126, 120–130. [Google Scholar] [CrossRef]
- Belussi, L.; Danza, L.; Meroni, I.; Salamone, F. Energy performance assessment with empirical methods: Application of energy signature. Opto-Electron. Rev. 2015, 23, 85–89. [Google Scholar] [CrossRef]
- Belussi, L.; Danza, L.; Meroni, I.; Salamone, F.; Ragazzi, F.; Mililli, M. Energy performance of buildings: A study of the differences between assessment methods. In Energy Consumption: Impacts of Human Activity, Current and Future Challenges, Environmental and Socio-Economic Effects; Nova Science Publishers: New York, NY, USA, 2014; pp. 53–75. [Google Scholar]
- Danza, L.; Belussi, L.; Meroni, I.; Salamone, F.; Floreani, F.; Piccinini, A.; Dabusti, A. A simplified thermal model to control the energy fluxes and to improve the performance of buildings. Energy Procedia 2016, 101, 97–104. [Google Scholar] [CrossRef]
- Danza, L.; Belussi, L.; Meroni, I.; Mililli, M.; Salamone, F. Hourly calculation method of air source heat pump behavior. Buildings 2016, 6, 16. [Google Scholar] [CrossRef]
- FHfFC Project Web Page. Available online: www.fhffc.it (accessed on 16 May 2018).


| Sensor | Typical Range | Response Time | Accuracy |
|---|---|---|---|
| Relative humidity: capacitive humidity sensor | 0 ÷ 100% | >2 s | ±2% |
| Air temperature: thermistor | −40 ÷ +80 °C | >2 s | ±0.5 °C |
| Radiant temperature: 10 k thermistor inside a 40 mm diameter hollow sphere, painted in matt black | −55 ÷ +60 °C | <10 s | ±0.2 °C |
| Air velocity: low-cost hot wire anemometer | 0 ÷ 27 m/s | <2 s | ±4% |
| Sensor | Typical Range | Sampling Frequency |
|---|---|---|
| PPG sensor | - | 64 Hz |
| EDA sensor | 0.01 ÷ 100 µS | 4 Hz |
| Skin Temperature sensor | −40 ÷ +85 °C | 4 Hz |
| 3-axes accelerometer | ±2 g | 32 Hz |
| Workstation | Clothing Insulation [clo] |
|---|---|
| 1a | 0.98 |
| 2a | 0.89 |
| 2b | 1.01 |
| 3a | 0.9 |
| 4a | 0.94 |
| 4b | 0.94 |
| 4c | 0.91 |
| 5a | 1.07 |
| N. | Floor Area [m2] | User | Age [y] | Weight [kg] | Height [cm] | Gender [-] | Position [-] | Period of Test [-] |
|---|---|---|---|---|---|---|---|---|
| 1 | 21.72 | a | 61 | 61.4 | 175 | male | Senior researcher | II. 13–17 November 2017 |
| 2 | 41.94 | a | 39 | 81 | 178 | male | Researcher | I. 6–10 November 2017 |
| b | 35 | 85 | 179 | male | Researcher | I. 6–10 November 2017 | ||
| 3 | 21.72 | a | 43 | 46 | 164 | female | Researcher | III. 20–24 November 2017 |
| 4 | 20.69 | a | 29 | 60 | 160 | female | Junior researcher | IV. 27–30 November 2017 |
| b | 37 | 57 | 179 | female | Researcher | III. 20–24 November 2017 | ||
| c | 33 | 80.2 | 191 | male | Technician | IV. 27–30 November 2017 | ||
| 5 | 20.26 | a | 35 | 70 | 177 | male | Researcher | II. 13–17 November 2017 |
| Period | External Environmental Variable | Min | Avg | Max | Days (Prec. > 1.0 mm) | Cumulative Precipitations [mm] |
|---|---|---|---|---|---|---|
| I. 6–10 November 2017 | Air temperature [°C] | 5.8 | 9.3 | 13.3 | - | - |
| Relative humidity [%] | 76.3 | 98.1 | 99.7 | |||
| Solar Radiation [W/m2] | 4.5 | 102.8 | 409.2 | - | - | |
| Wind speed [m/s] | 0.2 | 1.4 | 2.6 | - | - | |
| Rain [mm] | - | - | - | 3/5 | 14.8 | |
| II. 13–17 November 2017 | Air temperature [°C] | −0.1 | 6.2 | 14.3 | - | - |
| Relative humidity [%] | 36.8 | 85.7 | 100.0 | |||
| Solar Radiation [W/m2] | 0.3 | 222.0 | 475.8 | - | - | |
| Wind speed [m/s] | 0.0 | 1.3 | 5.2 | - | - | |
| Rain [mm] | - | - | - | 0/5 | 0.0 | |
| III. 20–24 November 2017 | Air temperature [°C] | 0.6 | 7.2 | 14.3 | - | - |
| Relative humidity [%] | 58.2 | 96.2 | 100.0 | |||
| Solar Radiation [W/m2] | 1.8 | 143.4 | 415.5 | - | - | |
| Wind speed [m/s] | 0.1 | 1.1 | 2.5 | - | - | |
| Rain [mm] | - | - | - | 0/5 | 0.0 | |
| IV. 27–30 November 2017 | Air temperature [°C] | −3.2 | 2.5 | 11.4 | - | - |
| Relative humidity [%] | 25.8 | 88.8 | 99.8 | |||
| Solar Radiation [W/m2] | 0.8 | 172.0 | 459.5 | - | - | |
| Wind speed [m/s] | 0.2 | 1.5 | 3.9 | - | - | |
| Rain [mm] | - | - | - | 1/4 | 1.8 |
| PMVint | PMV |
|---|---|
| 3 (hot) | >2.5 |
| 2 (warm) | 2.5:1.5 |
| 1 (slightly warm) | 1.5:0.5 |
| 0 (neutral) | −0.5:0.5 |
| −1 (slightly cool) | −1.5:−0.5 |
| −2 (cool) | −2.5:−1.5 |
| −3 (cold) | <−2.5 |
| Workstation | PMVint vs. TSV Difference |
|---|---|
| 1a | 16.67% |
| 2a | 72.73% |
| 2b | 61.54% |
| 3a | 25.00% |
| 4a | 45.83% |
| 4b | 29.17% |
| 4c | 44.44% |
| 5a | 10.53% |
| User | Instances | Variable | Min | Avg | Max |
|---|---|---|---|---|---|
| 1a | 2240 | EDA [μS] | 0.031 | 0.303 | 0.999 |
| HR [bpm] | 74 | 80 | 139 | ||
| Tskin [°C] | 28.96 | 32.58 | 35.51 | ||
| RH [%] | 37.35 | 40.41 | 44.15 | ||
| To [°C] | 19.1 | 21.88 | 23.97 | ||
| 2a | 276 | EDA [μS] | 0.111 | 0.264 | 0.866 |
| HR [bpm] | 55 | 79 | 114 | ||
| Tskin [°C] | 29.53 | 30.93 | 34.92 | ||
| RH [%] | 44.3 | 47.32 | 48.5 | ||
| To [°C] | 21.04 | 22.58 | 23.54 | ||
| 2b | 855 | EDA [μS] | 0.035 | 0.194 | 0.988 |
| HR [bpm] | 54 | 76 | 141 | ||
| Tskin [°C] | 30.44 | 32.08 | 33.99 | ||
| RH [%] | 42.95 | 46.25 | 49.75 | ||
| To [°C] | 20.78 | 23.03 | 23.53 | ||
| 3a | 0 | EDA [μS] | - | - | - |
| HR [bpm] | - | - | - | ||
| Tskin [°C] | - | - | - | ||
| RH [%] | - | - | - | ||
| To [°C] | - | - | - | ||
| 4a | 453 | EDA [μS] | 0.03 | 0.137 | 0.418 |
| HR [bpm] | 59 | 72 | 112 | ||
| Tskin [°C] | 30.12 | 32.39 | 34.25 | ||
| RH [%] | 32.65 | 35.24 | 38.6 | ||
| To [°C] | 21.81 | 23.55 | 24.83 | ||
| 4b | 1012 | EDA [μS] | 0.032 | 0.25 | 0.645 |
| HR [bpm] | 57 | 76 | 153 | ||
| Tskin [°C] | 28.35 | 30.84 | 33.43 | ||
| RH [%] | 39.4 | 40.84 | 43.6 | ||
| To [°C] | 18.8 | 21.74 | 22.98 | ||
| 4c | 1335 | EDA [μS] | 0.145 | 0.605 | 0.996 |
| HR [bpm] | 56 | 77 | 136 | ||
| Tskin [°C] | 30.2 | 32.46 | 33.82 | ||
| RH [%] | 36.2 | 37.07 | 39.9 | ||
| To [°C] | 20.85 | 22.86 | 24.65 | ||
| 5a | 2851 | EDA [μS] | 0.07 | 0.356 | 0.658 |
| HR [bpm] | 55 | 74 | 156 | ||
| Tskin [°C] | 27.48 | 30.33 | 33.88 | ||
| RH [%] | 34.9 | 38.2 | 41.4 | ||
| To [°C] | 22 | 23.82 | 25.06 |
| Scenario I | Scenario II | Scenario III | Scenario IV | Scenario V | ||||||
|---|---|---|---|---|---|---|---|---|---|---|
| Input Variables: | Input Variables: | Input Variables: | Input Variables: | Input Variables: | ||||||
| Tskin, EDA, HR, To and RH | Tskin, EDA, HR and To | Tskin, EDA, HR and RH | Tskin, EDA and HR | Tskin, EDA, To and RH | ||||||
| Algorithms | Avg. | St. dev. | Avg. | St. dev. | Avg. | St. dev. | Avg. | St. dev. | Avg. | St. dev. |
| Logistic Regression | 0.81409 | 0.01097 | 0.66468 | 0.020608 | 0.658721 | 0.013551 | 0.50145 | 0.01582 | 0.821118 | 0.015817 |
| Linear Discriminant Analysis | 0.834002 | 0.014409 | 0.679365 | 0.014593 | 0.712757 | 0.014929 | 0.508934 | 0.016283 | 0.837188 | 0.016283 |
| K-Nearest Neighbors | 0.939725 | 0.009485 | 0.807953 | 0.016847 | 0.874745 | 0.014654 | 0.628515 | 0.003083 | 0.991965 | 0.003083 |
| Classification and Regression Trees | 0.991964 | 0.003655 | 0.96564 | 0.006938 | 0.966609 | 0.006322 | 0.809057 | 0.002703 | 0.993211 | 0.00266 |
| Gaussian Naive Bayes | 0.829985 | 0.012559 | 0.707909 | 0.02119 | 0.789527 | 0.011923 | 0.537479 | 0.011854 | 0.809613 | 0.011854 |
| Support Vector Machines | 0.953167 | 0.009965 | 0.803516 | 0.025457 | 0.879319 | 0.019446 | 0.62186 | 0.005874 | 0.980602 | 0.005874 |
| User | Precision | Recall | F1-Score | Support |
|---|---|---|---|---|
| 1a | 1.00 | 0.99 | 0.99 | 438 |
| 2a | 1.00 | 0.98 | 0.99 | 66 |
| 2b | 0.99 | 1.00 | 1.00 | 184 |
| 3a | - | - | - | - |
| 4a | 1.00 | 1.00 | 1.00 | 100 |
| 4b | 0.97 | 0.98 | 0.98 | 193 |
| 4c | 1.00 | 1.00 | 1.00 | 247 |
| 5a | 0.99 | 1.00 | 1.00 | 577 |
| Avg/tot | 0.99 | 0.99 | 0.99 | 1805 |
© 2018 by the authors. Licensee MDPI, Basel, Switzerland. This article is an open access article distributed under the terms and conditions of the Creative Commons Attribution (CC BY) license (http://creativecommons.org/licenses/by/4.0/).
Share and Cite
Salamone, F.; Belussi, L.; Currò, C.; Danza, L.; Ghellere, M.; Guazzi, G.; Lenzi, B.; Megale, V.; Meroni, I. Integrated Method for Personal Thermal Comfort Assessment and Optimization through Users’ Feedback, IoT and Machine Learning: A Case Study †. Sensors 2018, 18, 1602. https://doi.org/10.3390/s18051602
Salamone F, Belussi L, Currò C, Danza L, Ghellere M, Guazzi G, Lenzi B, Megale V, Meroni I. Integrated Method for Personal Thermal Comfort Assessment and Optimization through Users’ Feedback, IoT and Machine Learning: A Case Study †. Sensors. 2018; 18(5):1602. https://doi.org/10.3390/s18051602
Chicago/Turabian StyleSalamone, Francesco, Lorenzo Belussi, Cristian Currò, Ludovico Danza, Matteo Ghellere, Giulia Guazzi, Bruno Lenzi, Valentino Megale, and Italo Meroni. 2018. "Integrated Method for Personal Thermal Comfort Assessment and Optimization through Users’ Feedback, IoT and Machine Learning: A Case Study †" Sensors 18, no. 5: 1602. https://doi.org/10.3390/s18051602
APA StyleSalamone, F., Belussi, L., Currò, C., Danza, L., Ghellere, M., Guazzi, G., Lenzi, B., Megale, V., & Meroni, I. (2018). Integrated Method for Personal Thermal Comfort Assessment and Optimization through Users’ Feedback, IoT and Machine Learning: A Case Study †. Sensors, 18(5), 1602. https://doi.org/10.3390/s18051602