Design Parameter Optimization of a Silicon-Based Grating Waveguide for Performance Improvement in Biochemical Sensor Application


Abstract
1. Introduction
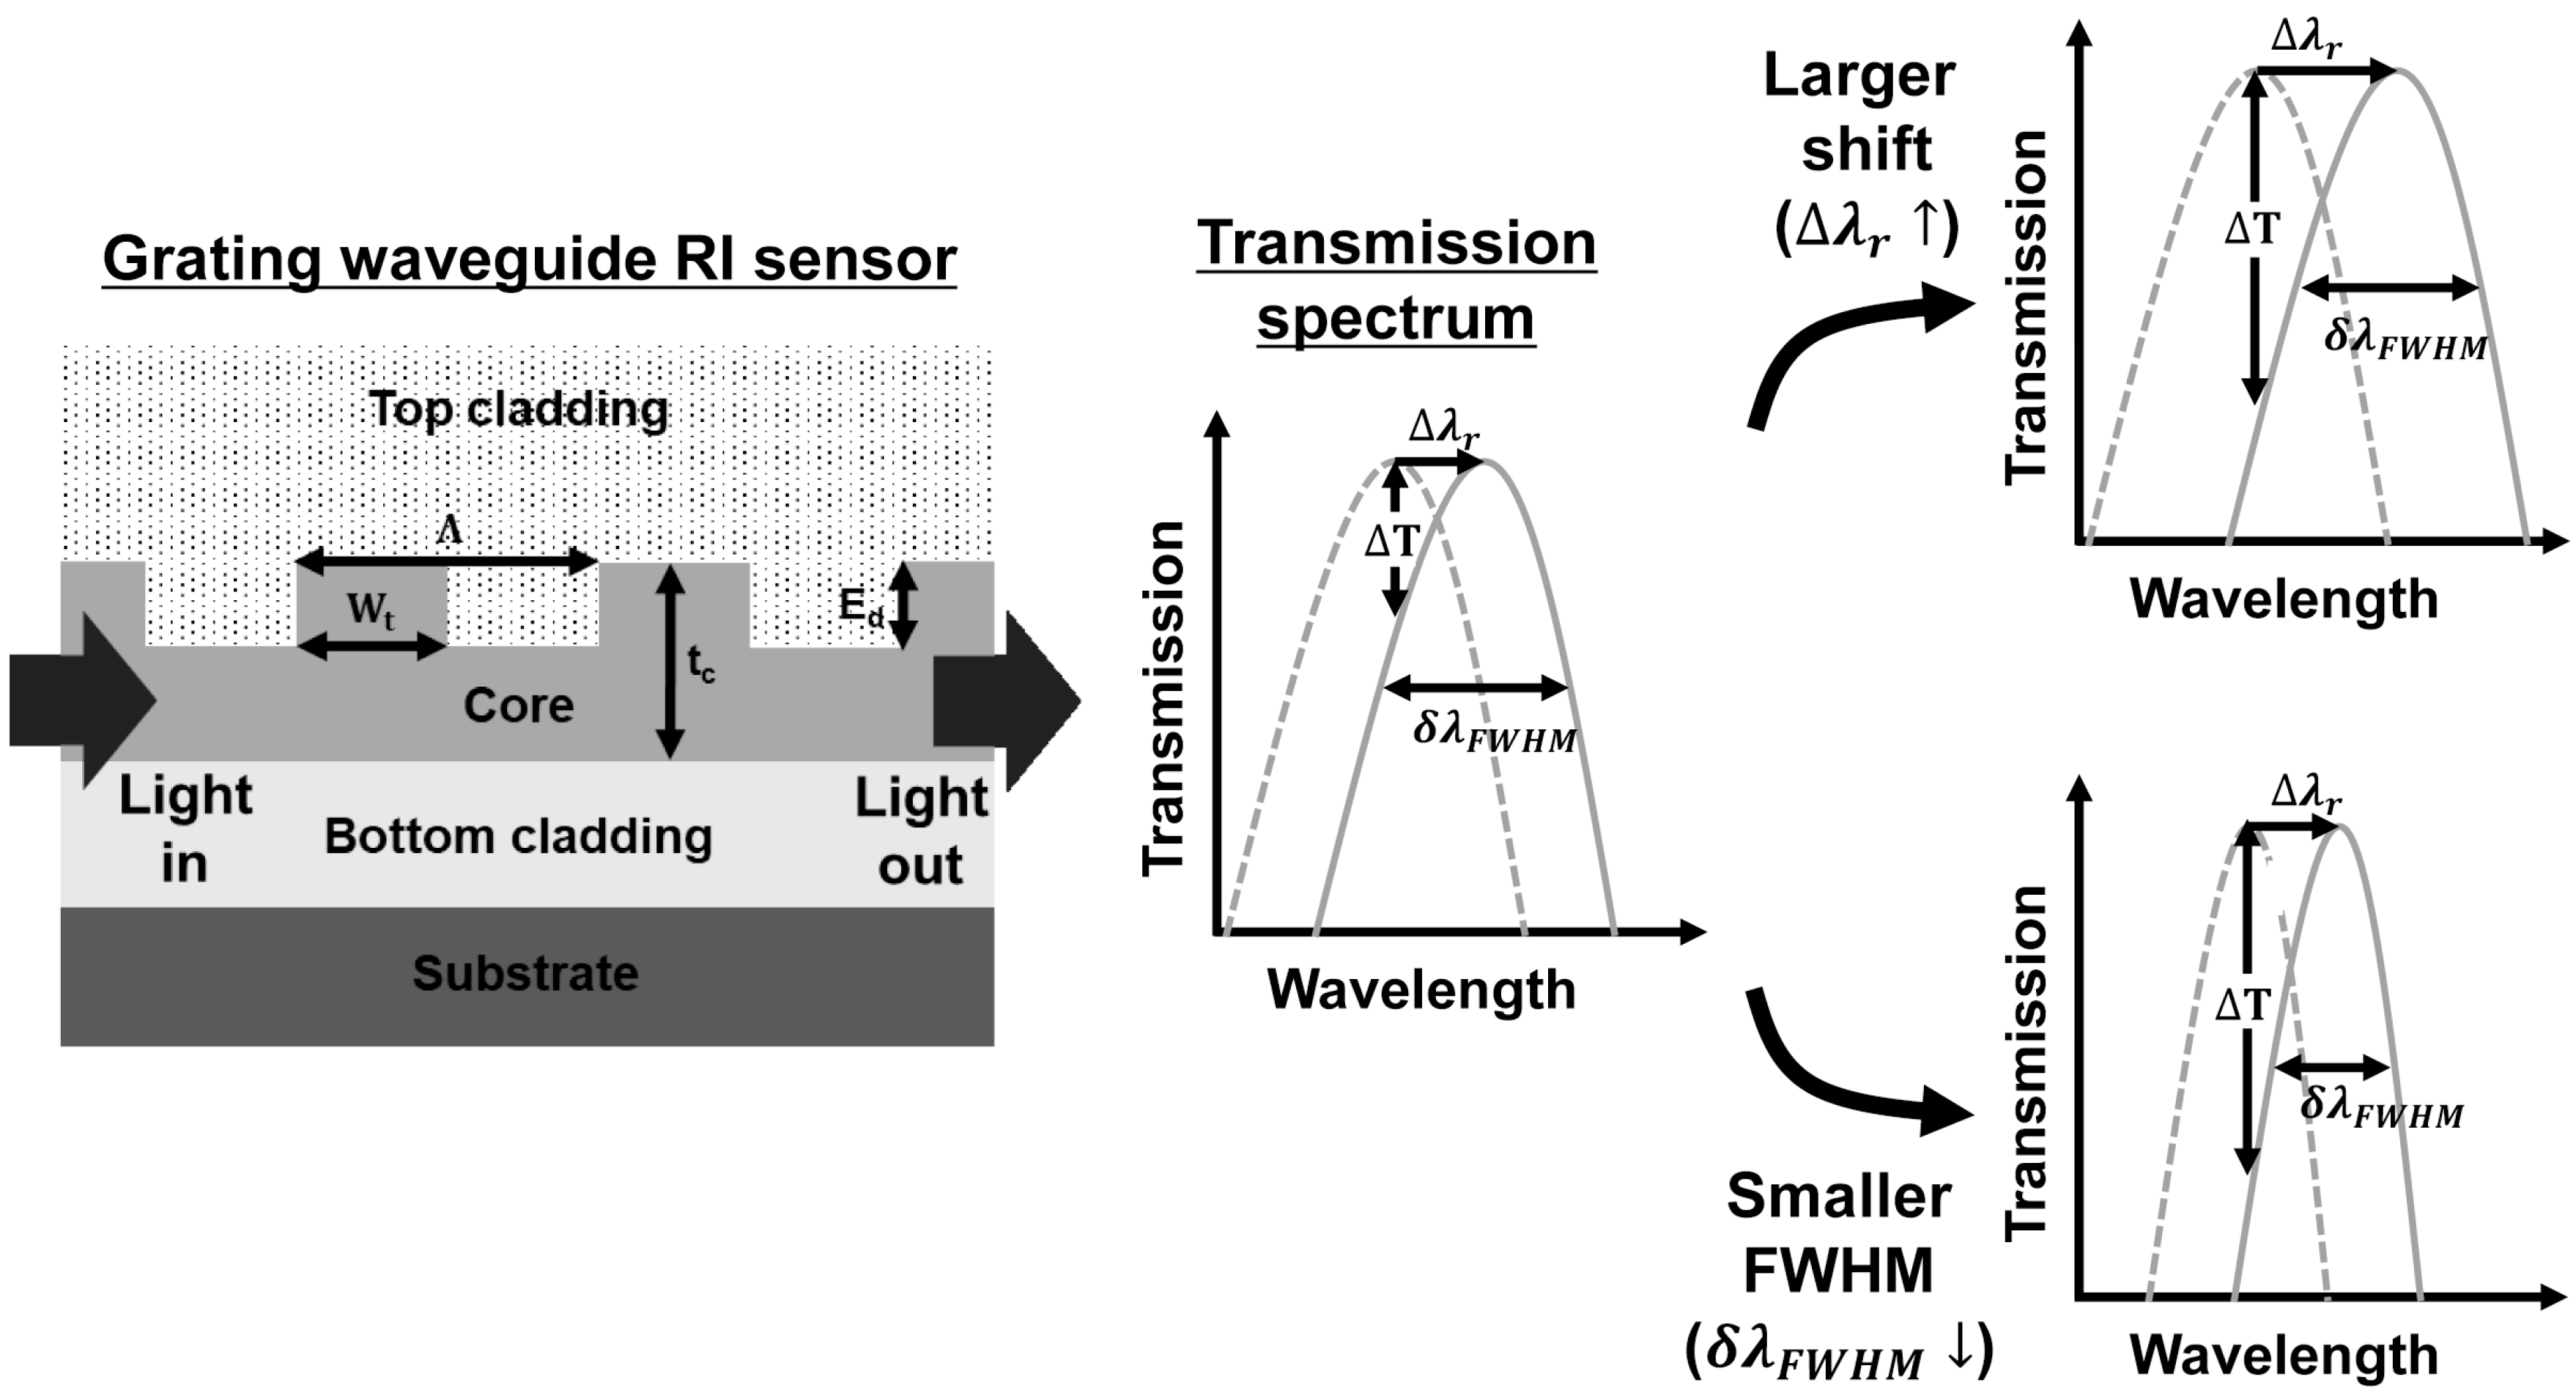
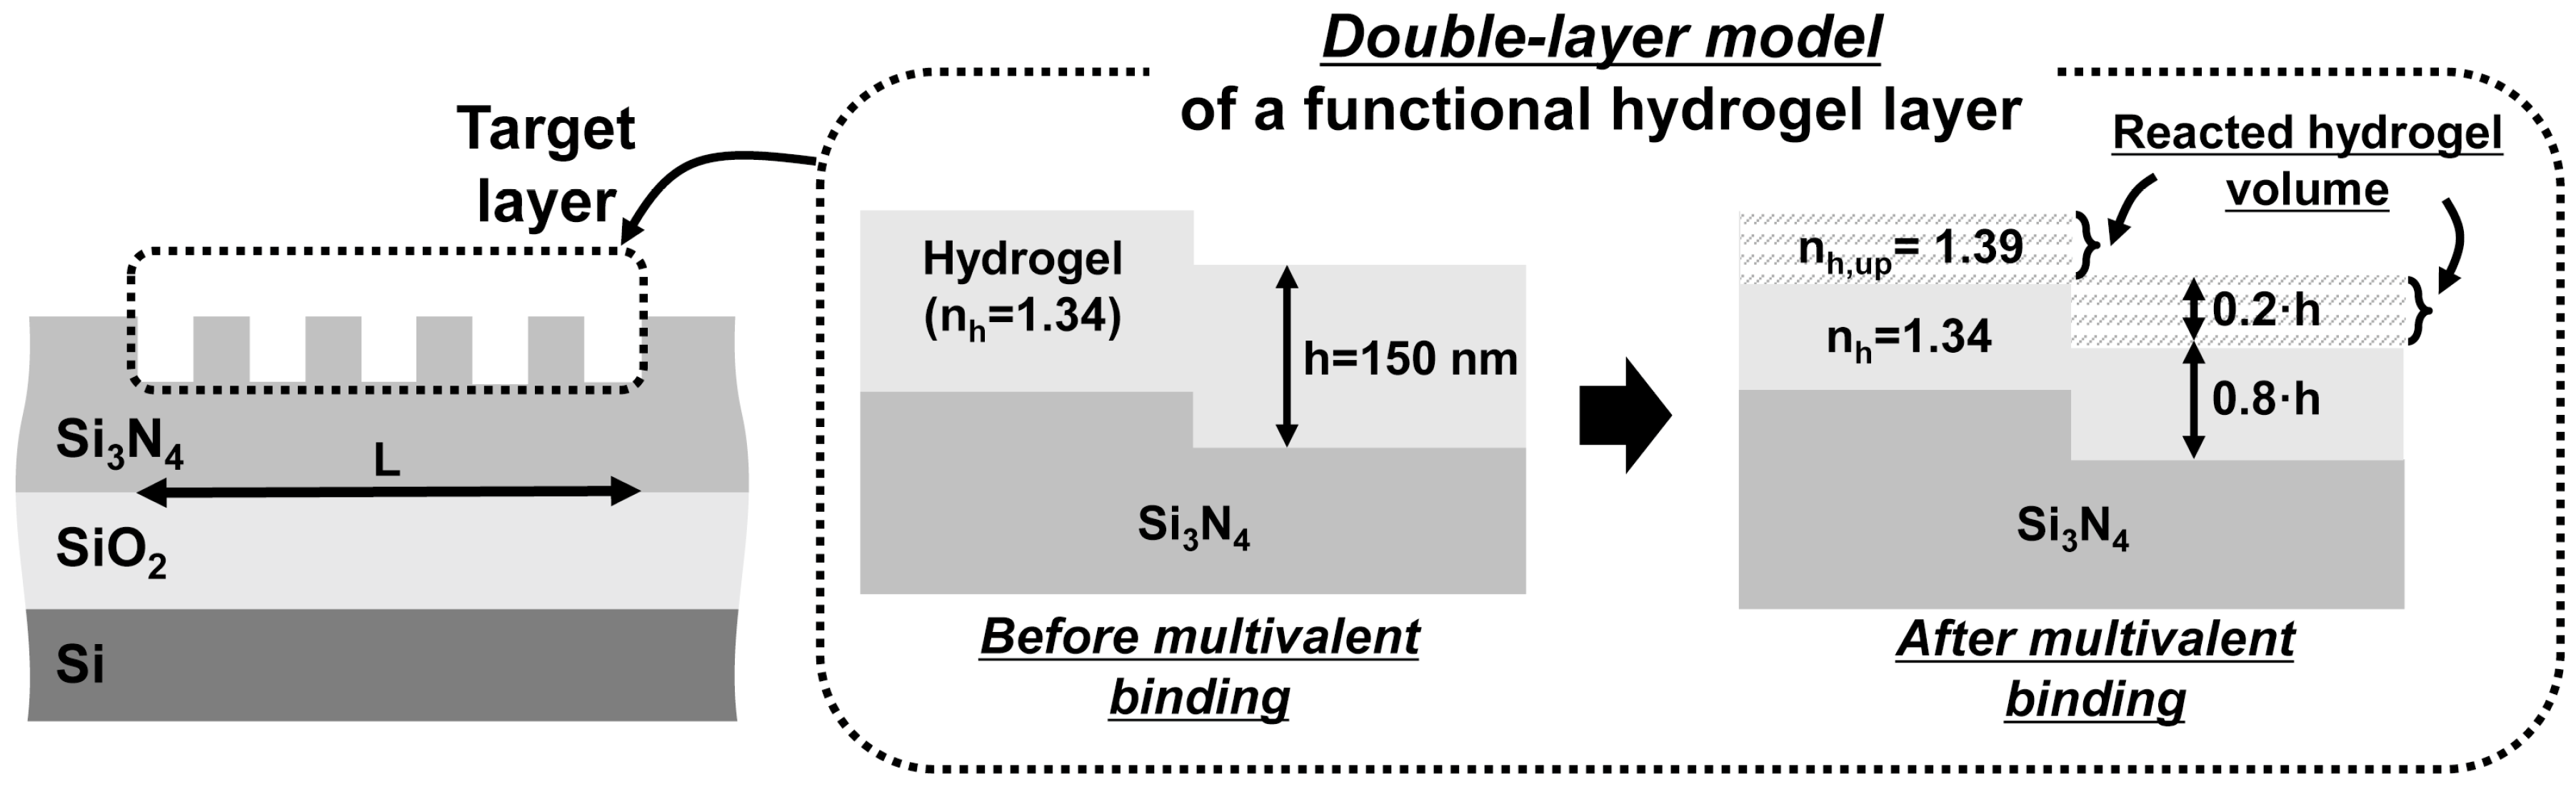
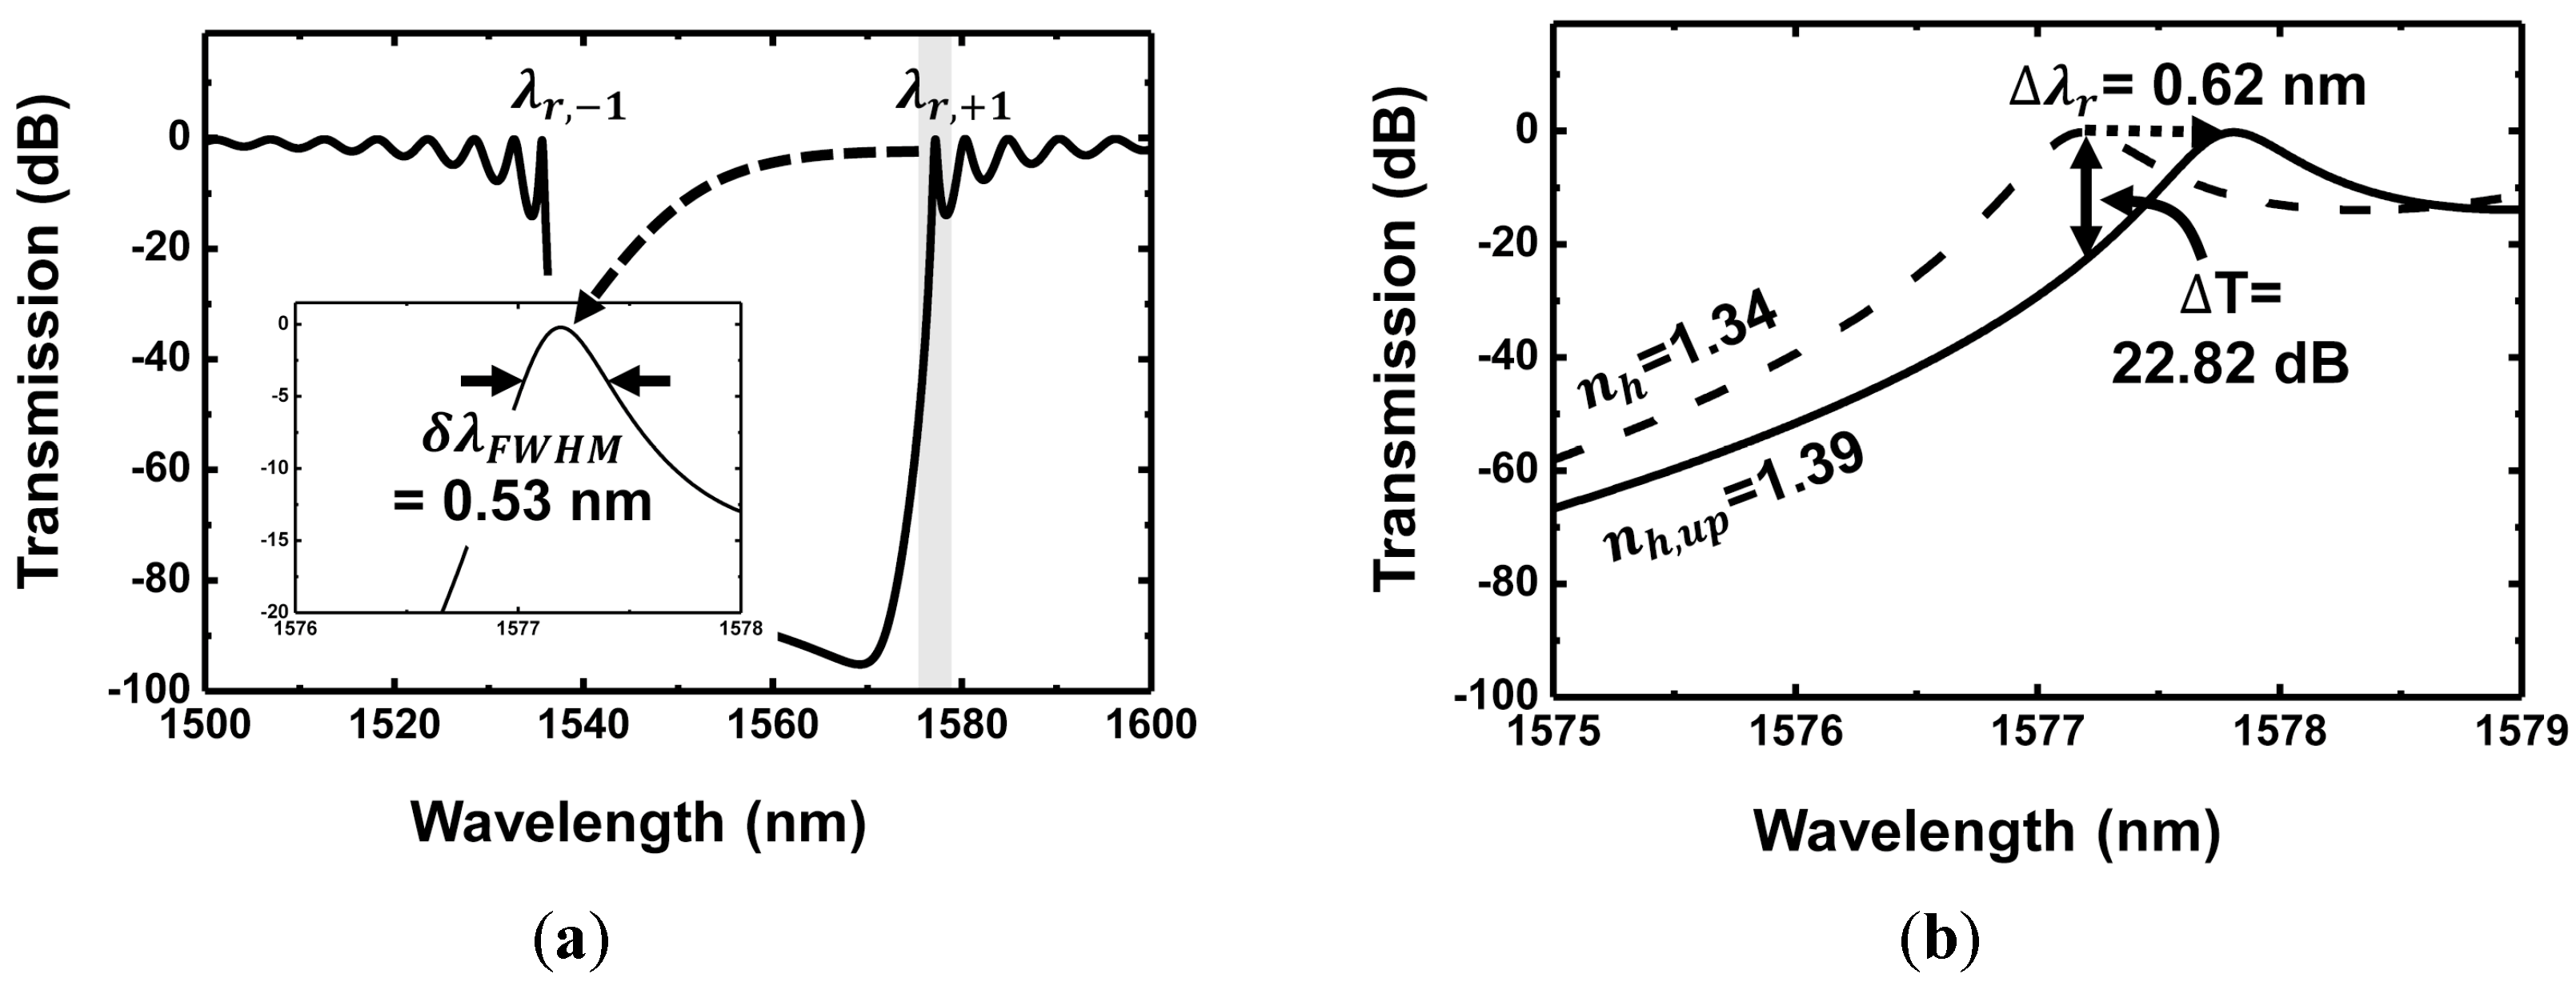
2. Principles
3. Simulation of Dependence of Performance Evaluation on Grating Parameters
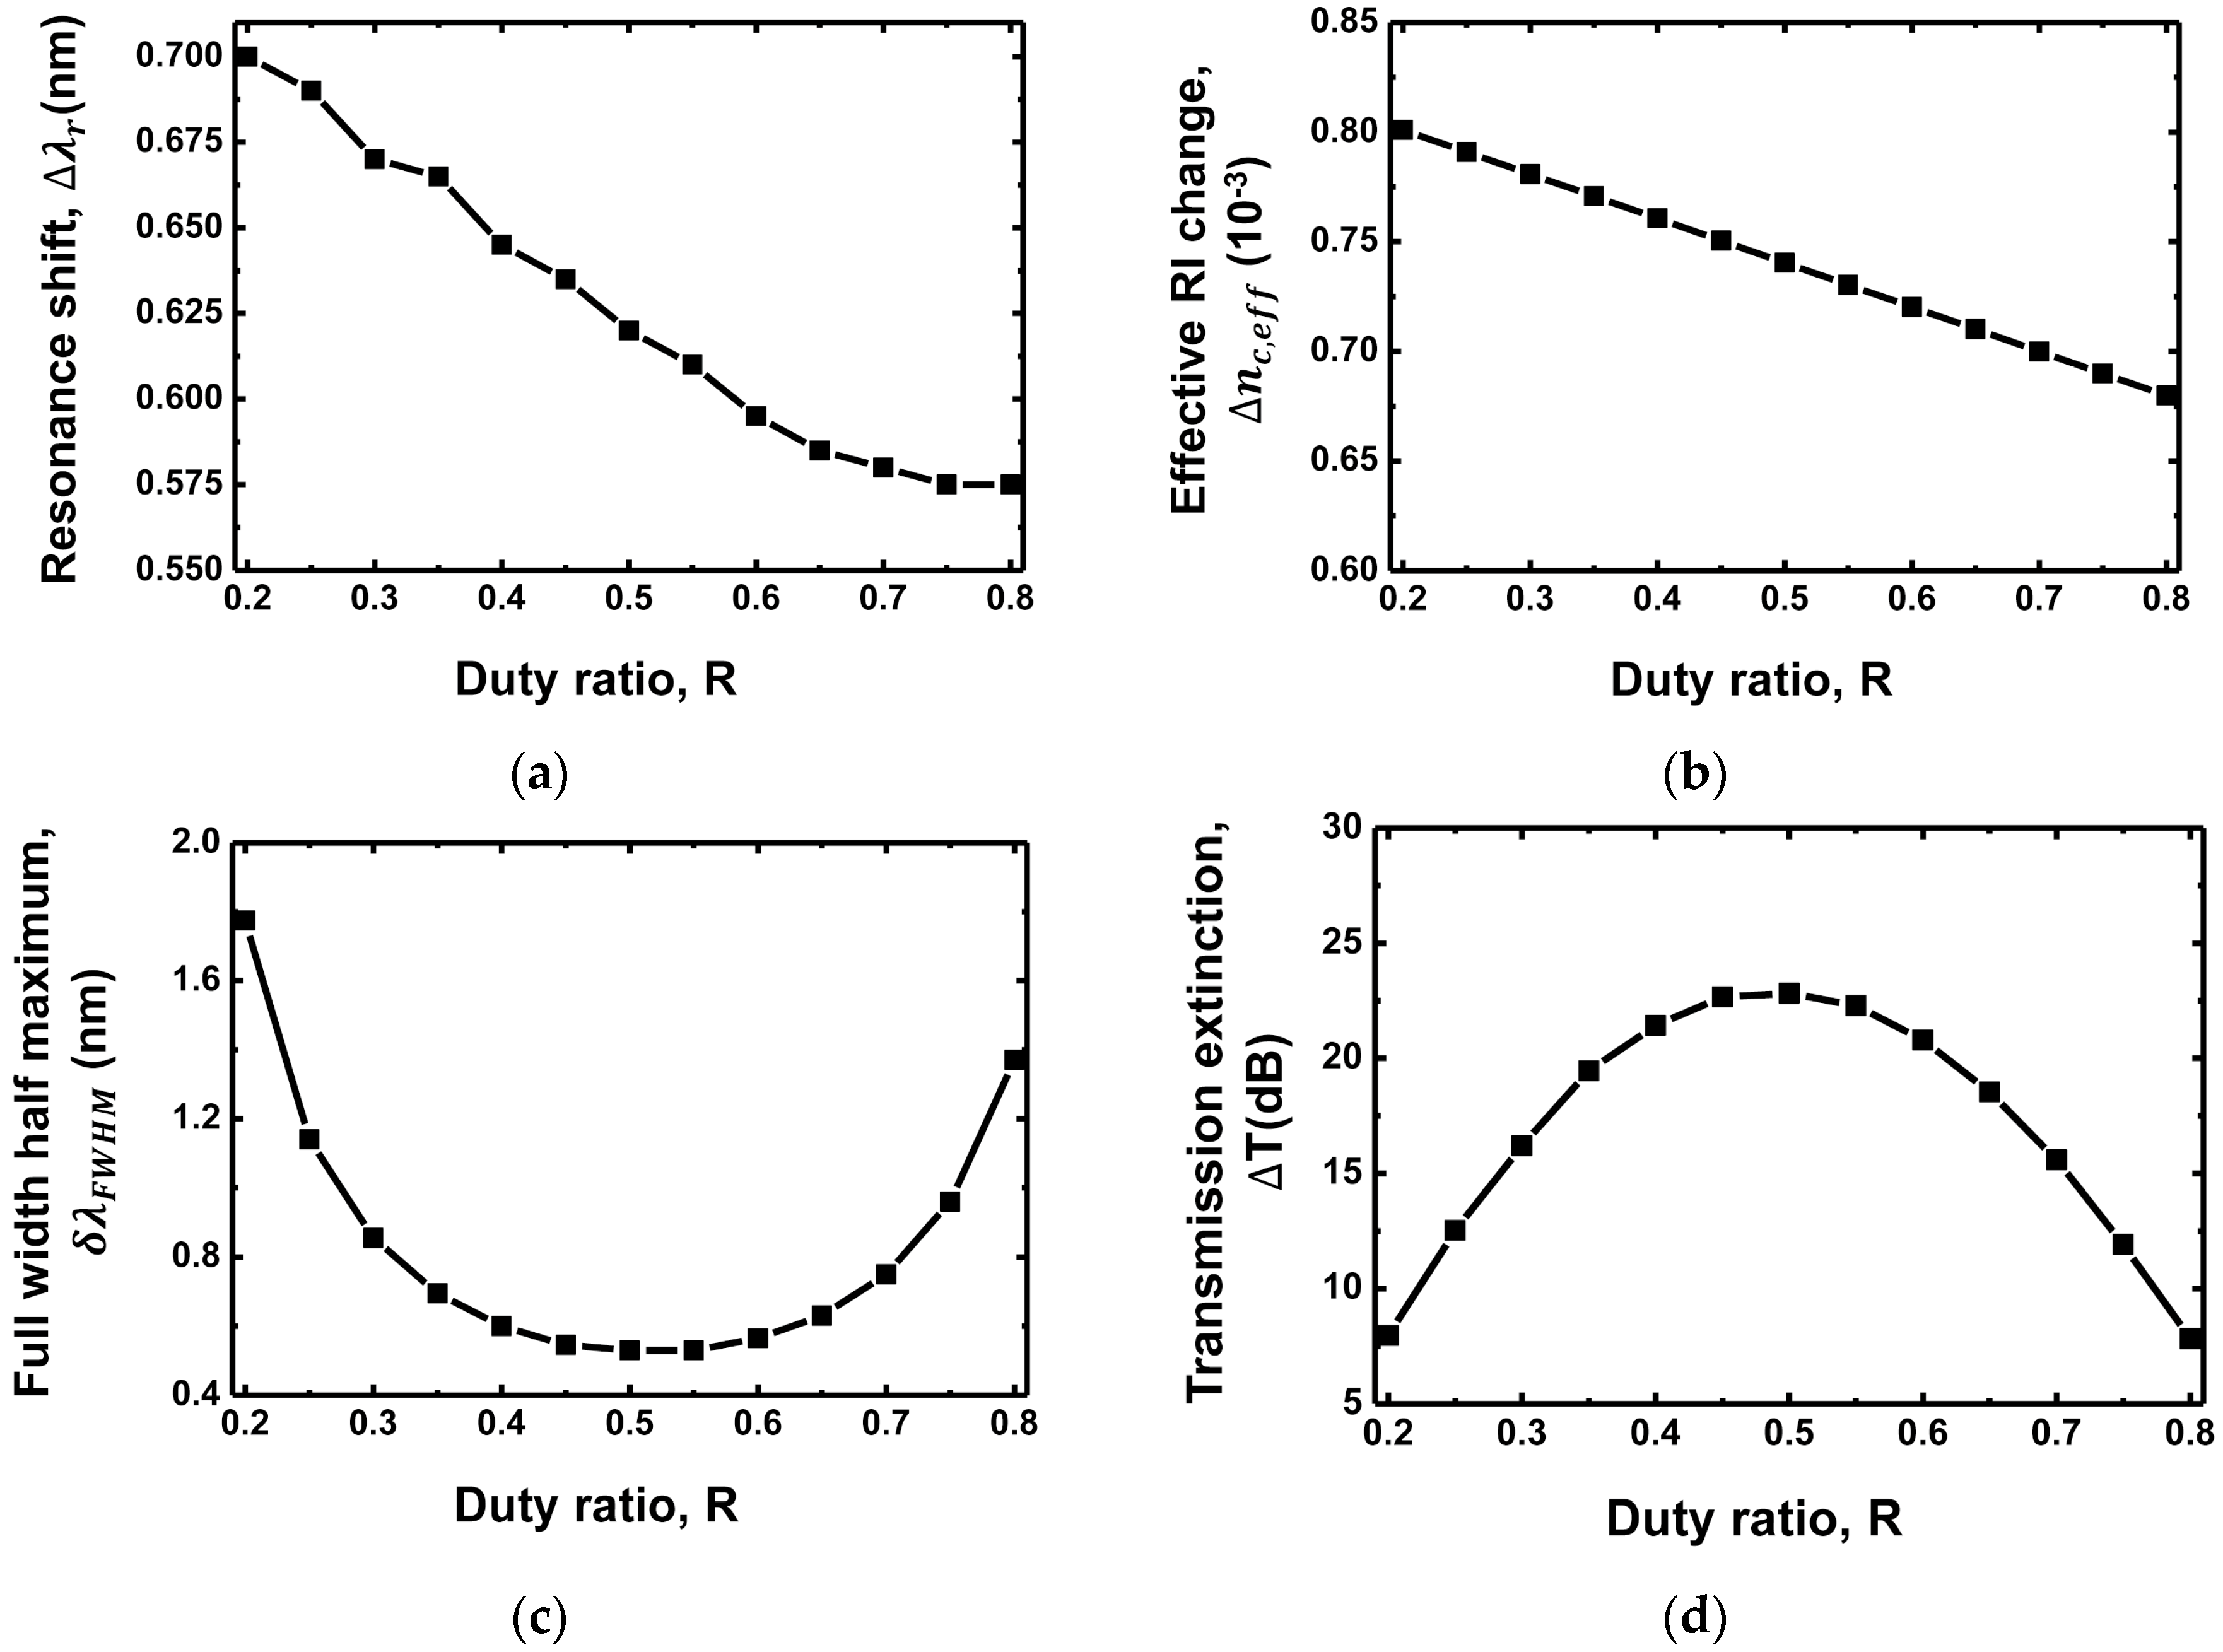
3.1. Duty Ratio Dependence
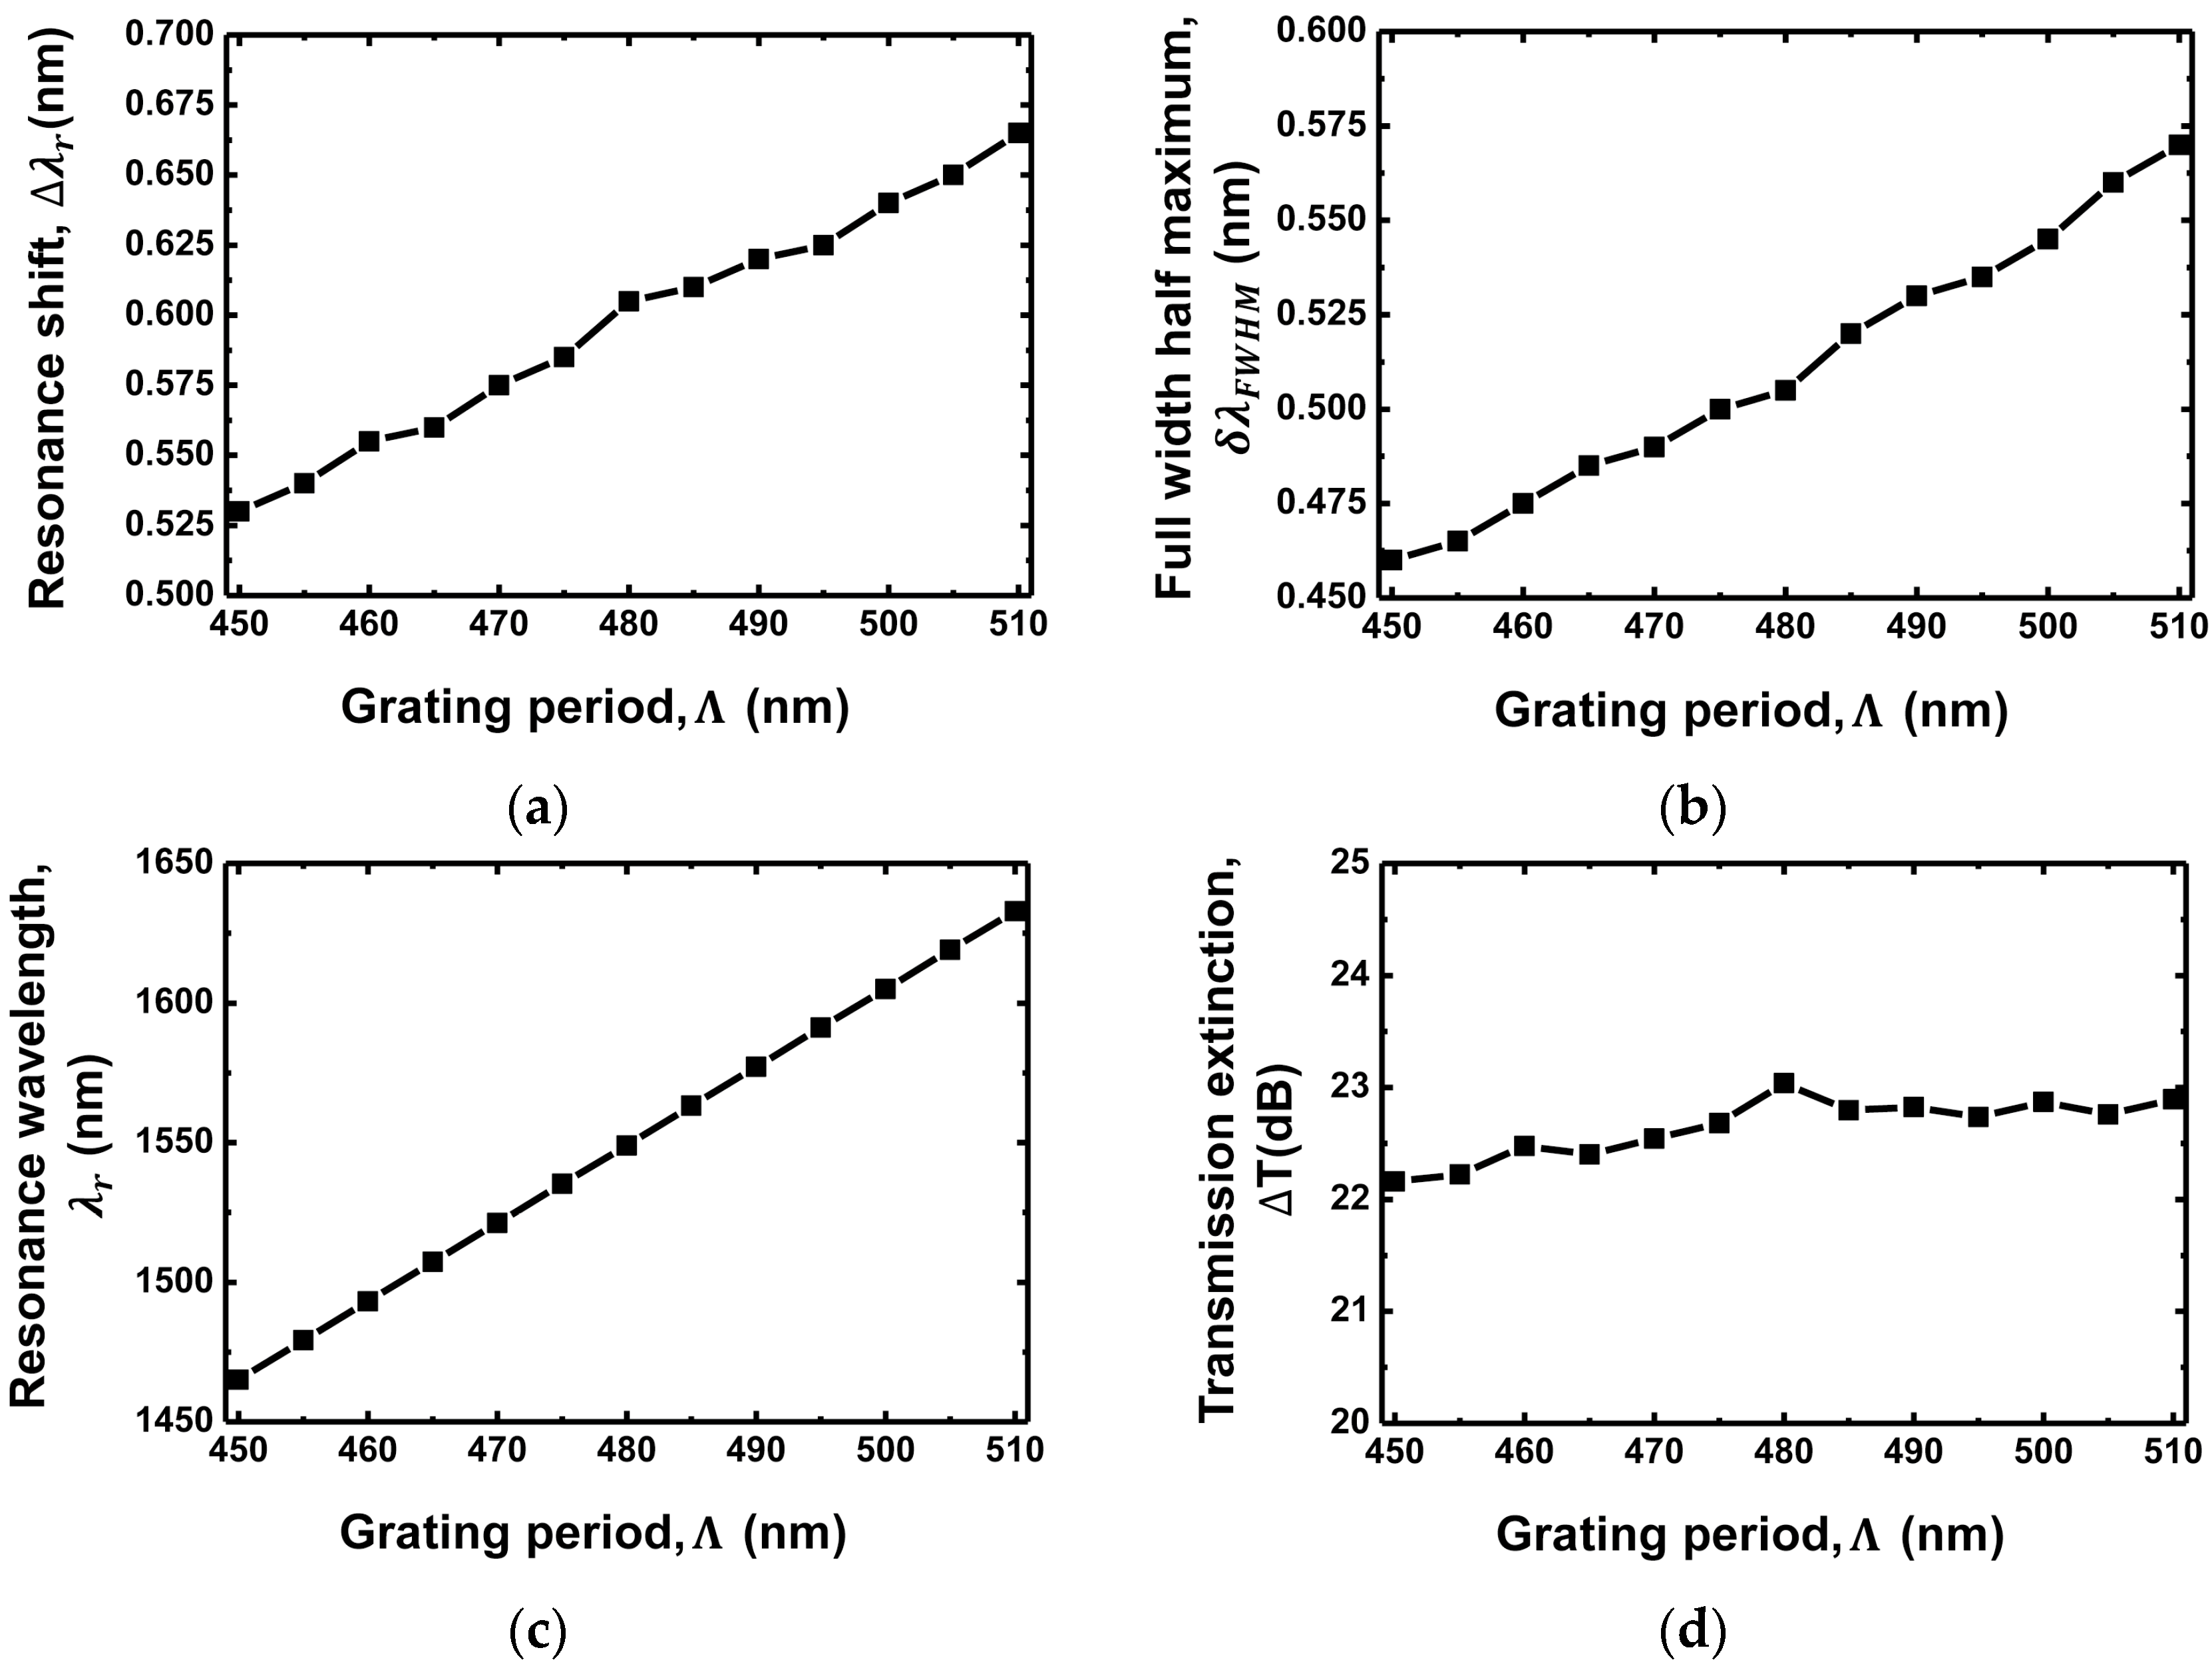
3.2. Grating Period Dependence
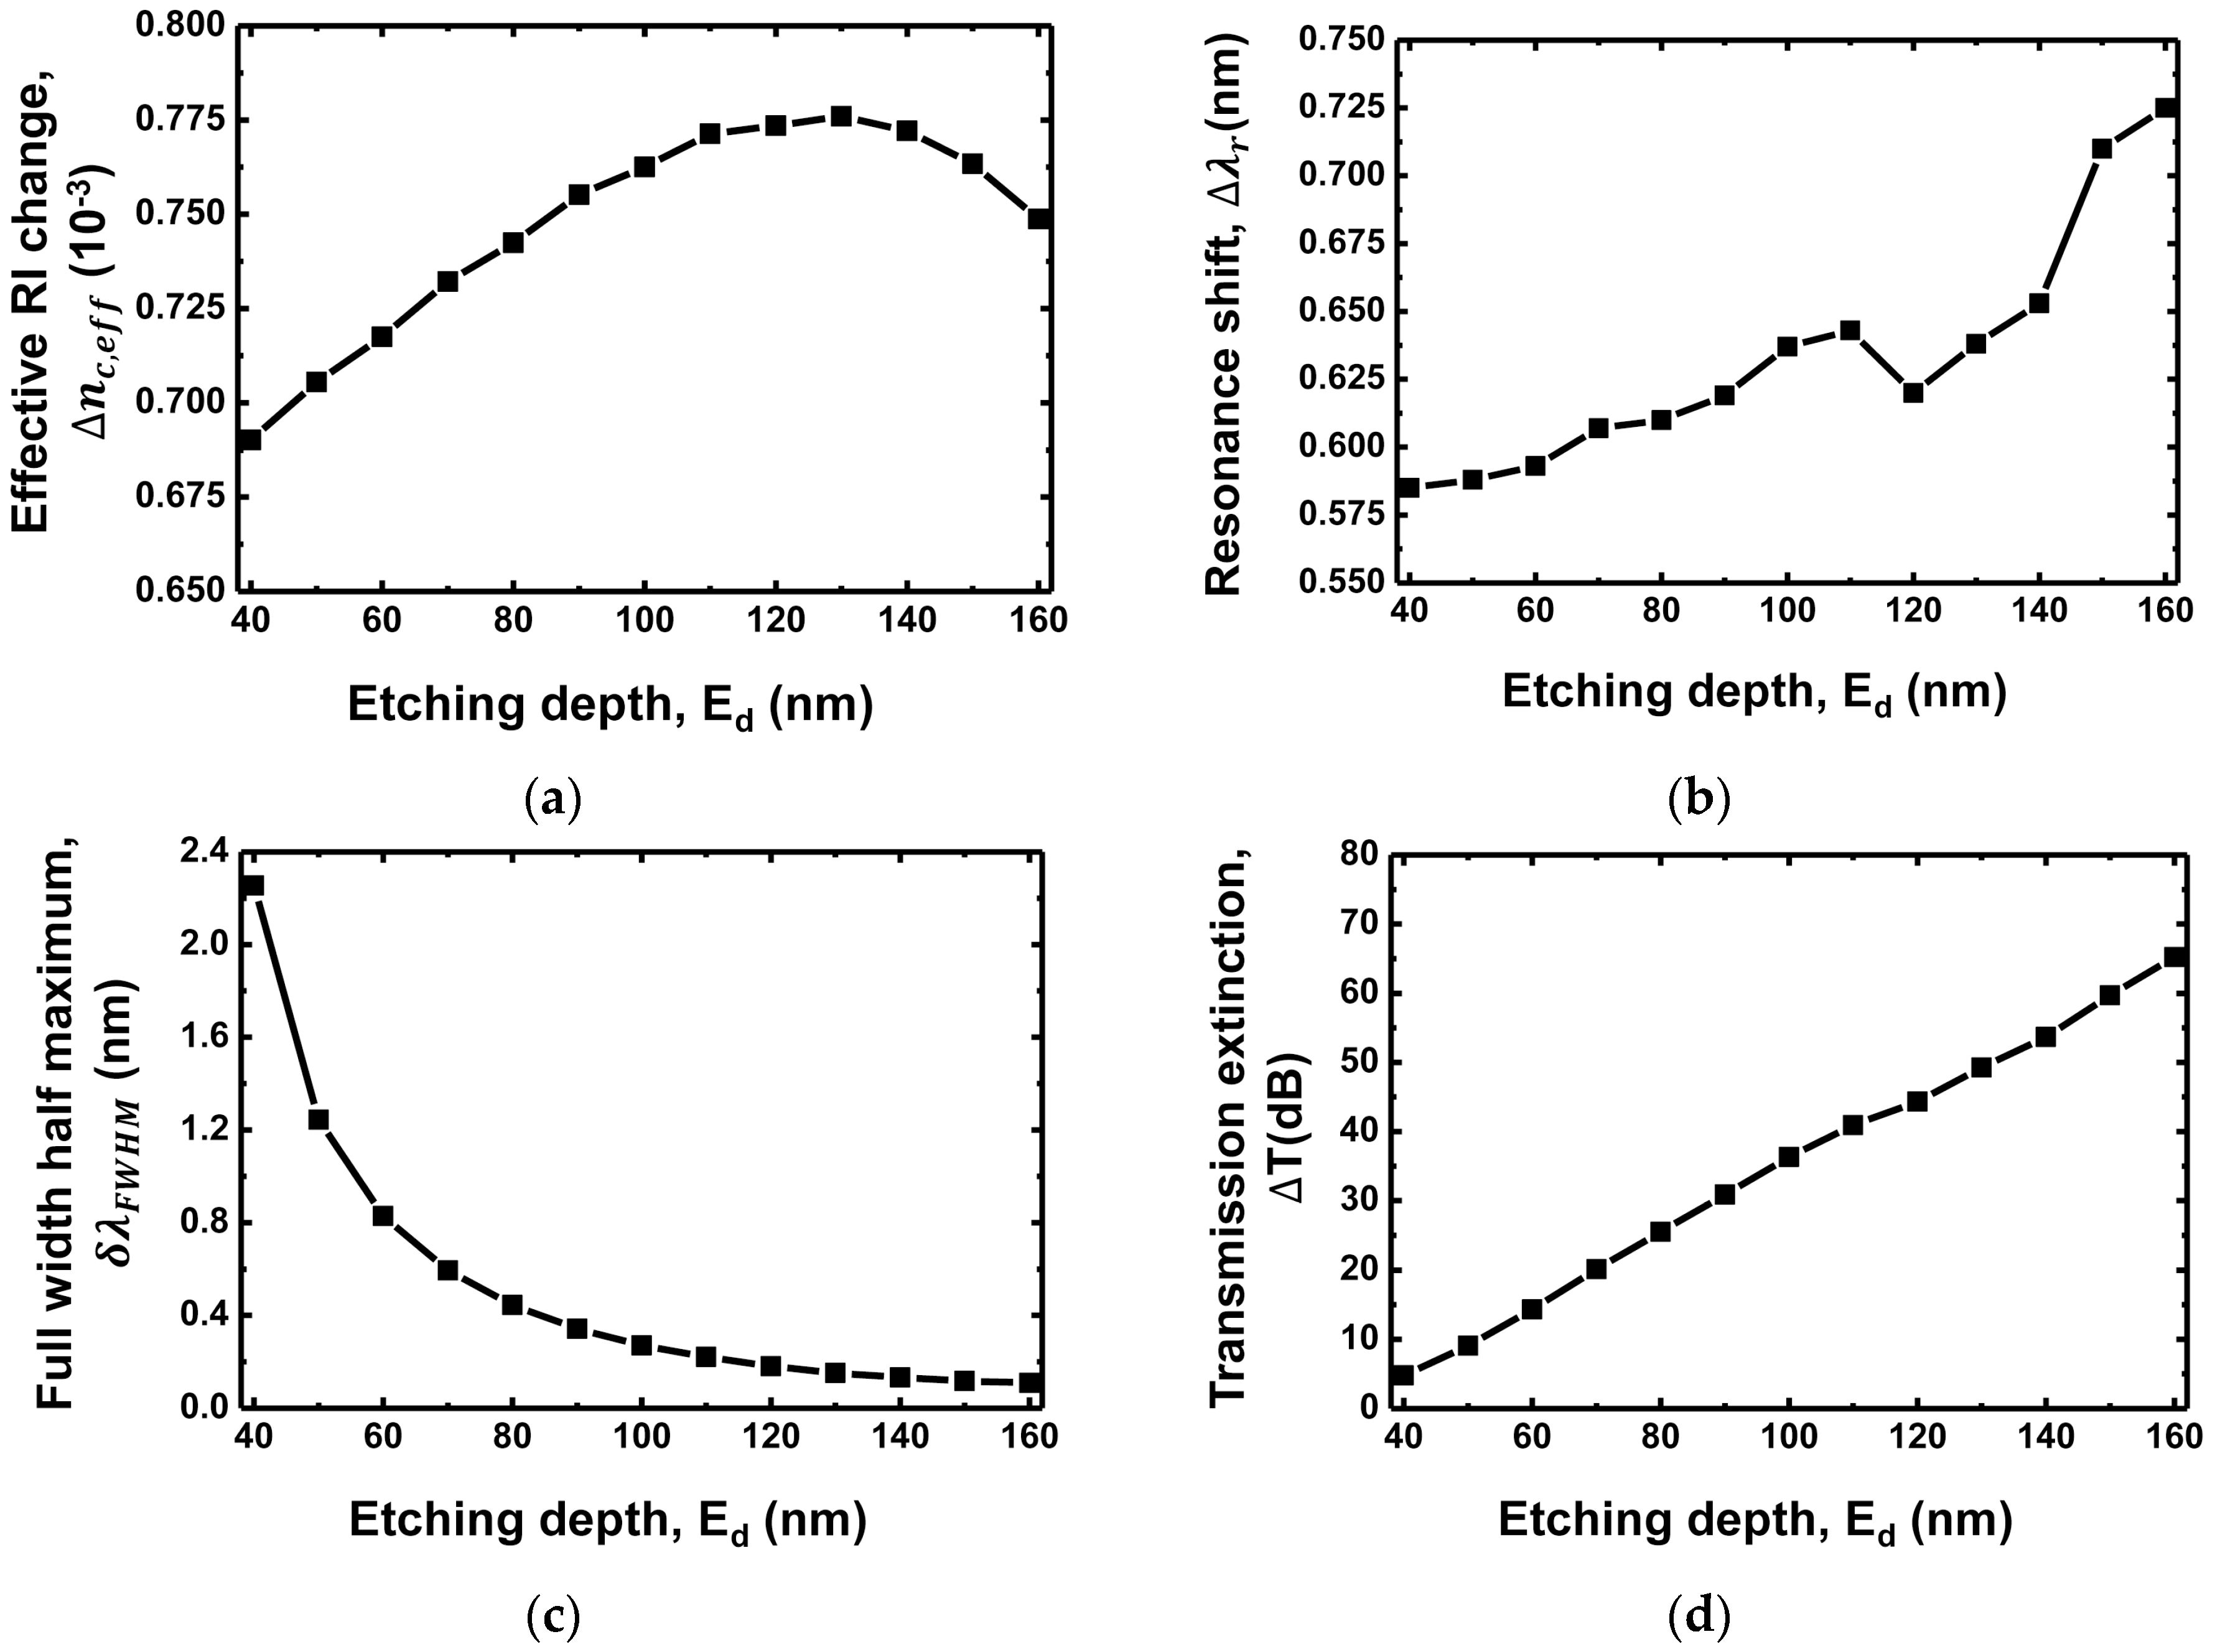
3.3. Etching Depth Dependence
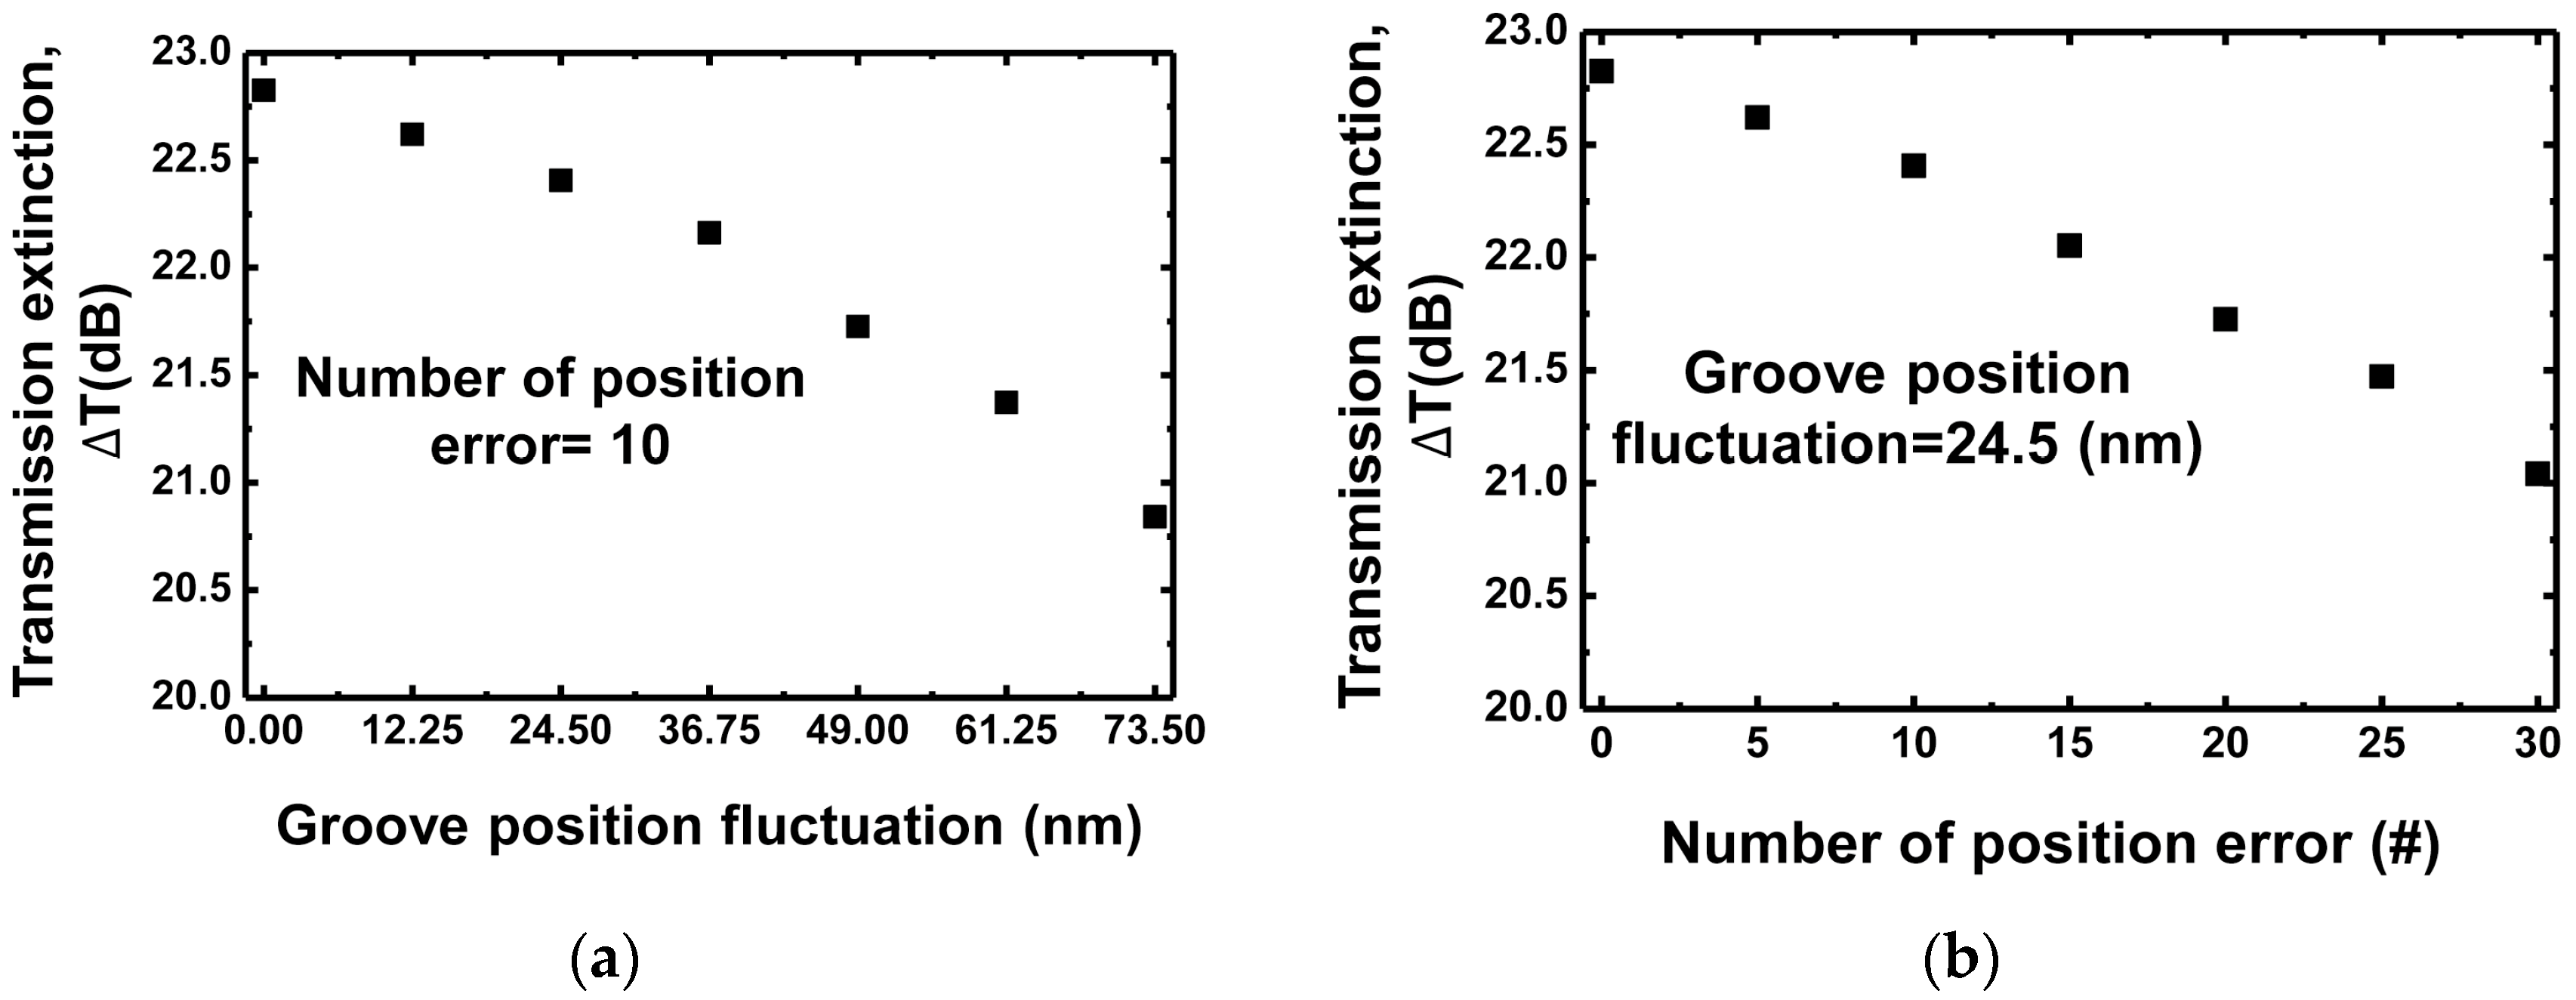
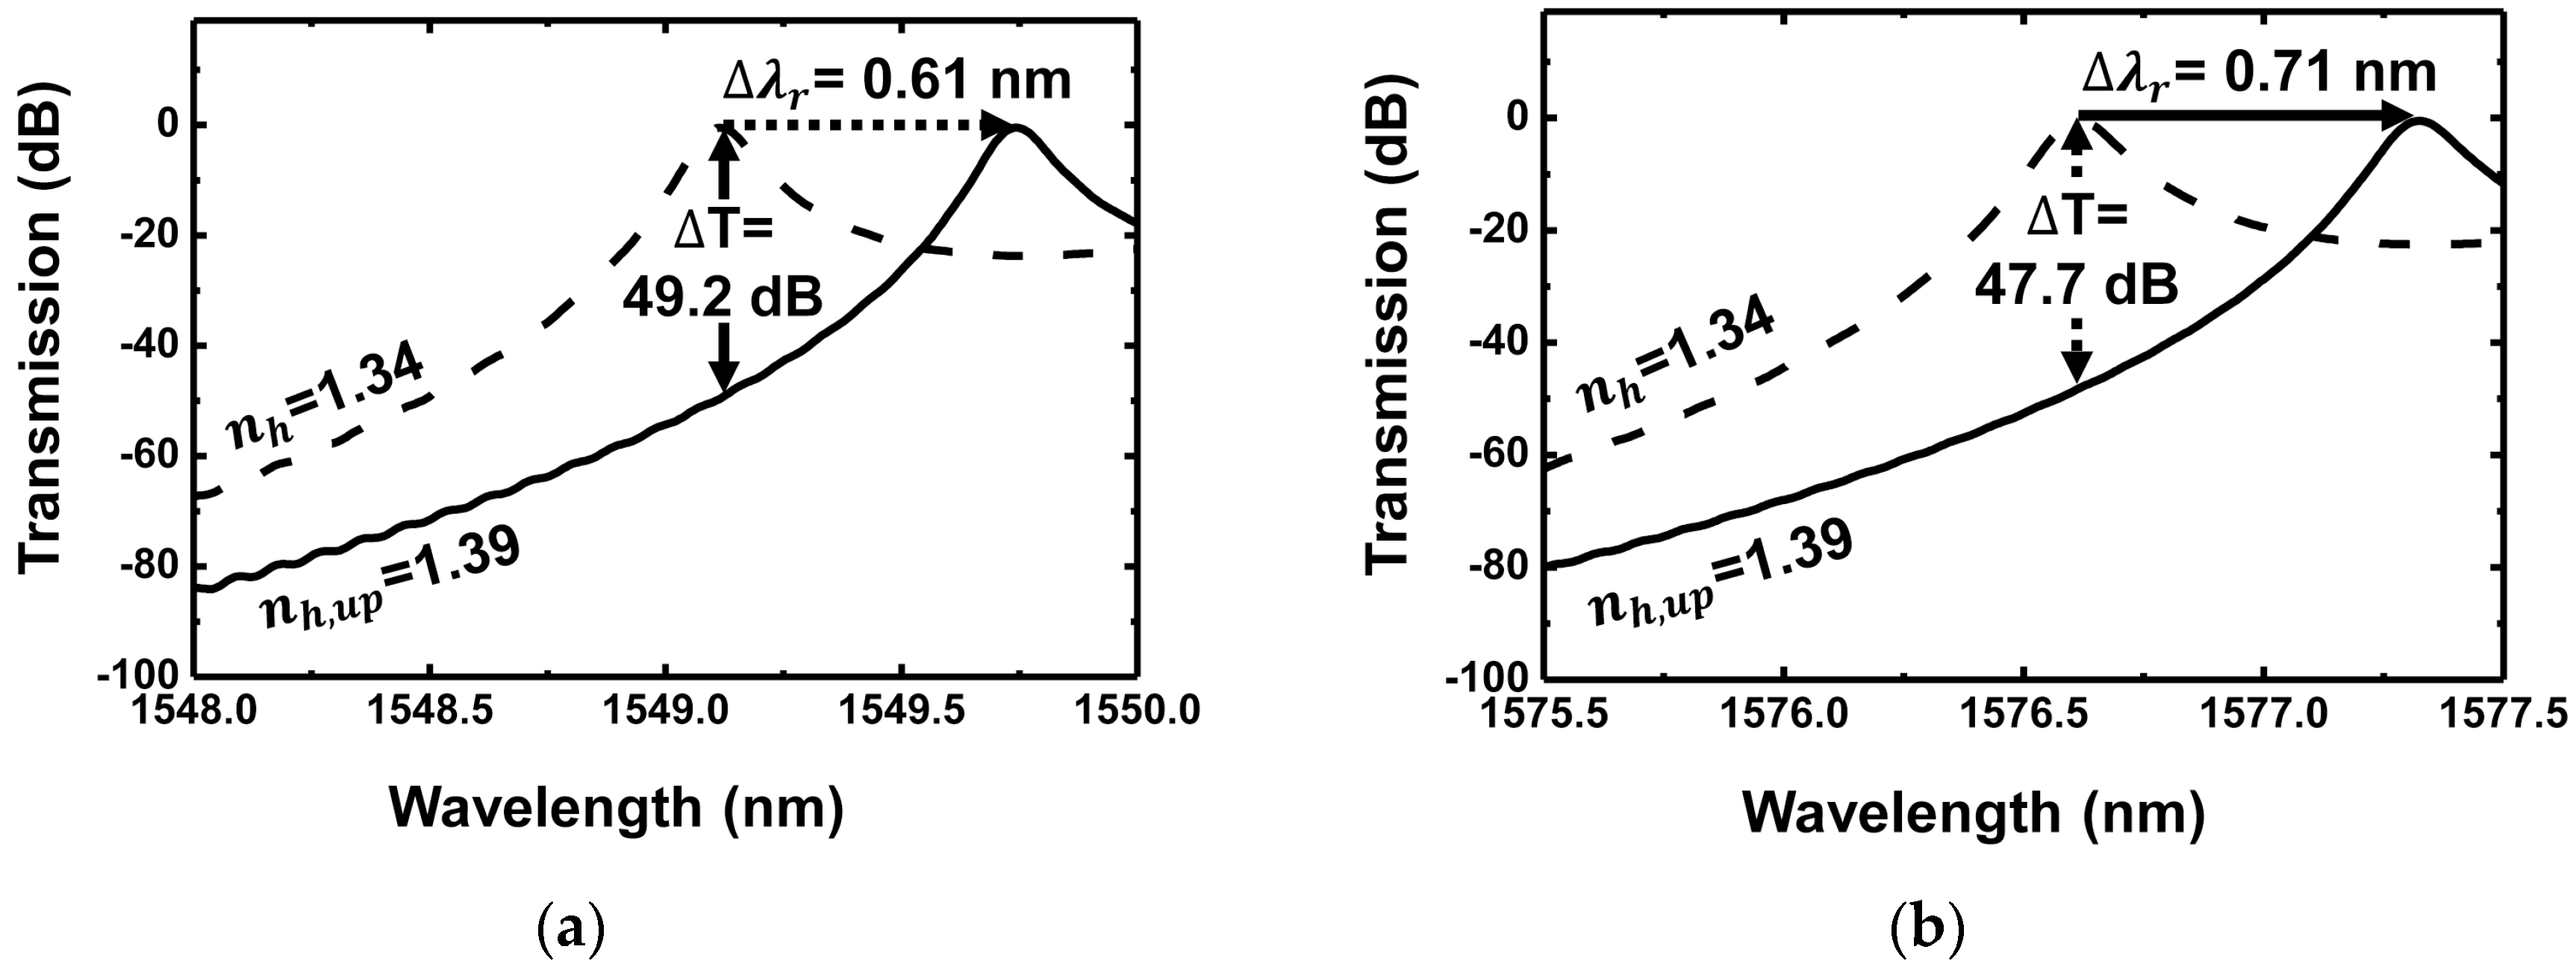
4. Discussions
5. Conclusions
Acknowledgments
Author Contributions
Conflicts of Interest
References
- Clerc, D.; Lukosz, W. Integrated optical output grating coupler as refractometer and (bio-)chemical sensor. Sens. Actuators B Chem. 1993, 11, 461–465. [Google Scholar] [CrossRef]
- Lukosz, W. Integrated optical chemical and direct biochemical sensors. Sens. Actuators B Chem. 1995, 29, 37–50. [Google Scholar] [CrossRef]
- Mogensen, K.B.; El-Ali, J.; Wolff, A.; Kutter, J.P. Integration of polymer waveguides for optical detection in microfabricated chemical analysis systems. Appl. Opt. 2003, 42, 4072–4079. [Google Scholar] [CrossRef] [PubMed]
- White, I.M.; Fan, X. On the performance quantification of resonant refractive index sensors. Opt. Express 2008, 16, 1020–1028. [Google Scholar] [CrossRef] [PubMed]
- Fan, X.D.; White, I.M.; Shopova, S.I.; Zhu, H.Y.; Suter, J.D.; Sun, Y. Sensitive optical biosensors for unlabeled targets: A review. Anal. Chim. Acta 2008, 620, 8–26. [Google Scholar] [CrossRef] [PubMed]
- Iqbal, M.; Gleeson, M.A.; Spaugh, B.; Tybor, F.; Gunn, W.G.; Hochberg, M.; Baehr-Jones, T.; Bailey, R.C.; Gunn, L.C. Label-free biosensor arrays based on silicon ring resonators and high-speed optical scanning instrumentation. IEEE J. Sel. Top. Quantum Electron. 2010, 16, 654–661. [Google Scholar] [CrossRef]
- Carlborg, C.F.; Gylfason, K.B.; Kazmierczak, A.; Dortu, F.; Banuls Polo, M.J.; Maquieira Catala, A.; Kresbach, G.M.; Sohlstrom, H.; Moh, T.; Vivien, L.; et al. Apackaged optical slot-waveguide ring resonator sensor array for multiplex label-free assays in labs-on-chips. Lab Chip 2010, 10, 281–290. [Google Scholar] [CrossRef] [PubMed]
- Hunt, H.K.; Armani, A.M. Label-free biological and chemical sensors. Nanoscale 2010, 2, 1544–1559. [Google Scholar] [CrossRef] [PubMed]
- Kozma, P.; Kehl, F.; Ehrentreich-Förster, E.; Stamm, C.; Bier, F.F. Integrated planar optical waveguide interferometer biosensors: A comparative review. Biosens. Bioelectron. 2014, 58, 287–307. [Google Scholar] [CrossRef] [PubMed]
- Pfeifer, P.; Aldinger, U.; Schwotzer, G.; Diekmann, S.; Steinrücke, P. Real time sensing of specific molecular binding using surface plasmon resonance spectroscopy. Sens. Actuators B Chem. 1999, 54, 166–175. [Google Scholar] [CrossRef]
- De Vos, K.; Bartolozzi, I.; Schacht, E.; Bienstman, P.; Baets, R. Silicon-on-insulator microring resonator for sensitive and label-free biosensing. Opt. Express 2007, 15, 7610–7615. [Google Scholar] [CrossRef] [PubMed]
- Rindorf, L.; Jensen, J.B.; Dufva, M.; Pedersen, L.H.; Høiby, P.E.; Bang, O. Photonic crystal fiber long-period gratings for biochemical sensing. Opt. Express 2006, 14, 8224–8231. [Google Scholar] [CrossRef] [PubMed]
- Vörös, J.; Ramsden, J.J.; Csúcs, G.; Szendrő, I.; De Paul, S.M.; Textor, M.; Spencer, N.D. Optical grating coupler biosensors. Biomaterials 2002, 23, 3699–3710. [Google Scholar] [CrossRef]
- Pham, S.V.; Dijkstra, M.; Hollink, A.J.F.; Kauppinen, L.J.; de Ridder, R.M.; Pollnau, M.; Lambeck, P.V.; Hoekstra, H.J.W.M. On-chip bulk-index concentration and direct, label-free protein sensing utilizing an optical grated-waveguide cavity. Sens. Actuators B Chem. 2012, 174, 602–608. [Google Scholar] [CrossRef]
- Kabashin, A.V.; Evans, P.; Pastkovsky, S.; Hendren, W.; Wurtz, G.A.; Atkinson, R.; Pollard, R.; Podolskiy, V.A.; Zayats, A.V. Plasmonic nanorod metamaterials for biosensing. Nat. Mater. 2009, 8, 867–871. [Google Scholar] [CrossRef] [PubMed]
- Prabhathan, P.; Murukeshan, V.M.; Jing, Z.; Ramana, P.V. Compact SOI nanowire refractive index sensor using phase shifted Bragg grating. Opt. Express 2009, 17, 15330–15341. [Google Scholar] [CrossRef] [PubMed]
- Hopman, W.C.L.; Hoekstra, H.J.W.M.; Dekker, R.; Zhuang, L.; De Ridder, R.M. Far-field scattering microscopy applied to analysis of slow light, power enhancement, and delay times in uniform Bragg waveguide gratings. Opt. Express 2007, 15, 1851–1870. [Google Scholar] [CrossRef] [PubMed]
- Kehl, F.; Bischof, D.; Michler, M.; Keka, M.; Stanley, R. Design of a label-free, distributed Bragg grating resonator based dielectric waveguide biosensor. Photonics 2015, 2, 125. [Google Scholar] [CrossRef]
- Hong, Y.S.; Kim, J.; Sung, H.K. Characterization of a functional hydrogel layer on a silicon-based grating waveguide for a biochemical sensor. Sensors 2016, 16, 914. [Google Scholar] [CrossRef] [PubMed]
- Kim, M.; Carman, C.V.; Yang, W.; Salas, A.; Springer, T.A. The primacy of affinity over clustering in regulation of adhesiveness of the integrin αLβ2. J. Cell Biol. 2004, 167, 1241–1253. [Google Scholar] [CrossRef] [PubMed]
- Dawson, J.P.; Berger, M.B.; Lin, C.C.; Schlessinger, J.; Lemmon, M.A.; Ferguson, K.M. Epidermal growth factor receptor dimerization and activation require ligand-induced conformational changes in the dimer interface. Mol. Cell. Biol. 2005, 25, 7734–7742. [Google Scholar] [CrossRef] [PubMed]
- Furie, B.; Furie, B.C. Mechanisms of thrombus formation. N. Engl. J. Med. 2008, 359, 938–949. [Google Scholar] [CrossRef] [PubMed]
- Densmore, A.; Xu, D.-X.; Waldron, P.; Janz, S.; Cheben, P.; Lapointe, J.; Delge, A.; Lamontagne, B.; Schmid, J.H.; Post, E. A silicon-on-insulator photonic wire based evanescent field sensor. IEEE Photonics Technol. Lett. 2006, 18, 2520–2522. [Google Scholar] [CrossRef]
- Li, J.Y.; Lu, D.F.; Zhang, Z.; Liu, Q.; Qi, Z.M. Hierarchical mesoporous silica film modified near infrared SPR sensor with high sensitivities to small and large molecules. Sens. Actuators B Chem. 2014, 203, 690–696. [Google Scholar] [CrossRef]
- Jokerst, N.; Royal, M.; Palit, S.; Luan, L.; Dhar, S.; Tyler, T. Chip scale integrated microresonator sensing systems. J. Biophotonics 2009, 2, 212–226. [Google Scholar] [CrossRef] [PubMed]
- Kim, J.; Singh, N.; Lyon, L.A. Label-free biosensing with hydrogel microlenses. Angew. Chem. Int. Ed. 2006, 45, 1446–1449. [Google Scholar] [CrossRef] [PubMed]
- Philipp, H.R. Optical properties of silicon nitride. J. Electrochem. Soc. 1972, 120, 295–300. [Google Scholar] [CrossRef]
- Palik, E.D. Handbook of Optical Constants of Solids; Academic Press: San Diego, CA, USA, 1998; Volume 3. [Google Scholar]
- Dai, X.; Mihailov, S.J.; Callender, C.L.; Blanchetière, C.; Walker, R.B. Ridge-waveguide-based polarization insensitive Bragg grating refractometer. Meas. Sci. Technol. 2006, 17, 1752–1756. [Google Scholar] [CrossRef]


| Grating Waveguide Parameters | Resonance Shift () | FWHM () | Resonance Wavelength () | Transmission Extinction (T) |
|---|---|---|---|---|
| Duty ratio (R) | Proportional decrease | Quadratic (min. at 0.5) | Proportional increase | Quadratic (max. at 0.5) |
| Grating period () | Proportional increase | Proportional increase | Proportional increase | Almost constant |
| Etching depth () | Proportional increase | Exponential decrease | Proportional decrease | Proportional increase |
© 2018 by the authors. Licensee MDPI, Basel, Switzerland. This article is an open access article distributed under the terms and conditions of the Creative Commons Attribution (CC BY) license (http://creativecommons.org/licenses/by/4.0/).
Share and Cite
Hong, Y.-S.; Cho, C.-H.; Sung, H.-K. Design Parameter Optimization of a Silicon-Based Grating Waveguide for Performance Improvement in Biochemical Sensor Application. Sensors 2018, 18, 781. https://doi.org/10.3390/s18030781
Hong Y-S, Cho C-H, Sung H-K. Design Parameter Optimization of a Silicon-Based Grating Waveguide for Performance Improvement in Biochemical Sensor Application. Sensors. 2018; 18(3):781. https://doi.org/10.3390/s18030781
Chicago/Turabian StyleHong, Yoo-Seung, Chun-Hyung Cho, and Hyuk-Kee Sung. 2018. "Design Parameter Optimization of a Silicon-Based Grating Waveguide for Performance Improvement in Biochemical Sensor Application" Sensors 18, no. 3: 781. https://doi.org/10.3390/s18030781
APA StyleHong, Y.-S., Cho, C.-H., & Sung, H.-K. (2018). Design Parameter Optimization of a Silicon-Based Grating Waveguide for Performance Improvement in Biochemical Sensor Application. Sensors, 18(3), 781. https://doi.org/10.3390/s18030781