1. Introduction
The knowledge of the spatial distribution of airflow in complex geometries is essential for optimization in several technical applications. Due to the increasing computational power with advanced workstations, CFD (computational fluid dynamics) simulations have become popular to predict airflow conditions. Nevertheless, experimental evaluation is still inevitable. Especially for the case of porous media, there is little experimental verification for applications with complex geometries, e.g., a mixture of airflow in free space and porous media. The optimization of airflow in cooling applications for food products is an example with high economic importance, e.g., the cooling of agricultural produce in cold stores.
Rapid cooling of fresh horticultural produce after harvest is important to avoid quality loss before offering it to consumers. In forced-air precooling facilities and cool stores, the field and respiration heat of the produce is removed by circulation of cooled air. During initial cooling processes after harvest, produce is ventilated with higher flow rates compared to the following storage period when the set point temperature is achieved. The air speed and the temperature of the airflow affect not only the cooling rate of the produce but also their water status. High airflow increases undesirable water loss due to transpiration at the produce surface. This effect is especially important for fruit and vegetables with high surface permeability to water vapor [
1,
2]. Uniform air speed and temperature distribution in a produce stack are required to maintain homogenous quality. There is an increasing research interest in analyzing airflow conditions, heat and mass transfer in cooling facilities to derive appropriate layout and operation of storage and transport facilities and package design [
3,
4,
5,
6]. Flow conditions are very complex due to high variability of produce shapes, package geometry and arrangement of packages in transport and storage facilities. Airflow measurement techniques were applied according to specific conditions in cooling facilities or packages with only few verifications of the airflow inside porous media, i.e., between fruits.
To characterize airflow, the terms air speed and air velocity have to be differentiated. “Speed” is a scalar quantity that describes the change of rate of distance in time of an object in contrast to “velocity” describing a vector quantity expressing both magnitude and directions [
7]. The term “air speed” is used to characterize air movement with unknown direction. The most applied principle for measuring the speed or the velocity of air in industrial food cooling facilities is thermal anemometry.
Air velocity was measured with directional hot wire anemometers in gaps between pallets or bins in fruit and vegetable cold stores. Different flow directions were considered by changing the orientation of the sensors [
8,
9]. Omni-directional hot film anemometers were used for air speed measurements in cold stores, because of the unknown flow direction at the measuring points in gaps between product bins and above the bin stacks [
10,
11,
12]. Laguerre et al. [
13] measured the air velocity with hot wire anemometers in the homogenized airflow in a supply air duct and in the air curtain of a display cabinet for cooling food packages in retail. Hot wire anemometers are not suitable for complex situations with high fluctuations [
13] or airflow measurements inside packages or bulks because of the size of the probes up to 0.5 m length [
14]. Alvarez and Flick [
15] and Delele et al. [
16] studied air velocity and turbulence distribution inside vented bins for agricultural products with hot wire anemometer measurements. For fixing the rod-type sensor probe between synthetic spheres as produce dummies in a bin, it was inevitable to build a gap by removing some of the spheres or using a cylindrical frame for the sensor to avoid contact to the spheres. Concentration changes of tracer gases in moving air were also used for velocity determination in the surrounding of horticultural produce. Tanner et al. [
17] measured air velocity at different points in a ventilated package of horticultural products by analyzing the reduction of CO
2-concentration at different positions inside the package compared to the CO
2-concentration in the inlet stream. The air in the package was sampled with a pipe and conducted to a CO
2 gas analyzer. This method is limited by the possibility to place the pipe and not suitable for continuous measurement. To investigate airflow profiles more accurate techniques are available as laser Doppler anemometry (LDA) and particle image velocimetry (PIV). These methods allow determination of air velocity in the free space by analyzing tracer particle displacement [
14] at defined measuring points (LDA) or in a field (PIV). Moureh et al. [
18] used LDA for measurement of airflow in a reduced-scale model of a truck for food transport. The air velocity and fluctuations were measured above the pallets. This measurement technique requires space for influx of tracer particles and measuring positions accessible for the laser light beam. Therefore, measuring points can be chosen only in gaps or above the products but not inside packages or bulks. Air velocity fields were determined with PIV in the air curtain in front of a display cabinet [
13]. The measurement agreed well with measurements of a hot wire anemometer in zones of uncomplex flow conditions at the internal side of the curtain. In zones with rapid velocity fluctuations the punctual measurements of the hot wire anemometers showed discrepancies to the air velocity fields recorded by PIV. Ferruah et al. [
19] studied velocity fields with PIV in different horizontal planes of a transparent model of a typical retail clamshell filled with synthetic spheres. Similar to the LDA method, the PIV technique captures air velocity only in space, which is accessible to laser light. A widely applied method for indirect estimation of airflow inside packages or produce stacks is the determination of the convective heat transfer coefficient (CHTC) with aluminum or brass heating spheres equipped with a thermocouple and surrounded by synthetic spheres to minimize the influence by conduction or radiation between the heating sphere and the surrounding area. The CHTC is calculated from the relation of time and temperature decrease of the sphere [
8,
18,
20]. Studies with heated spheres for CHTC determination were carried out in produce stacks and in packages with regular arrangement of produce dummies in the surrounding of the measurement device.
The objective of this study was to develop a sensor for measuring air speed between horticultural produce in bulks and storage bins with random stacking of the products. It is envisaged that such measuring system would be applicable in industrial field tests as well as allow continuous measurement to record adaptation of air speed next to the produce with changing airflow conditions in cold stores. The air speed measurement should be omnidirectional as the airflow direction in the hollow space of a bulk is unknown and not relevant for the presented application. The measuring system itself should affect the speed values as minimal as possible. It should be able to record low air speed values below 1 m/s. To our knowledge, there is no system available for measurement of air speed distribution inside a bulk or a bin with random produce stacking. The estimation of local airflow by preheated spheres does not allow real time measurement and capture of air speed fluctuations.
In this work, the construction and calibration of a new airflow sensing system is described. The new device was tested for airflow measurement between fruit dummies in a wind tunnel at laboratory scale and between fruit in an apple bin in a commercial storage room.
2. Structure of the Airflow Measuring Device
The airflow speed logger (ASL) consists of four hollow transparent spheres made of polystyrene (thickness 1.5 mm). Each of the spheres has a diameter of 80 millimeters. Using screws, the spheres are mounted together in the form of a triangular pyramid similar to how they would arrange themselves when closely packed in a bulk of fruit with similar shapes and sizes (
Figure 1).
At the central position in the space between the spheres, a silicon diode is attached by four wires. This diode is the main sensor element. Within the gaps between the three spheres of each of the four pyramidal faces, four further diodes are fixed with wires acting as reference diodes. These four diodes are connected electrically in series (
Figure 1 and
Figure 2).
Beside the diodes acting as airflow and temperature sensor elements, the self-contained device is equipped with electronic components that are necessary for running the measuring system. Two batteries are placed inside one of the four spheres. The electronic circuity is located in one of the adjacent spheres (
Figure 3). A printed circuit board (PCB) contains an analog part (8), a microcontroller with A/D converter (5), a USB port (1) for data transfer, a non-volatile data memory (ferro electric RAM (FRAM)) (6), a real time clock chip (7), several DC-DC converters (4), and a charging circuitry (2) for the two lithium polymer batteries (3.3 V/900 mAh) (3) (
Figure 4).
3. Measuring Principle
The measurements are based on the calorimetric principle operating in CTD (Constant Temperature Difference) mode. This principle has the advantage of a nearly omnidirectional sensitivity for the airflow. Furthermore, the CTD mode causes the sensitivity to decrease while air speed increases resulting in a wide dynamic range. The measuring principle is based on cooling by the airflow of an electrically heated element (central diode) serving simultaneously as heater and as temperature sensor. The four unheated reference diodes, which are exposed to the airflow simultaneously, are used for determining the difference between the temperatures of the heated diode and ambience as needed for the CTD method. The central diode is heated by a controlled DC current and cooled by heat transfer loss caused by the airflow. Every 100 ms, the heating DC current is interrupted for 2 ms. During this period of 2 ms, small measuring current flows through the diode to measure the voltage drop across the diode chip which is linear proportional to the temperature. Measurement current also flows through the four reference diodes connected in series. The voltage drop across these diodes is linear proportional to the ambient temperature and can therefore be used to measure this temperature.
Figure 5 shows the simplified diagram of the analog loop-controlled system which is made to adjust the heating current (1) in such a way that the temperature difference between heated and unheated diodes remains at a constant level independent of the ambient temperature. Therefore, a measuring clock (6) is generated by the microcontroller to intermittently switch on and off the heating current (1) and to control the sampling switches (4) for the voltage measurement. Every 100 ms, the current is interrupted and measuring current flows through the heated diode (12) as well as the reference diodes (13). A differential amplifier amplifies the weighted voltage difference between the diodes. Its output voltage is proportional to the temperature difference between heated and unheated diodes. A second differential amplifier (7) compares this voltage difference with a preset voltage and an integrator (8) integrates the voltage variance to control the heating current source (1). A third differential amplifier (11) subtracts an offset (10) such that there is nearly zero voltage at the output when air speed is set to zero. The present heating current in the balanced loop is directly proportional to the airflow speed of the cooling air passing the central diode. The OUT signal (
Figure 5) is led to the A/D converter input of the microcontroller, to be digitized and stored. The microcontroller is controlling the whole system. The data are stored (recorded) every second together with the ambient temperature data and the clock cycle. After completion of the measurements, the recorded data have to be transferred to a PC via the USB port. The lithium polymer batteries for supplying the measurement unit are also charged from the USB port. The capacity of the battery and the data memory is adequate for the sensing system to record continuously up to 28 h. The measurement may be interrupted up to 99 times along a variable period before continuation of operation.
4. Calibration of the Sensor
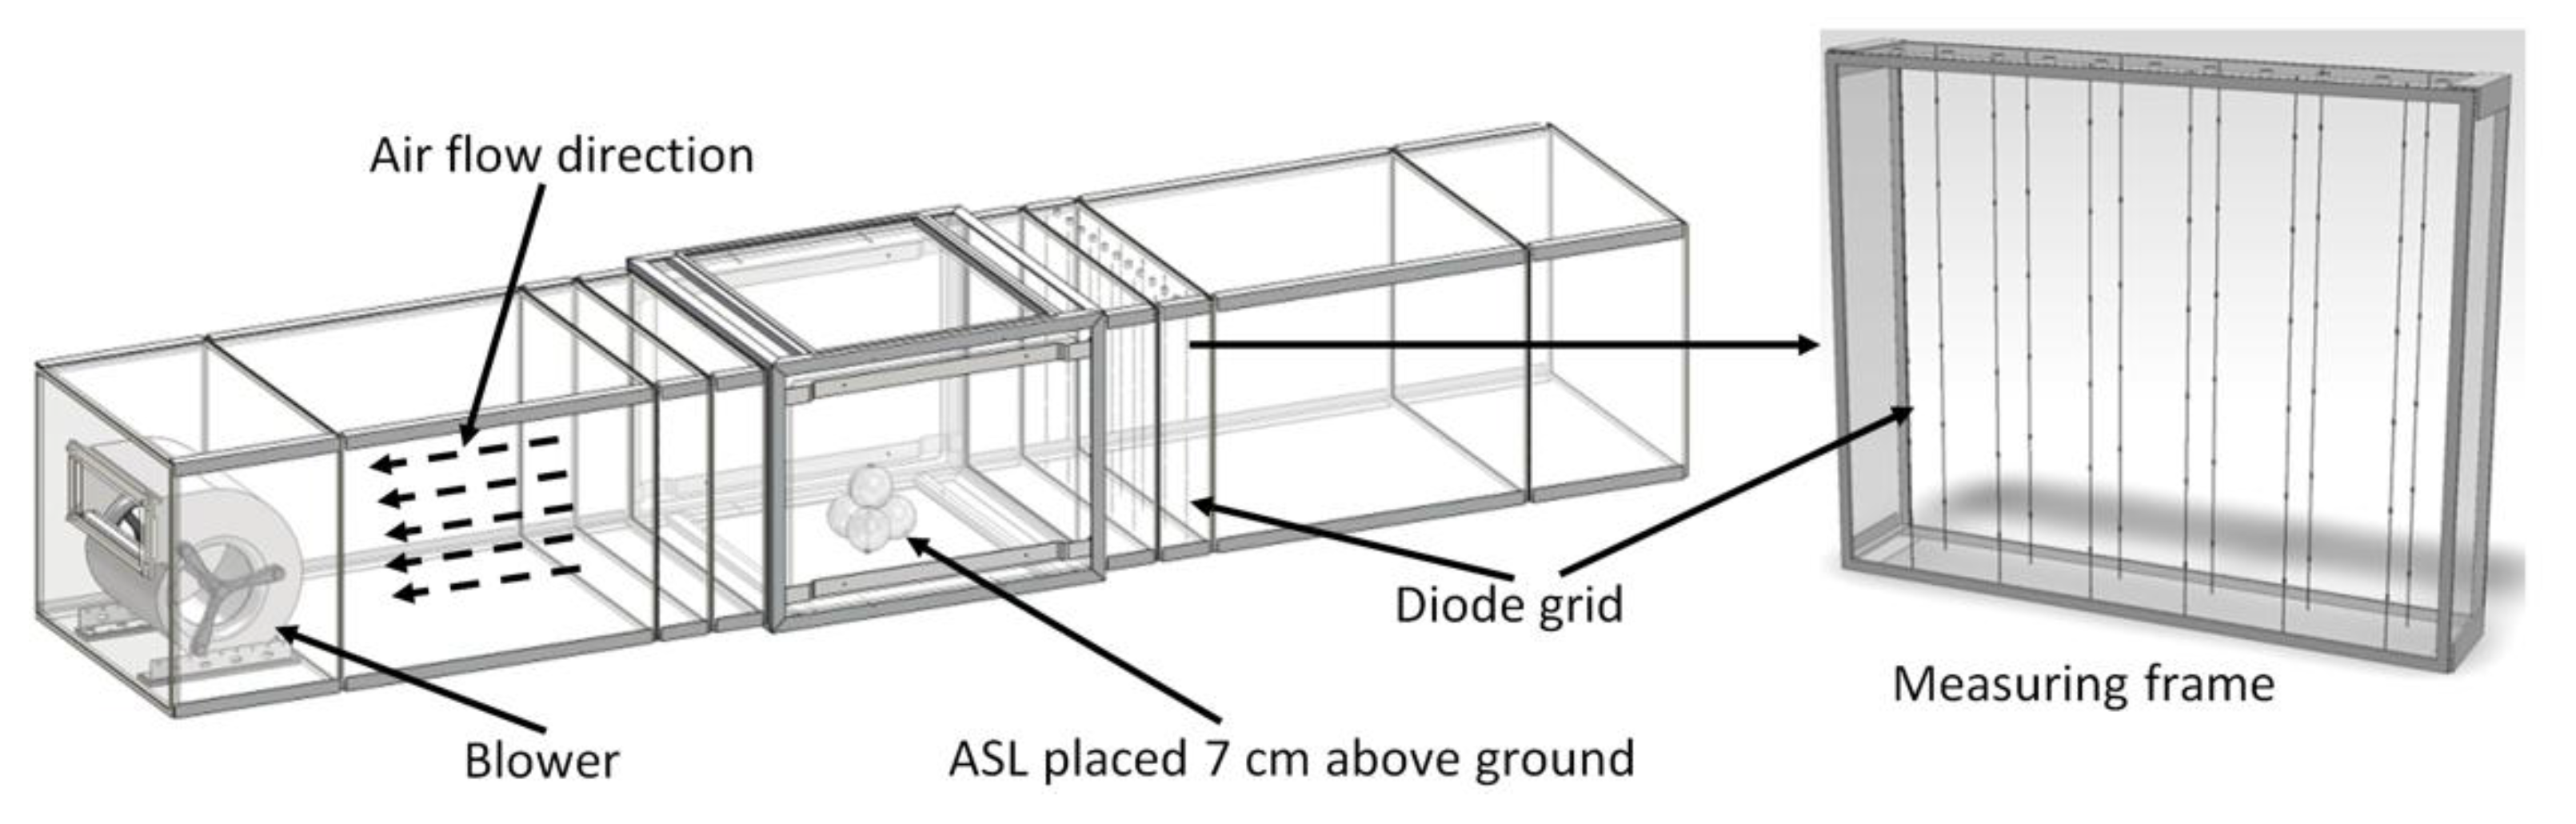
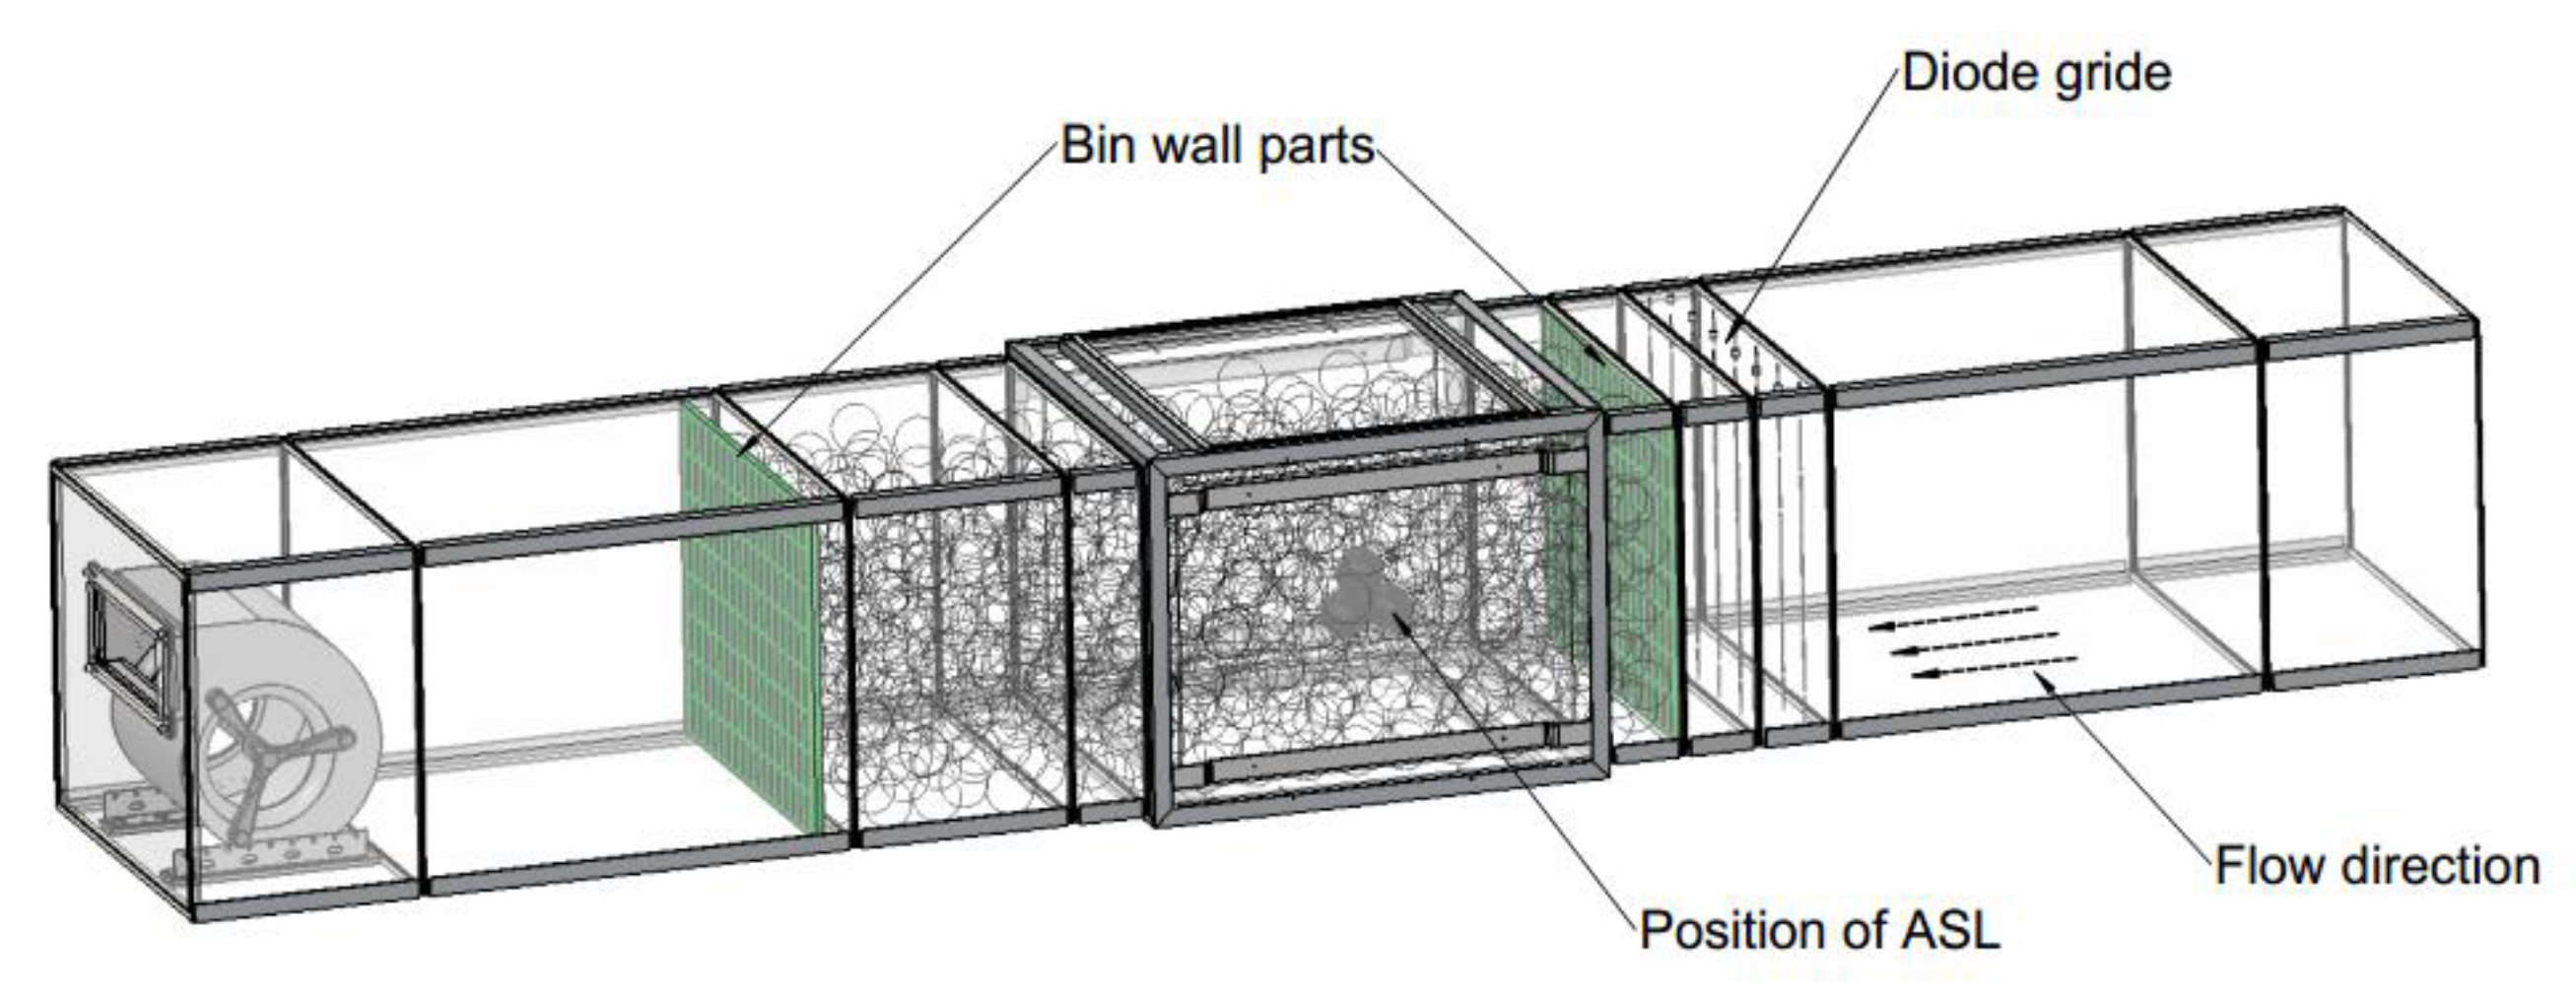
The calibration of the measuring device was performed in a laboratory sized wind tunnel of 3.3 m length and sectional area of 550 mm × 450 mm with walls made of acrylic glass. The airflow in the tunnel was generated by a continuously adjustable cross-flow blower (type D340/E1, Fischbach, Luft- und Ventilatorentechnik GmbH, Neunkirchen, Germany). The ASL was placed centric between the side walls on a platform at a height of 7 cm above the ground of the tunnel (
Figure 6).
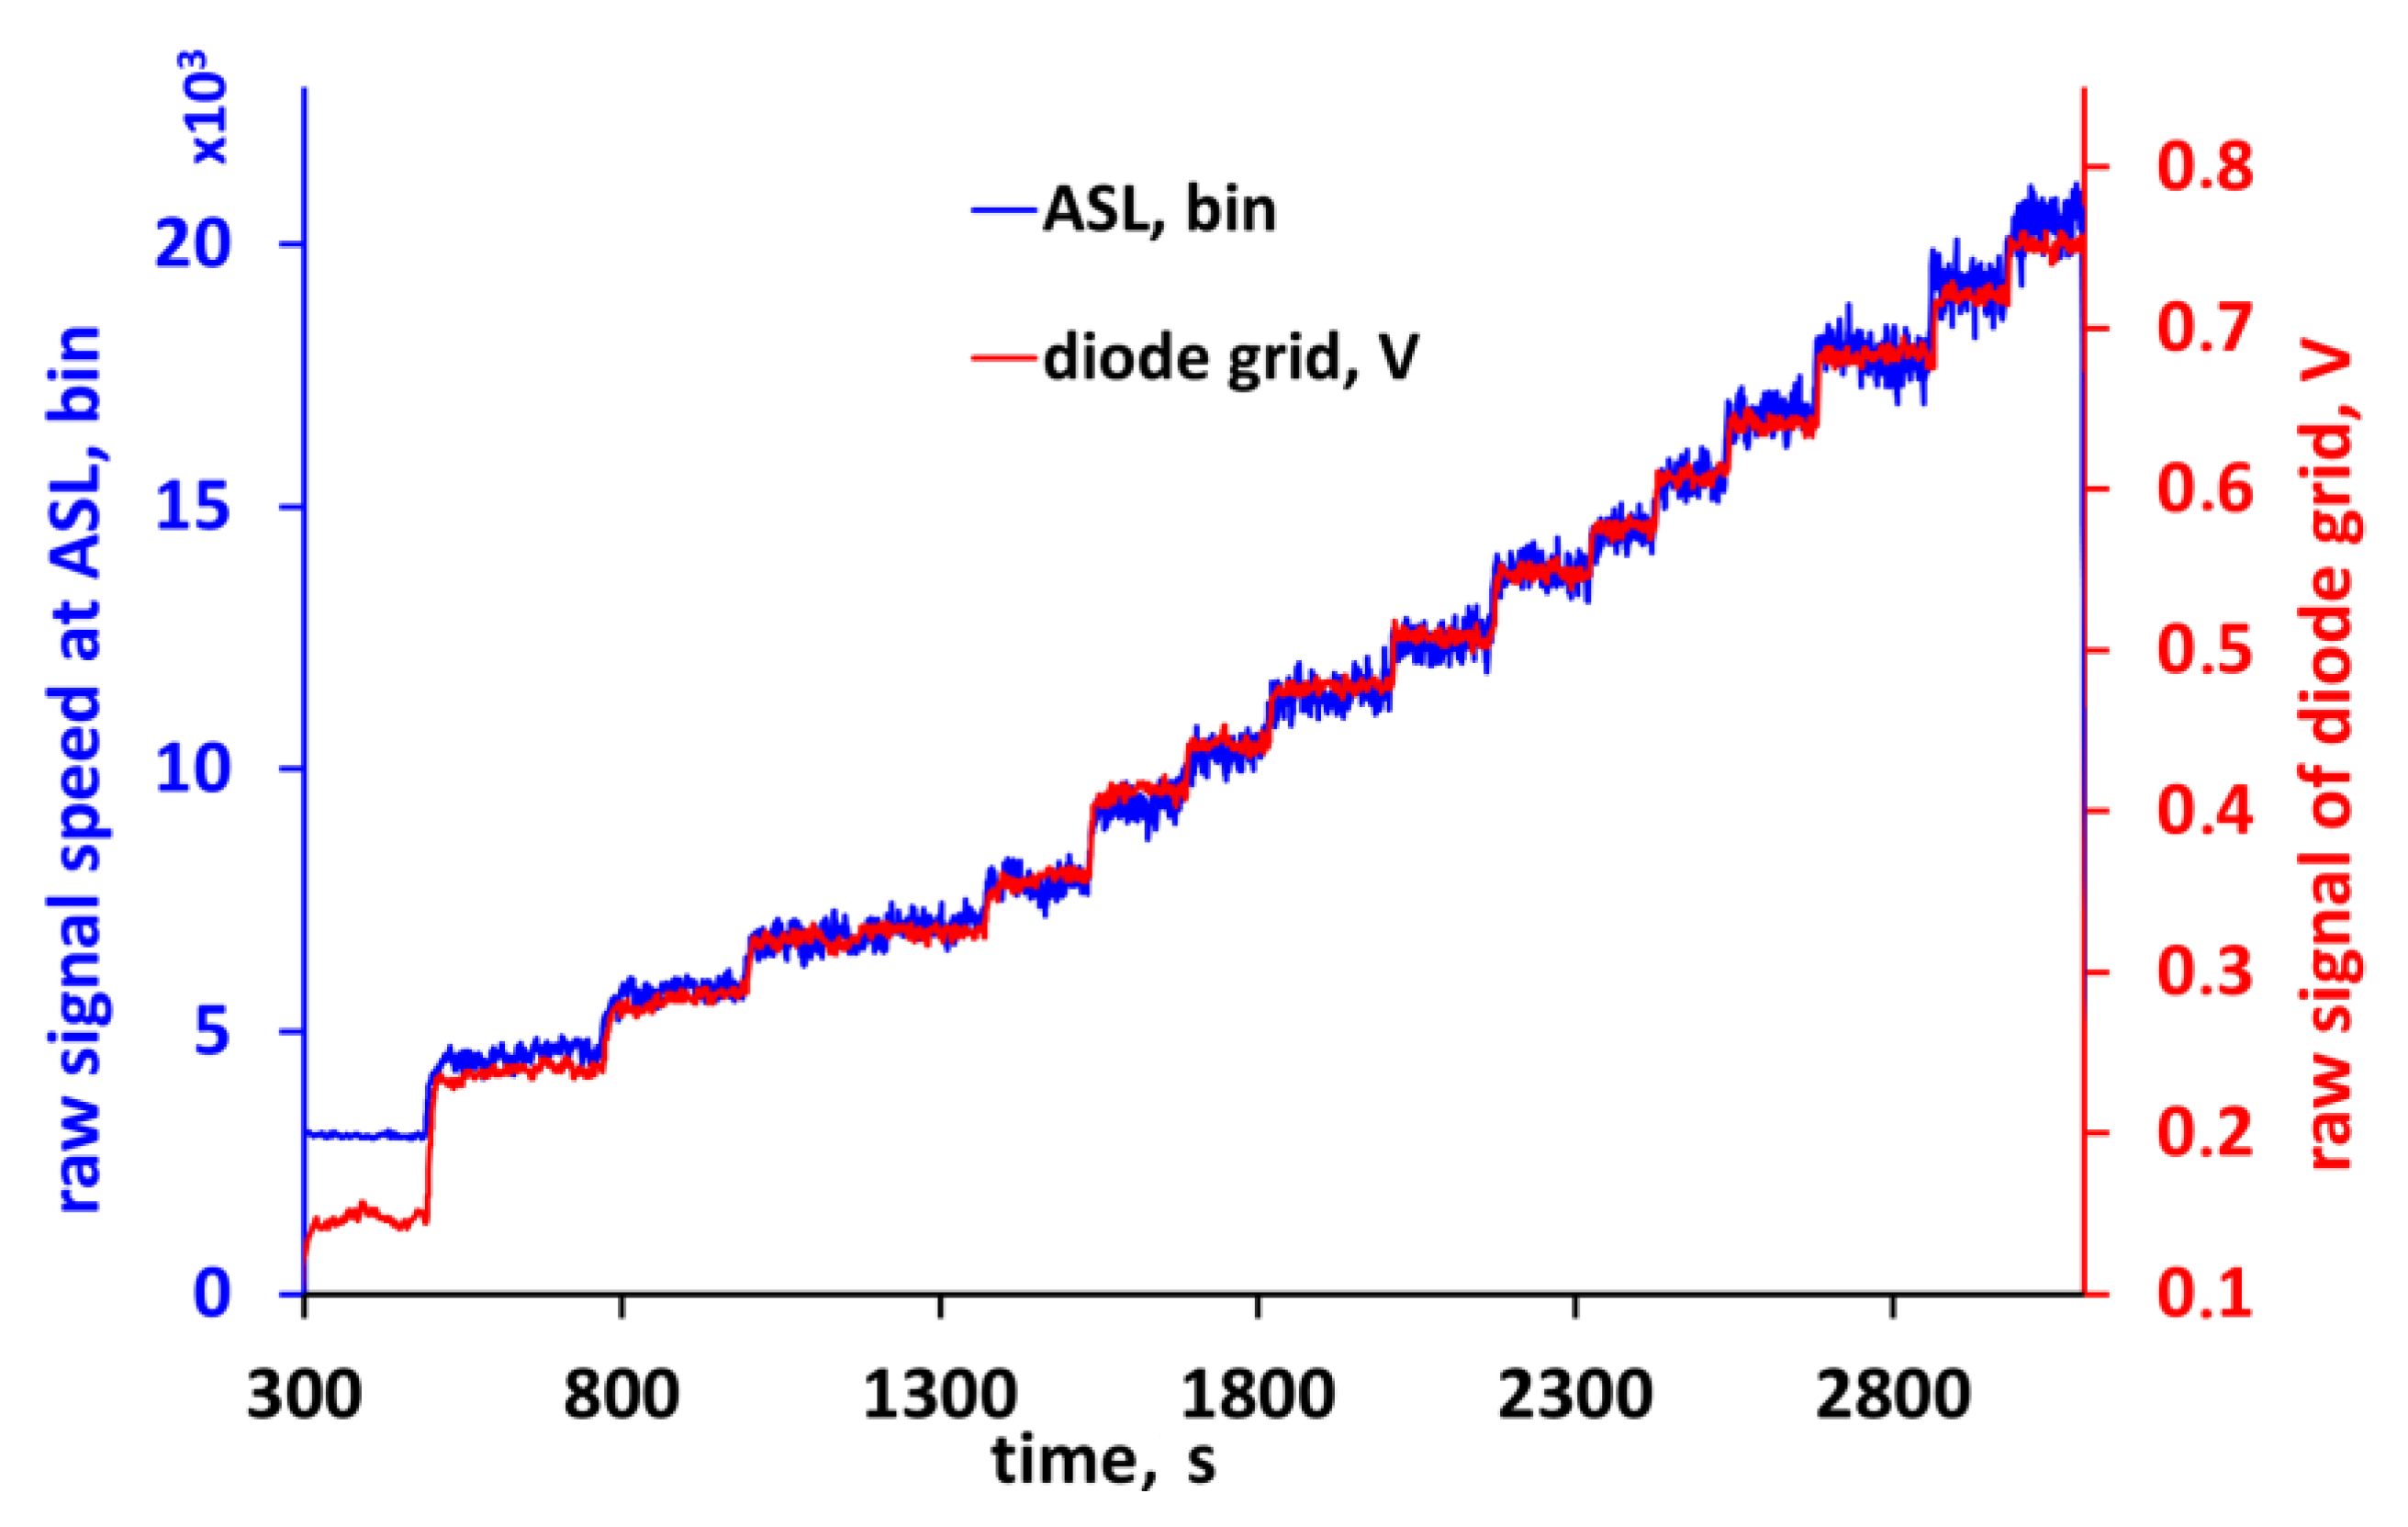
The aim of the calibration was to calibrate the ASL to the air speed present at the location of the heated diode in the center of the ASL, which is equivalent to the gap between apples arranged similar to the plastic spheres. Therefore, the reference sensor used for the calibration was placed temporarily at the same spot. Neither the geometry of the wind tunnel nor the orientation of the ASL could influence the result of the calibration as long as it was possible to repeatedly reach a time invariant airflow at this spot. A thermal anemometer (Velocity transducer model 8465, TSI Inc., St. Paul, MN, USA, accuracy ±0.5% of full scale of selected range) was used as reference sensor with a measuring range of 0–5 m/s. This special device has the advantage of using a very small sensor probe that can simply be placed very near to the diode of the ASL. The ASL and the reference sensor are working according to the calorimetric principle. Therefore, both the diode of the ASL as well as the sensor head of the thermal anemometer are sensitive to local heating sources. To avoid interferences between both sensors acting at nearly the same location, they had to be used consecutively. First a set of increasing air speed steps was measured with the reference sensor, while the ASL was switched off. In a second part, the ASL had to record raw data in the same range of air speed data while the reference sensor was switched off (
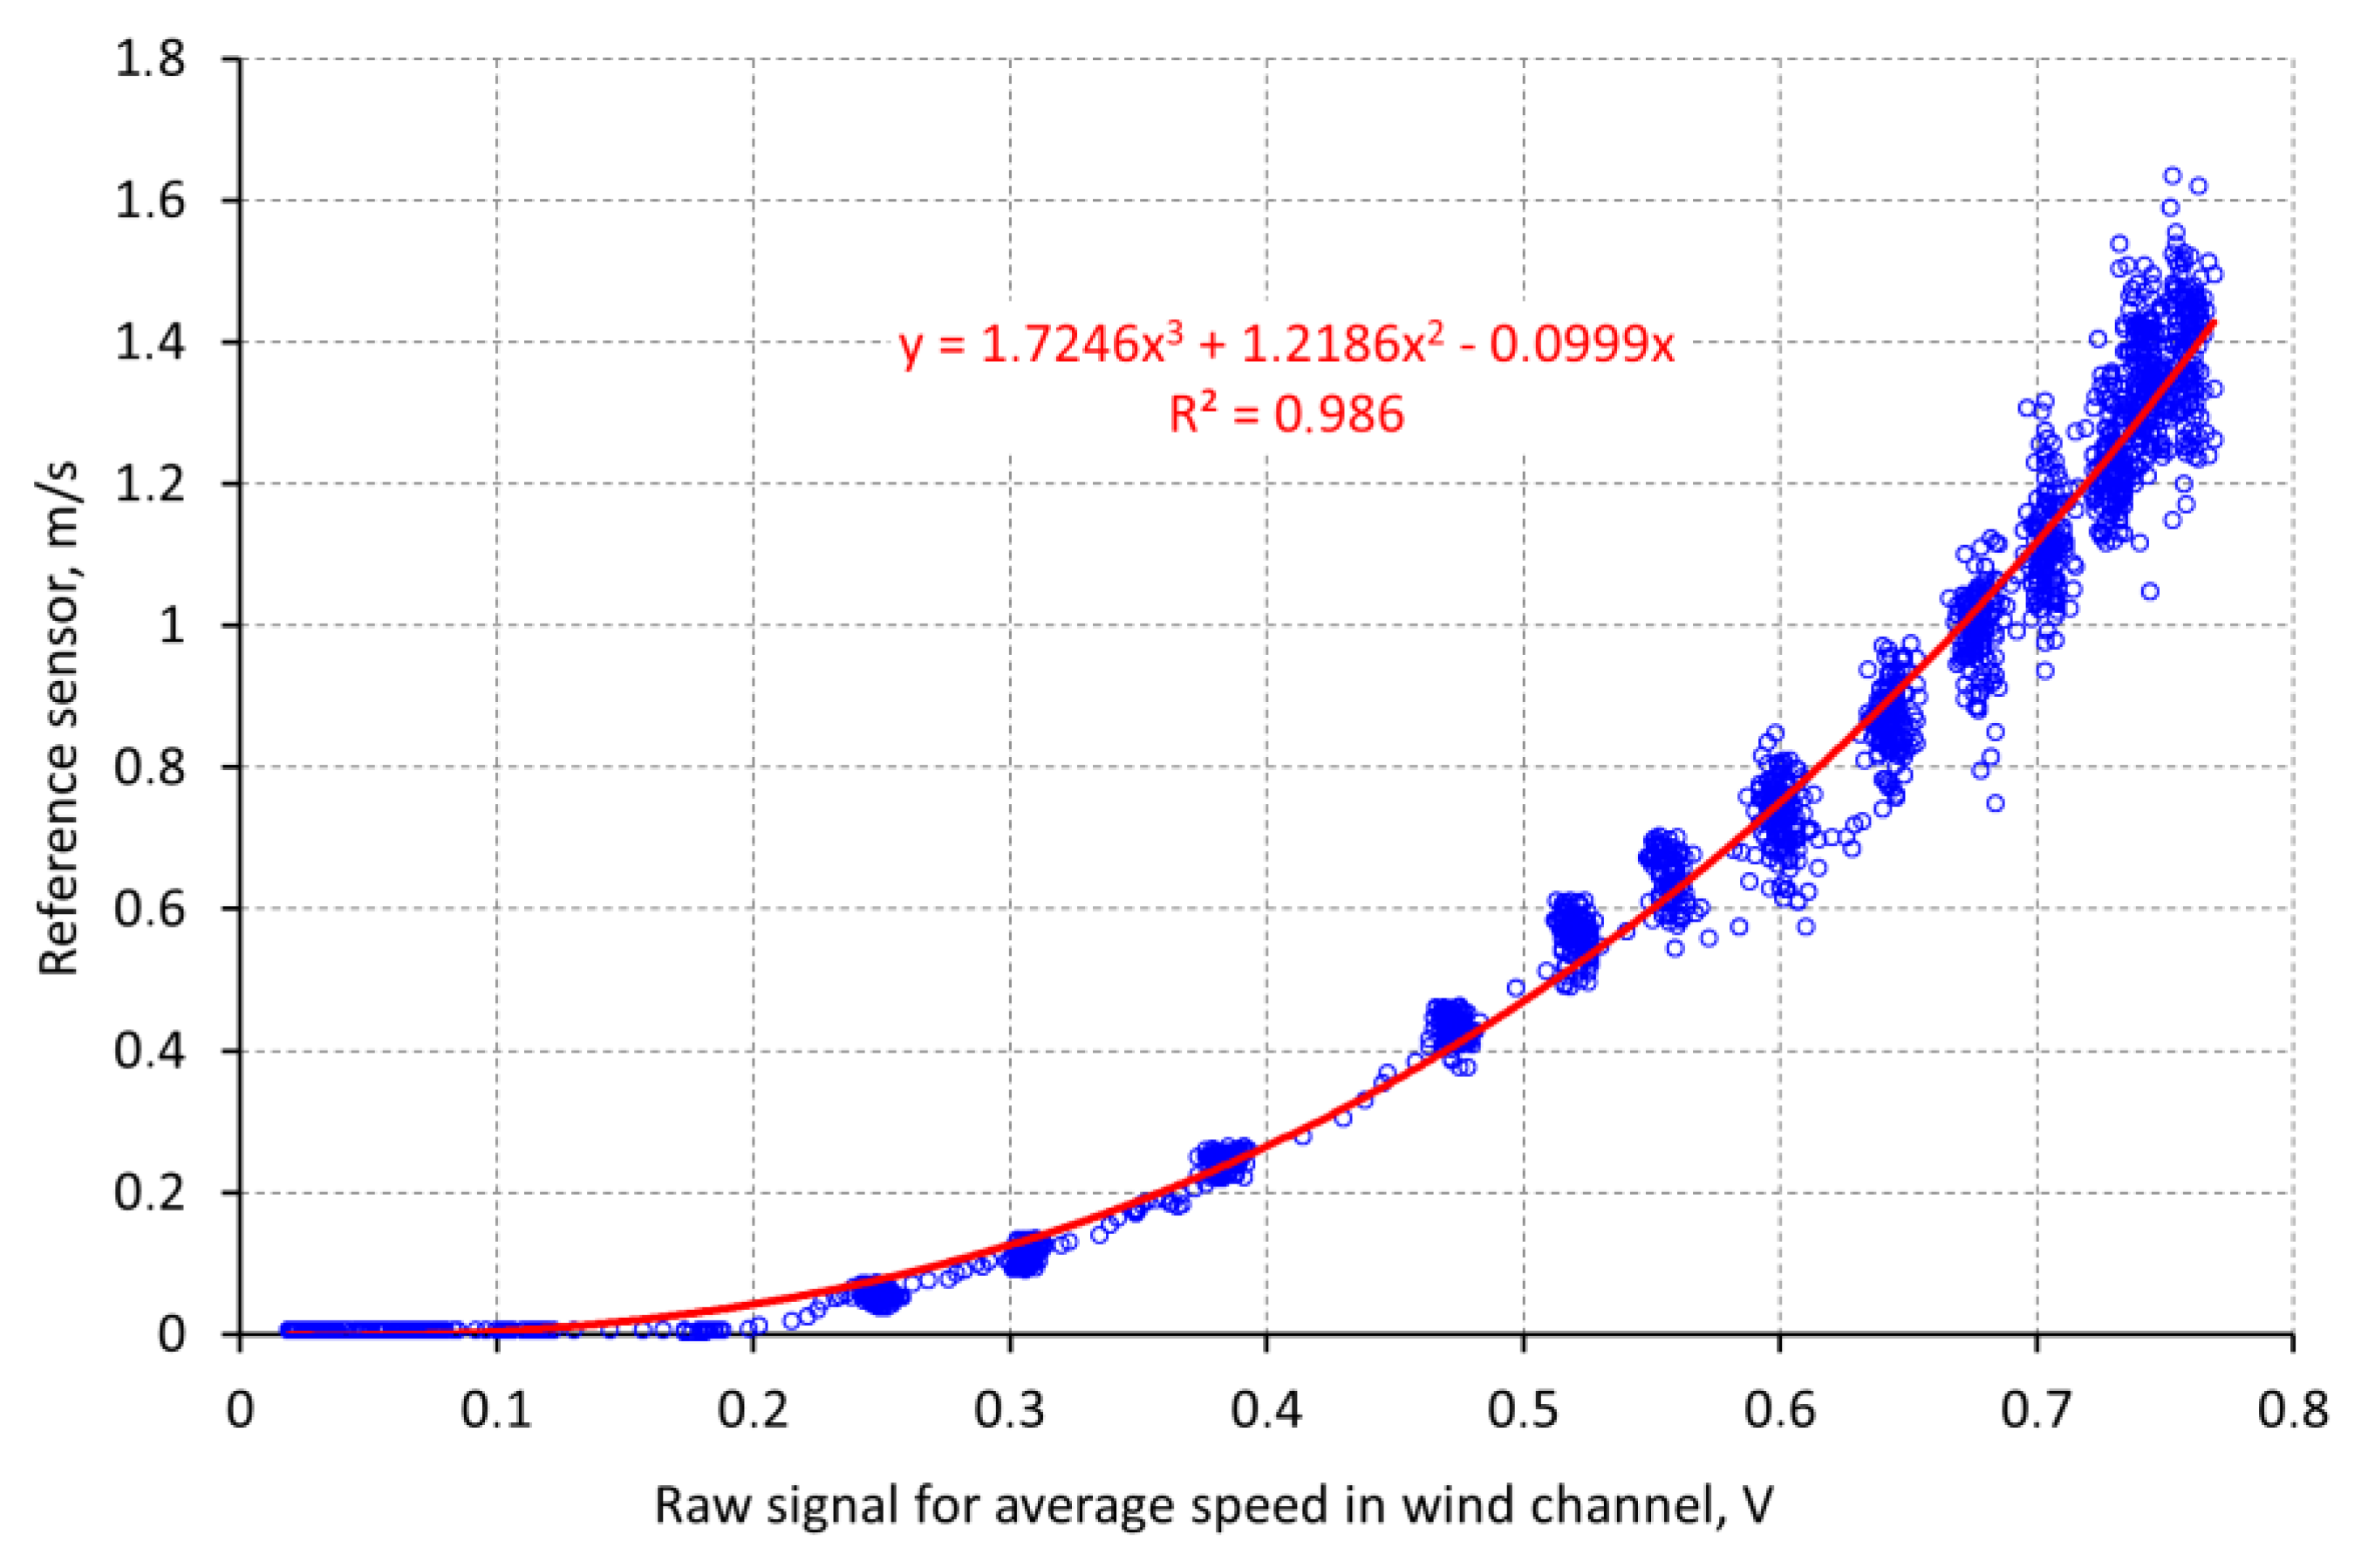
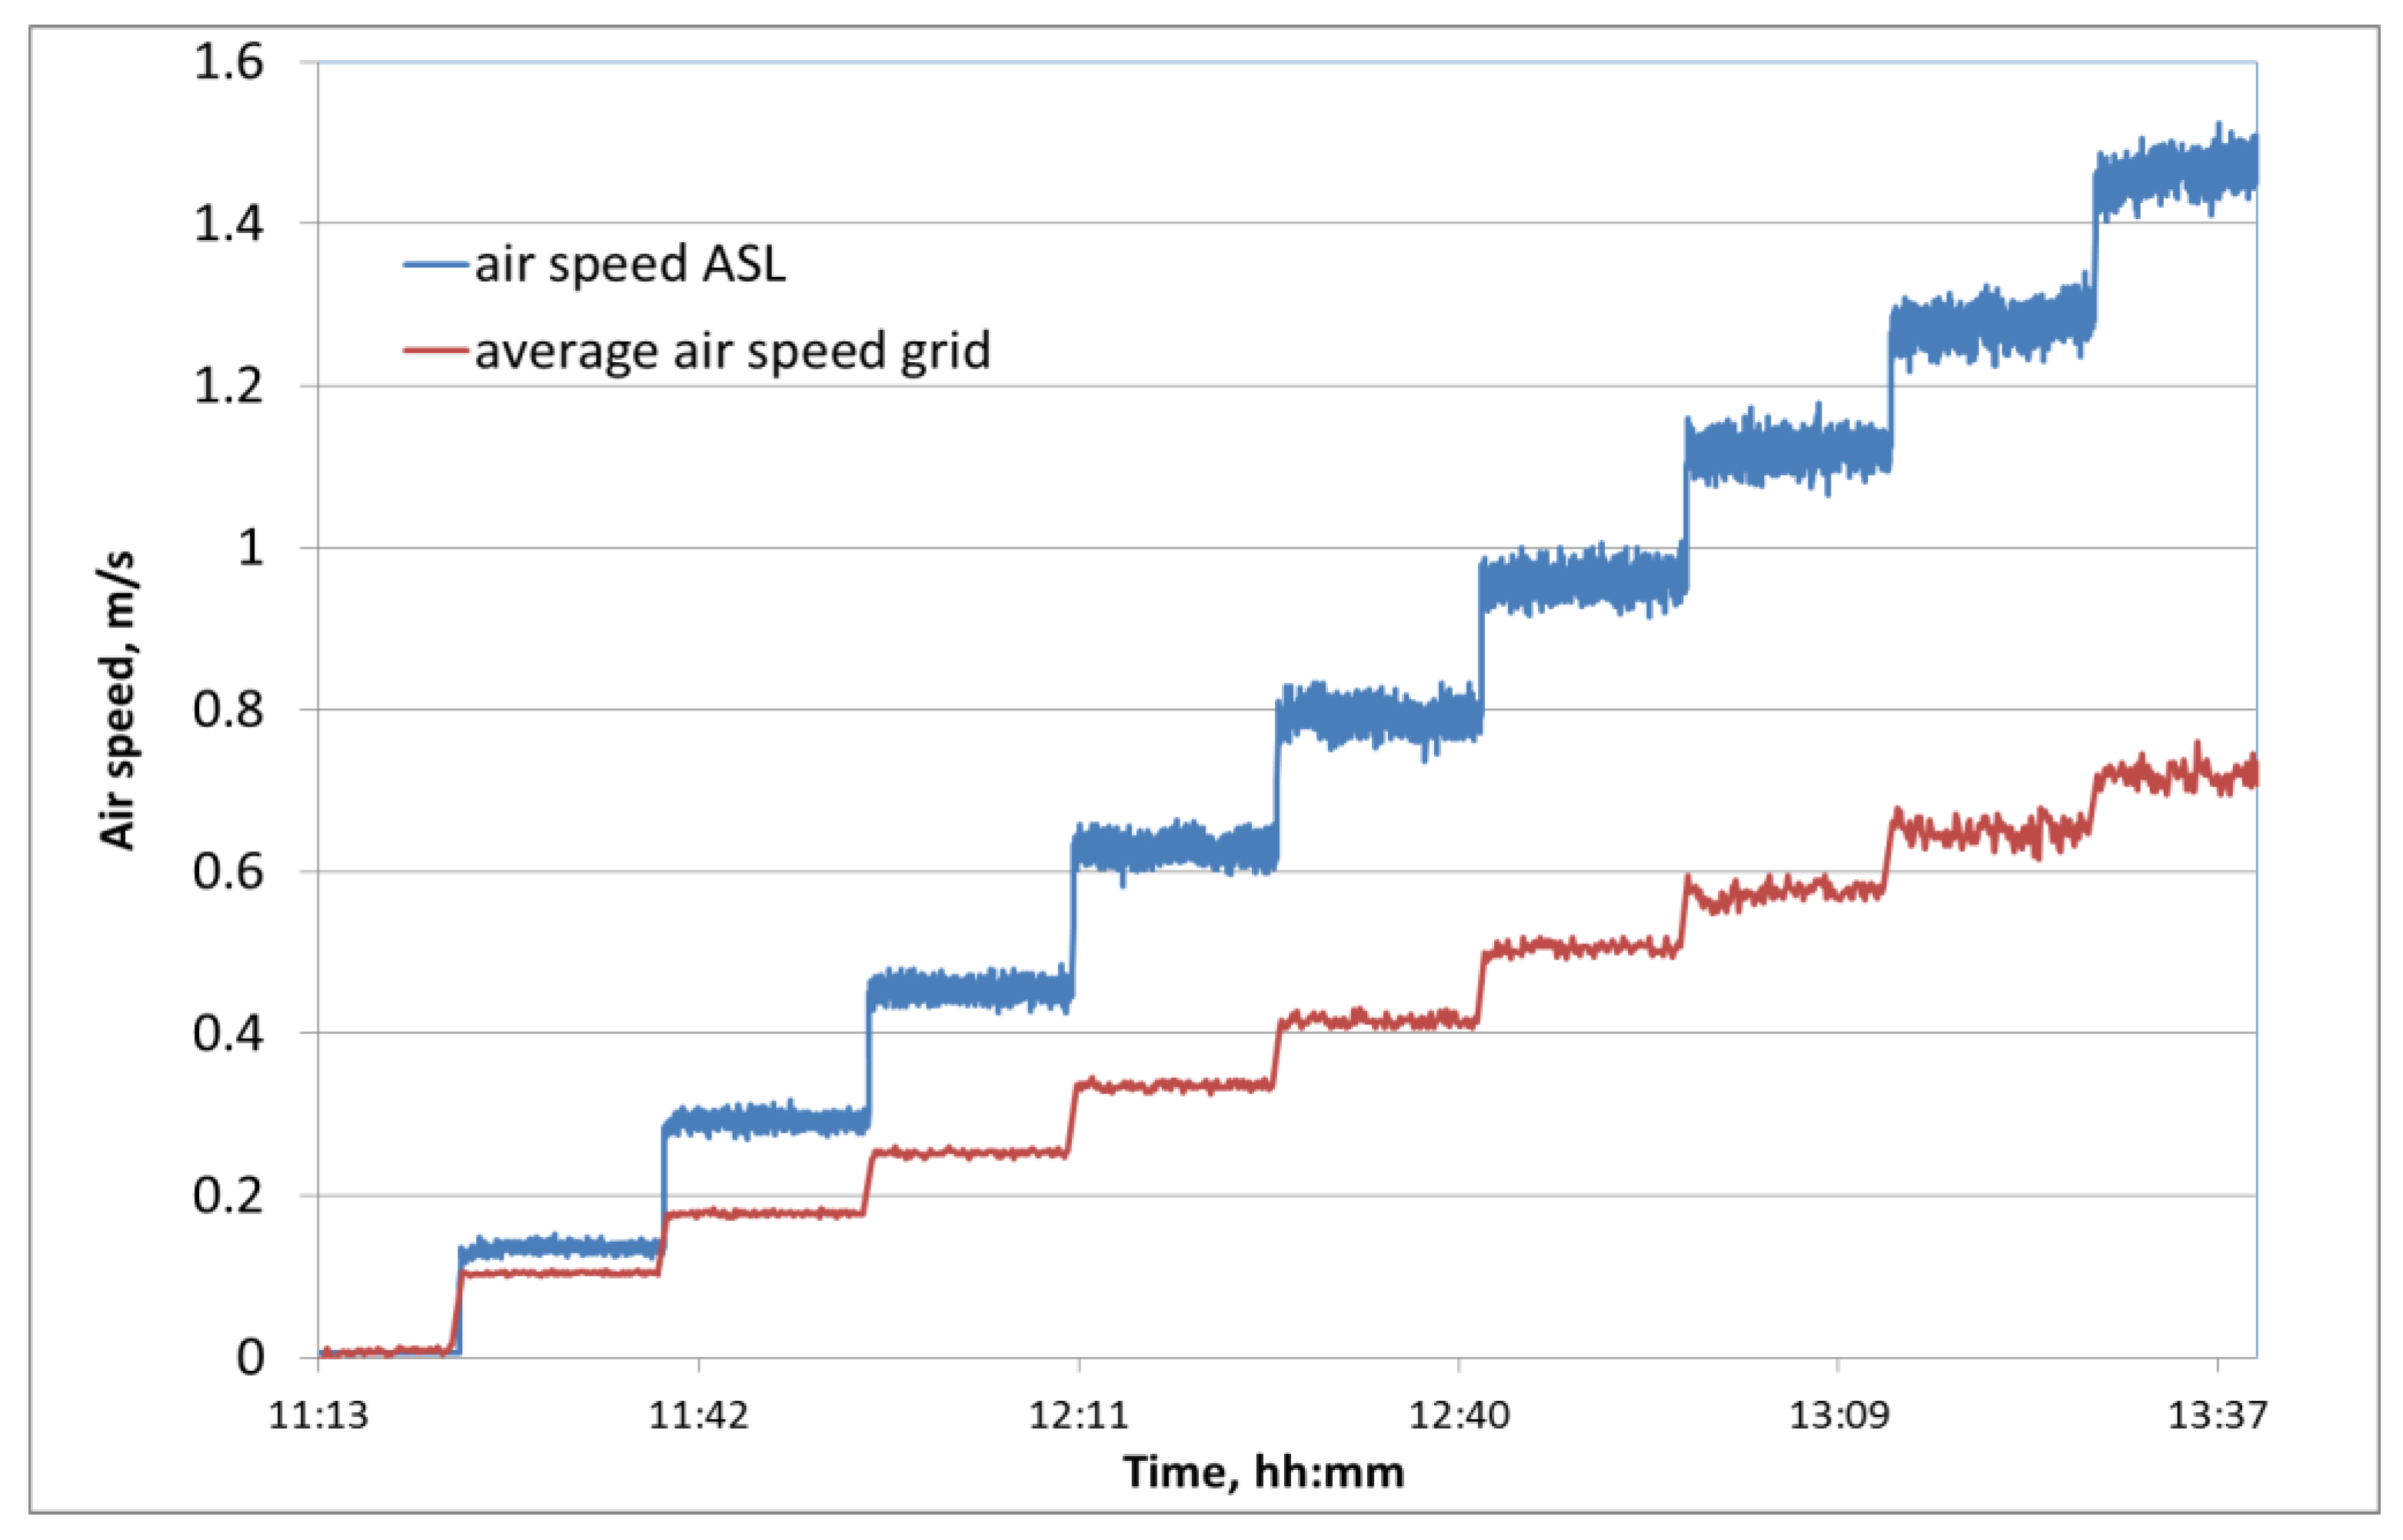
Figure 7). Airflow generation is controlled only by changing the voltage of the blower. An additional sensor was needed to ensure that the air speed in the wind tunnel during the recording of the reference data is comparable to the air speed present while recording the data with the ASL. A grid of 2 × 16 diodes interconnected with thin wires was mounted at a measuring frame in the tunnel (
Figure 6). This grid of diodes was used for monitoring the average air speed within the cross-section of the tunnel by means of the same measuring principle as for the ASL. As a result of the first calibration part a correlation function was calculated for the relation between the raw data of the diode grid and the real air speed locally measured with the reference sensor (
Figure 7).
Since the reference sensor does not measure air speed values below 0.1 m/s, the range from 0 to 0.1 m/s is extrapolated using the function that was fitted to the measured data. It was done in that way, because the data above 0.1 m/s are reliable and the point of origin is known. We can assume that the calibration function is a steady one without any discontinuities.
During the second part of the calibration procedure the raw data of the diode grid were recorded (
Figure 8). Due to the nonlinearity of the diode grid at very low air speed, there is a difference at the first step. Since the diode grid is used in both parts of the calibration, this effect does not affect the result. Using the function in
Figure 7, in a next step, the raw data of the diode grid were converted into real air speed data at the location of the diode in the ASL.
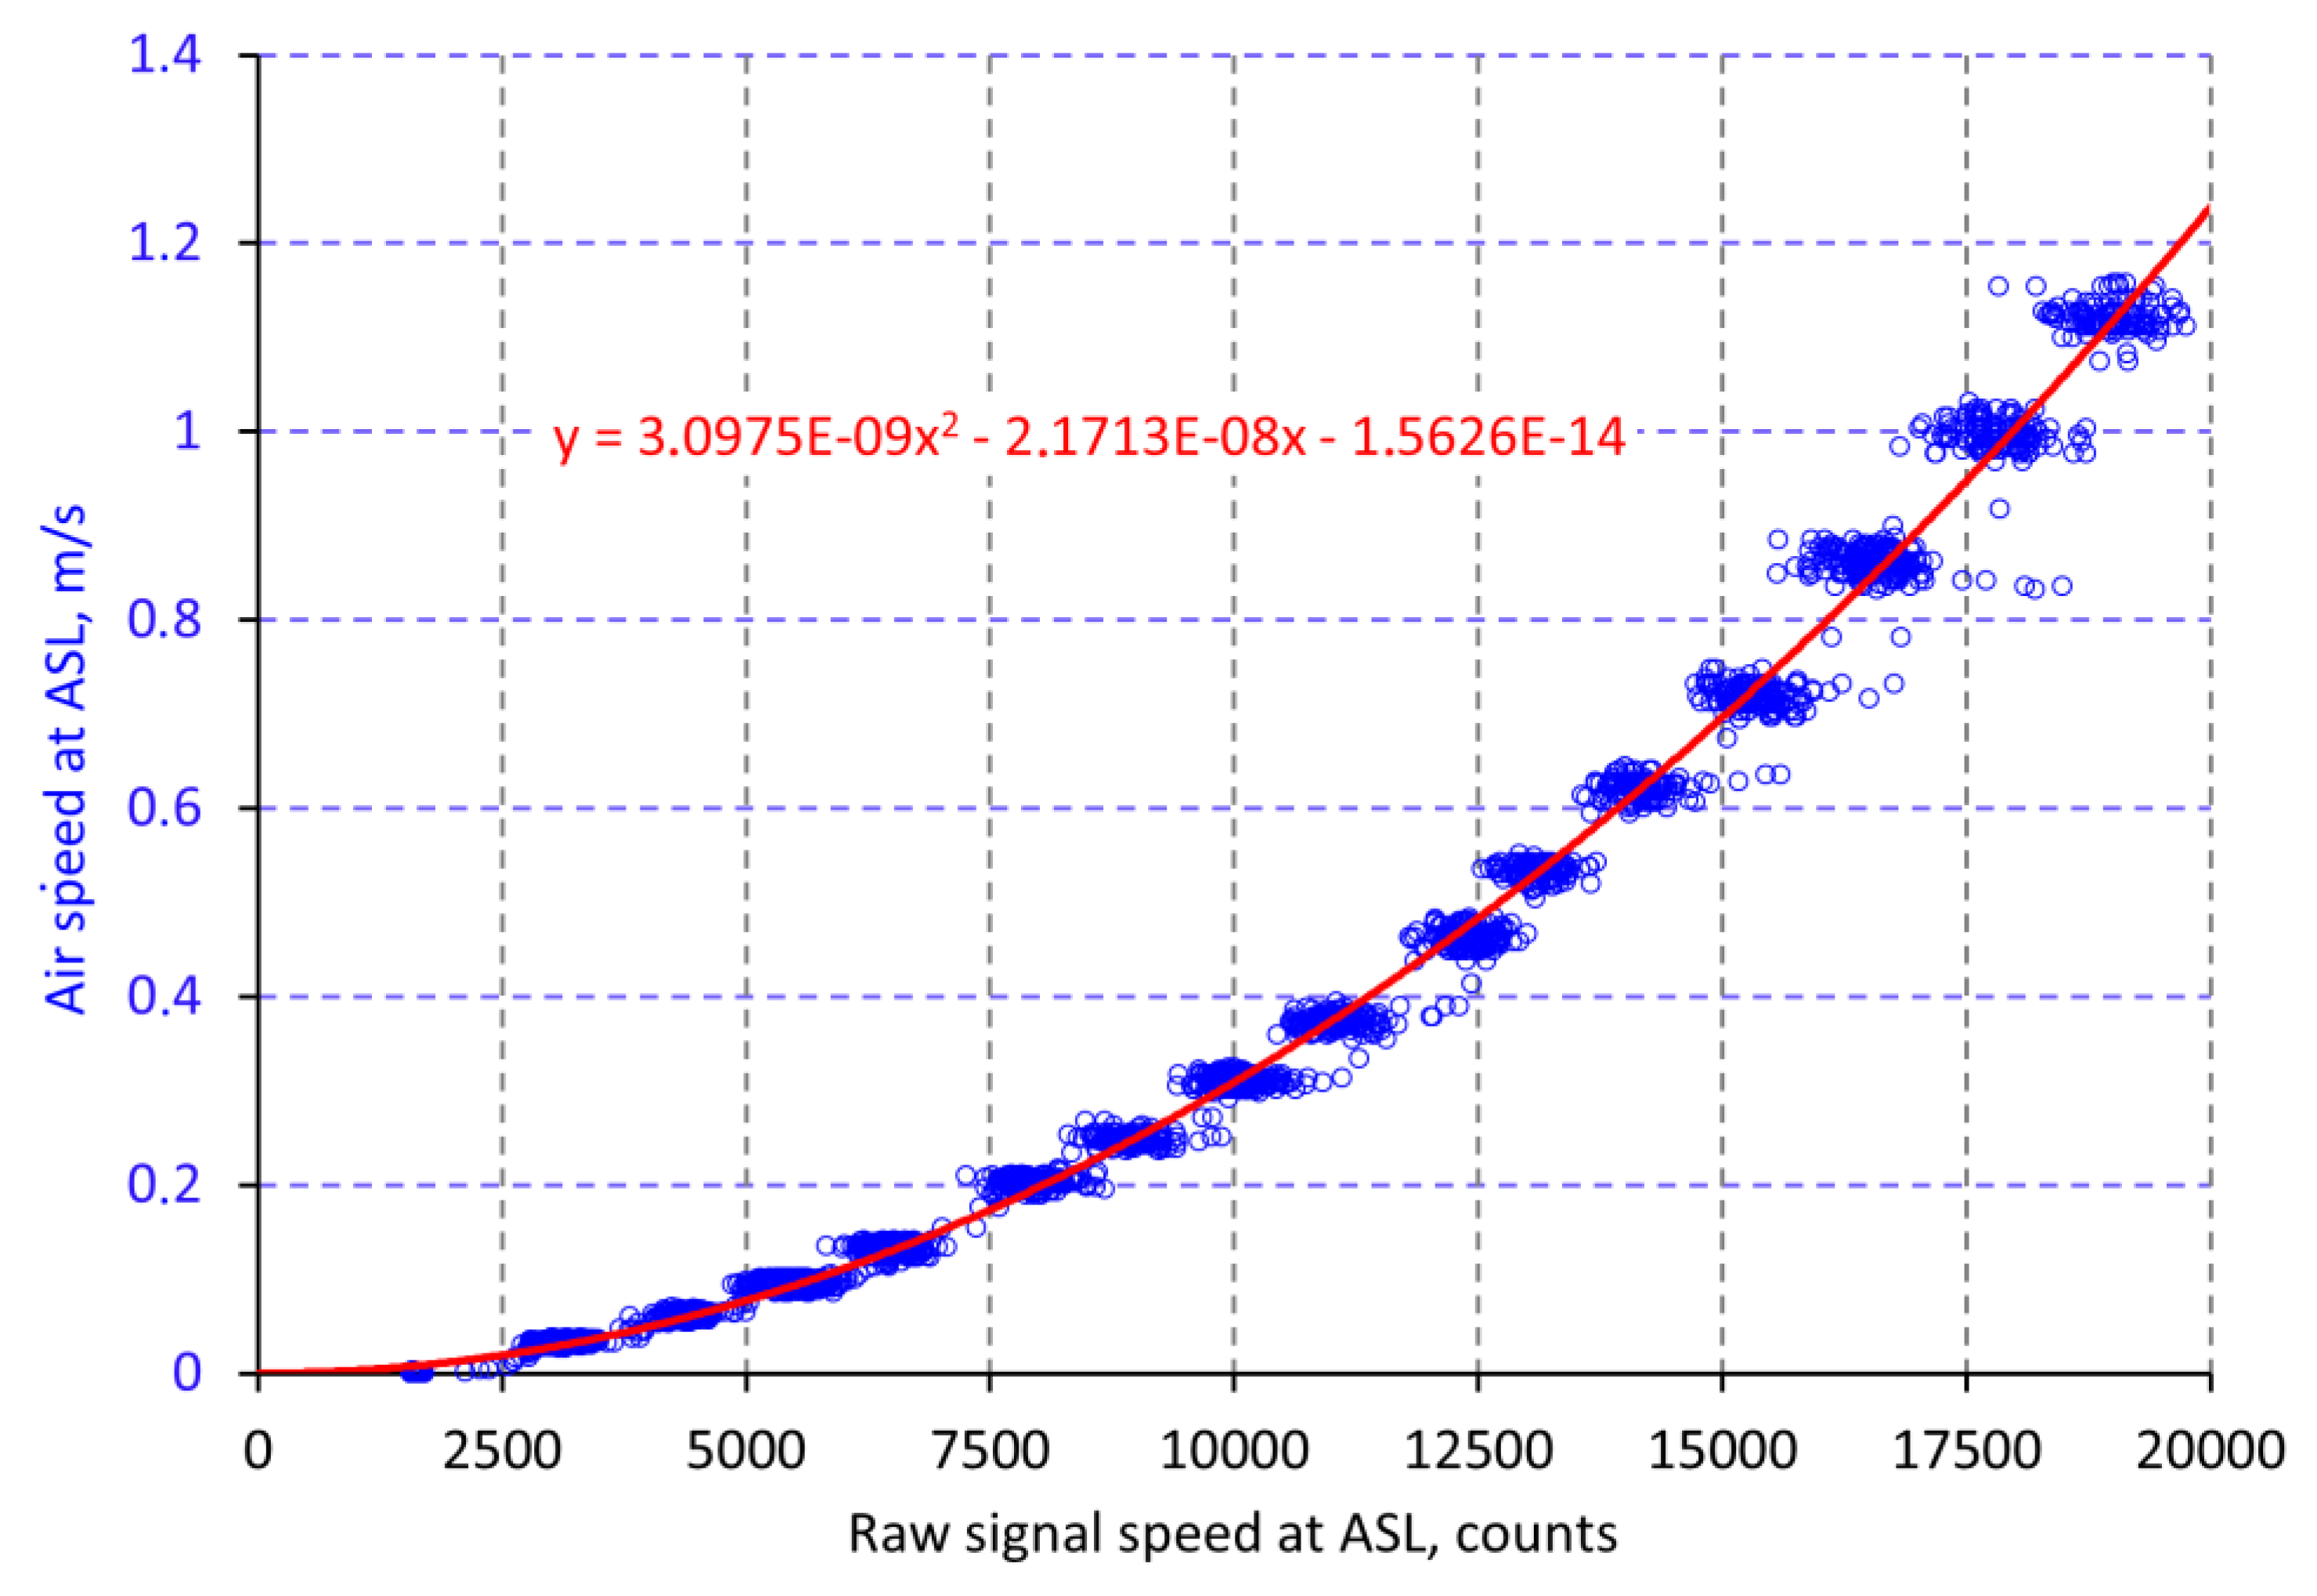
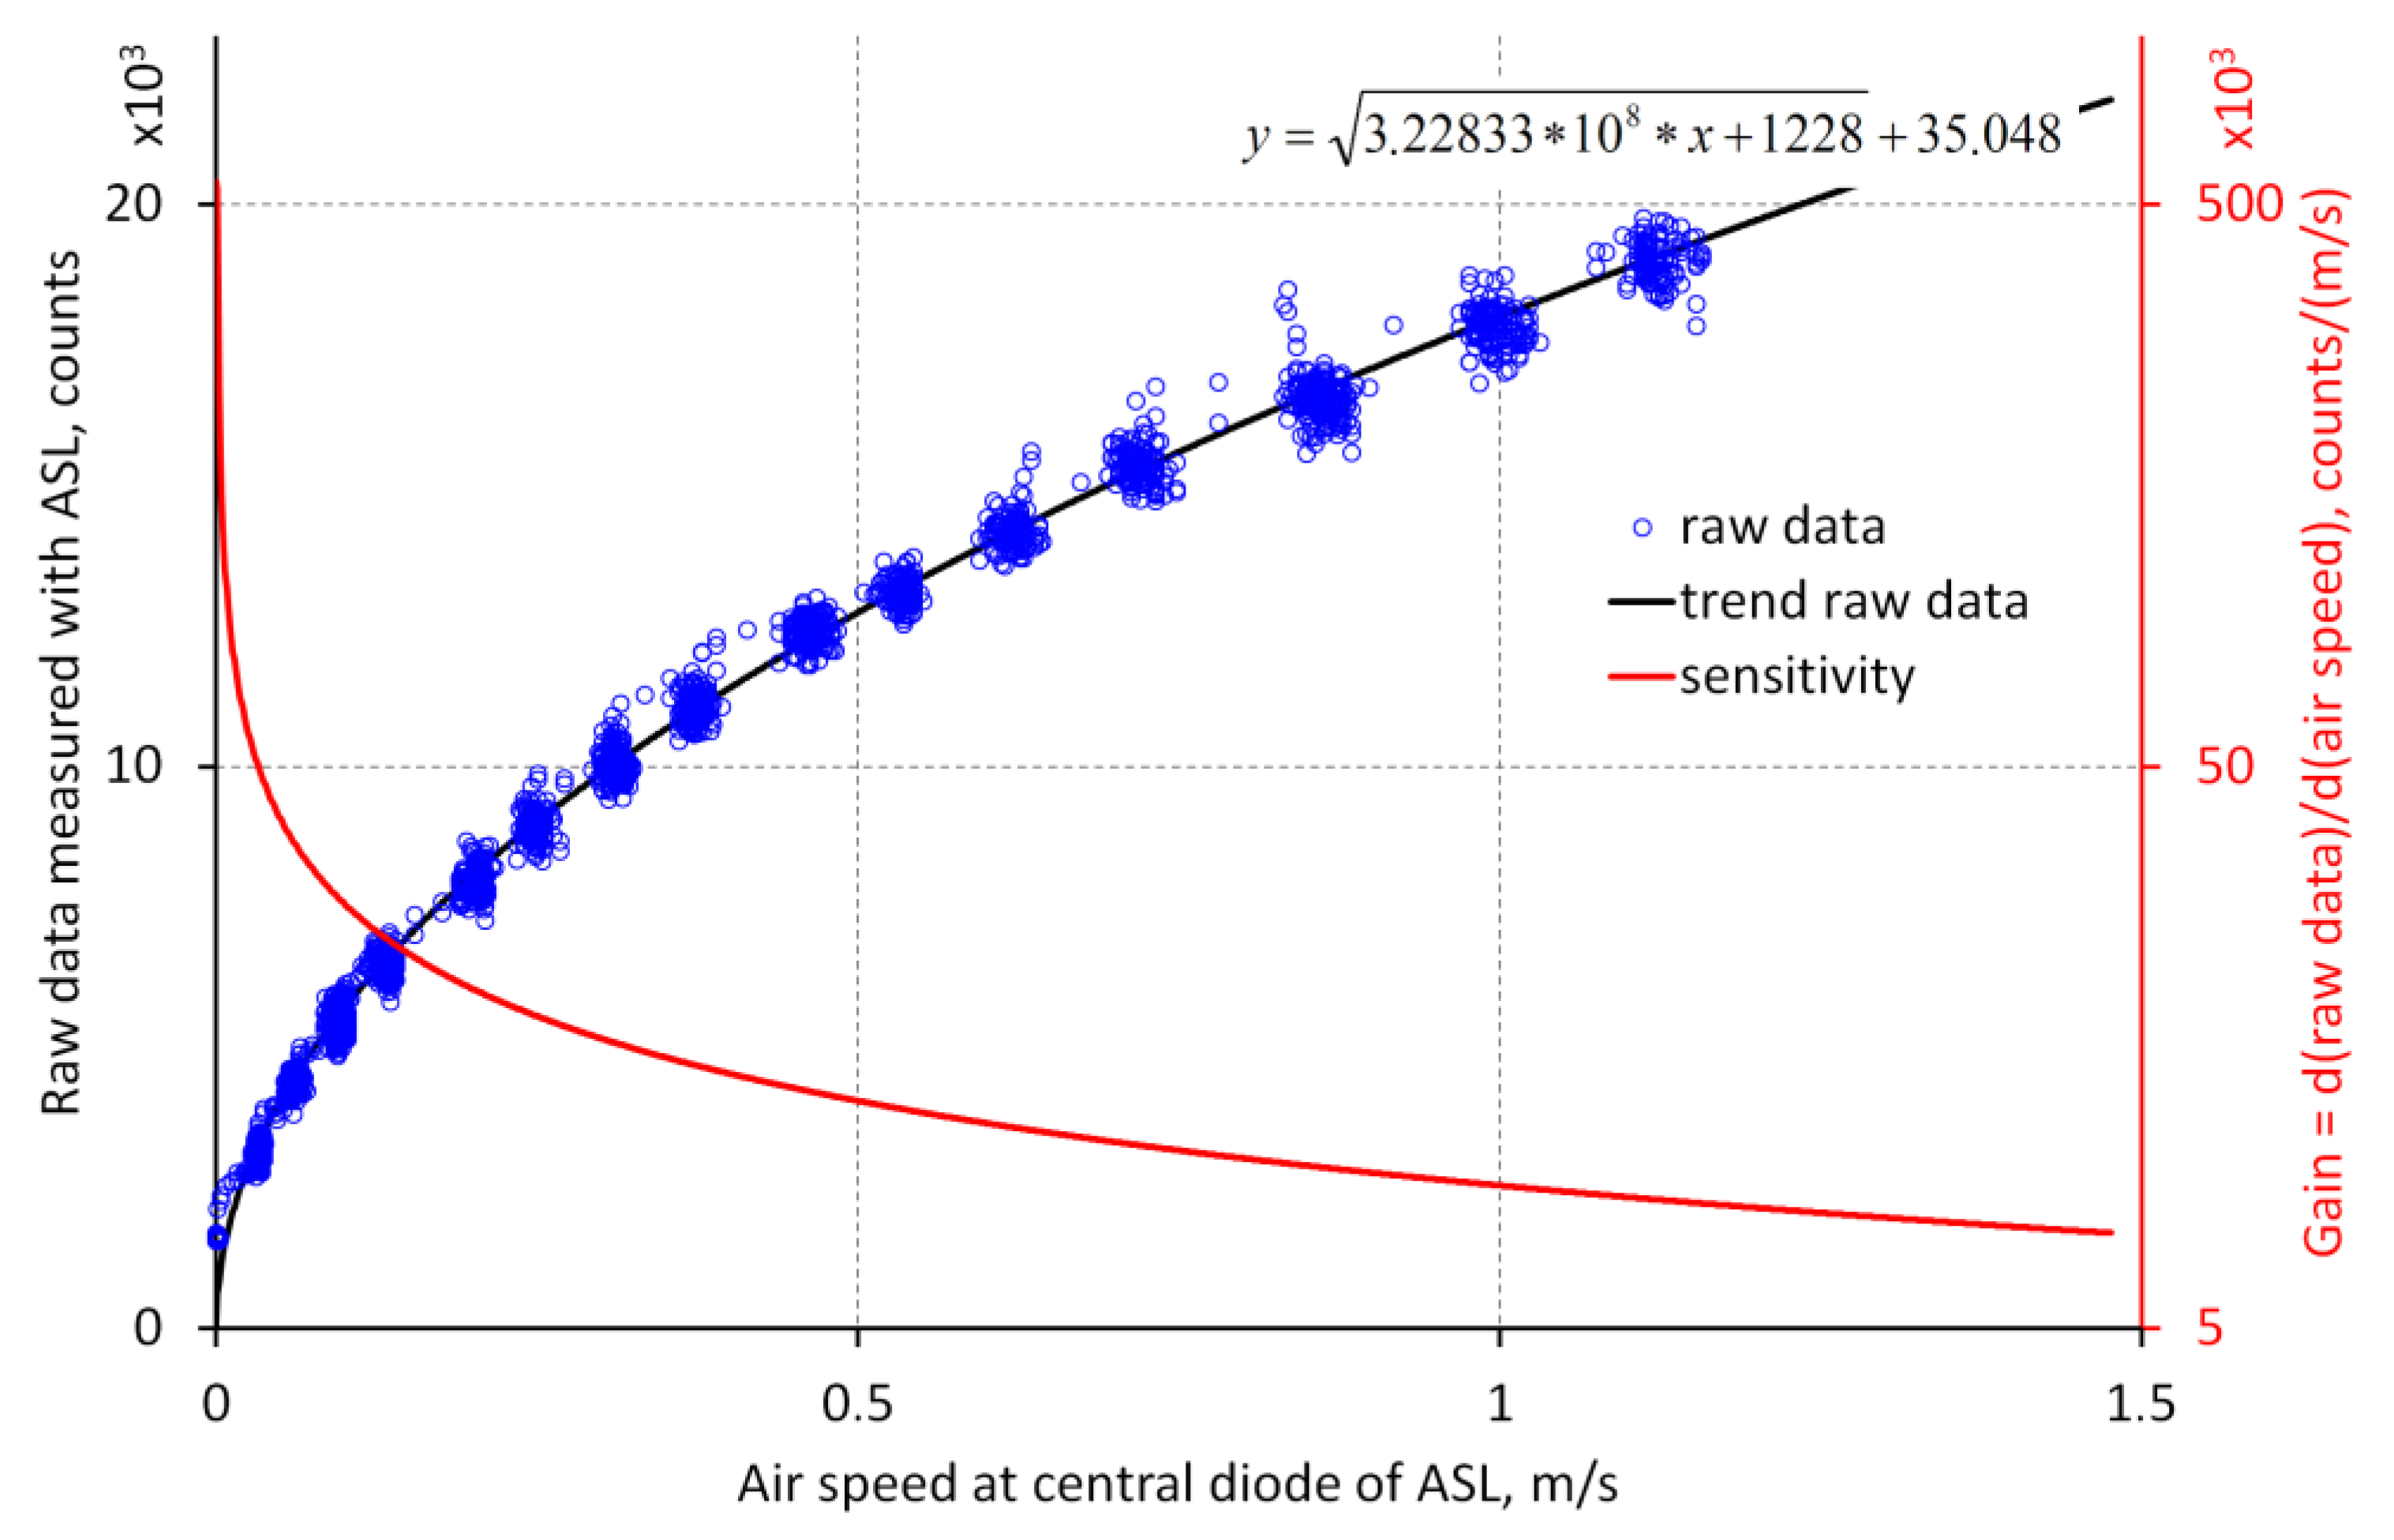
The final result was the relation between this real air speed data measured by the reference sensor and the raw data recorded by the ASL (
Figure 9). This function is used to calculate the real air speed from the binary data of the A/D converter of the ASL.
The inverse function (
Figure 10) of the function in
Figure 9 represents the sensitivity of the device. The derivative of the sensitivity is the gain of the sensor and tells how many binary steps will be present by a given change in air speed. It decreases from about 500 binary steps for 1 mm/s at an air speed near 0 mm/s (resolution of 2 µm/s) to about 7 binary steps for 1 mm/s at 1.5 m/s (resolution of 143 µm/s). This diagram proves the high dynamic range of the sensor which is limited especially by the stability of the zero point.
The peak-to-peak noise at zero air speed—while ALS was placed in a closed chamber—was about 0.5 mm/s. Further investigation relating the accuracy of the ASL will be performed if a small reference sensor is available for lower air speed that fits in the space between the spheres. Changes of the ambient temperature can influence the result, as the measuring principle bases on the constant temperature difference of two diode items. Software compensation ensures that the zero level of the ASL keeps stable (±2 mm/s at 20 K temperature difference). Especially fast changes of the temperature cause the effect that the parts of the ASL have temperature different to the air. Therefore, the diodes are influenced by the temperature of the airflow as well as by that of the device itself. Such temperature changes can temporarily shift the zero level. For a step of 20 K (cooling from 24 °C to 4 °C), the zero level was shifted for about 5 min to a maximum difference of 10 mm/s. Since the temperature is recorded together with the air speed, such effects can be considered when evaluating the results.
6. Conclusions
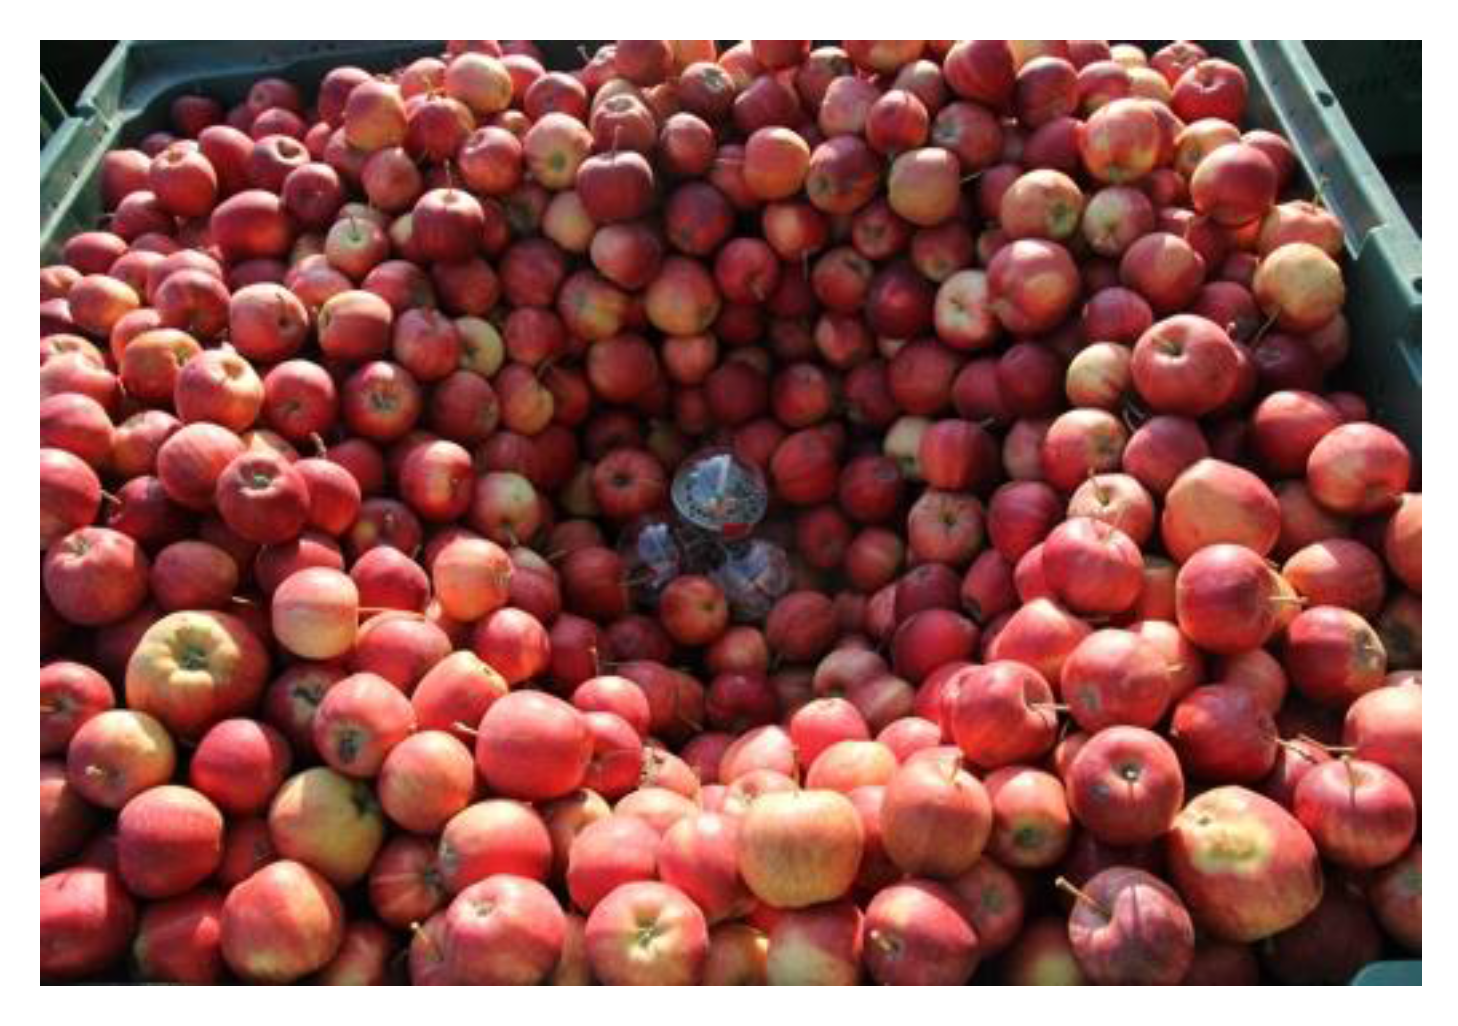
A new autonomous sensing device is developed for determination of air speed and temperature inside bulks and bins of stored agricultural products. Up to now, it was impossible to perform continuous airflow measurements in bulks of fruit or vegetables without disturbing the storage process. The presented device is adapted to the size of apples. It is appropriate in particular for produce of similar size and shape such as onions, potatoes, kiwi and oranges. The measuring principle is based on an established calorimetric method for air speed determination. The peculiarity of the device is the measurement of non-directional flow speed in gaps next to the produce due to its pyramidal array of four spheres simulating stacked fruit in storage conditions with central position of the heated diodes as main sensor element between the spheres.
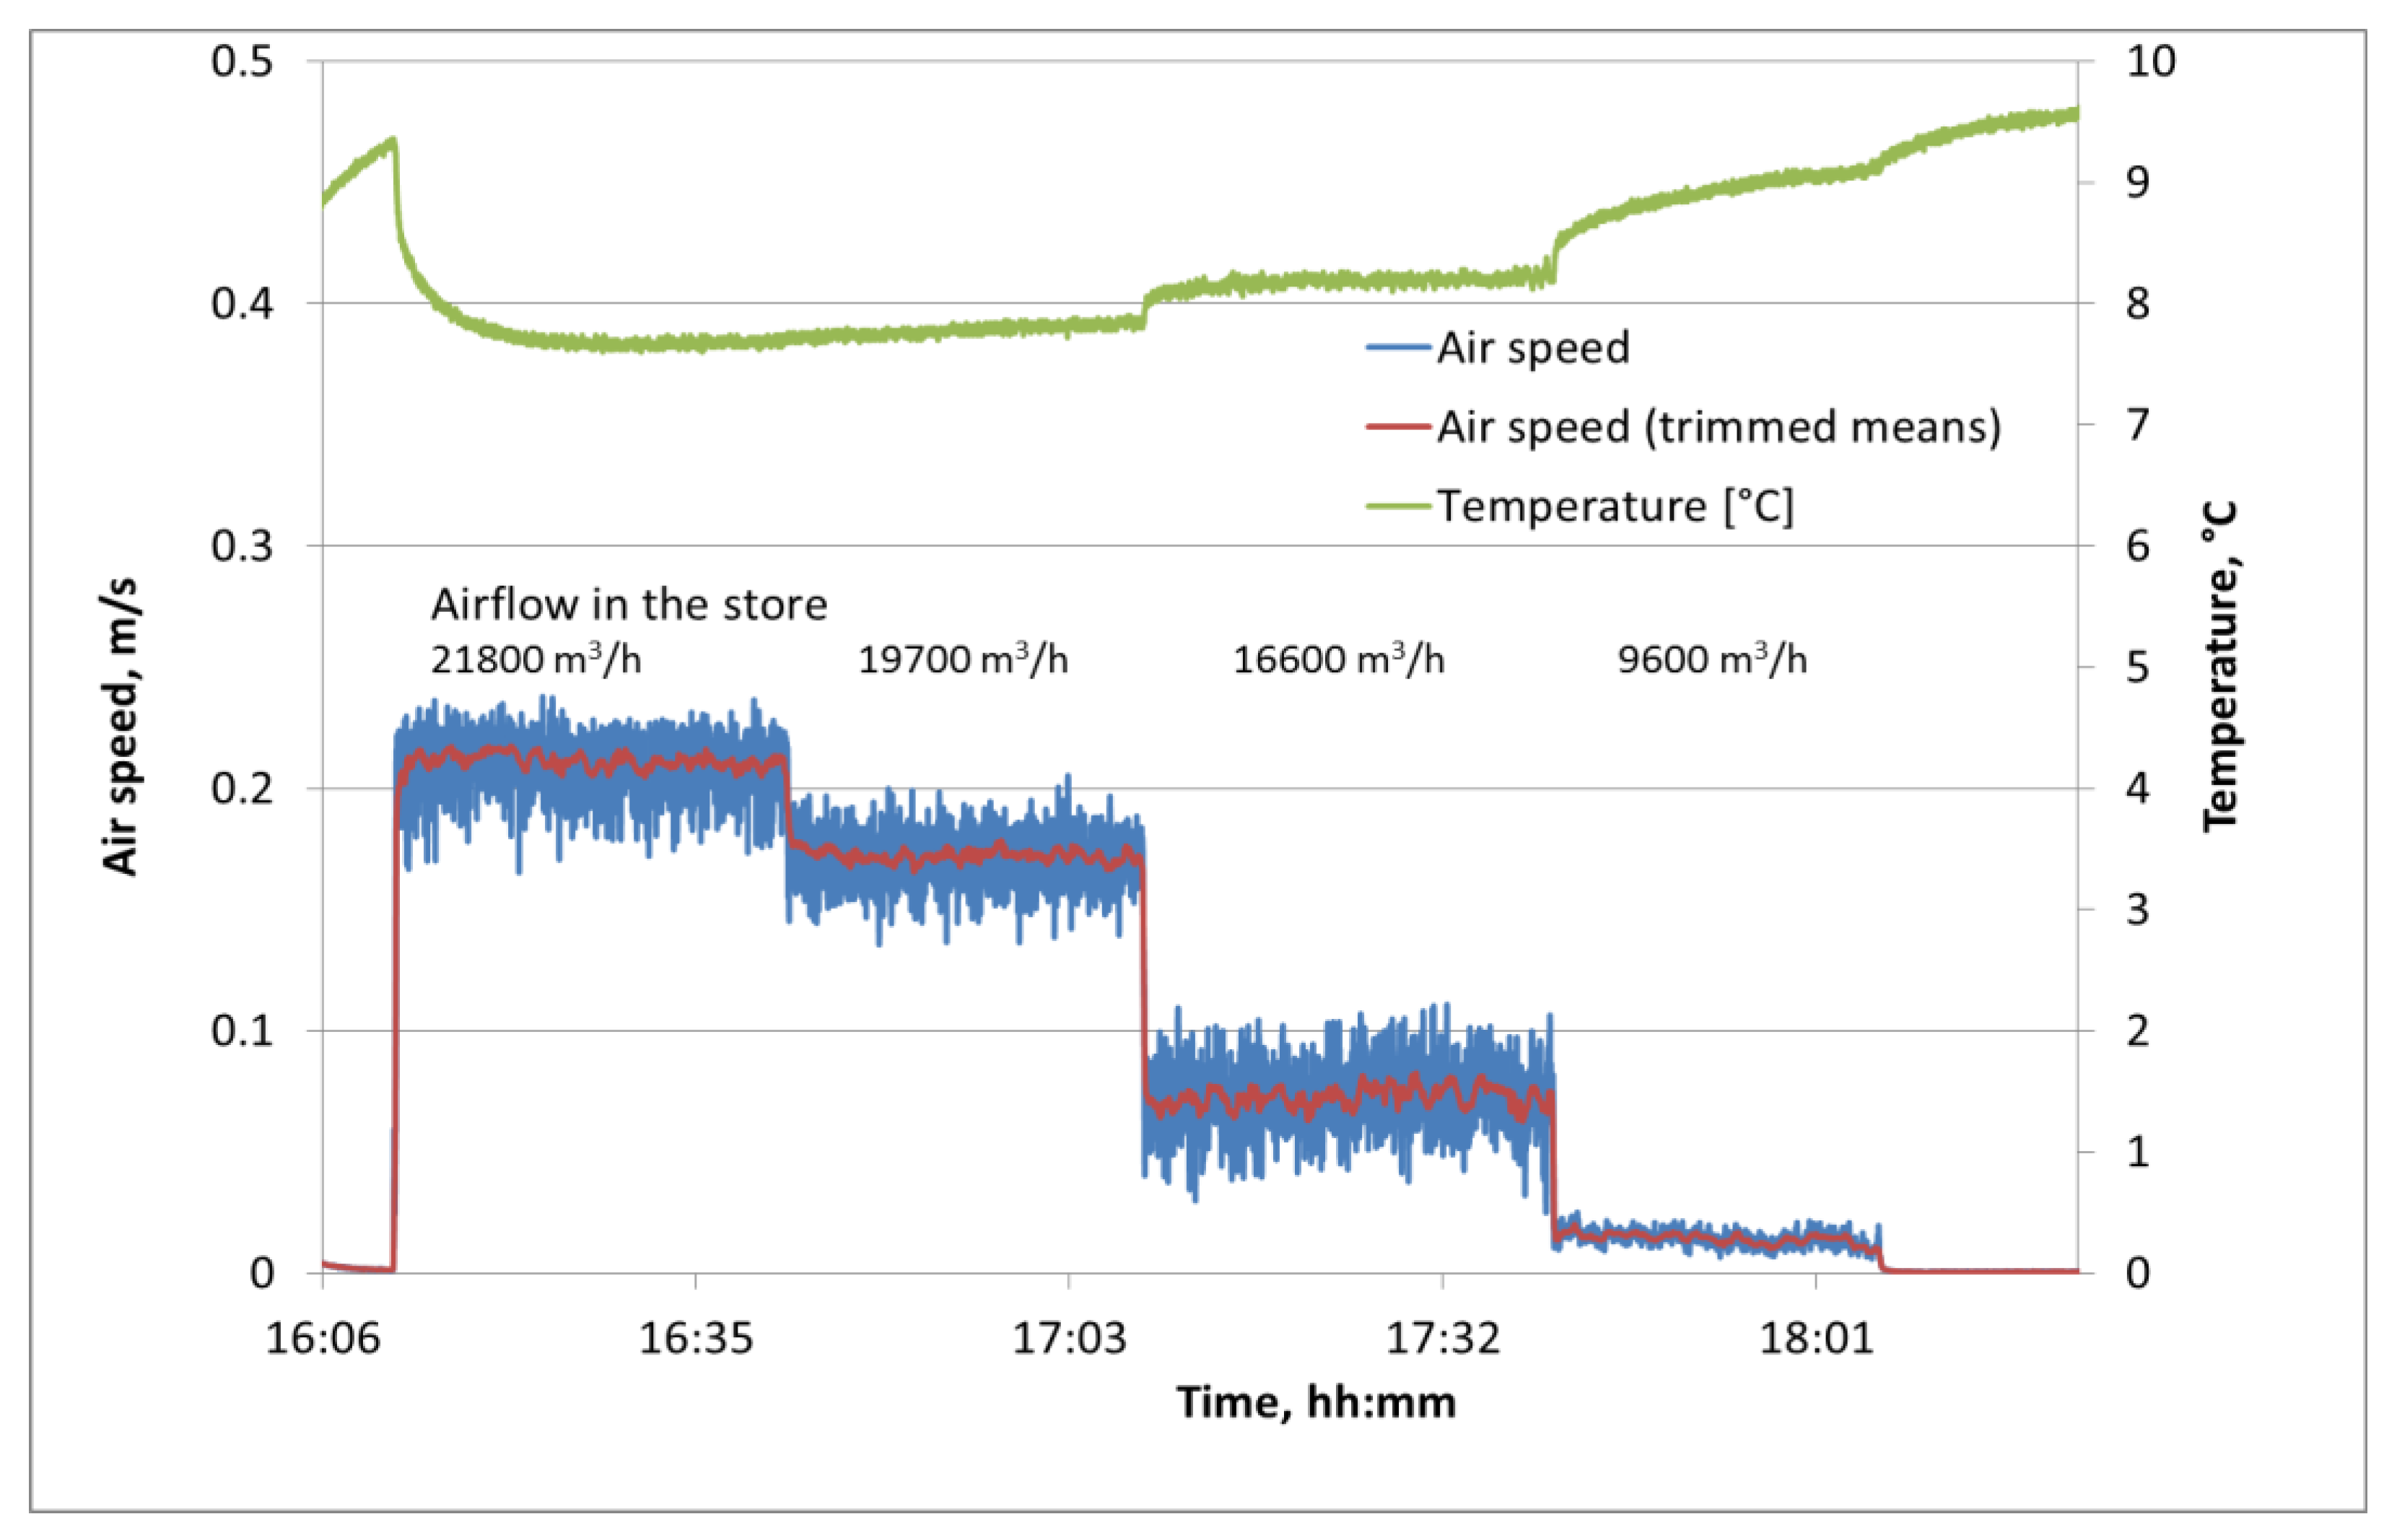
The device meets the requirement of recording very low air speed in a range of 0 to 1.5 m/s, as is estimated between fruit in ventilated storage bins. The need for air speed measurement in a very low measuring range (<0.3 m/s) is exemplary shown by measurements in an industrial apple store. Therefore, an advantage is that the sensitivity of the sensor increases remarkably with decreasing air speed values. Further studies on the measurements with the device in produce bulks may be used for validation of air speed models. The new system allows measurements with much lower influence on the airflow in the produce stack by the sensing system itself than common hot wire anemometers that were used in previous studies.
The handling of the device in industrial conditions is easy because it is placed without cable connection at the measuring position. The arrangement is relatively insensitive to mechanical damage compared to anemometers because the four spheres protect the sensor unit. The internal power supply and data memory allow data recording up to 28 h. The readout of the data and the battery charging is done with the same USB-connection. For application in storage rooms, the influence of fast temperature changes on air speed measurement must be considered and measurements should be done when temperature is stable. A correction factor could be established because of the simultaneous temperature measurement with air speed recording.
The new sensor will provide the possibility to better understand airflow conditions near produce in cool stores with the main task to improve quality of fruit, vegetables and potatoes.

 ,
, 


