Classification of Human Daily Activities Using Ensemble Methods Based on Smartphone Inertial Sensors


Abstract
:1. Introduction
2. Literature Review
2.1. Related Work
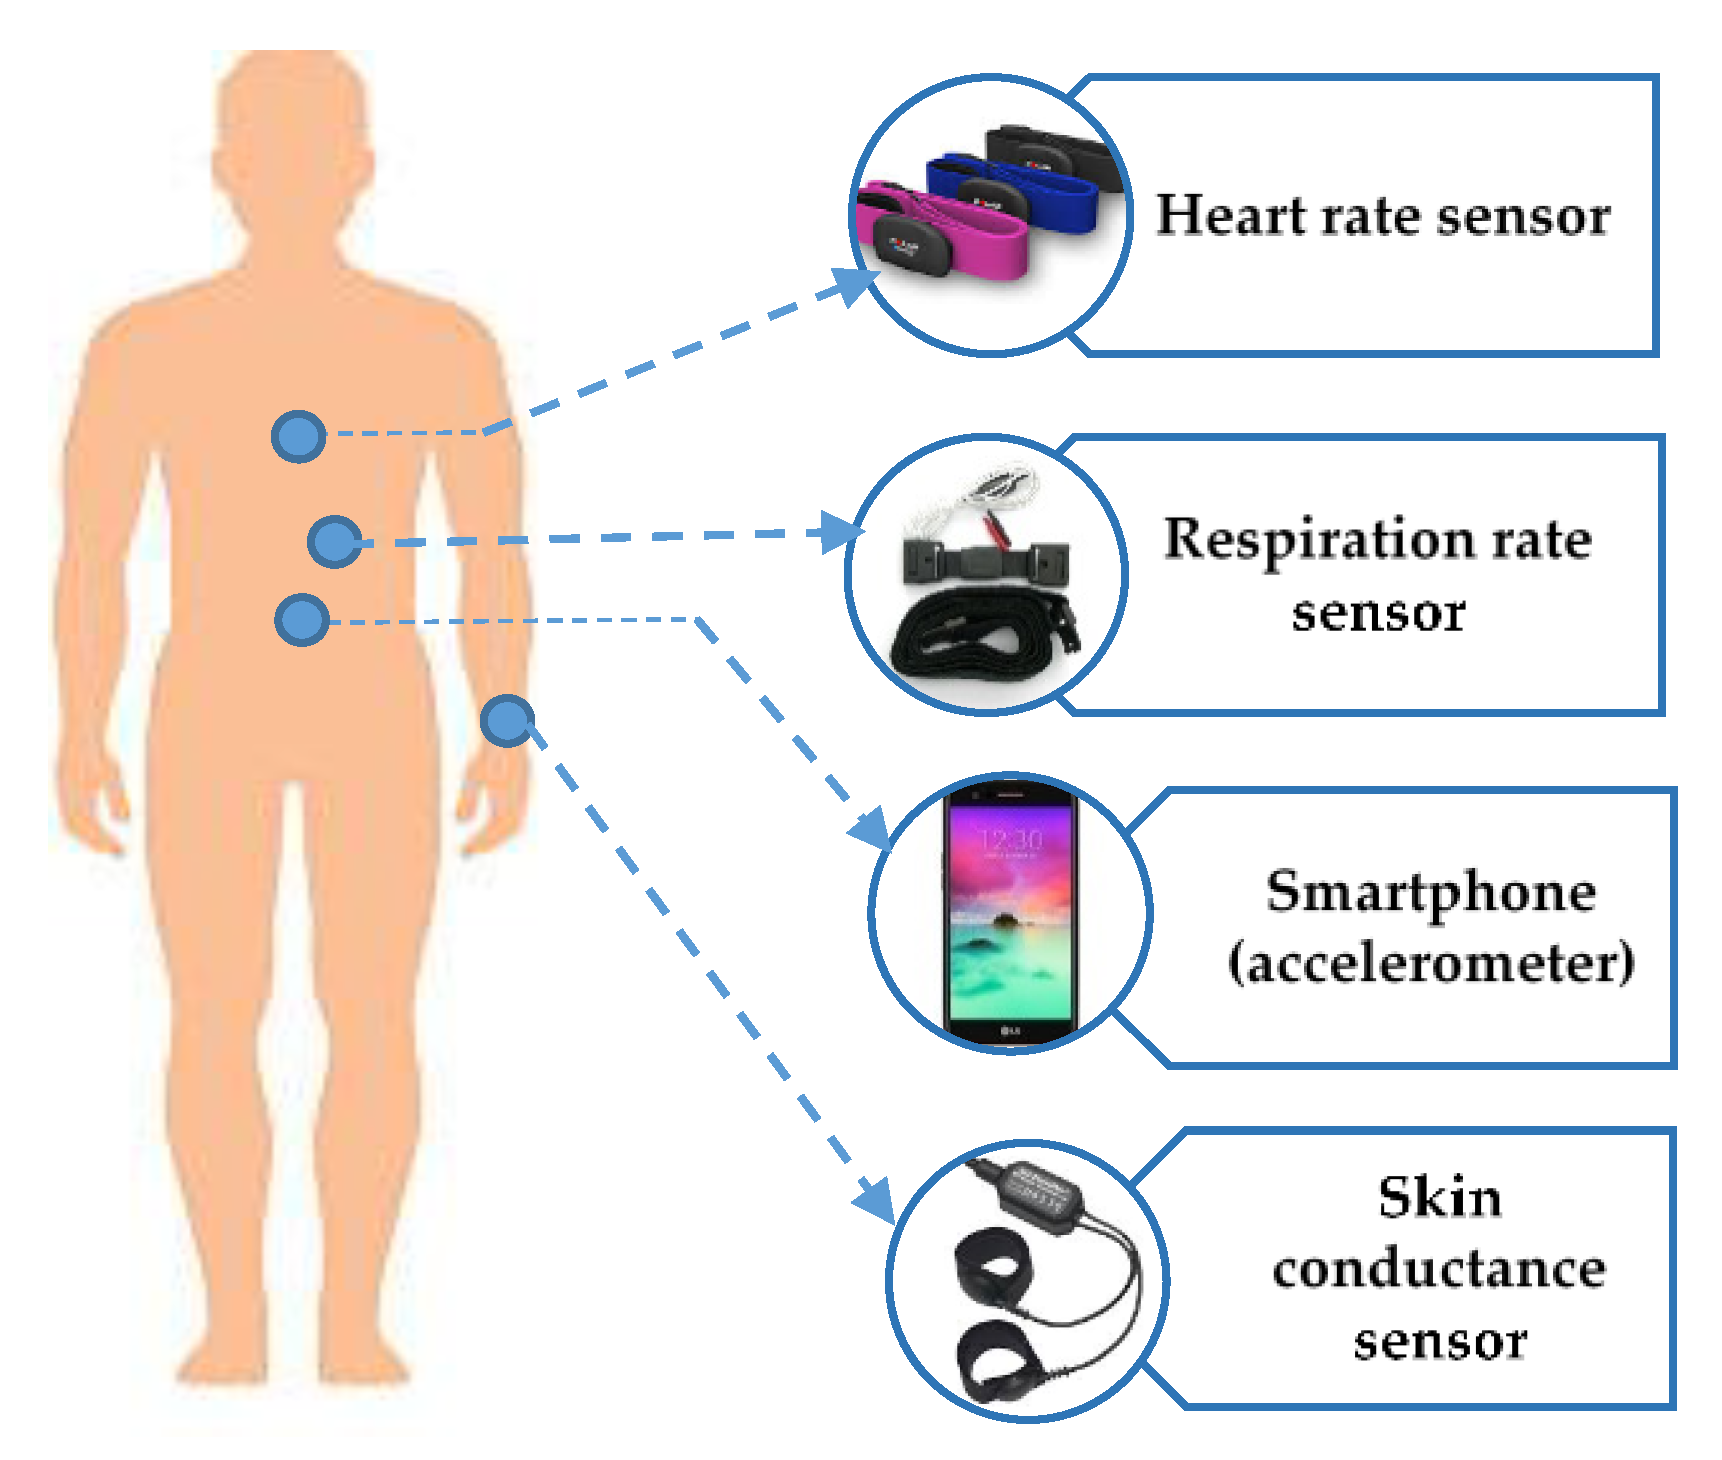
2.2. HAR System
3. Methods
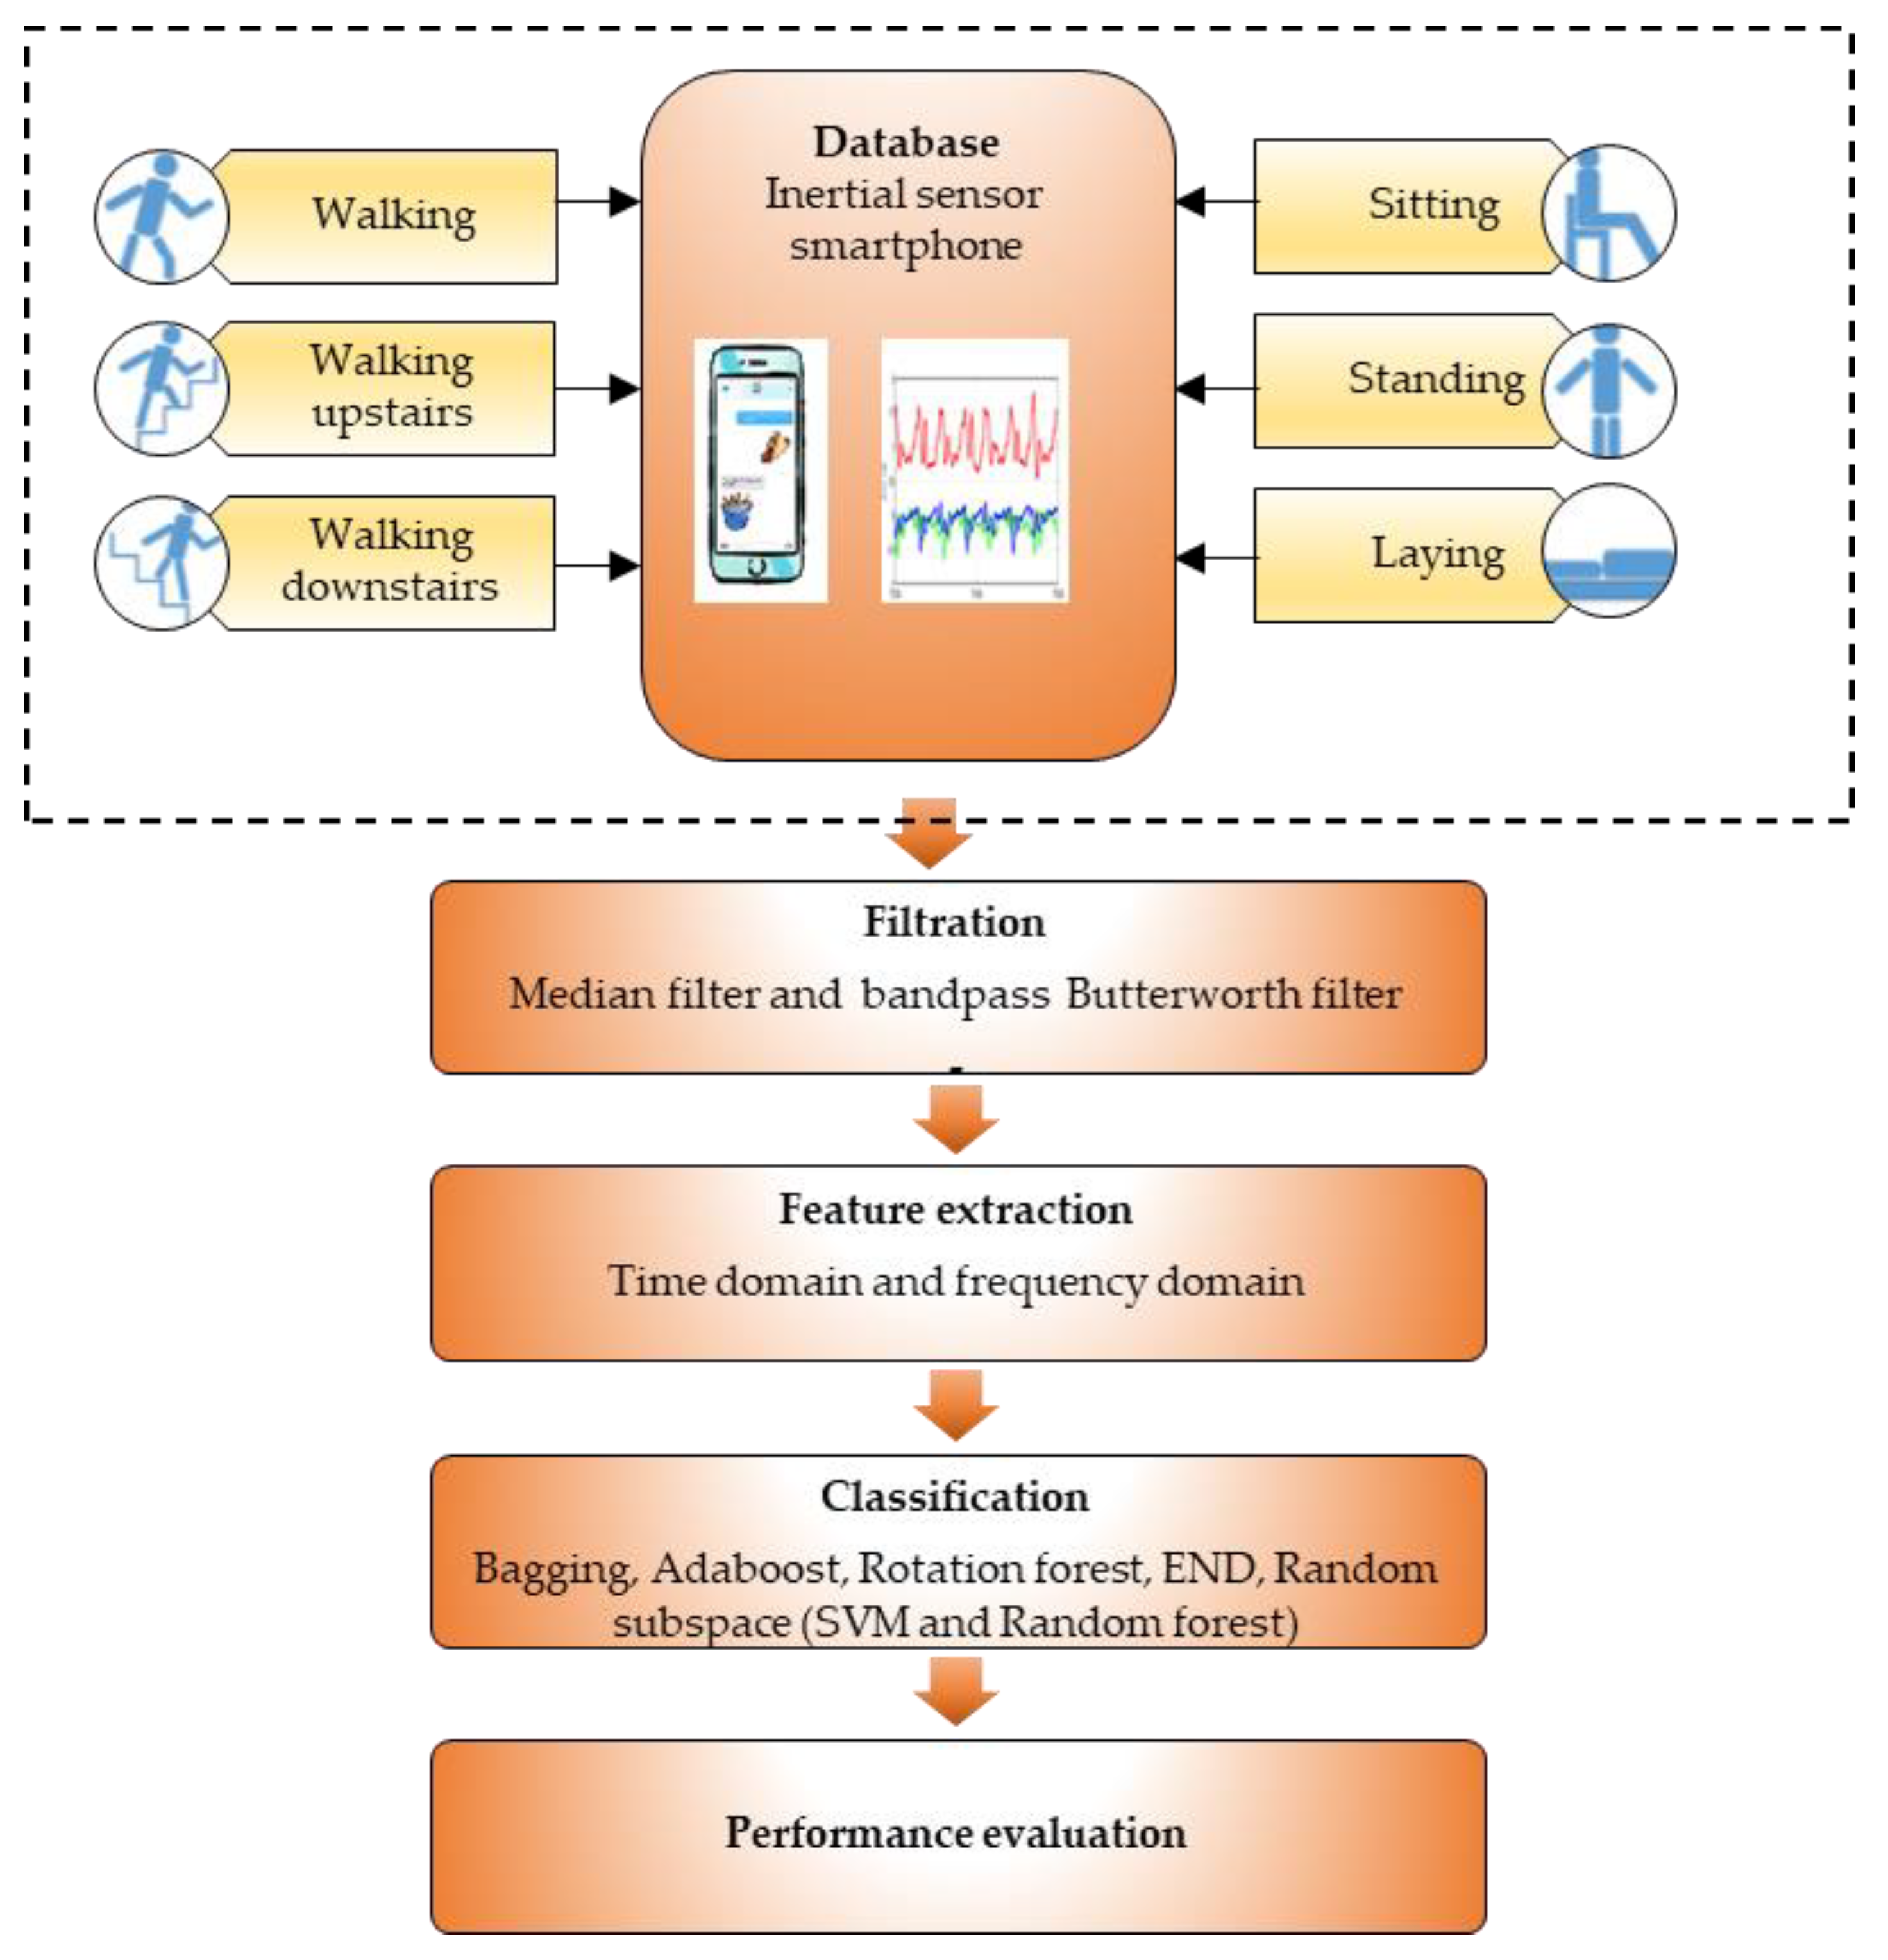
3.1. Signal Processing Method for HAR
3.2. Database
3.3. Data Pre-Processing Filtering and Feature Extraction
3.4. Classification Techniques—Ensemble Methods
3.5. Performance Evaluation
4. Results and Discussion
4.1. Performance Evaluation of Dataset 1
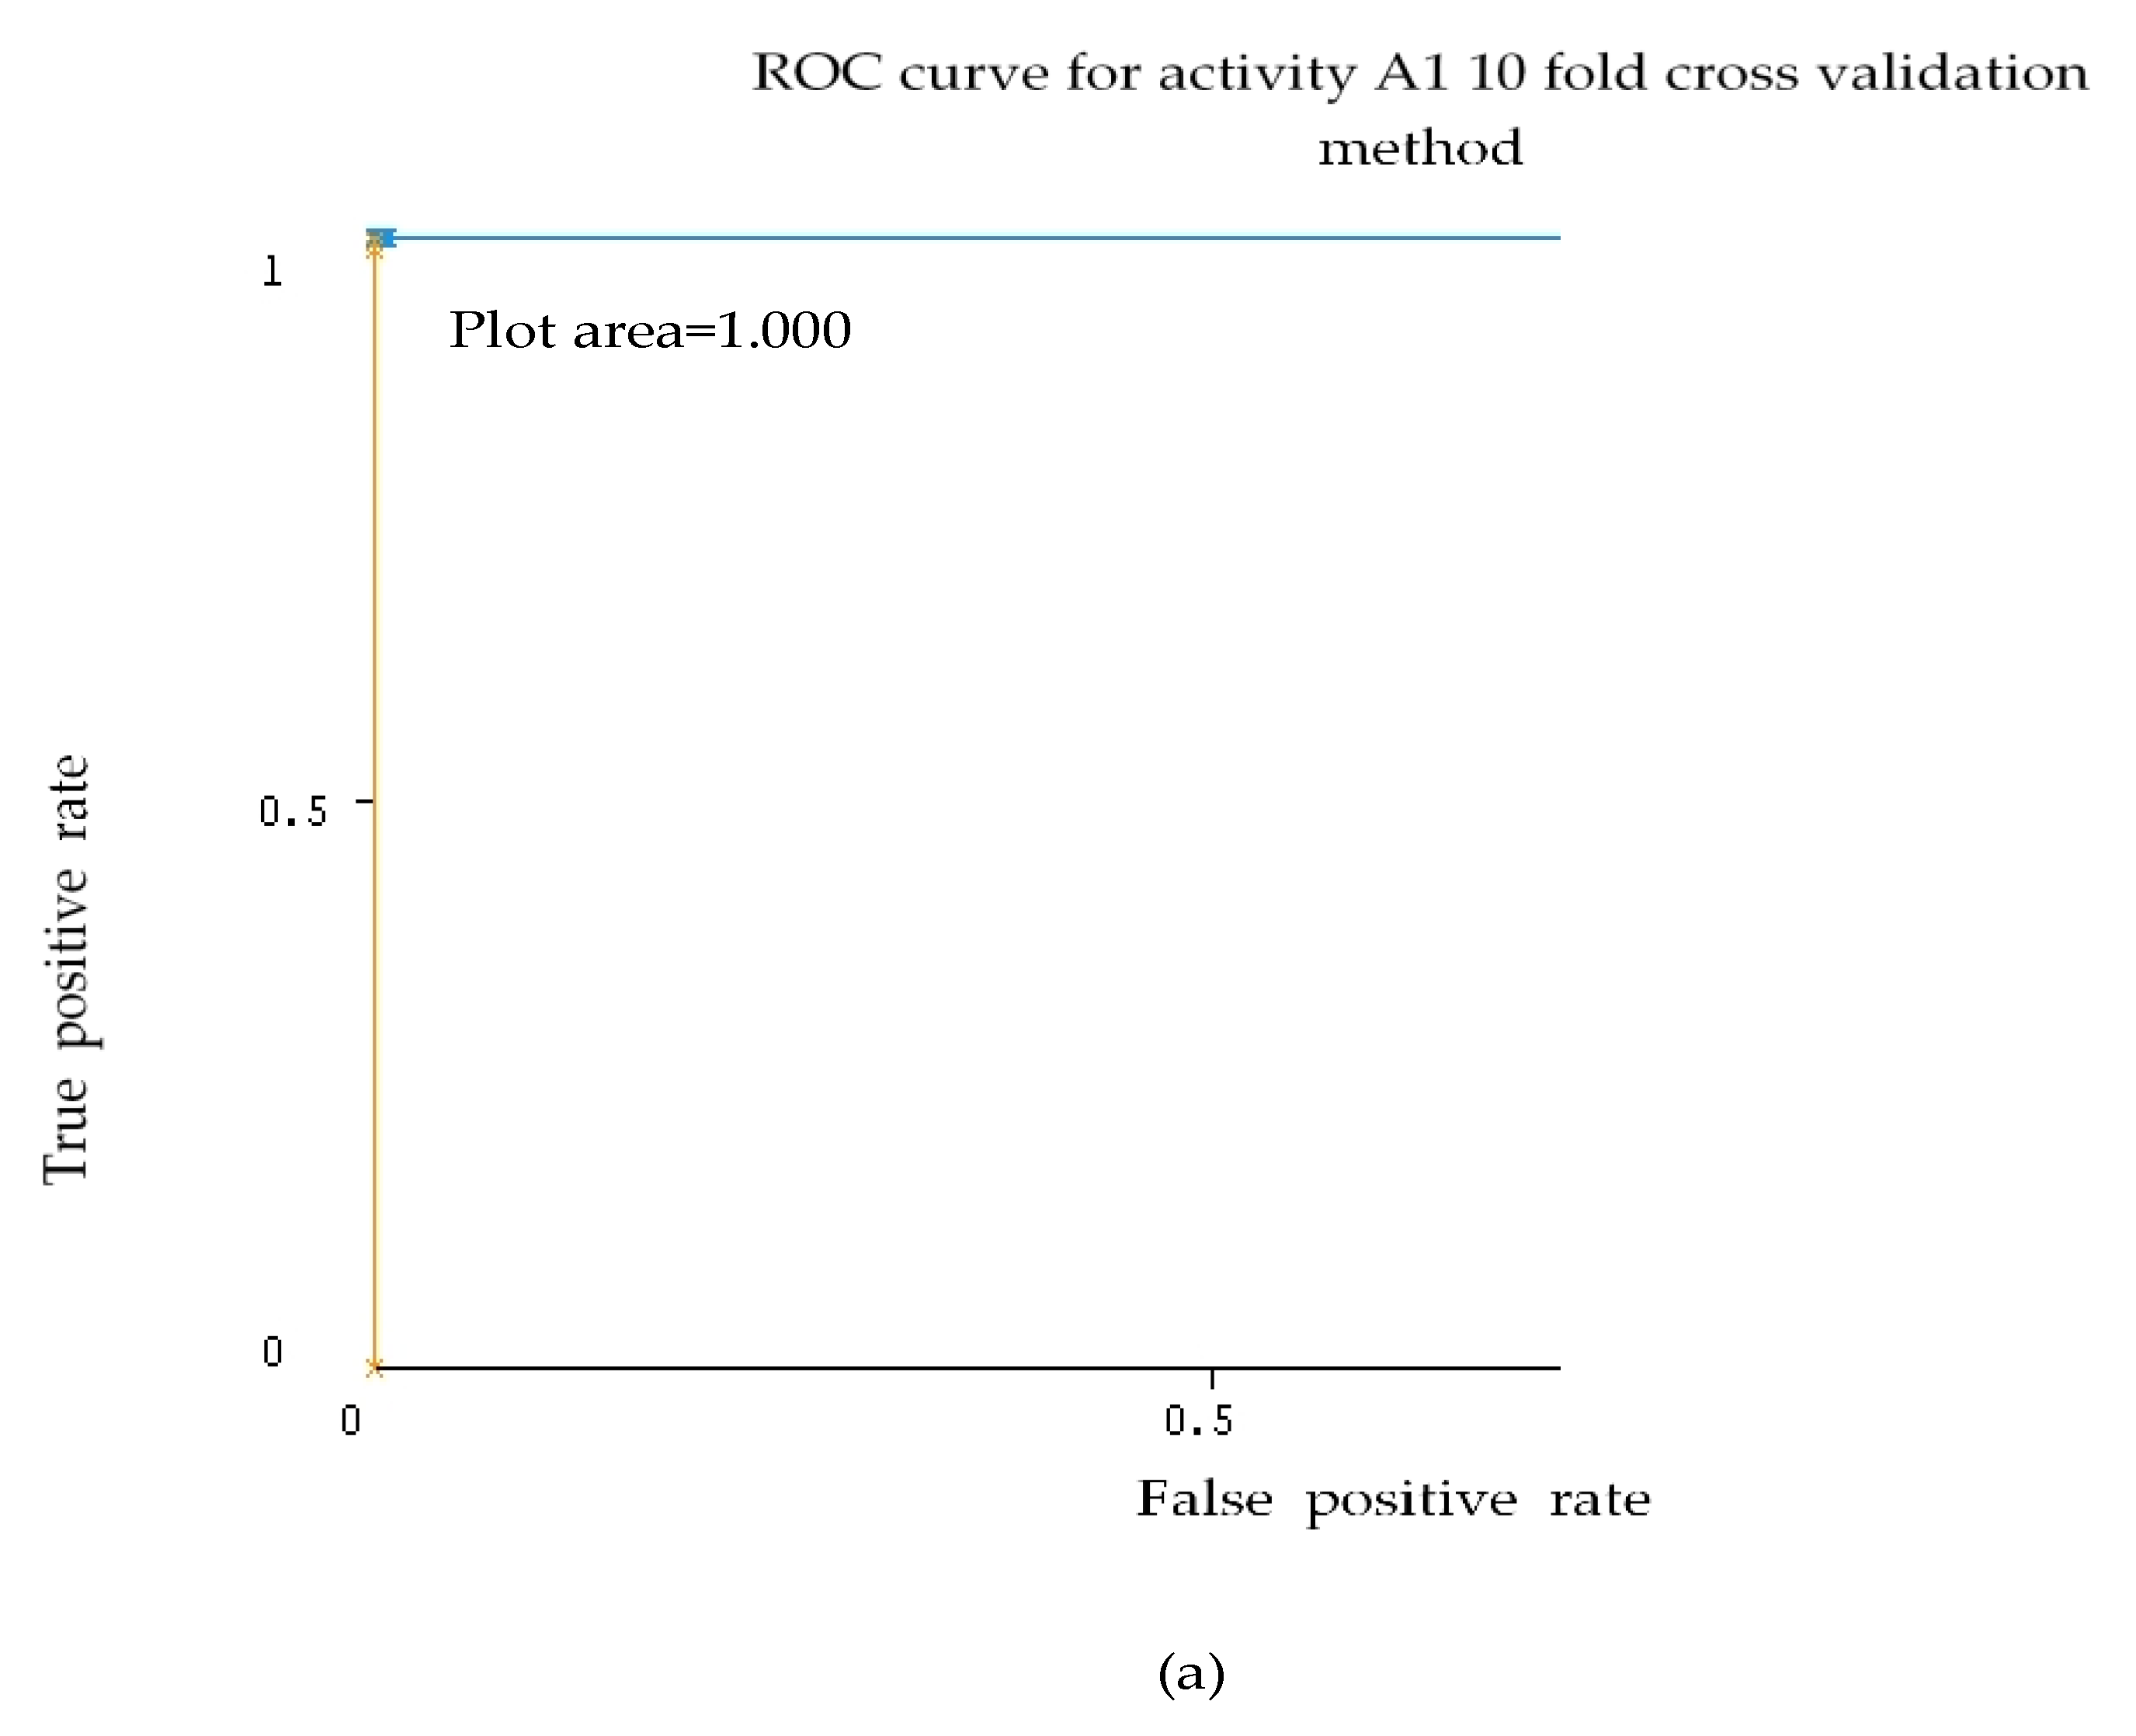
4.1.1. Holdout and 10 Cross-Validations for Precision, Recall, F-measure, and ROC Evaluation
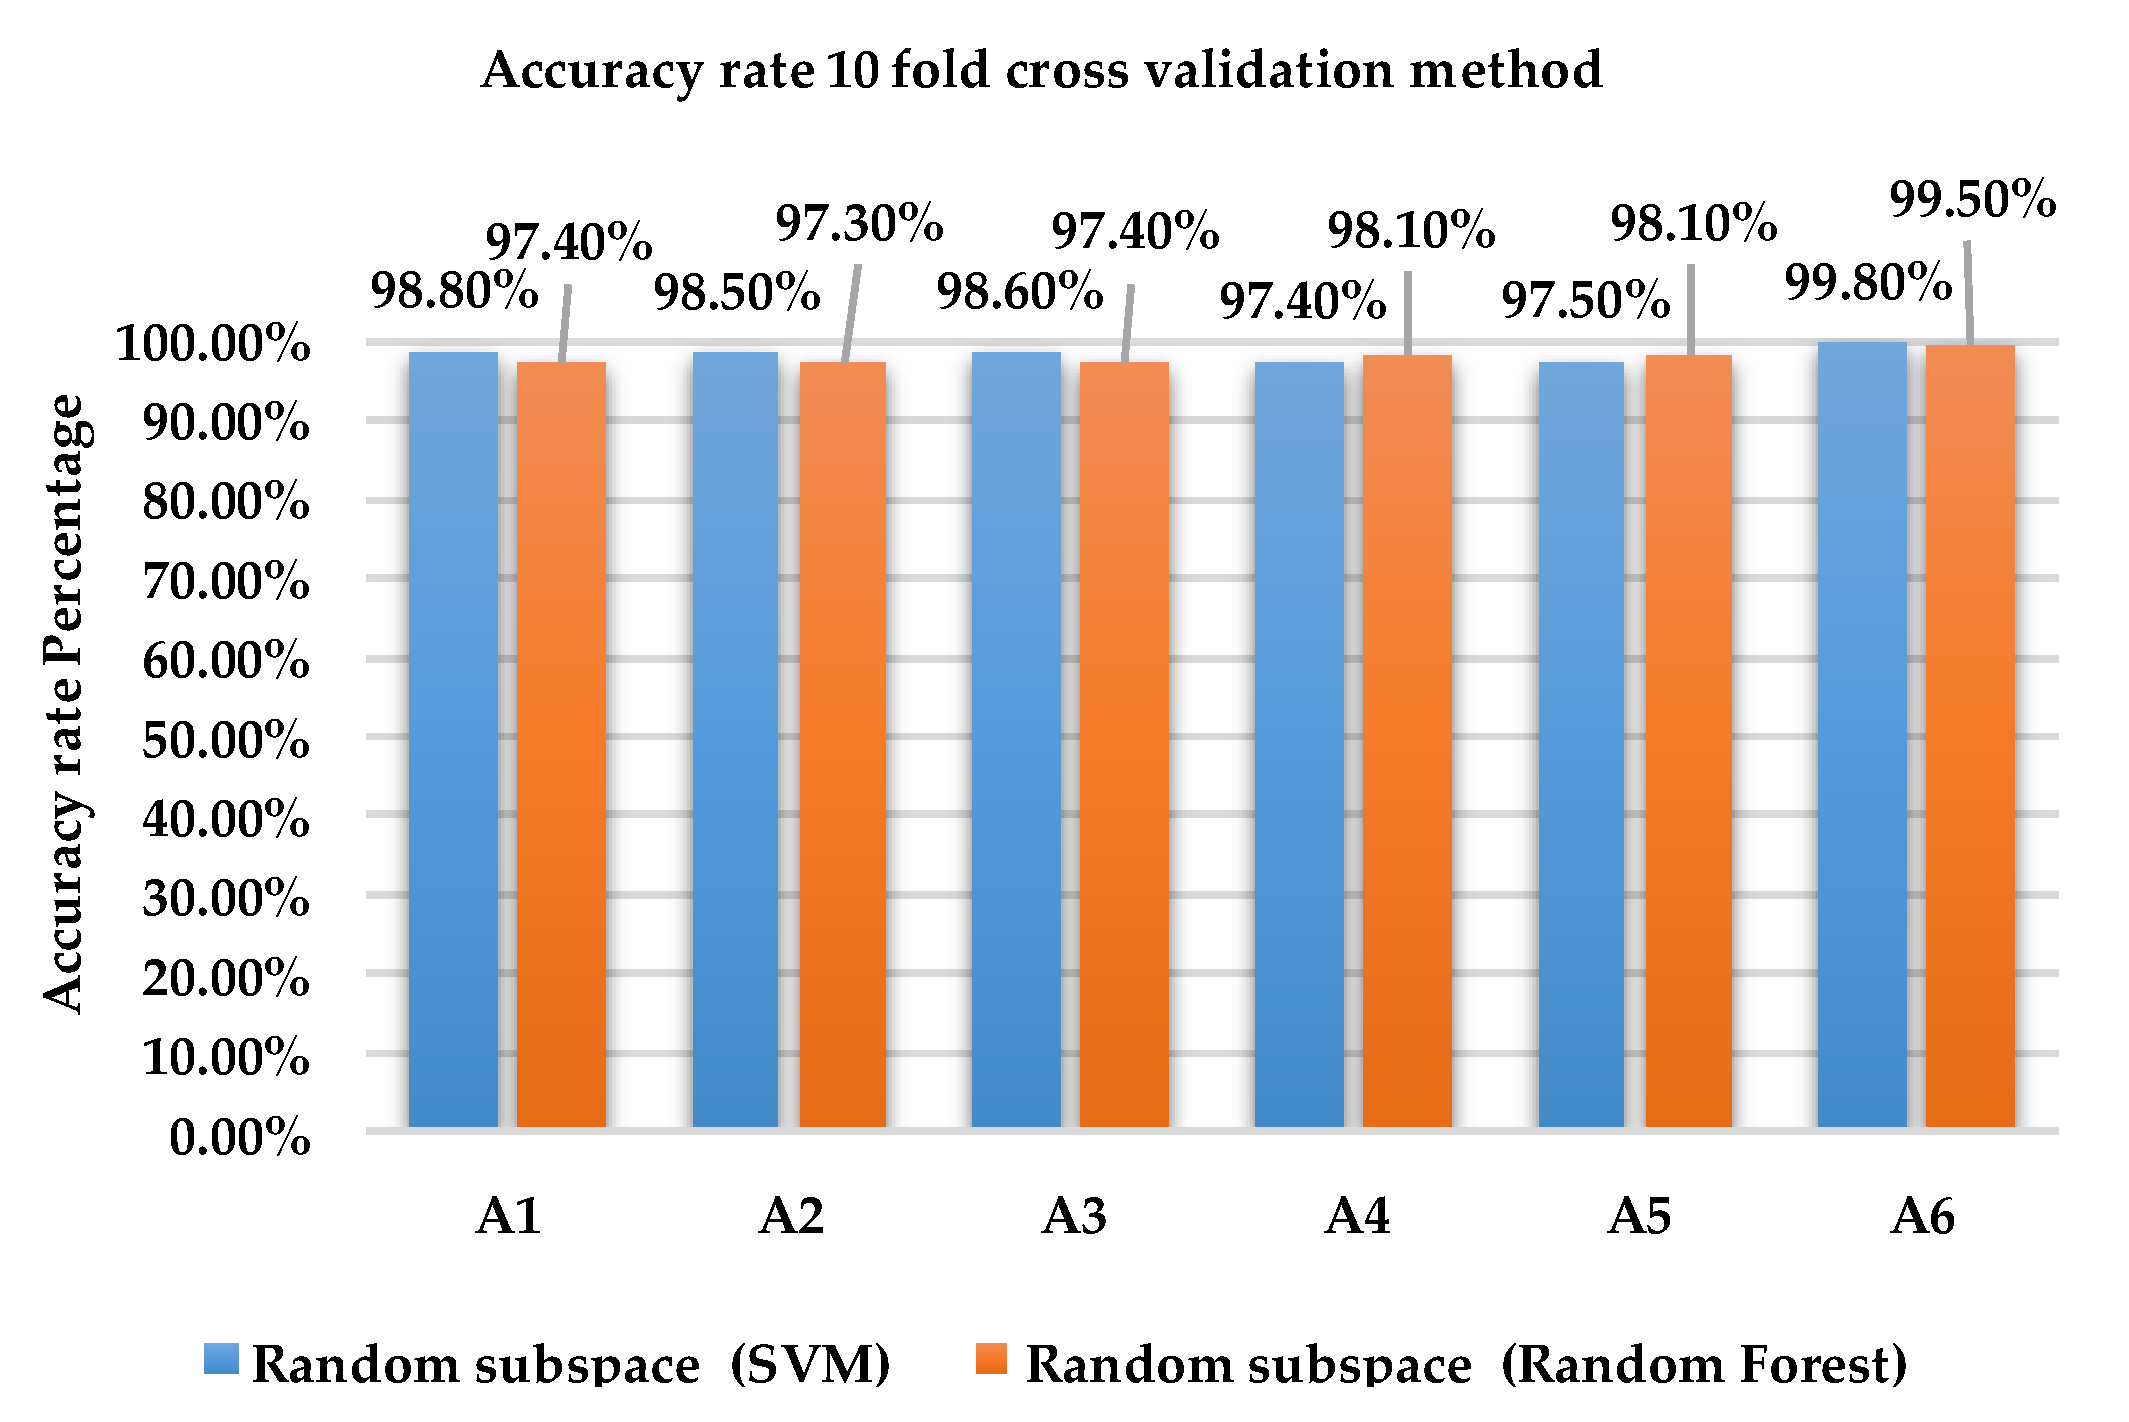
4.1.2. Holdout and 10-Fold Cross-Validations for Overall Accuracy Rate
4.2. Performance Evaluation of Dataset 2
4.2.1. Holdout Method for Precision, Recall, F-measure, and ROC Evaluation
4.2.2. 10-Fold Cross Validation for Precision, Recall, F-measure, and ROC Evaluation
4.2.3. Holdout and 10-Fold CROSS-validations for Overall Accuracy Rate Classification
4.3. Comparative Analysis
5. Conclusions
Author Contributions
Funding
Acknowledgments
Conflicts of Interest
References
- Abowd, G.D.; Dey, A.K.; Orr, R.; Brotherton, J. Context Tracking in Wearable and Ubiquitous Computing. In Proceedings of the 1st International Symposium on Wearable Computers, Cambridge, MA, USA, 13–14 October 1997; pp. 179–180. [Google Scholar]
- Fikri, M.; Fahmi, A.; Negara, P.; Sayeed, S.; Choi, D. Classification Algorithms in Human Activity Recognition Using Smartphones. Int. J. Comput. Inf. Eng. 2012, 6, 77–84. [Google Scholar]
- Wu, W.H.; Bui, A.A.T.; Batalin, M.A.; Au, L.K.; Binney, J.D.; Kaiser, W.J. MEDIC: Medical Embedded Device for Individualized Care. Artif. Intell. Med. 2008, 42, 137–152. [Google Scholar] [CrossRef] [PubMed]
- Patel, S.; Park, H.; Bonato, P.; Chan, L.; Rodgers, M. A Review of Wearable Sensors and Systems with Application in Rehabilitation. J. NeuroEng. Rehabil. 2012, 9, 21. [Google Scholar] [CrossRef] [PubMed] [Green Version]
- Abowd, G.D.; Atkeson, C.G.; Hong, J.; Long, S.; Kooper, R.; Pinkerton, M. Cyberguide: A Mobile Context Aware Tour Guide. Wirel. Netw. 1997, 3, 421–433. [Google Scholar] [CrossRef]
- Alt, F.; Shirazi, A.S.; Pfeiffer, M.; Holleis, P.; Schmidt, A. TaxiMedia: An Interactive Context-Aware Entertainment and Advertising System. In Proceedings of the Informatik 2009: Im Focus das Leben, Beiträge der 39. Jahrestagung der Gesellschaft für Informatik e.V. (GI), Lübeck, Germany, 28 September–2 October 2009. [Google Scholar]
- Mitra, S.; Acharya, T. Gesture Recognition: A Survey. IEEE Trans. Syst. Man Cybern. Part C Appl. Rev. 2007, 37, 311–324. [Google Scholar] [CrossRef] [Green Version]
- Turaga, P.; Chellappa, R.; Subrahmanian, V.S.; Udrea, O. Machine Recognition of Human Activities: A Survey. IEEE Trans. Circuits Syst. Video Technol. 2008, 18, 1473–1488. [Google Scholar] [CrossRef] [Green Version]
- Aggarwal, J.K.; Ryoo, M.S. Human Activity Analysis: A Review. ACM Comput. Surv. 2011, 43, 1–47. [Google Scholar] [CrossRef]
- Obermayer, J.L.; Riley, W.T.; Asif, O.; Jean-Mary, J. College Smoking-Cessation Using Cell Phone Text Messaging. J Am. Coll. Health 2004, 53, 71–78. [Google Scholar] [CrossRef] [PubMed]
- Aguiar, B.; Silva, J.; Rocha, T.; Carneiro, S.; Sousa, I. Monitoring Physical Activity and Energy Expenditure with Smartphones. In Proceedings of the IEEE-EMBS International Conference on Biomedical and Health Informatics (BHI), Valencia, Spain, 1–4 June 2014; pp. 664–667. [Google Scholar]
- Del Rosario, M.B.; Redmond, S.J.; Lovell, N.H. Tracking the Evolution of Smartphone Sensing for Monitoring Human Movement. Sensors 2015, 15, 18901–18933. [Google Scholar] [CrossRef] [PubMed] [Green Version]
- Micucci, D.; Mobilio, M.; Napoletano, P. UniMiB SHAR: Dataset for Human Activity Recognition Using Acceleration Data from Smartphones. Appl. Sci. 2017, 7, 1101. [Google Scholar] [CrossRef]
- Pires, I.M.; Garcia, N.M.; Pombo, N.; Flórez-Revuelta, F. From Data Acquisition to Data Fusion: A Comprehensive Review and a Roadmap for the Identification of Activities of Daily Living Using Mobile Devices. Sensors 2016, 16, 184. [Google Scholar] [CrossRef] [PubMed]
- Jain, A.; Kanhangad, V. Human Activity Classification in Smartphones Using Accelerometer and Gyroscope Sensors. IEEE Sens. J. 2018, 18, 1169–1177. [Google Scholar] [CrossRef]
- Polikar, R. Ensemble Based Systems in Decision Making. IEEE Circuits Syst. Mag. 2006, 6, 21–45. [Google Scholar] [CrossRef]
- Sagi, O.; Rokach, L. Ensemble Learning: A Survey. Wires Data Min. Knowl. Discovery 2018, 8, e1249. [Google Scholar] [CrossRef]
- Anguita, D.; Ghio, A.; Oneto, L.; Parra, X.; Reyes-Ortiz, J.L. Human Activity Recognition on Smartphones Using a Multiclass Hardware-Friendly Support Vector Machine. In Proceedings of the 4th International Workshop, IWAAL 2012, Vitoria-Gasteiz, Spain, 3–5 December 2012. [Google Scholar]
- Saha, J.; Chowdhury, C.; Chowdhury, I.R.; Biswas, S.; Aslam, N. An Ensemble of Condition Based Classifiers for Device Independent Detailed Human Activity Recognition Using Smartphones. Information 2018, 9, 94. [Google Scholar] [CrossRef]
- Mohamed, R.; Zainudin, M.N.S.; Sulaiman, M.N.; Perumal, T.; Mustapha, N. Multi-Label Classification for Physical Activity Recognition from Various Accelerometer Sensor Positions. J. Inf. Commun. Technol. 2018, 18, 209–231. [Google Scholar]
- Ronao, C.A.; Cho, S.-B. Recognizing Human Activities from Smartphone Sensors Using Hierarchical Continuous Hidden Markov Models. Int. J. Distrib. Sens. Netw. 2017, 13, 1–16. [Google Scholar] [CrossRef]
- Gao, L.; Bourke, A.K.; Nelson, J. Evaluation of Accelerometer Based Multi-Sensor versus Single-Sensor Activity Recognition Systems. Med. Eng. Phys. 2014, 36, 779–785. [Google Scholar] [CrossRef] [PubMed]
- Kastner, M.; Strickert, M.; Villmann, T. A Sparse Kernelized Matrix Learning Vector Quantization Model for Human Activity Recognition. In Proceedings of the Europearn Symposium on Artificial Neural Networks, Computational Intelligence and Machine Learning (ESANN 2013), Bruges, Belgium, 24–26 April 2013. [Google Scholar]
- Romera-Paredes, B.; Aung, M.S.H.; Bianchi-Berthouze, N. A One-vs-One Classifier Ensemble with Majority Voting for Activity Recognition. In Proceedings of the Europearn Symposium on Artificial Neural Networks, Computational Intelligence and Machine Learning (ESANN 2013), Bruges, Belgium, 24–26 April 2013. [Google Scholar]
- Anguita, D.; Ghio, A.; Oneto, L.; Parra, X.; Reyes-Ortiz, J.L. A Public Domain Dataset for Human Activity Recognition Using Smartphones. In Proceedings of the Europearn Symposium on Artificial Neural Networks, Computational Intelligence and Machine Learning (ESANN 2013), Bruges, Belgium, 24–26 April 2013. [Google Scholar]
- Azmi, M.S.M.; Sulaiman, M.N. Accelerator-Based Human Activity Recognition Using Voting Technique with NBTree and MLP Classifiers. Int. J. Adv. Sci. Eng. Inf. Technol. 2017, 7, 146–152. [Google Scholar] [CrossRef]
- Daghistani, T.; Alshammari, R. Improving Accelerometer-Based Activity Recognition by Using Ensemble of Classifiers. (IJACSA) Int. J. Adv. Comput. Sci. Appl. 2016, 7, 128–133. [Google Scholar] [CrossRef]
- Catal, C.; Tufekci, S.; Pirmit, E.; Kocabag, G. On the Use of Ensemble of Classifiers for Accelerometer-Based Activity Recognition. Appl. Soft Comput. 2015, 37, 1018–1022. [Google Scholar] [CrossRef]
- Gupta, S.; Kumar, A. Human Activity Recognition through Smartphone’s Tri-Axial Accelerometer Using Time Domain Wave Analysis and Machine Learning. Int. J. Compt. Appl. 2015, 127, 22–26. [Google Scholar] [CrossRef]
- Bayat, A.; Pomplun, M.; Tran, D.A. A Study on Human Activity Recognition Using Accelerometer Data from Smartphones. Procedia Comput. Sci. 2014, 34, 450–457. [Google Scholar] [CrossRef]
- Ha, E.T.; Ryu, K.R. Activity Recognition by Smartphone Accelerometer Data Using Ensemble Learning Methods. Int. J. Electr. Comput. Eng. 2014, 8, 480–483. [Google Scholar]
- Jiang, W.; Yin, Z. Human Activity Recognition Using Wearable Sensors by Deep Convolutional Neural Networks. In Proceedings of the 23rd ACM international conference on Multimedia, Brisbane, Australia, 26–30 October 2015; pp. 1307–1310. [Google Scholar]
- Erdaş, B.C.; Atasoy, I.; Açici, K.; Oǧul, H. Integrating Features for Accelerometer-Based Activity Recognition. Procedia Comput. Sci. 2016, 98, 522–527. [Google Scholar] [CrossRef]
- Lara, Ó.D.; Prez, A.J.; Labrador, M.A.; Posada, J.D. Centinela: A Human Activity Recognition System Based on Acceleration and Vital Sign Data. Pervasive Mob. Comput. 2012, 8, 717–729. [Google Scholar] [CrossRef]
- Pärkkä, J.; Ermes, M.; Korpipää, P.; Mäntyjärvi, J.; Peltola, J.; Korhonen, I. Activity Classification Using Realistic Data from Wearable Sensors. IEEE Trans. Inf. Technol. Biomed. 2006, 10, 119–128. [Google Scholar] [CrossRef] [PubMed]
- Maurer, U.; Smailagic, A.; Siewiorek, D.P.; Deisher, M. Activity Recognition and Monitoring Using Multiple Sensors on Different Body Positions. In Proceedings of the International Workshop on Wearable and Implantable Body Sensor Networks (BSN’06), Cambridge, MA, USA, 3–5 April 2006. [Google Scholar]
- Reddy, S.; Mun, M.; Burke, J.; Estrin, D.; Hansen, M.; Srivastava, M. Using Mobile Phones to Determine Transportation Modes. ACM Trans. Sens. Netw. 2010, 6, 1–27. [Google Scholar] [CrossRef]
- Shoaib, M.; Bosch, S.; Incel, O.D.; Scholten, H.; Havinga, P.J.M. Complex Human Activity Recognition Using Smartphone and Wrist-Worn Motion Sensors. Sensors 2016, 16, 426. [Google Scholar] [CrossRef] [PubMed]
- Ali, H.M.; Muslim, A.M. Human Activity Recognition Using Smartphone and Smartwatch. Int. J. Comput. Eng. Res. Trends 2016, 3, 568–576. [Google Scholar] [CrossRef]
- Bajrami, G.; Derawi, M.O.; Bours, P. Towards an Automatic Gait Recognition System Using Activity Recognition (Wearable Based). In Proceedings of the 2011 Third International Workshop on Security and Communication Networks (IWSCN), Gjovik, Norway, 18–20 May 2011. [Google Scholar]
- Lara, O.D.; Labrador, M.A. A Survey on Human Activity Recognition Using Wearable Sensors. IEEE Commun. Surv. Tutor. 2012, 15, 1192–1209. [Google Scholar] [CrossRef]
- Nurhanim, K.; Elamvazuthi, I.; Izhar, L.I.; Ganesan, T. Classification of Human Activity based on Smartphone Inertial Sensor using Support Vector Machine. In Proceedings of the 2017 IEEE 3rd International Symposium in Robotics and Manufacturing Automation (ROMA), Kuala Lumpur, Malaysia, 19–21 September 2017. [Google Scholar]
- Rokach, L. Ensemble-Based Classifiers. Artif. Intell. Rev. 2010, 33, 1–39. [Google Scholar] [CrossRef]
- Breiman, L. Bagging Predictors. Mach. Learn. 1996, 24, 123–140. [Google Scholar] [CrossRef]
- Schapire, R.E.; Singer, Y. Improved Boosting Algorithms Using Confidence-Rated Predictions. Mach. Learn. 1999, 37, 297–336. [Google Scholar] [CrossRef]
- Freund, Y.; Schapire, R.E. A Desicion-Theoretic Generalization of on-Line Learning and an Application to Boosting. J. Comput. Syst. Sci. 1995, 55, 119–139. [Google Scholar] [CrossRef]
- Rodríguez, J.J.; Kuncheva, L.I.; Alonso, C.J. Rotation Forest: A New Classifier Ensemble Method. IEEE Trans. Pattern Anal. Mach. Intell. 2006, 28, 1619–1630. [Google Scholar] [CrossRef] [PubMed]
- Frank, E.; Kramer, S. Ensembles of Nested Dichotomies for Multi-Class Problems. In Proceedings of the twenty-first international conference on Machine learning, Banff, AB, Canada, 4–8 July 2004. [Google Scholar]
- Ho, T.K. The Random Subspace Method for Constructing Decision Forests. IEEE Trans. Pattern Anal. Mach. Intell. 1998, 20, 832–844. [Google Scholar]
- Amit, Y.; Geman, D. Randomized Inquiries about Shape: An Application to Handwritten Digit Recognition. Available online: http://www.dtic.mil/dtic/tr/fulltext/u2/a290812.pdf (accessed on 27 May 2018).
- Hsu, C.-W.; Chang, C.-C.; Lin, C.-J. A Practical Guide to Support Vector Classification. BJU Int. 2008, 101, 1396–1400. [Google Scholar]
- Hall, M.; Frank, E.; Holmes, G.; Pfahringer, B.; Reutemann, P.; Witten, I.H. The WEKA Data Mining Software: An Update. ACM SIGKDD Explor. Newslett. 2009, 11, 10–18. [Google Scholar] [CrossRef]
- IBM SPSS Software Ver. 20. Available online: http://www.ibm.com (accessed on 24 June 2014).
- Shao, Y.; Lunetta, R.S. Comparison of support vector machine, neural network, and CART algorithms for the land-cover classification using limited training data points. ISPRS J. Photogramm. Remote Sens. 2012, 70, 78–87. [Google Scholar] [CrossRef]
- Thanh Noi, P.; Kappas, M. Comparison of Random Forest, k-Nearest Neighbor, and Support Vector Machine Classifiers for Land Cover Classification Using Sentinel-2 Imagery. Sensors 2018, 18, 18. [Google Scholar] [CrossRef] [PubMed]
- Hasan, M.A.M.; Nasser, M.; Pal, B.; Ahmad, S. Support Vector Machine and Random Forest Modeling for Intrusion Detection System (IDS). J. Intell. Learn. Syst. Appl. 2014, 6, 45–52. [Google Scholar] [CrossRef]
- Solé, X.; Ramisa, A.; Torras, C. Evaluation of Random Forests on Large-Scale Classification Problems Using a Bag-of-Visual-Words Representation. In Artificial Intelligence Research and Development: Recent Advances and Development; Museros, L., Pujol, O., Agell, N., Eds.; IOS Press: Amsterdam, The Netherlands, 2014; pp. 273–276. [Google Scholar]
- Sheshasaayee, A.; Thailambal, G. Comparison of Classification Algorithms in Text Mining. Int. J. Pure Appl. Math. 2017, 116, 425–433. [Google Scholar]
- Bengio, Y.; Grandvalet, Y. No unbiased estimator of the variance of k-fold cross-validation. J. Mach. Learn. Res. 2004, 5, 1089–1105. [Google Scholar]
- Kim, J.H. Estimating classification error rate: Repeated cross-validation, repeated hold-out and bootstrap. Comput. Stat. Data Anal. 2009, 53, 3735–3745. [Google Scholar] [CrossRef]
- Sakr, S.; Elshawi, R.; Ahmed, A.; Qureshi, W.T.; Brawner, C.; Keteyian, S.; Blaha, M.J.; AI-Mallah, M.H. Using Machine Learning on Cardiorespiratory Fitness Data for Predicting Hypertension: The Henry Ford ExercIse Testing (FIT) Project. PLoS ONE 2018, 13, e0195344. [Google Scholar] [CrossRef] [PubMed]


| Activity Reference | Description of Activity |
|---|---|
| A1 | Walking |
| A2 | Walking upstairs |
| A3 | Walking downstairs |
| A4 | Sitting |
| A5 | Standing |
| A6 | Laying |
| Feature | Description |
|---|---|
| Min | Smallest value in the array |
| Max | Largest value in the array |
| Std | Standard deviation |
| Entropy | Signal entropy |
| Kurtosis | Kurtosis of the frequency domain signal |
| Skewness | Skewness of the frequency domain signal |
| END (Holdout) | ||||||||
|---|---|---|---|---|---|---|---|---|
| SVM | RF | |||||||
| Activity | Precision | Recall | F-measure | ROC | Precision | Recall | F-measure | ROC |
| A1 | 96.10% | 97.60% | 96.90% | 99.20% | 92.70% | 94.90% | 93.80% | 99.70% |
| A2 | 95.30% | 94.00% | 94.70% | 98.80% | 89.60% | 90.80% | 90.20% | 99.40% |
| A3 | 95.50% | 96.00% | 95.70% | 98.80% | 92.30% | 91.90% | 92.10% | 99.50% |
| A4 | 92.80% | 90.40% | 91.60% | 95.20% | 96.60% | 90.10% | 93.20% | 99.60% |
| A5 | 88.80% | 91.50% | 90.20% | 96.20% | 88.80% | 94.60% | 91.60% | 99.40% |
| A6 | 100.00% | 99.10% | 99.60% | 99.80% | 99.10% | 97.30% | 98.20% | 100.00% |
| Random Subspace (10-fold Cross-Validation) | ||||||||
|---|---|---|---|---|---|---|---|---|
| SVM | Random Forest | |||||||
| Activity | Precision | Recall | F-measure | ROC | Precision | Recall | F-measure | ROC |
| A1 | 95.60% | 97.70% | 96.70% | 99.30% | 90.30% | 95.90% | 93.10% | 99.60% |
| A2 | 95.40% | 94.80% | 95.10% | 98.70% | 92.50% | 90.00% | 91.20% | 99.30% |
| A3 | 96.60% | 94.70% | 95.70% | 98.30% | 93.80% | 90.10% | 91.90% | 99.40% |
| A4 | 93.00% | 93.90% | 93.40% | 98.20% | 96.40% | 94.20% | 95.30% | 99.80% |
| A5 | 93.50% | 92.50% | 93.00% | 98.60% | 94.10% | 95.90% | 95.00% | 99.60% |
| A6 | 99.00% | 99.40% | 99.20% | 99.80% | 98.00% | 98.20% | 98.10% | 100.00% |
| Overall Accuracy Rate | |||
|---|---|---|---|
| Holdout | |||
| Ensemble Method | SVM | RF | p-Value |
| Bagging | 93.83% | 91.62% | 0.028 |
| Adaboost | 94.24% | 94.24% | 0.917 |
| Rotation forest | 89.95% | 92.23% | 0.344 |
| END | 94.50% | 93.16% | 0.172 |
| Random subspace | 94.24% | 92.76% | 0.116 |
| Overall Accuracy Rate | |||
|---|---|---|---|
| 10-Fold Cross-Validation | |||
| Ensemble Method | SVM | Random Forest | p-Value |
| Bagging | 94.57% | 92.88% | 0.173 |
| Adaboost | 94.84% | 94.74% | 0.917 |
| Rotation forest | 90.65% | 93.65% | 0.075 |
| END | 95.14% | 94.48% | 0.249 |
| Random subspace | 95.33% | 94.08% | 0.249 |
| Random Subspace (Holdout) | ||||||
|---|---|---|---|---|---|---|
| SVM | RF | |||||
| Activity | Precision | Recall | F-measure | Precision | Recall | F-measure |
| A1 | 99.80% | 100.00% | 99.90% | 98.20% | 99.00% | 98.60% |
| A2 | 98.90% | 99.50% | 99.20% | 98.20% | 98.60% | 98.40% |
| A3 | 99.80% | 99.00% | 99.40% | 98.80% | 97.30% | 98.00% |
| A4 | 96.70% | 97.20% | 97.00% | 96.60% | 95.30% | 95.90% |
| A5 | 97.70% | 97.00% | 97.30% | 95.80% | 97.20% | 96.50% |
| A6 | 100.00% | 100.00% | 100.00% | 100.00% | 99.80% | 99.90% |
| Random Subspace (Holdout) | ||
|---|---|---|
| SVM | RF | |
| Activity | ROC | ROC |
| A1 | 1.000 | 1.000 |
| A2 | 1.000 | 1.000 |
| A3 | 1.000 | 1.000 |
| A4 | 0.995 | 0.999 |
| A5 | 0.998 | 0.999 |
| A6 | 1.000 | 1.000 |
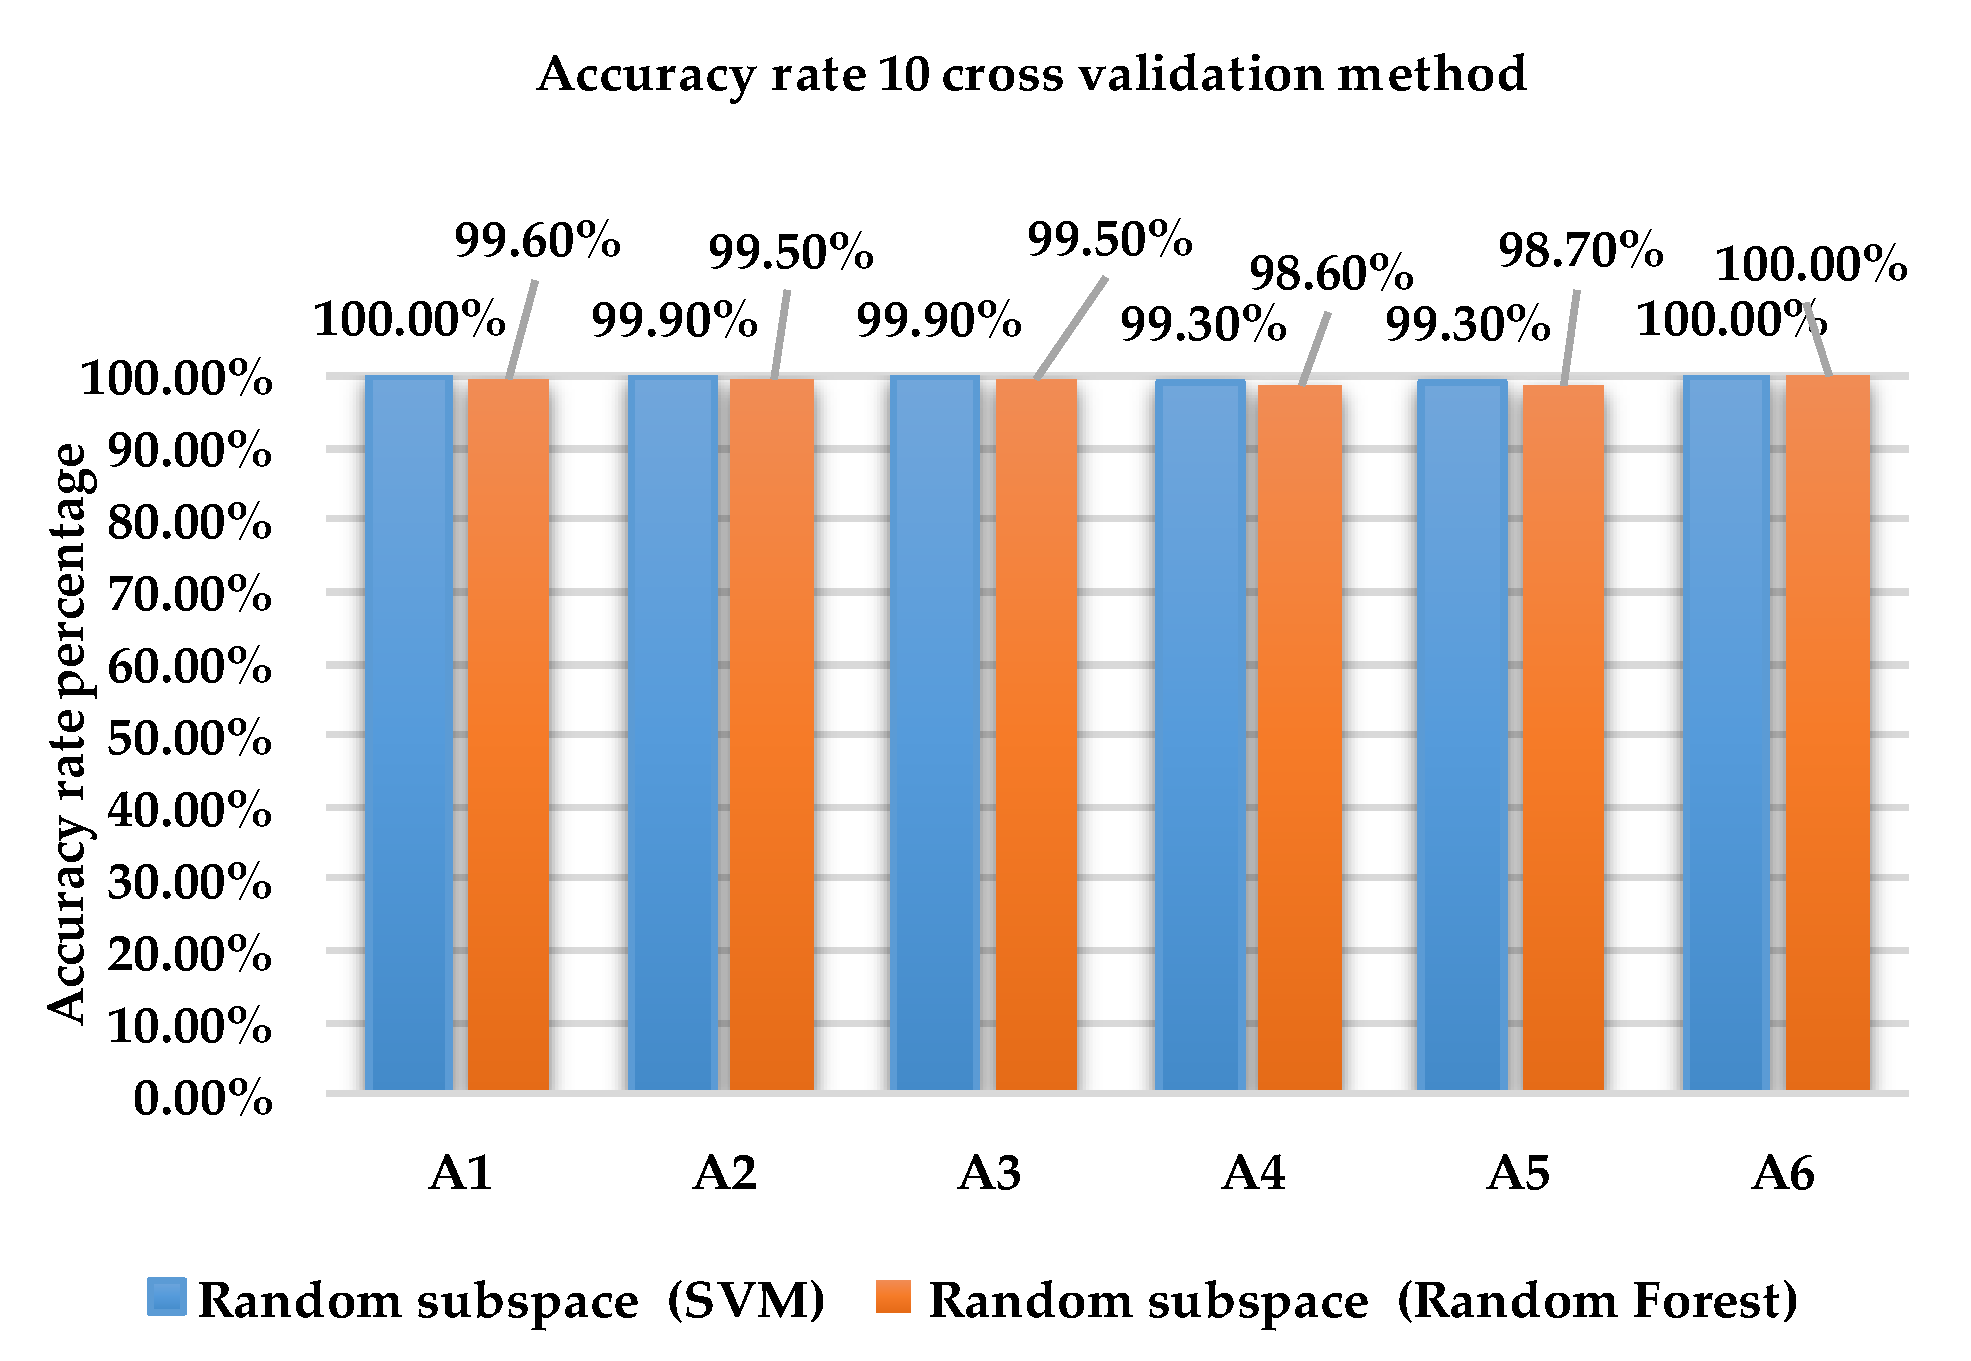
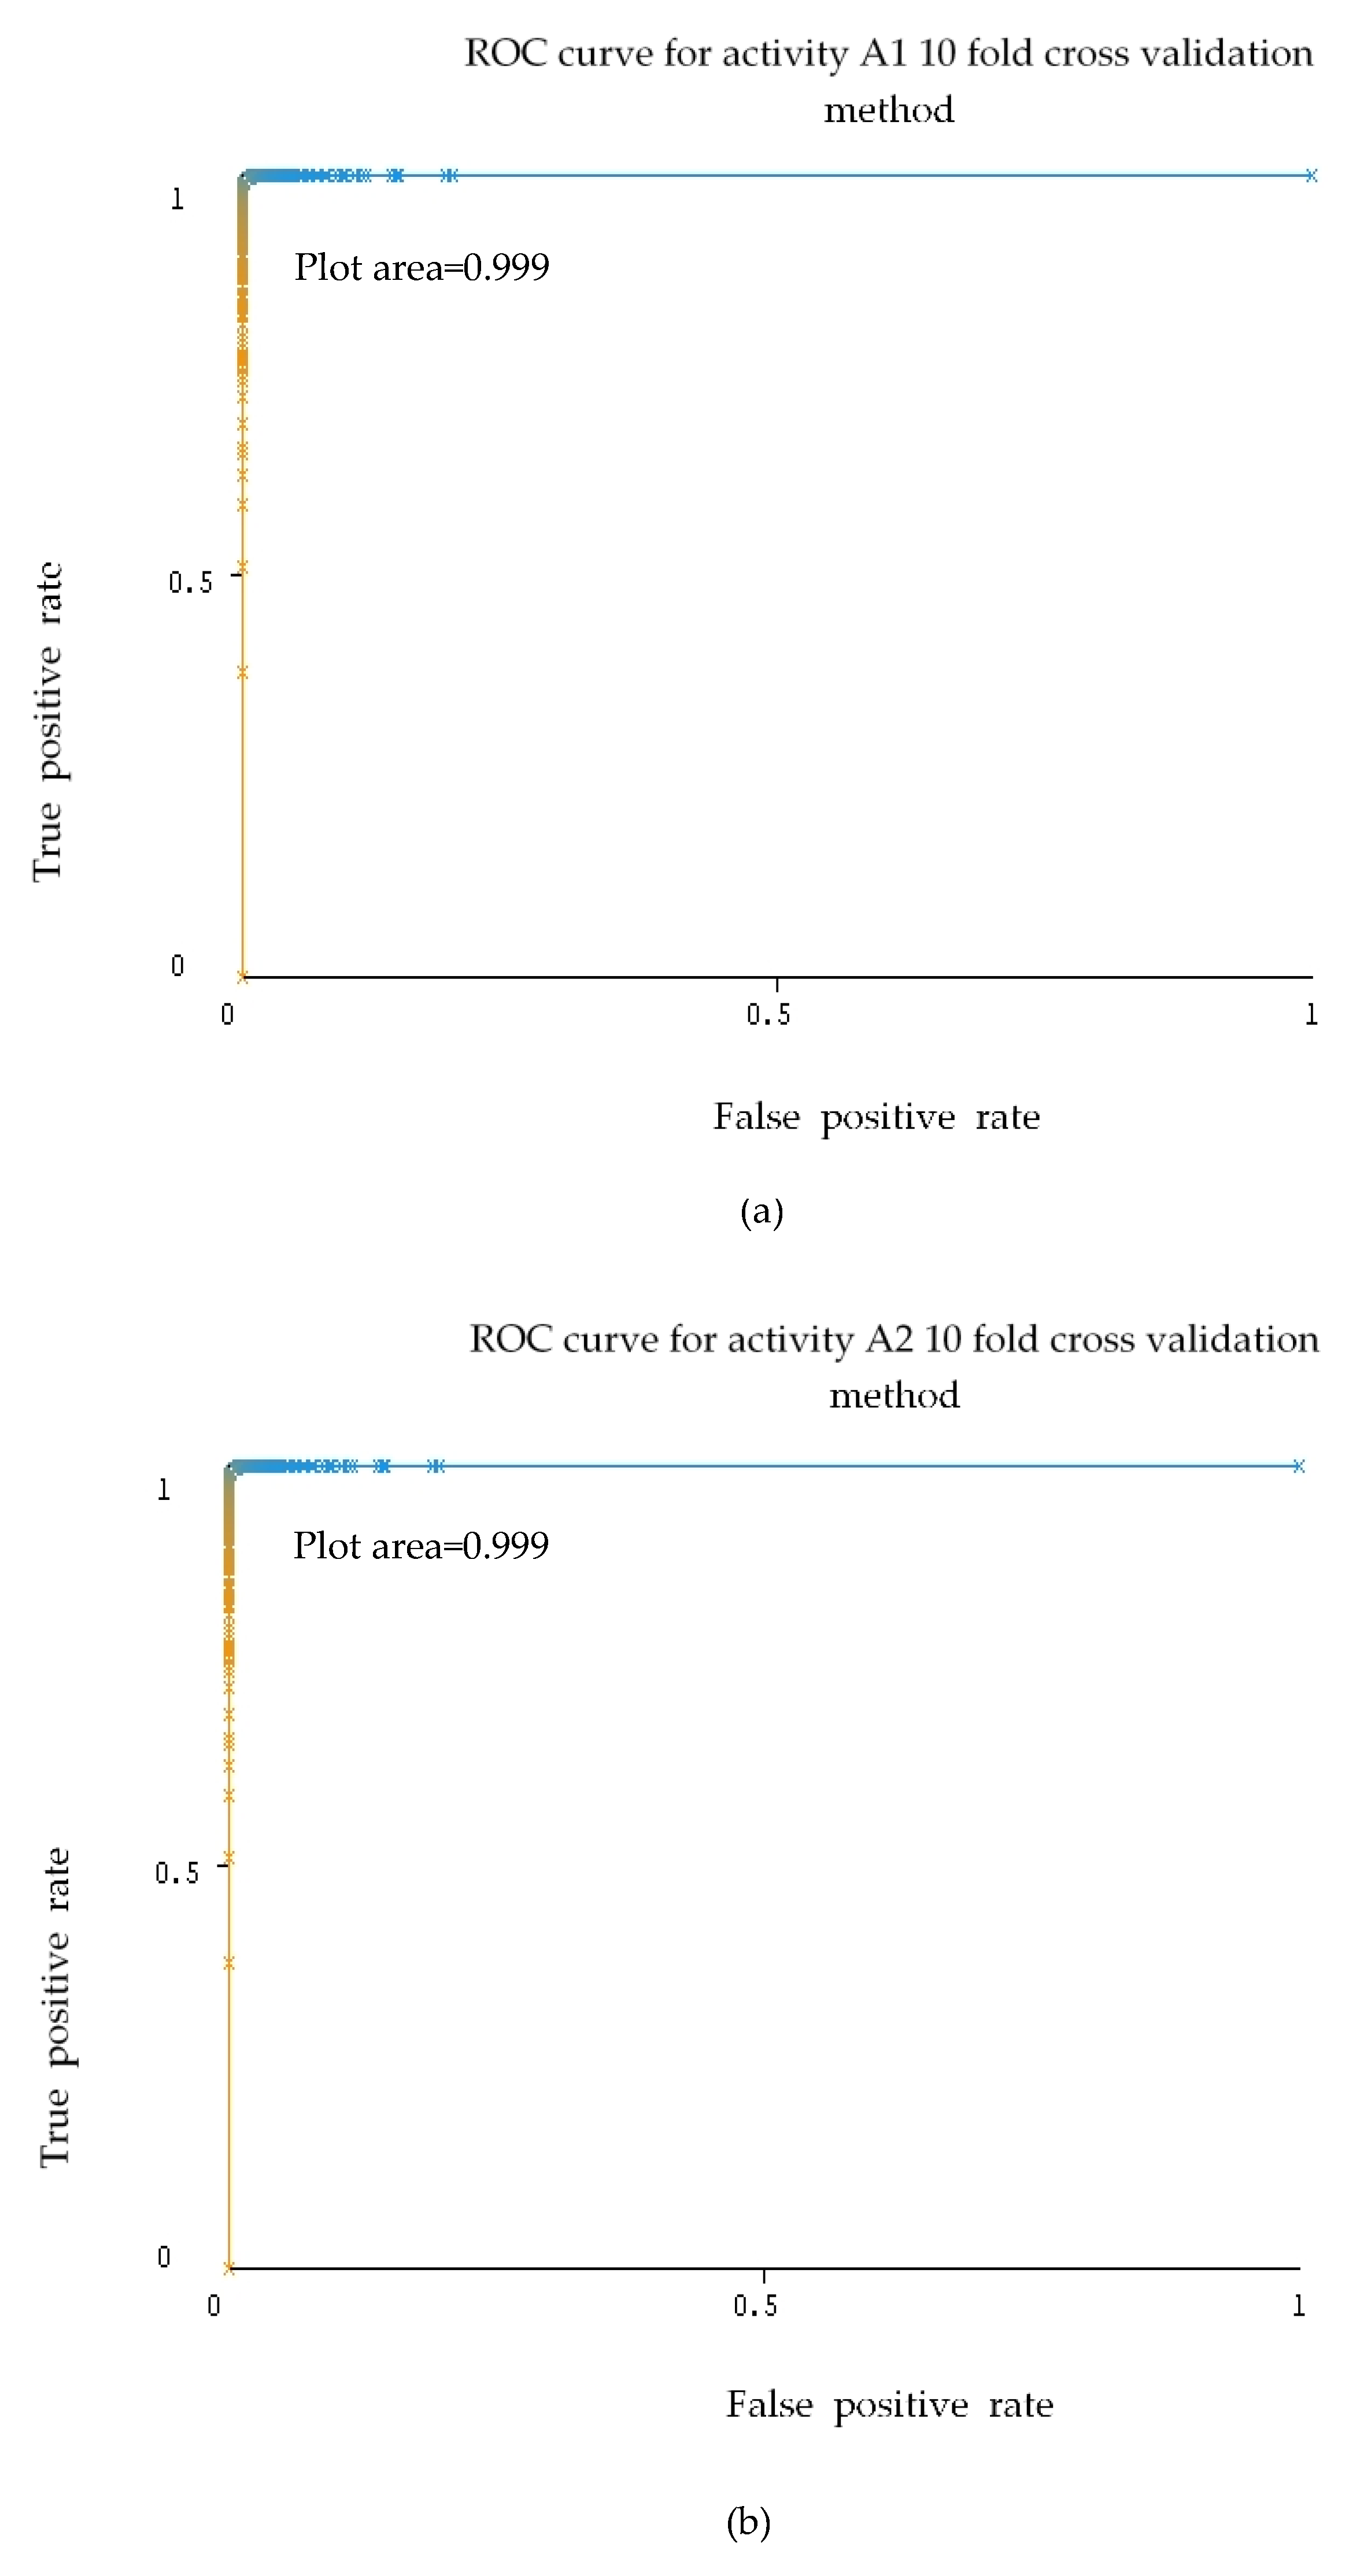
| Random Subspace (10-Fold Cross-Validation Method) | ||||||
|---|---|---|---|---|---|---|
| SVM | RF | |||||
| Activity | Precision | Recall | F-measure | Precision | Recall | F-measure |
| A1 | 99.90% | 100.00% | 100.00% | 99.90% | 98.40% | 98.70% |
| A2 | 99.70% | 99.70% | 99.70% | 97.50% | 99.20% | 98.30% |
| A3 | 99.70% | 99.80% | 99.80% | 98.50% | 97.60% | 98.00% |
| A4 | 97.90% | 98.00% | 98.00% | 97.00% | 95.20% | 96.10% |
| A5 | 98.20% | 98.10% | 98.10% | 95.60% | 97.30% | 96.40% |
| A6 | 100.00% | 100.00% | 100.00% | 100.00% | 99.80% | 99.90% |
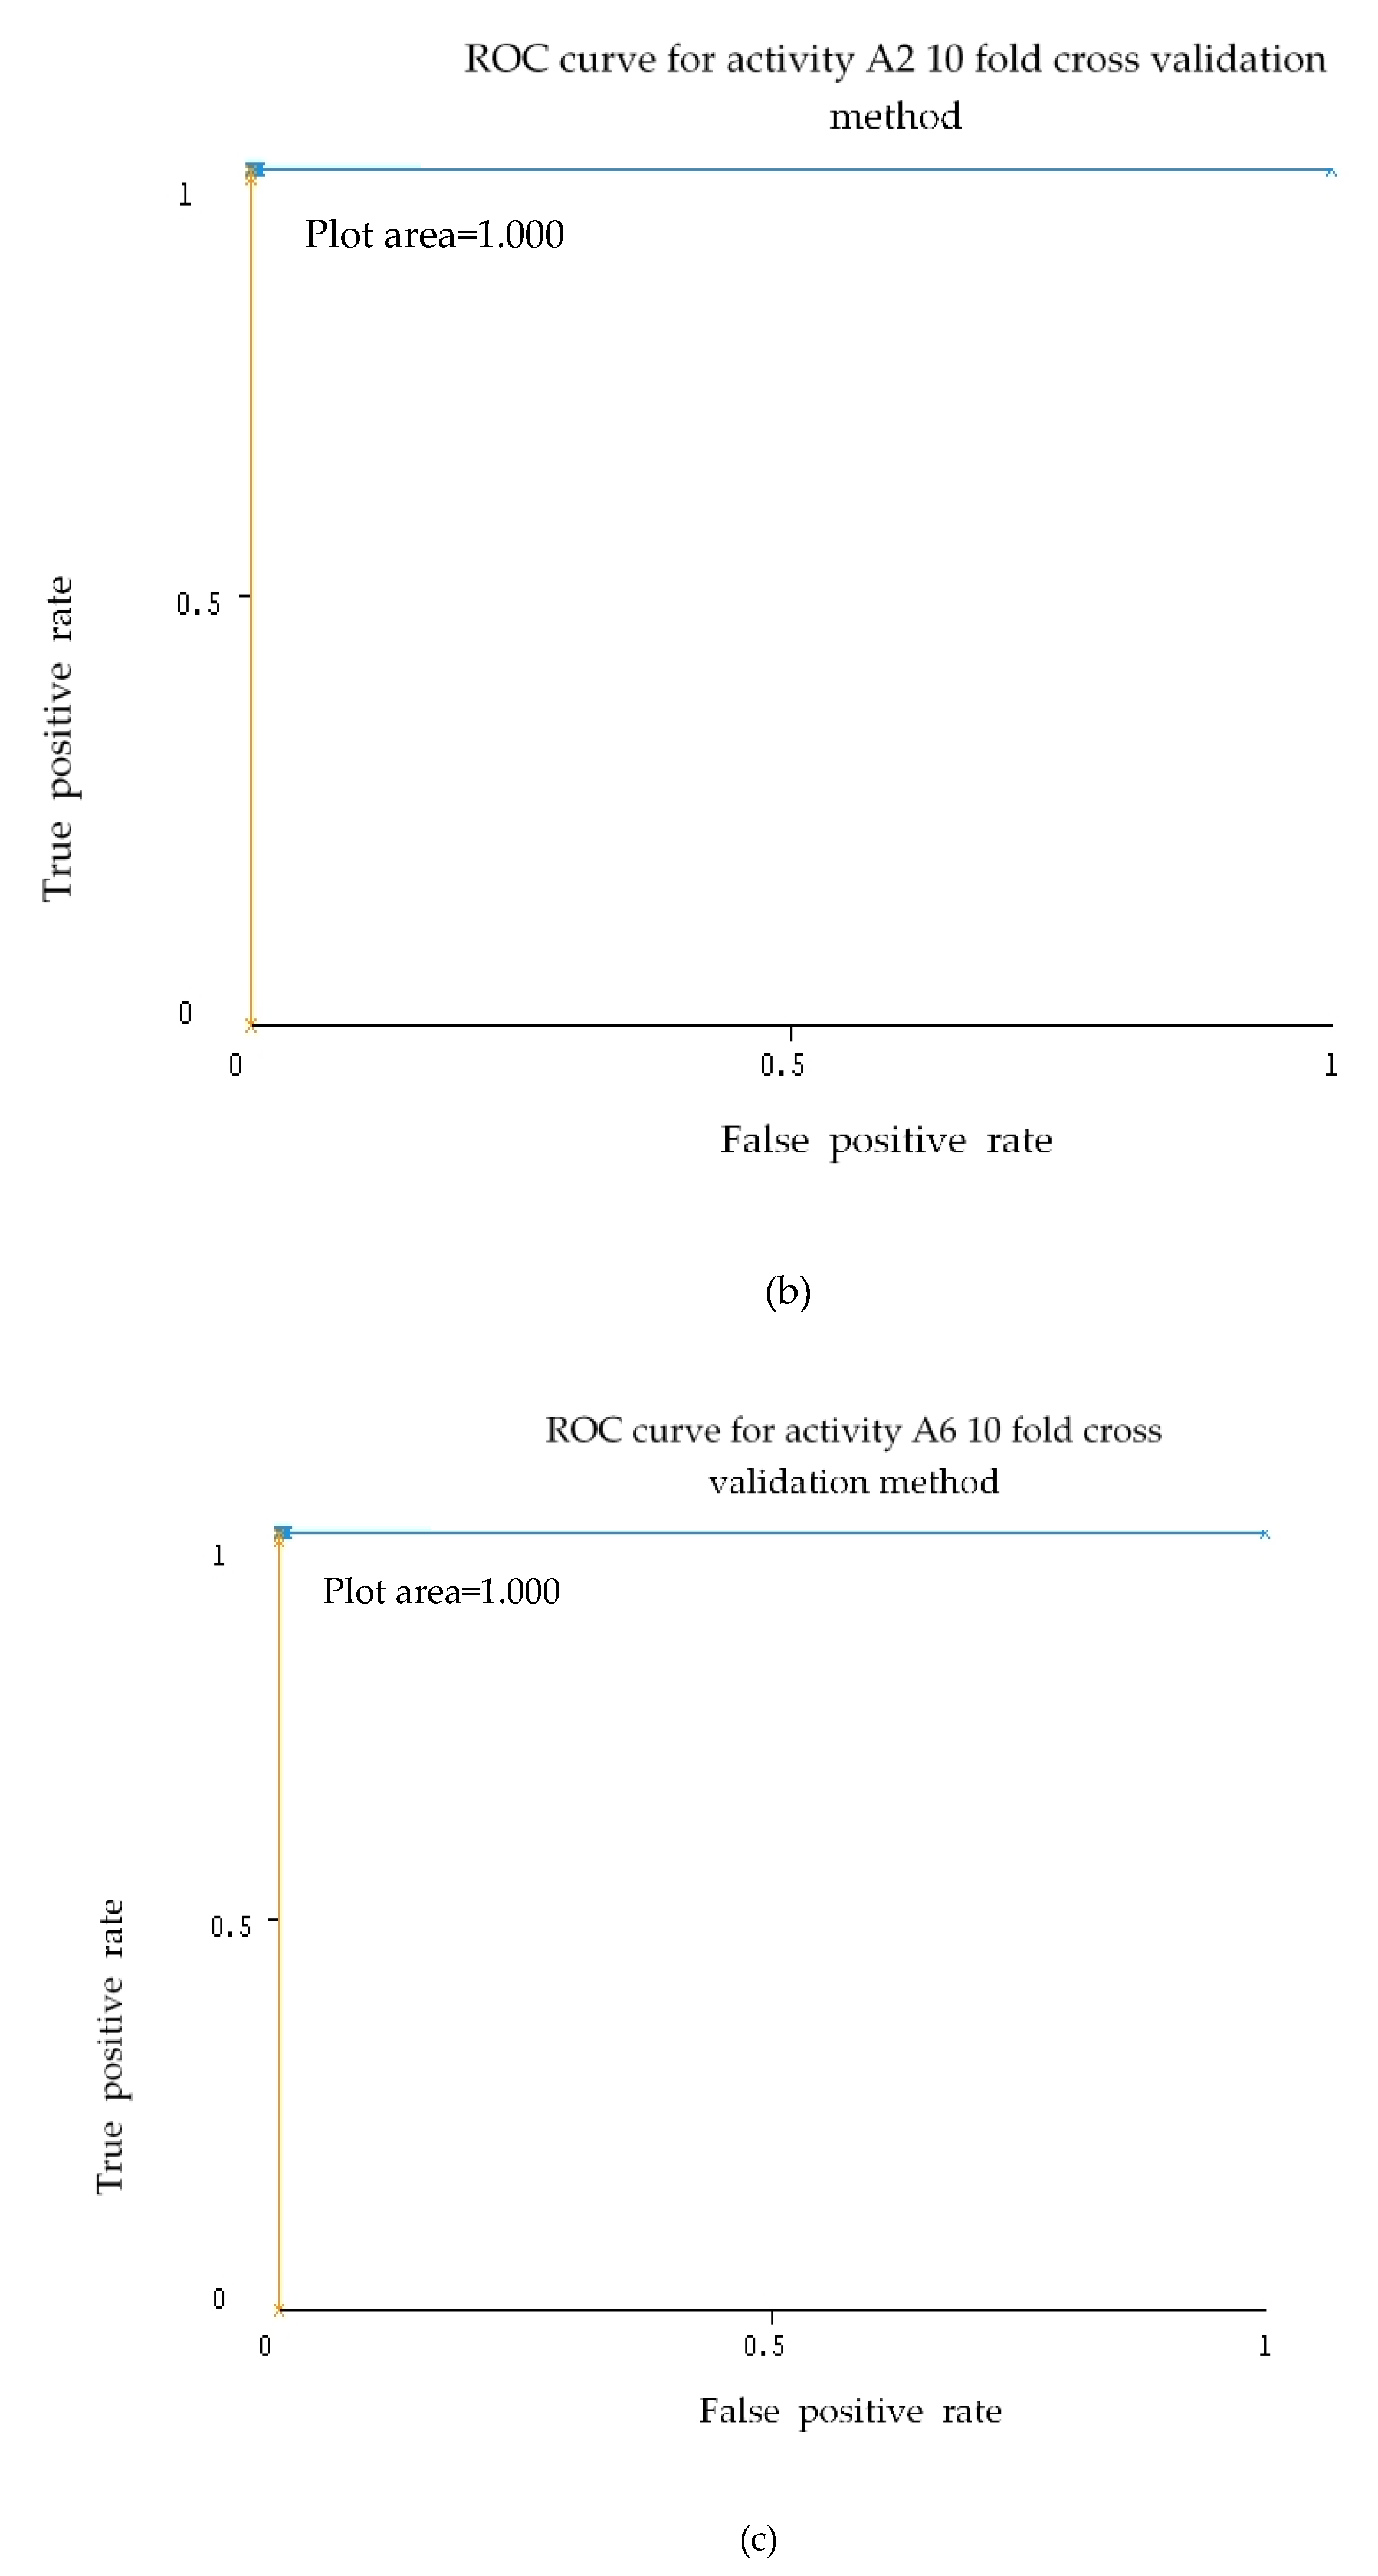
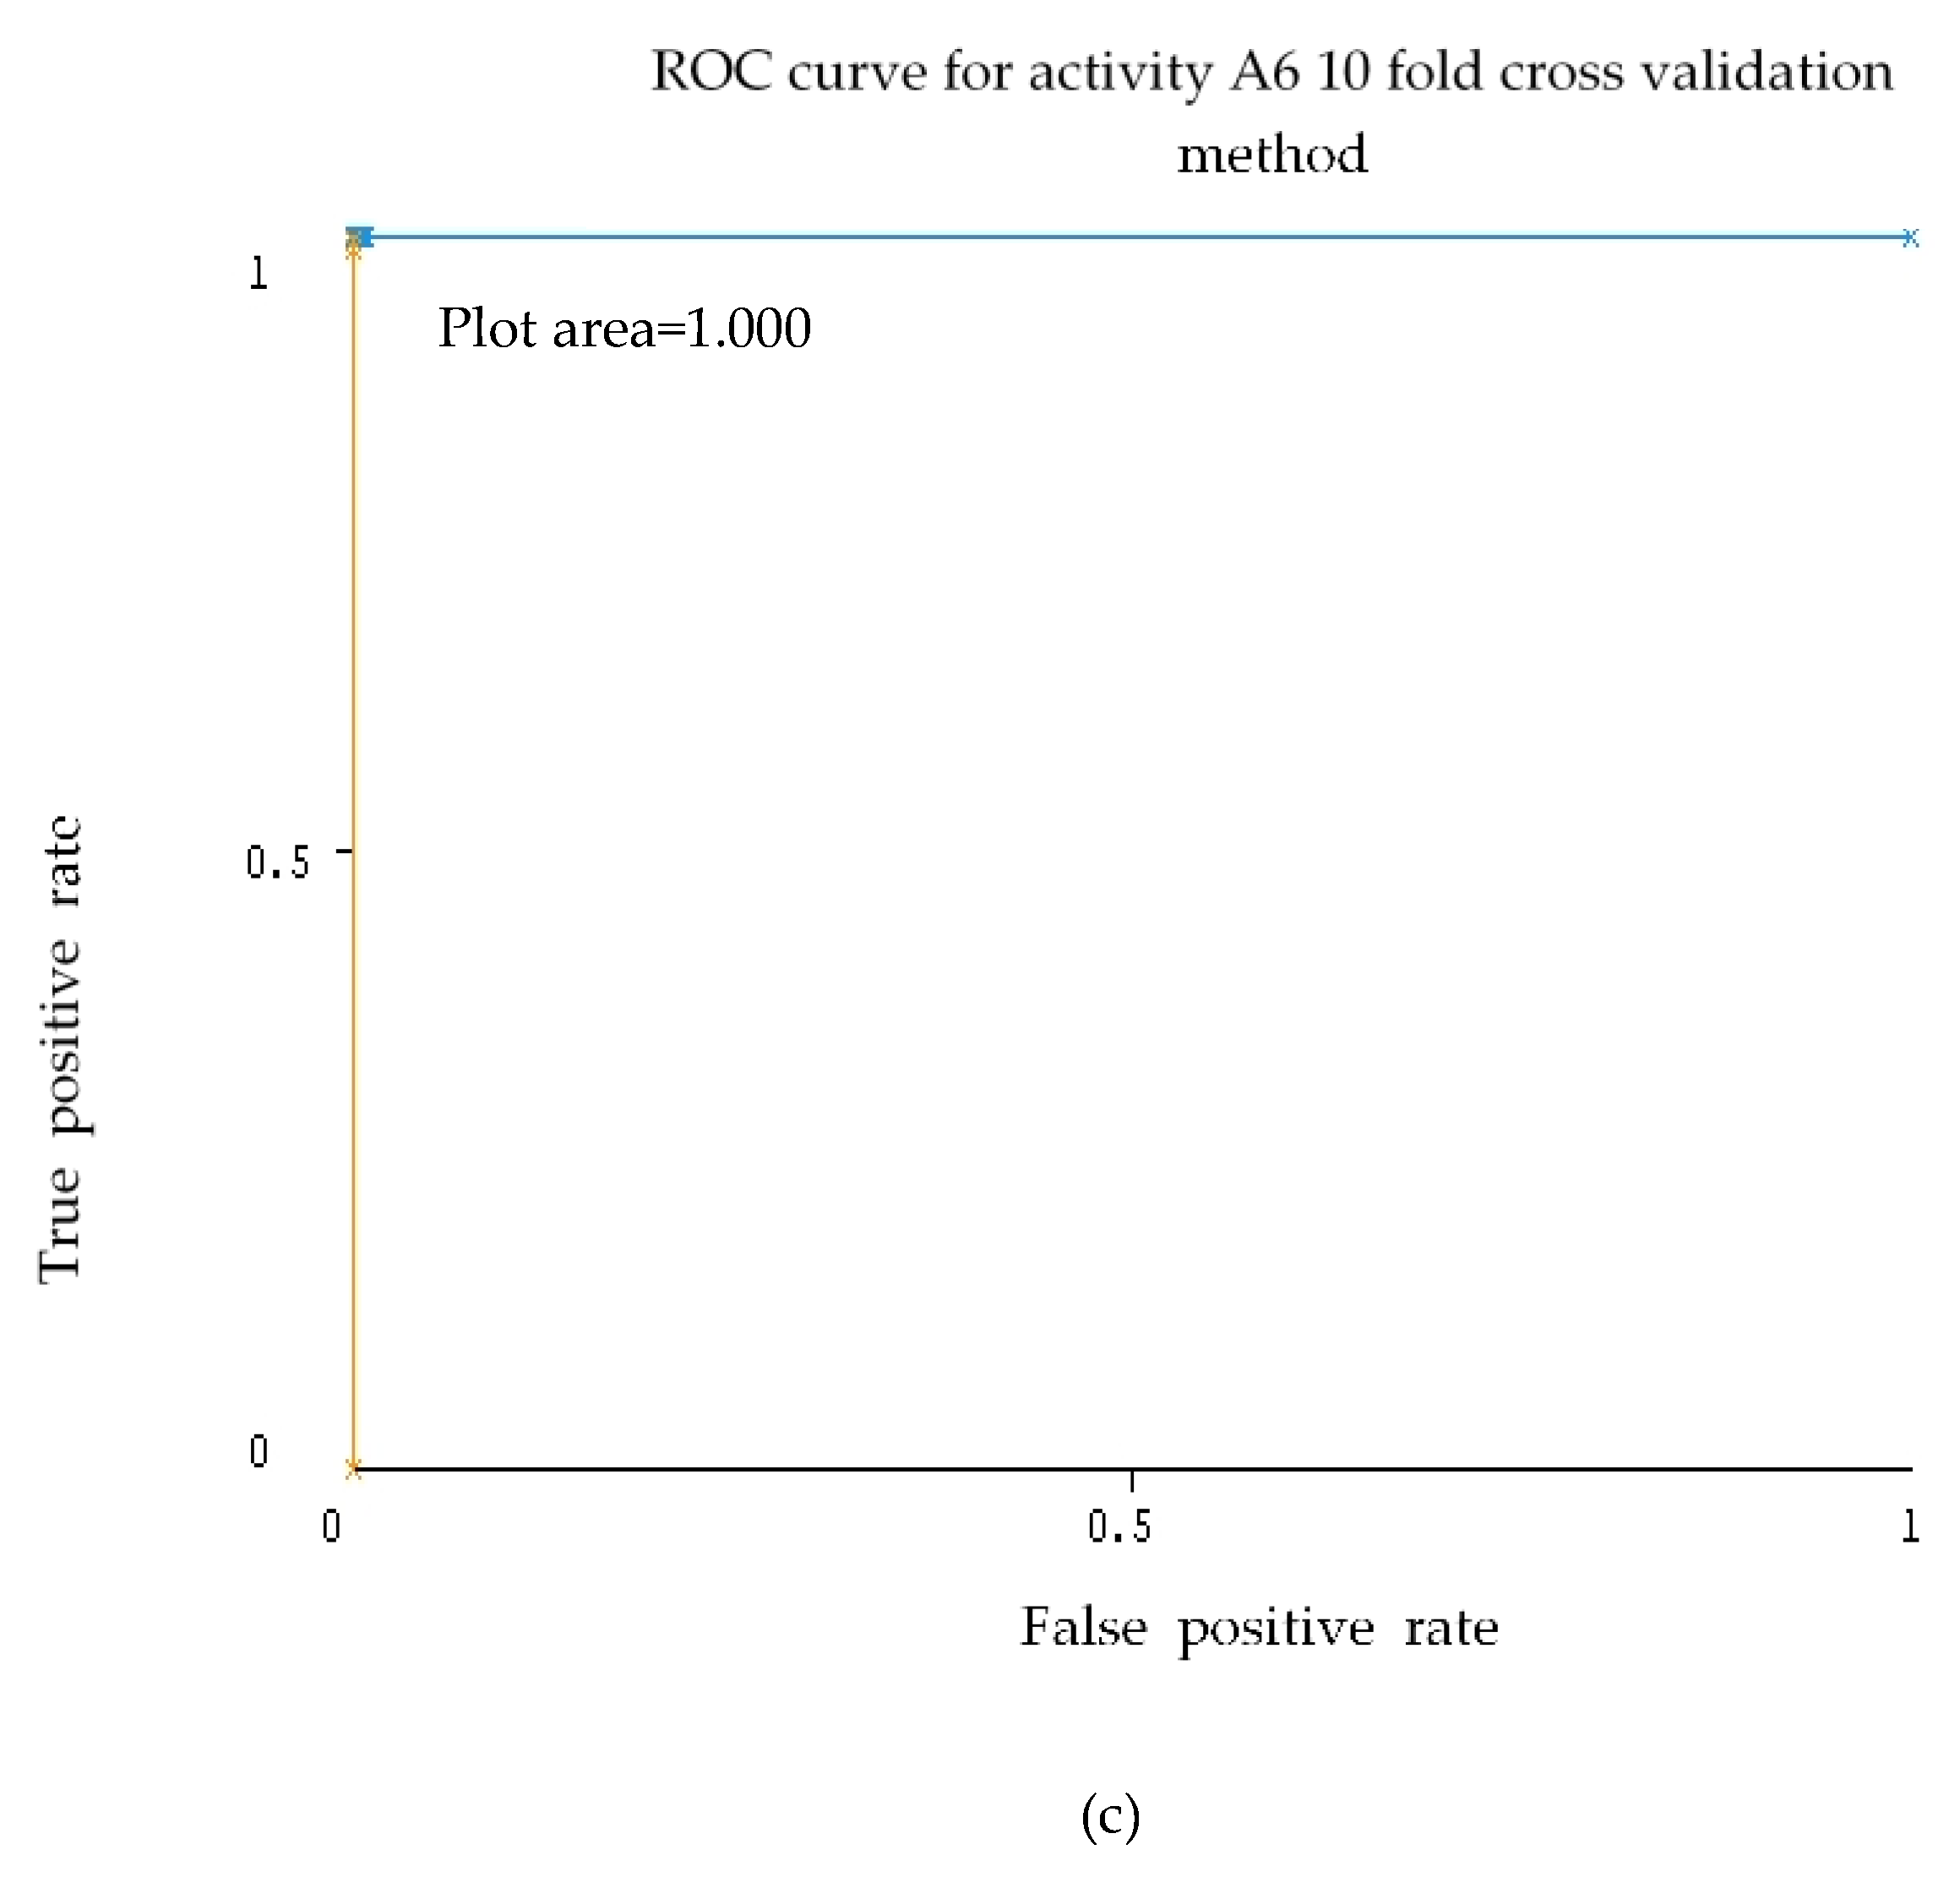
| Random Subspace (10-Fold Cross Validation) | ||
|---|---|---|
| SVM | RF | |
| Activity | ROC | ROC |
| A1 | 1.000 | 0.999 |
| A2 | 1.000 | 0.999 |
| A3 | 1.000 | 0.999 |
| A4 | 0.999 | 0.998 |
| A5 | 0.999 | 0.999 |
| A6 | 1.000 | 1.000 |
| Overall Accuracy Rate | |||
|---|---|---|---|
| Holdout | |||
| Ensemble Method | SVM | RF | p-Value |
| Bagging | 98.54% | 97.18% | 0.028 |
| Adaboost | 98.43% | 98.07% | 0.686 |
| Rotation forest | 98.07% | 98.03% | 0.893 |
| END | 98.61% | 98.03% | 0.028 |
| Random subspace | 98.74% | 97.86% | 0.028 |
| Overall Accuracy Rate | |||
|---|---|---|---|
| 10-Fold Cross-Validation | |||
| Ensemble Method | SVM | RF | p-Value |
| Bagging | 99.07% | 97.43% | 0.028 |
| Adaboost | 99.17% | 98.82% | 0.028 |
| Rotation forest | 98.43% | 98.22% | 0.249 |
| END | 99.20% | 98.28% | 0.028 |
| Random subspace | 99.22% | 97.91% | 0.028 |
| Reference | Evaluation Method | Dataset | Classification Method | Overall Accuracy Rate |
|---|---|---|---|---|
| Proposed classifier | 10-fold Cross-validation | 10,000 samples | Random subspace-SVM | 99.22% |
| Proposed classifier | Holdout | 10,000 samples | Random subspace-SVM | 98.74% |
| Ronao and Cho (2017) [21] | 10-fold Cross-validation | 10,000 samples | Two stages of continuous Hidden Markov model | 93.18% |
| Anguita et al. (2013) [25] | Holdout | 10,000 samples | OVA MC-SVM-Gaussian kernel | 96.5% |
| Romero-Paredes et al. (2013) [24] | Holdout | 10,000 samples | OVO MC-SVM-Linear Kernel majority voting | 96.40% |
| Kastner et al. (2013) [23] | Holdout | 10,000 samples | Kernel generalized learning vector quantization | 96.23% |
© 2018 by the authors. Licensee MDPI, Basel, Switzerland. This article is an open access article distributed under the terms and conditions of the Creative Commons Attribution (CC BY) license (http://creativecommons.org/licenses/by/4.0/).
Share and Cite
Ku Abd. Rahim, K.N.; Elamvazuthi, I.; Izhar, L.I.; Capi, G. Classification of Human Daily Activities Using Ensemble Methods Based on Smartphone Inertial Sensors. Sensors 2018, 18, 4132. https://doi.org/10.3390/s18124132
Ku Abd. Rahim KN, Elamvazuthi I, Izhar LI, Capi G. Classification of Human Daily Activities Using Ensemble Methods Based on Smartphone Inertial Sensors. Sensors. 2018; 18(12):4132. https://doi.org/10.3390/s18124132
Chicago/Turabian StyleKu Abd. Rahim, Ku Nurhanim, I. Elamvazuthi, Lila Iznita Izhar, and Genci Capi. 2018. "Classification of Human Daily Activities Using Ensemble Methods Based on Smartphone Inertial Sensors" Sensors 18, no. 12: 4132. https://doi.org/10.3390/s18124132
APA StyleKu Abd. Rahim, K. N., Elamvazuthi, I., Izhar, L. I., & Capi, G. (2018). Classification of Human Daily Activities Using Ensemble Methods Based on Smartphone Inertial Sensors. Sensors, 18(12), 4132. https://doi.org/10.3390/s18124132