Spectroscopic Analysis of Melatonin in the Terahertz Frequency Range

 , ,
, , 
Abstract
1. Introduction
2. Materials
3. Methods
4. Results and Discussion
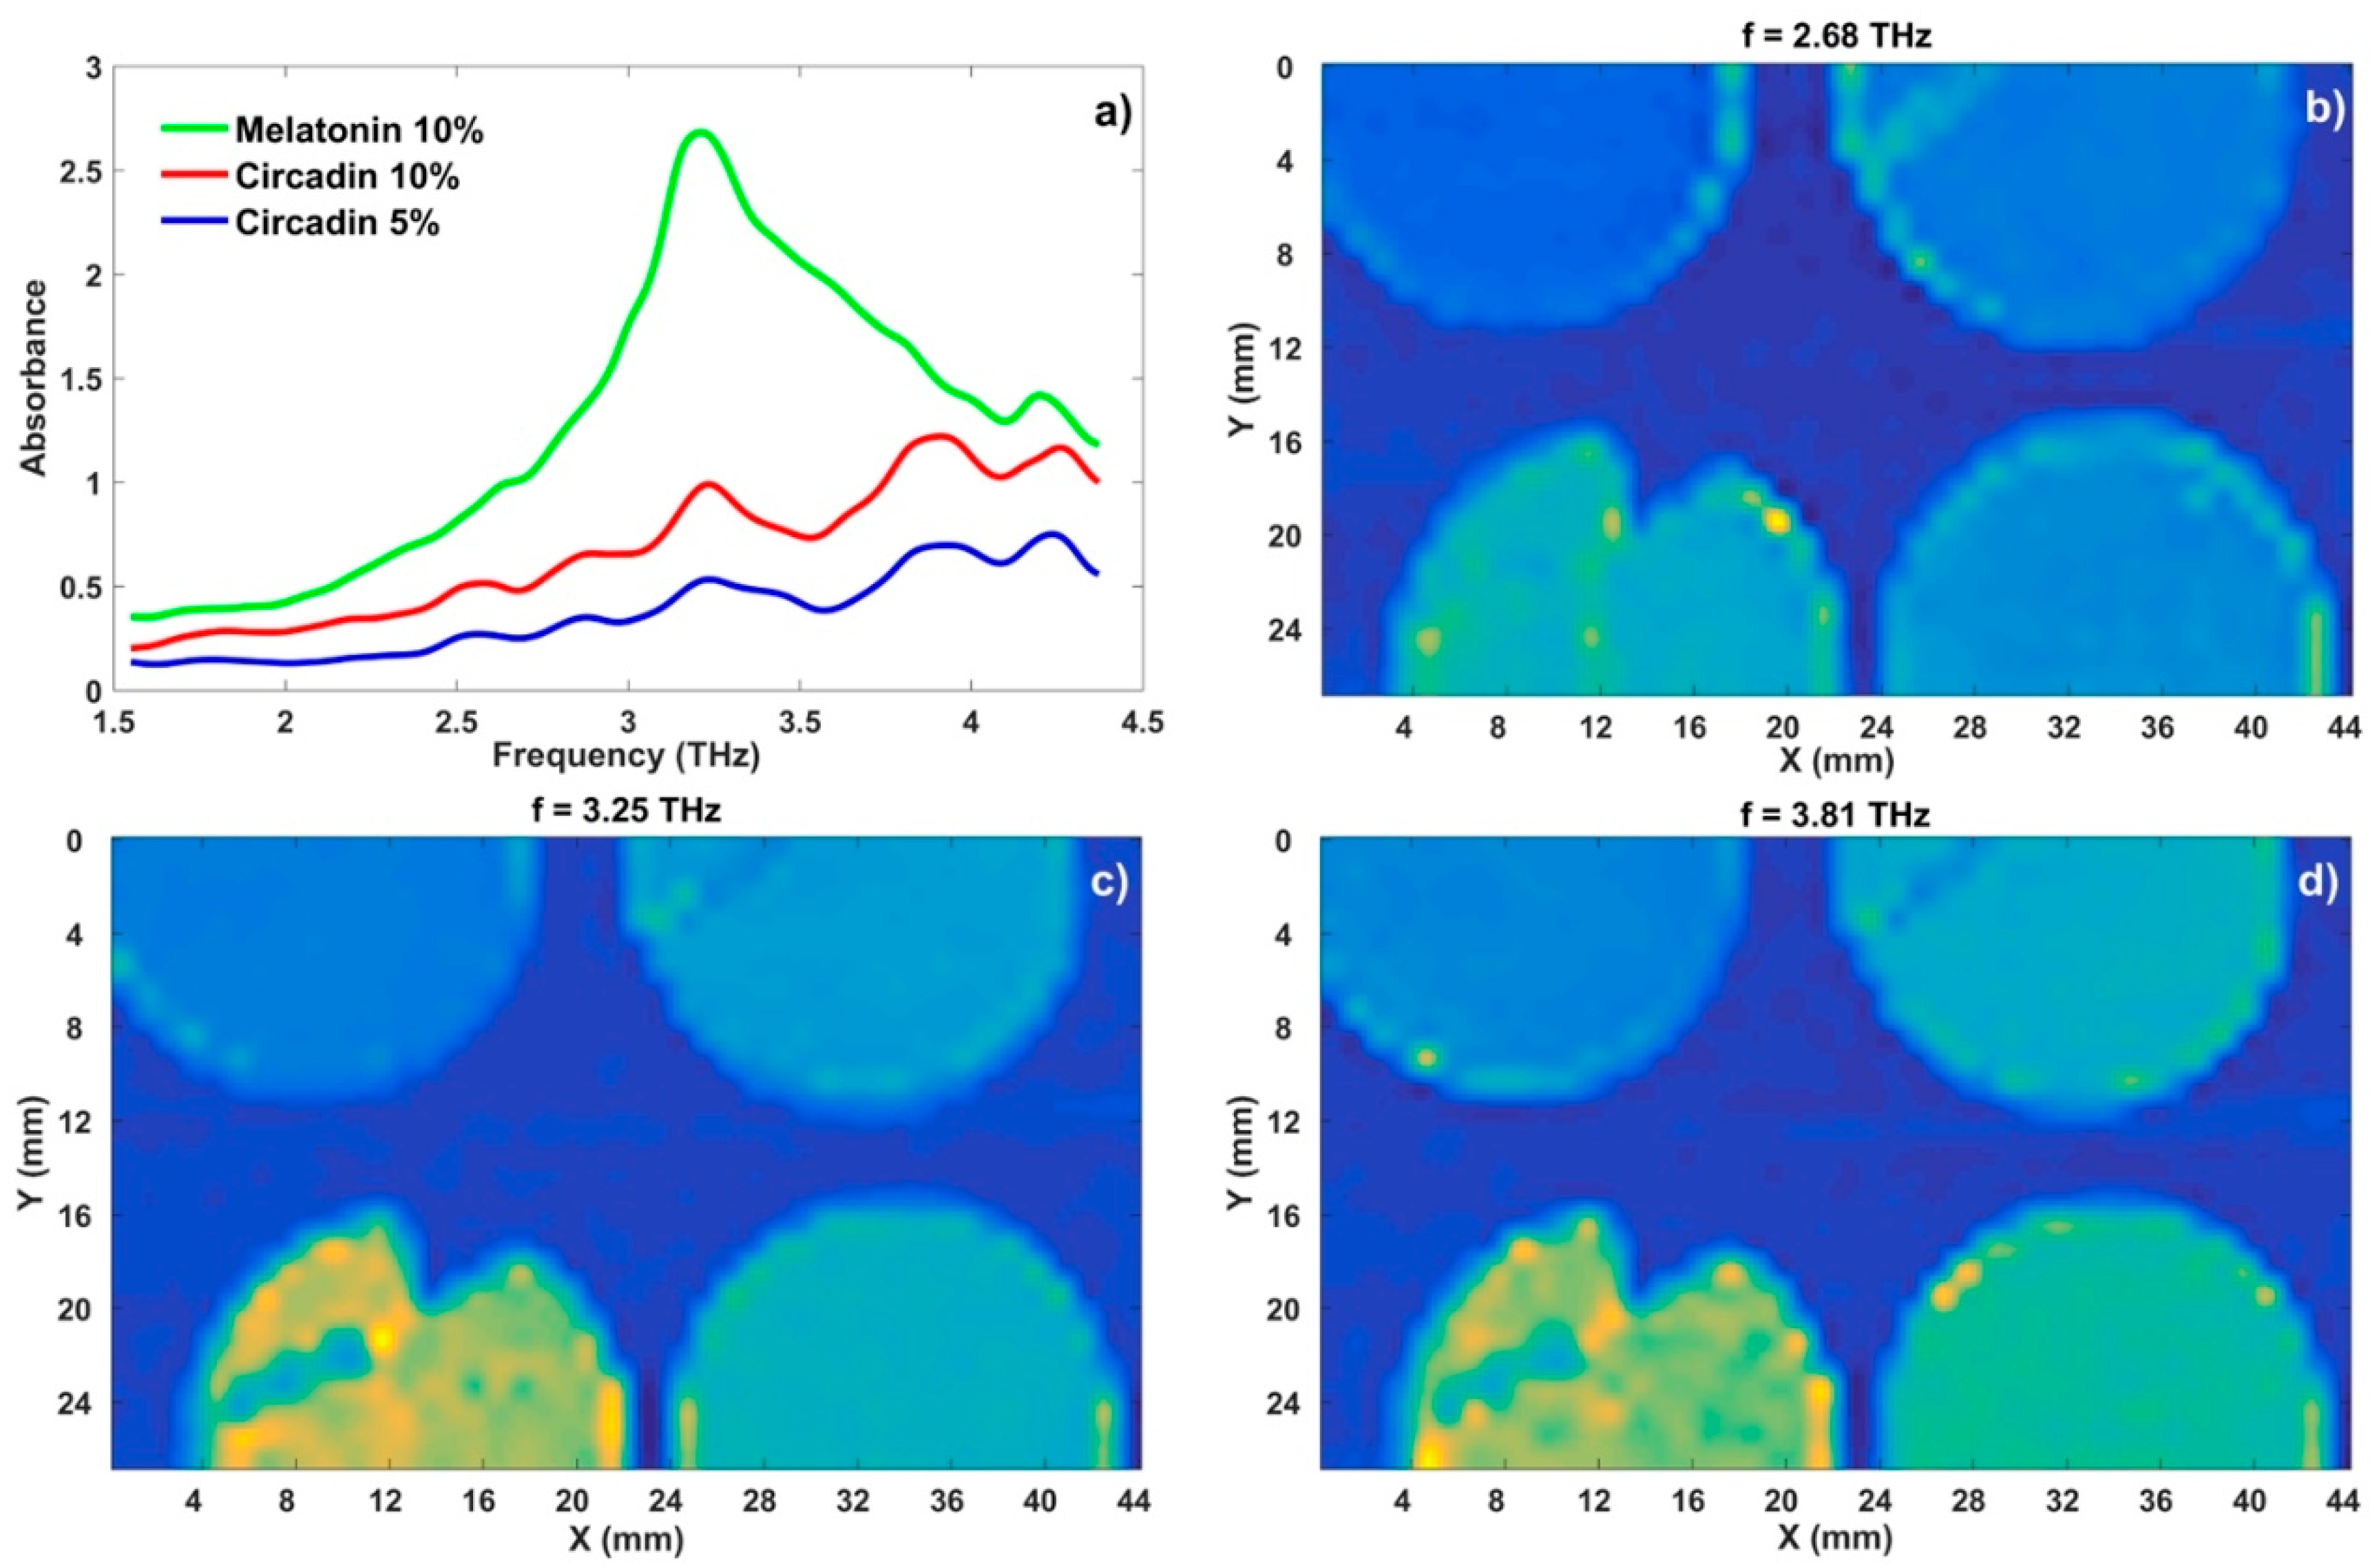
4.1. THz Spectroscopy Analysis
4.2. THz Imaging Analysis
5. Conclusions
Supplementary Materials
Supplementary File 1Author Contributions
Funding
Acknowledgments
Conflicts of Interest
References
- Görög, S. Advances in the analysis of steroid hormone drugs in pharmaceuticals and environmental samples (2004–2010). J. Pharm. Biomed. Anal. 2011, 55, 728–743. [Google Scholar] [CrossRef] [PubMed]
- Surmeian, M.; Aboul-Enein, H.Y. Simultaneous Analysis of Pyridoxine and Melatonin in Tablet Formulation by Derivative Ultraviolet Spectroscopy. Anal. Lett. 1998, 31, 1731–1741. [Google Scholar] [CrossRef]
- Ball, A.T.; Patel, B.A. Rapid voltammetric monitoring of melatonin in the presence of tablet excipients. Electrochim. Acta 2012, 83, 196–201. [Google Scholar] [CrossRef]
- Attar, A.L.; Redekar, M.P.; Jadhav, N.R. Estimation of Progesterone in Oil based Injection by UV-Visible Spectroscopy. J. Curr. Pharma Res. 2016, 6, 1825–1829. [Google Scholar]
- Sievänen, E.; Kolehmainen, E. High-Resolution Solid-State NMR Spectroscopy of Steroids and Their Derivatives. Appl. Spectrosc. Rev. 2013, 48, 50–76. [Google Scholar] [CrossRef]
- Florio, G.M.; Zwier, T.S. Solvation of a Flexible Biomolecule in the Gas Phase: The Ultraviolet and Infrared Spectroscopy of Melatonin−Water Clusters. J. Phys. Chem. A 2003, 107, 974–983. [Google Scholar] [CrossRef]
- Cherkasova, O.P.; Milekhin, A.G.; Milekhin, I.A.; Kuznetsov, S.A.; Rodyakina, E.E.; Latyshev, A.V. Application of surface-enhanced infrared spectroscopy for steroids analysis. In Proceedings of the 2016 International Conference Laser Optics (LO), St. Petersburg, Russia, 27 June–1 July 2016. [Google Scholar]
- Smirnova, I.N.; Sapozhnikov, D.A.; Kargovsky, A.V.; Volodin, V.A.; Cherkasova, O.P.; Bocquet, R.; Shkurinov, A.P. Lowest-lying vibrational signatures in corticosteroids studied by terahertz time-domain and Raman spectroscopies. Vib. Spectrosc. 2012, 62, 238–247. [Google Scholar] [CrossRef]
- Álvarez, R.M.S.; Farías, R.N.; Hildebrandt, P. Comparative vibrational analysis of thyronine hormones using infrared and Raman spectroscopy and density functional theory calculations. J. Raman Spectrosc. 2004, 35, 947–955. [Google Scholar] [CrossRef]
- Singh, G.; Abbas, J.M.; Dogra, S.D.; Sachdeva, R.; Rai, B.; Tripathi, S.K.; Prakash, S.; Sathe, V.; Saini, G.S.S. Vibrational and electronic spectroscopic studies of melatonin. Spectrochim. Acta A. Mol. Biomol. Spectrosc. 2014, 118, 73–81. [Google Scholar] [CrossRef] [PubMed]
- Zheng, B.; Li, W.; Li, H.; Liu, L.; Lei, P.; Ge, X.; Yu, Z.; Zhou, Y. Separation and determination of estrogen in the water environment by high performance liquid chromatography-fourier transform infrared spectroscopy. Sci. Rep. 2016, 6, 32264. [Google Scholar] [CrossRef] [PubMed]
- Kasalynas, I.; Venckevicius, R.; Valusis, G. Continuous Wave Spectroscopic Terahertz Imaging with InGaAs Bow-Tie Diodes at Room Temperature. IEEE Sens. J. 2013, 13, 50–54. [Google Scholar] [CrossRef]
- Jiusheng, L. Optical Parameters of Vegetable Oil Studied by Terahertz Time-Domain Spectroscopy. Appl. Spectrosc. 2010, 64, 231–234. [Google Scholar] [CrossRef] [PubMed]
- Wallace, V.P.; Fitzgerald, A.J.; Pickwell, E.; Pye, R.J.; Taday, P.F.; Flanagan, N.; Ha, T. Terahertz Pulsed Spectroscopy of Human Basal Cell Carcinoma. Appl. Spectrosc. 2006, 60, 1127–1133. [Google Scholar] [CrossRef] [PubMed]
- Abina, A.; Puc, U.; Jeglič, A.; Zidanšek, A. Structural analysis of insulating polymer foams with terahertz spectroscopy and imaging. Polym. Test. 2013, 32, 739–747. [Google Scholar] [CrossRef]
- Kašalynas, I.; Venckevičius, R.; Minkevičius, L.; Sešek, A.; Wahaia, F.; Tamošiūnas, V.; Voisiat, B.; Seliuta, D.; Valušis, G.; Švigelj, A.; et al. Spectroscopic Terahertz Imaging at Room Temperature Employing Microbolometer Terahertz Sensors and Its Application to the Study of Carcinoma Tissues. Sensors 2016, 16, 432. [Google Scholar] [CrossRef] [PubMed]
- Yurchenko, S.O.; Zaytsev, K.I. Spectroscopy of Nafion in terahertz frequency range. J. Appl. Phys. 2014, 116, 113508. [Google Scholar] [CrossRef]
- Ney, M.; Abdulhalim, I. Modeling of reflectometric and ellipsometric spectra from the skin in the terahertz and submillimeter waves region. J. Biomed. Opt. 2011, 16, 067006. [Google Scholar] [CrossRef] [PubMed]
- Ajito, K. Terahertz Spectroscopy for Pharmaceutical and Biomedical Applications. IEEE Trans. Terahertz Sci. Technol. 2015, 5, 1140–1145. [Google Scholar]
- Ewing, A.V.; Kazarian, S.G. Recent advances in the applications of vibrational spectroscopic imaging and mapping to pharmaceutical formulations. Spectrochim. Acta. A. Mol. Biomol. Spectrosc. 2018, 197, 10–29. [Google Scholar] [CrossRef] [PubMed]
- Zeitler, J.A. Pharmaceutical Terahertz Spectroscopy and Imaging. In Analytical Techniques in the Pharmaceutical Sciences; Müllertz, A., Perrie, Y., Rades, T., Eds.; Advances in Delivery Science and Technology; Springer: New York, NY, USA, 2016; pp. 171–222. ISBN 978-1-4939-4029-5. [Google Scholar]
- Bawuah, P.; Tan, N.; Tweneboah, S.N.A.; Ervasti, T.; Axel Zeitler, J.; Ketolainen, J.; Peiponen, K.-E. Terahertz study on porosity and mass fraction of active pharmaceutical ingredient of pharmaceutical tablets. Eur. J. Pharm. Biopharm. 2016, 105, 122–133. [Google Scholar] [CrossRef] [PubMed]
- Karaliūnas, M.; Venckevičius, R.; Kašalynas, I.; Puc, U.; Abina, A.; Jeglič, A.; Zidanšek, A.; Valušis, G. Investigation of pharmaceutical drugs and caffeine-containing foods using Fourier and terahertz time-domain spectroscopy. In Proceedings of the Terahertz Emitters, Receivers, and Applications VI, San Diego, CA, USA, 31 August 2015; Volume 9585, p. 95850U. [Google Scholar]
- Zhao, G.; Wang, H.; Liu, L.; Wang, X. THz spectra of parabens at low temperature. Sci. China Inf. Sci. 2012, 55, 114–119. [Google Scholar] [CrossRef]
- Ajito, K.; Ueno, Y.; Song, H.-J.; Tamechika, E.; Kukutsu, N. Terahertz Spectroscopic Imaging of Polymorphic Forms in Pharmaceutical Crystals. Mol. Cryst. Liq. Cryst. 2011, 538, 33–38. [Google Scholar] [CrossRef]
- Chieng, N.; Rades, T.; Aaltonen, J. An overview of recent studies on the analysis of pharmaceutical polymorphs. J. Pharm. Biomed. Anal. 2011, 55, 618–644. [Google Scholar] [CrossRef] [PubMed]
- Pindelska, E.; Sokal, A.; Kolodziejski, W. Pharmaceutical cocrystals, salts and polymorphs: Advanced characterization techniques. Adv. Drug Deliv. Rev. 2017, 117, 111–146. [Google Scholar] [CrossRef] [PubMed]
- Strachan, C.J.; Rades, T.; Newnham, D.A.; Gordon, K.C.; Pepper, M.; Taday, P.F. Using terahertz pulsed spectroscopy to study crystallinity of pharmaceutical materials. Chem. Phys. Lett. 2004, 390, 20–24. [Google Scholar] [CrossRef]
- Zeitler, J.A.; Kogermann, K.; Rantanen, J.; Rades, T.; Taday, P.F.; Pepper, M.; Aaltonen, J.; Strachan, C.J. Drug hydrate systems and dehydration processes studied by terahertz pulsed spectroscopy. Int. J. Pharm. 2007, 334, 78–84. [Google Scholar] [CrossRef] [PubMed]
- Takahashi, M.; Ishikawa, Y. Translational vibrations between chains of hydrogen-bonded molecules in solid-state aspirin form I. Chem. Phys. Lett. 2013, 576, 21–25. [Google Scholar] [CrossRef]
- Ney, M.; Abdulhalim, I. Does human skin truly behave as an array of helical antennae in the millimeter and terahertz wave ranges? Opt. Lett. 2010, 35, 3180. [Google Scholar] [CrossRef] [PubMed]
- Delaney, S.P.; Pan, D.; Galella, M.; Yin, S.X.; Korter, T.M. Understanding the Origins of Conformational Disorder in the Crystalline Polymorphs of Irbesartan. Cryst. Growth Des. 2012, 12, 5017–5024. [Google Scholar] [CrossRef]
- Kawase, K.; Ogawa, Y.; Watanabe, Y.; Inoue, H. Non-destructive terahertz imaging of illicit drugs using spectral fingerprints. Opt. Express 2003, 11, 2549–2554. [Google Scholar] [CrossRef] [PubMed]
- Charron, D.M.; Ajito, K.; Kim, J.-Y.; Ueno, Y. Chemical Mapping of Pharmaceutical Cocrystals Using Terahertz Spectroscopic Imaging. Anal. Chem. 2013, 85, 1980–1984. [Google Scholar] [CrossRef] [PubMed]
- Sakamoto, T.; Portieri, A.; Arnone, D.D.; Taday, P.F.; Kawanishi, T.; Hiyama, Y. Coating and Density Distribution Analysis of Commercial Ciprofloxacin Hydrochloride Monohydrate Tablets by Terahertz Pulsed Spectroscopy and Imaging. J. Pharm. Innov. 2012, 7, 87–93. [Google Scholar] [CrossRef] [PubMed]
- Cherkasova, O.P.; Nazarov, M.M.; Sapozhnikov, D.A.; Man’kova, A.A.; Fedulova, E.V.; Volodin, V.A.; Minaeva, V.A.; Minaev, B.F.; Baryshnikov, G.V. Vibrational spectra of corticosteroid hormones in the terahertz range. In Proceedings of the Laser Applications in Life Sciences, Oulu, Finland, 9–11 June 2010; Volume 7376, p. 73760P. [Google Scholar]
- Minaeva, V.A.; Cherkasova, O.P.; Minaev, B.F.; Baryshnikov, G.V.; Khmara, A.V. Features of terahertz adsorption and Raman scattering of mineralocorticoid hormones. Bull. Russ. Acad. Sci. Phys. 2015, 79, 1196–1201. [Google Scholar] [CrossRef]
- Angeluts, A.A.; Balakin, A.V.; Evdokimov, M.G.; Esaulkov, M.N.; Nazarov, M.M.; Ozheredov, I.A.; Sapozhnikov, D.A.; Solyankin, P.M.; Cherkasova, O.P.; Shkurinov, A.P. Characteristic responses of biological and nanoscale systems in the terahertz frequency range. Quantum Electron. 2014, 44, 614. [Google Scholar] [CrossRef]
- Cherkasova, O.P.; Nazarov, M.M.; Smirnova, I.N.; Shkurinov, A.P. THz and Raman Spectroscopy in Steroid Chemistry. ALT Proc. 2012, 1. [Google Scholar] [CrossRef]
- Quema, A.; Takahashi, H.; Sakai, M.; Goto, M.; Ono, S.; Sarukura, N.; Shioda, R.; Yamada, N. Identification of Potential Estrogenic Environmental Pollutants by Terahertz Transmission Spectroscopy. Jpn. J. Appl. Phys. 2003, 42, L932. [Google Scholar] [CrossRef]
- Cherkasova, O.P.; Nazarov, M.M.; Shkurinov, A.P. Terahertz spectroscopy for diabetes diagnostics. EPJ Web Conf. 2017, 149, 05013. [Google Scholar] [CrossRef]
- Cherkasova, O.P.; Nazarov, M.M.; Mańkova, A.A.; Fedulova, E.V.; Volodin, V.A.; Minaeva, V.A.; Minaev, B.F.; Baryshnikov, G.V. Terahertz time-domain spectroscopy of testosterone, estradiol and estriol. In Proceedings of the 2010 International Kharkov Symposium on Physics And Engineering of Microwaves, Millimeter and Submillimeter Waves, Kharkiv, Ukraine, 21–26 June 2010; pp. 1–3. [Google Scholar] [CrossRef]
- Chowdhury, I.; Sengupta, A.; Maitra, S.K. Melatonin: Fifty Years of Scientific Journey from the Discovery in Bovine Pineal Gland to Delineation of Functions in Human. IJBB 2008, 45, 289–304. [Google Scholar]
- Sahin, I.; Bilge, D.; Kazanci, N.; Severcan, F. Concentration-dependent effect of melatonin on DSPC membrane. J. Mol. Struct. 2013, 1052, 183–188. [Google Scholar] [CrossRef]
- Lee, S.-H.; Jazbinsek, M.; Hauri, C.P.; Kwon, O.-P. Recent progress in acentric core structures for highly efficient nonlinear optical crystals and their supramolecular interactions and terahertz applications. CrystEngComm 2016, 18, 7180–7203. [Google Scholar] [CrossRef]
- Schneider, A.; Biaggio, I.; Günter, P. Terahertz-induced lensing and its use for the detection of terahertz pulses in a birefringent crystal. Appl. Phys. Lett. 2004, 84, 2229–2231. [Google Scholar] [CrossRef]
- Zhang, X.C.; Xu, J. THz Wave Near-Field Imaging. In Introduction to THz Wave Photonics; Springer: Boston, MA, USA, 2010; pp. 149–174. ISBN 978-1-4419-0977-0. [Google Scholar] [CrossRef]
- Chernomyrdin, N.V.; Schadko, A.O.; Lebedev, S.P.; Tolstoguzov, V.L.; Kurlov, V.N.; Reshetov, I.V.; Spektor, I.E.; Skorobogatiy, M.; Yurchenko, S.O.; Zaytsev, K.I. Solid immersion terahertz imaging with sub-wavelength resolution. Appl. Phys. Lett. 2017, 110, 221109. [Google Scholar] [CrossRef]
- Sanjuan, F.; Gaborit, G.; Coutaz, J.-L. Sub-wavelength terahertz imaging through optical rectification. Sci. Rep. 2018, 8, 13492. [Google Scholar] [CrossRef] [PubMed]
- Burnett, A.D.; Fan, W.; Upadhya, P.C.; Cunningham, J.E.; Hargreaves, M.D.; Munshi, T.; Edwards, H.G.M.; Linfield, E.H.; Davies, A.G. Broadband terahertz time-domain spectroscopy of drugs-of-abuse and the use of principal component analysis. Analyst 2009, 134, 1658–1668. [Google Scholar] [CrossRef] [PubMed]
- Jin, B.B.; Chen, Z.X.; Li, Z.; Ma, J.L.; Fu, R.; Zhang, C.H.; Chen, J.; Wu, P.H. Mode assignment of terahertz spectrum of α-lactose monohydrate. In Proceedings of the 2009 34th International Conference on Infrared, Millimeter, and Terahertz Waves, Busan, South Korea, 21–25 September 2009; pp. 1–2. [Google Scholar] [CrossRef]
- Burnett, A.D.; Fan, W.; Upadhya, P.C.; Cunningham, J.E.; Hargreaves, M.; Munshi, T.; Edwards, H.G.M.; Linfield, E.H.; Davies, A.G. Broadband terahertz time-domain spectroscopy of drugs-of-abuse mixtures and ‘street’ samples. In Proceedings of the 2008 33rd International Conference on Infrared, Millimeter and Terahertz Waves, Pasadena, CA, USA, 15–19 September 2008; pp. 1–2. [Google Scholar] [CrossRef]
- Puc, U.; Abina, A.; Rutar, M.; Zidanšek, A.; Jeglič, A.; Valušis, G. Terahertz spectroscopic identification of explosive and drug simulants concealed by various hiding techniques. Appl. Opt. 2015, 54, 4495–4502. [Google Scholar] [CrossRef] [PubMed]
- Lavrič, Z.; Pirnat, J.; Lužnik, J.; Seliger, J.; Žagar, V.; Trontelj, Z.; Srčič, S. Application of 14N NQR to the study of piroxicam polymorphism. J. Pharm. Sci. 2010, 99, 4857–4865. [Google Scholar] [CrossRef] [PubMed]
- Lavrič, Z.; Pirnat, J.; Lužnik, J.; Puc, U.; Trontelj, Z.; Srčič, S. 14N Nuclear Quadrupole Resonance Study of Piroxicam: Confirmation of New Polymorphic Form V. J. Pharm. Sci. 2015, 104, 1909–1918. [Google Scholar] [CrossRef] [PubMed]
- Martino, R.; Malet-Martino, M.; Gilard, V.; Balayssac, S. Counterfeit drugs: Analytical techniques for their identification. Anal. Bioanal. Chem. 2010, 398, 77–92. [Google Scholar] [CrossRef] [PubMed]


| Sample | Polyethylene | Constituent 2 |
|---|---|---|
| PE pellet | 320 mg | NA |
| Low concentration melatonin pellet | 304 mg | 16 mg melatonin |
| High concentration melatonin pellet | 288 mg | 32 mg melatonin |
| Low concentration Circadin pellet | 304 mg | 16 mg Circadin (0.1 mg melatonin) |
| High concentration Circadin pellet | 288 mg | 32 mg Circadin (0.2 mg melatonin) |
| Chemical Compound | Absorption PeakTHz-TDS (This Work) | Absorption Peak FTIR (This Work) | Absorption PeakFTIR (Published 1–3) | |||
|---|---|---|---|---|---|---|
| THz | cm−1 | THz | cm−1 | THz | cm−1 | |
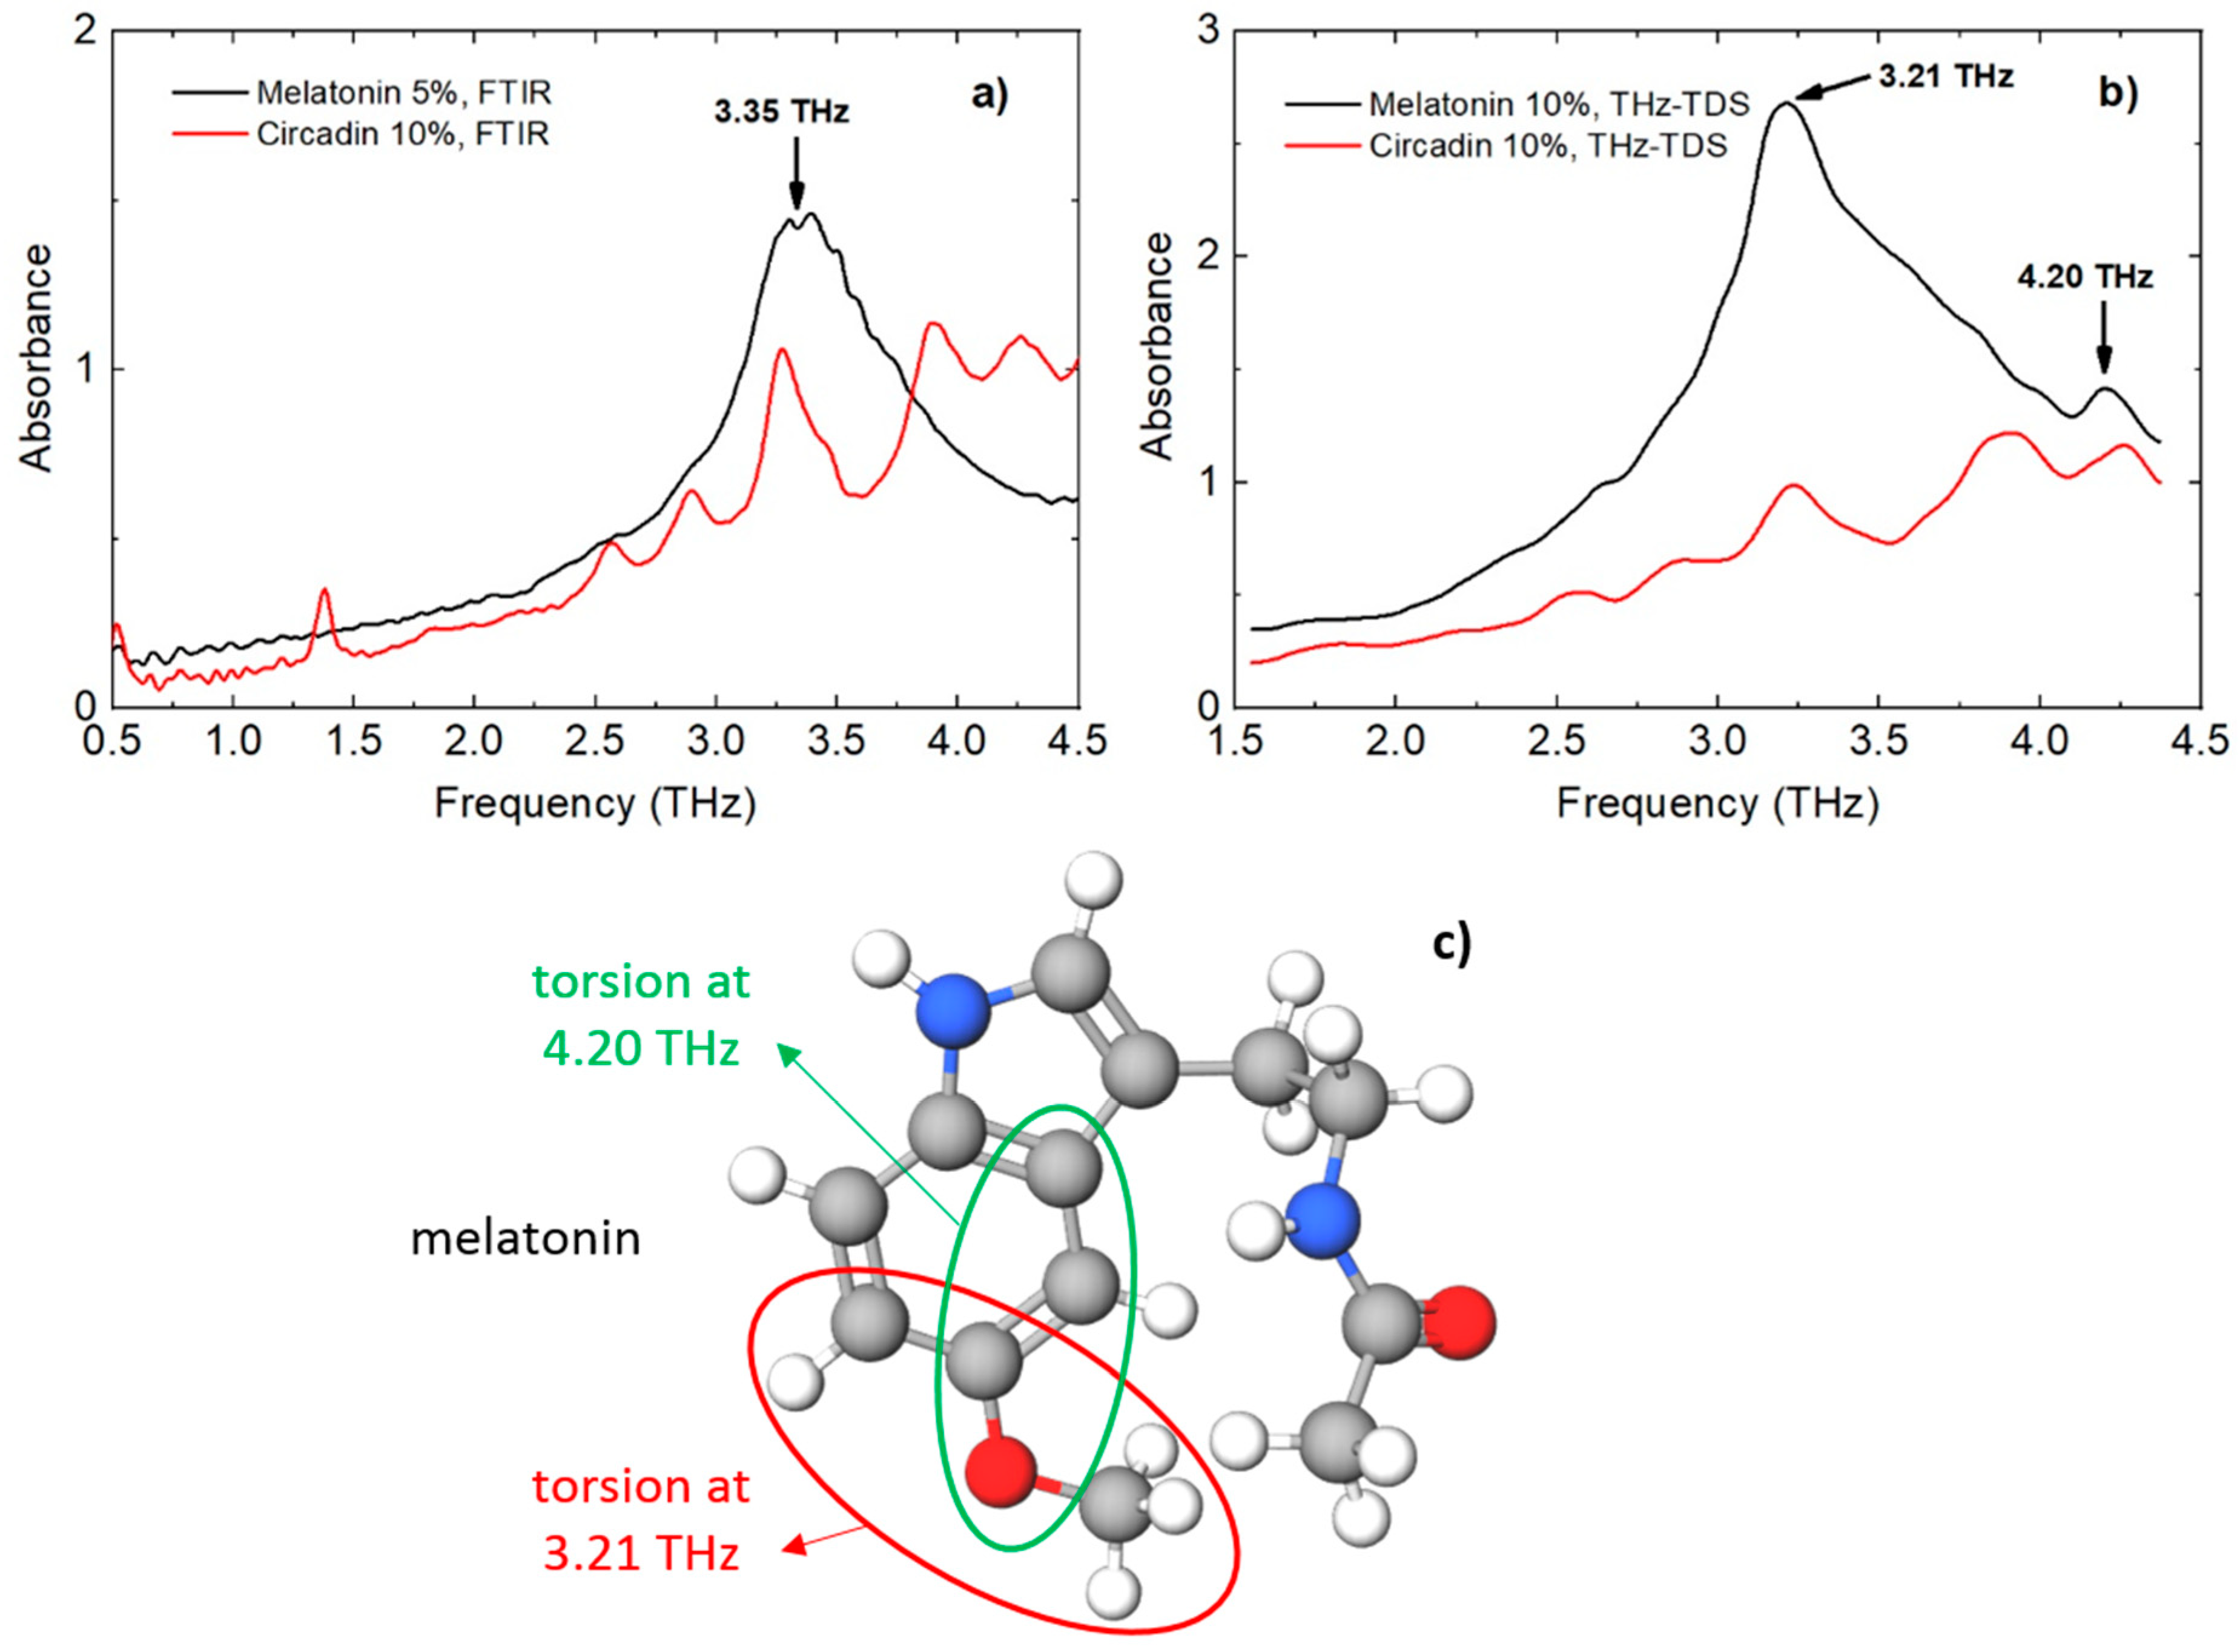
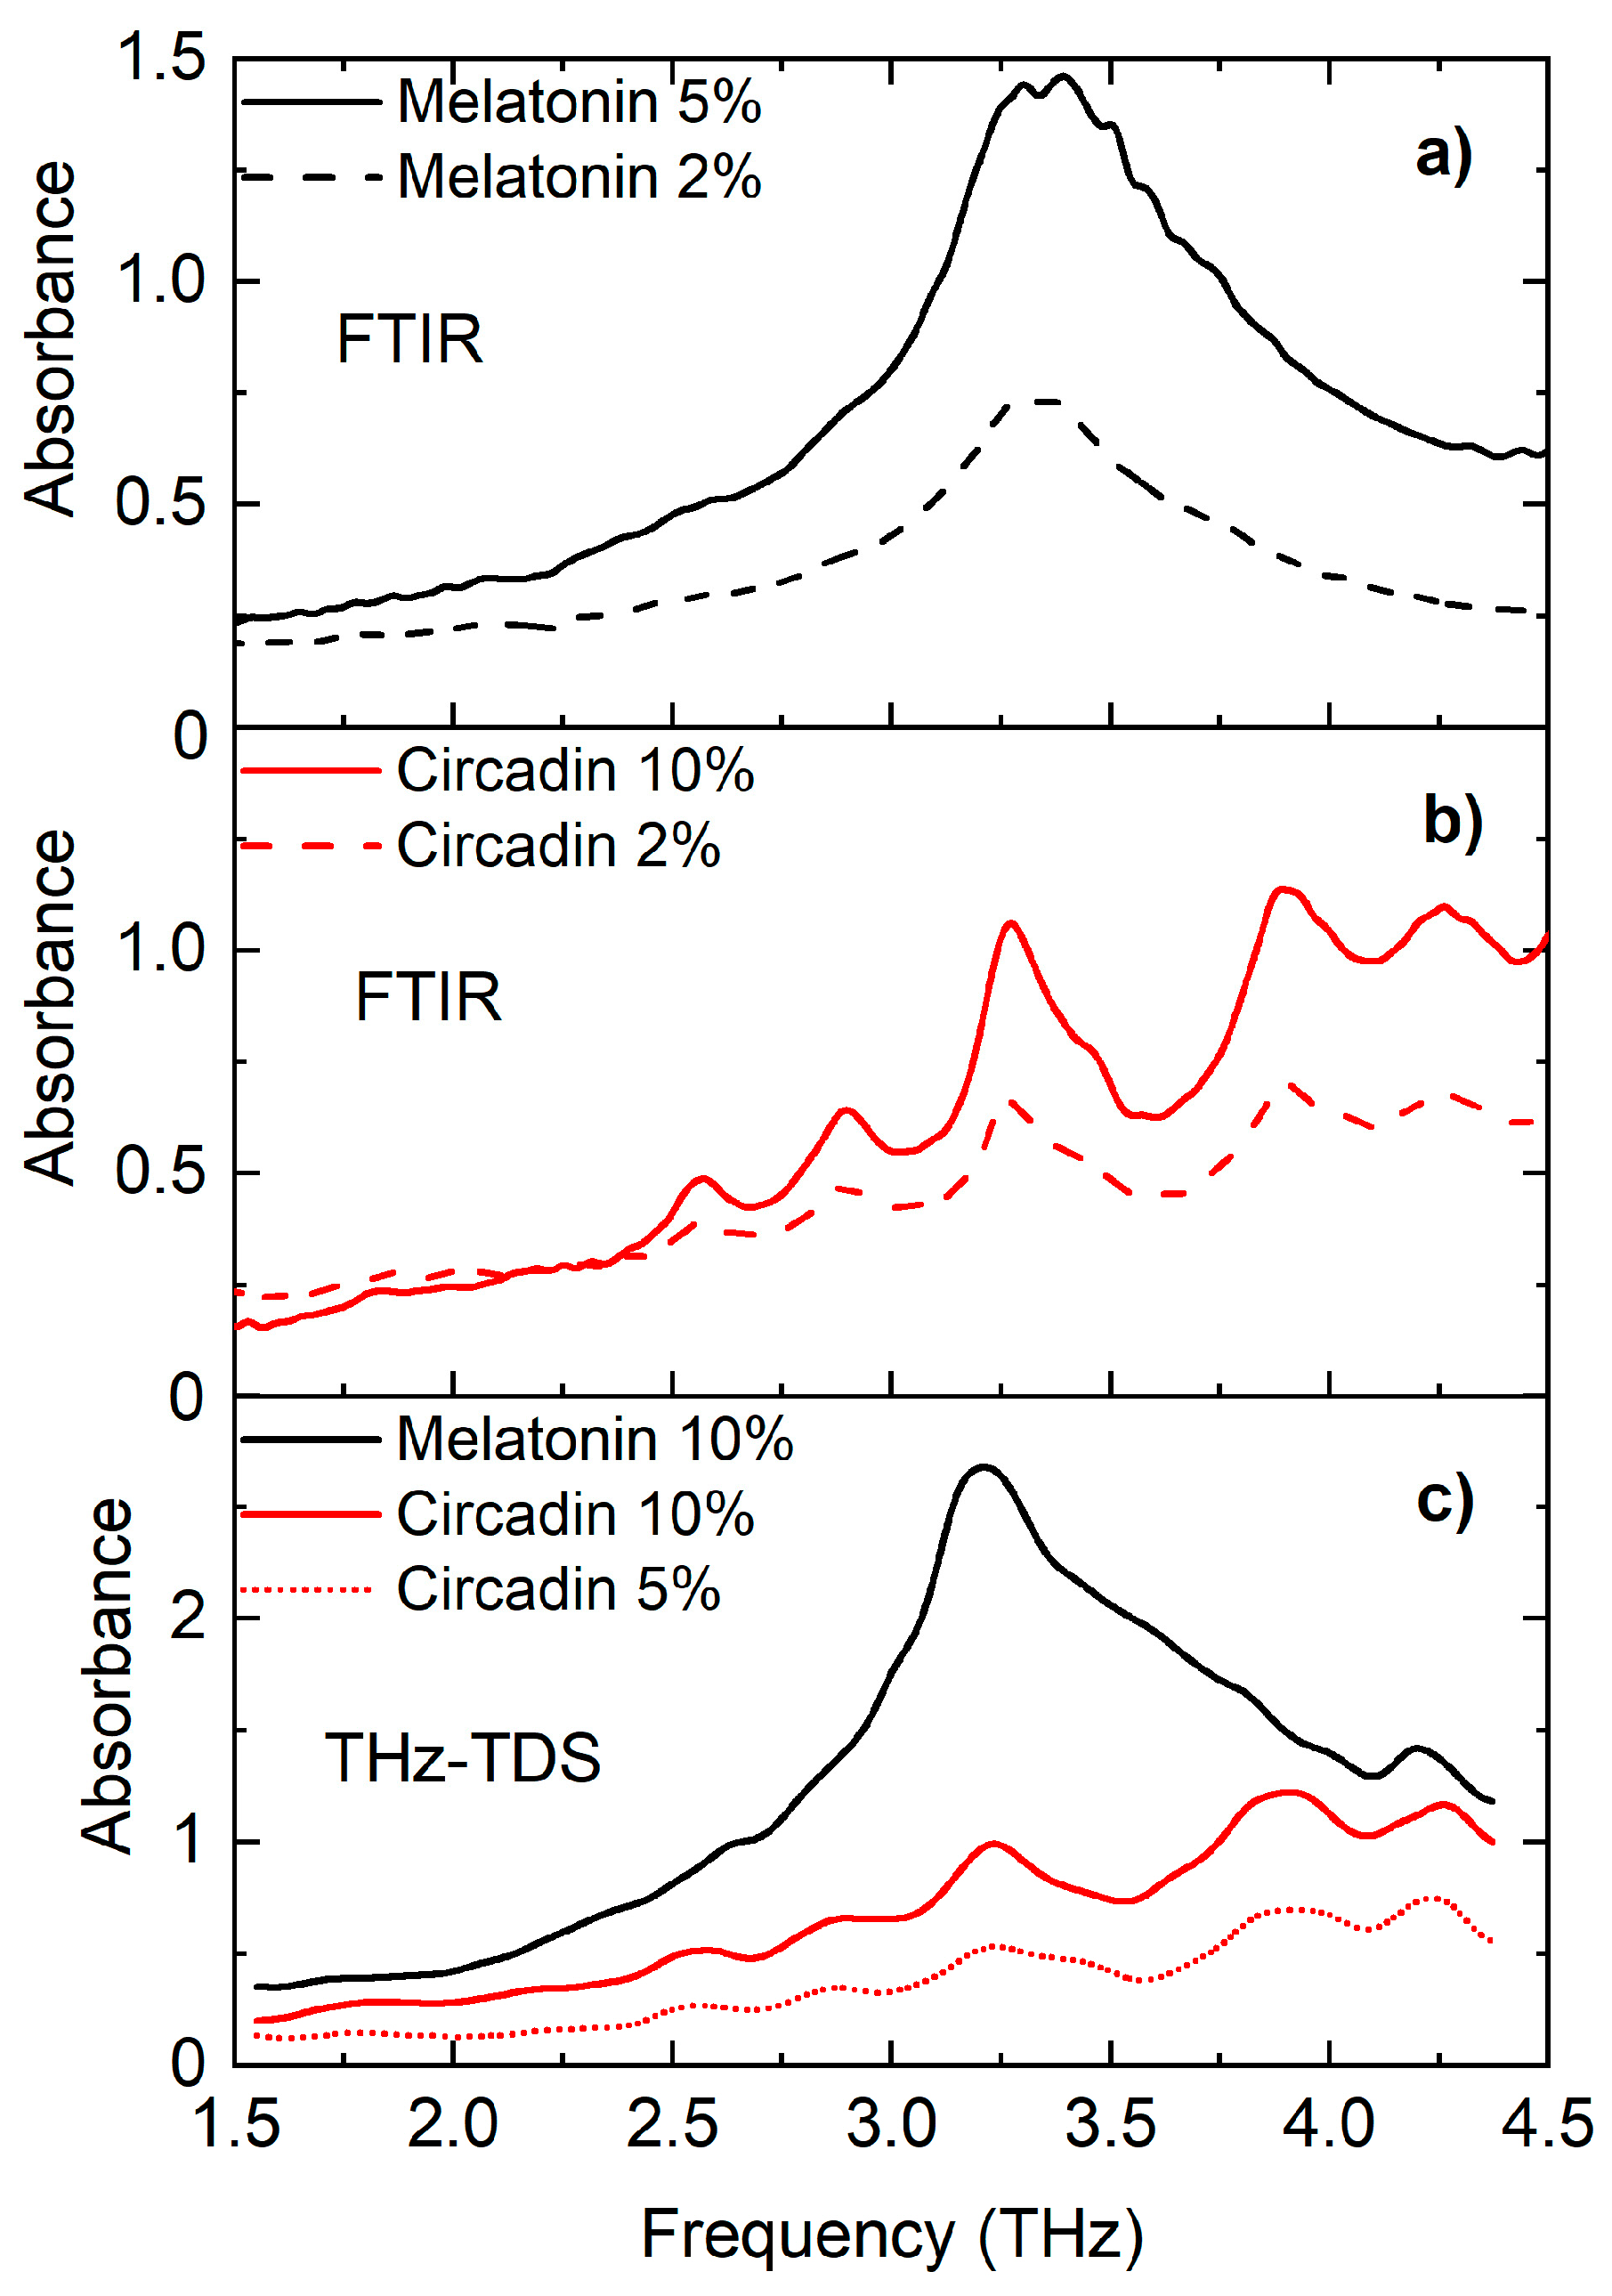
| Melatonin | 3.21 | 107 | 3.35 | 112 | 3.60 1 | 120 |
| 4.20 | 140 | 4.11 1 | 137 | |||
| Lactose Monohydrate | 1.42 2,3 | 47 | ||||
| 1.85 3 | 62 | |||||
| 2.65 3 | 88 | |||||
| 2.95 3 | 98 | |||||
| 3.45 3 | 115 | |||||
| 3.90 3 | 130 | |||||
| 4.0 3 | 133 | |||||
| 4.2 3 | 140 | |||||
| Circadin (melatonin) | 3.25 | 108 | 3.25 | 108 | ||
| 4.25 | 142 | 4.25 | 142 | |||
| Circadin (lactose monohydrate) | 1.40 | |||||
| 2.65 | 88 | 2.65 | 88 | |||
| 2.90 | 97 | 2.90 | 97 | |||
| 3.90 | 130 | 3.90 | 130 | |||
© 2018 by the authors. Licensee MDPI, Basel, Switzerland. This article is an open access article distributed under the terms and conditions of the Creative Commons Attribution (CC BY) license (http://creativecommons.org/licenses/by/4.0/).
Share and Cite
Puc, U.; Abina, A.; Jeglič, A.; Zidanšek, A.; Kašalynas, I.; Venckevičius, R.; Valušis, G. Spectroscopic Analysis of Melatonin in the Terahertz Frequency Range. Sensors 2018, 18, 4098. https://doi.org/10.3390/s18124098
Puc U, Abina A, Jeglič A, Zidanšek A, Kašalynas I, Venckevičius R, Valušis G. Spectroscopic Analysis of Melatonin in the Terahertz Frequency Range. Sensors. 2018; 18(12):4098. https://doi.org/10.3390/s18124098
Chicago/Turabian StylePuc, Uroš, Andreja Abina, Anton Jeglič, Aleksander Zidanšek, Irmantas Kašalynas, Rimvydas Venckevičius, and Gintaras Valušis. 2018. "Spectroscopic Analysis of Melatonin in the Terahertz Frequency Range" Sensors 18, no. 12: 4098. https://doi.org/10.3390/s18124098
APA StylePuc, U., Abina, A., Jeglič, A., Zidanšek, A., Kašalynas, I., Venckevičius, R., & Valušis, G. (2018). Spectroscopic Analysis of Melatonin in the Terahertz Frequency Range. Sensors, 18(12), 4098. https://doi.org/10.3390/s18124098