THz Spectroscopic Investigation of Wheat-Quality by Using Multi-Source Data Fusion

Abstract
:1. Introduction
2. Experimental Methods
2.1. Experimental Setup
2.2. Sample Preparation and Parameter Extraction
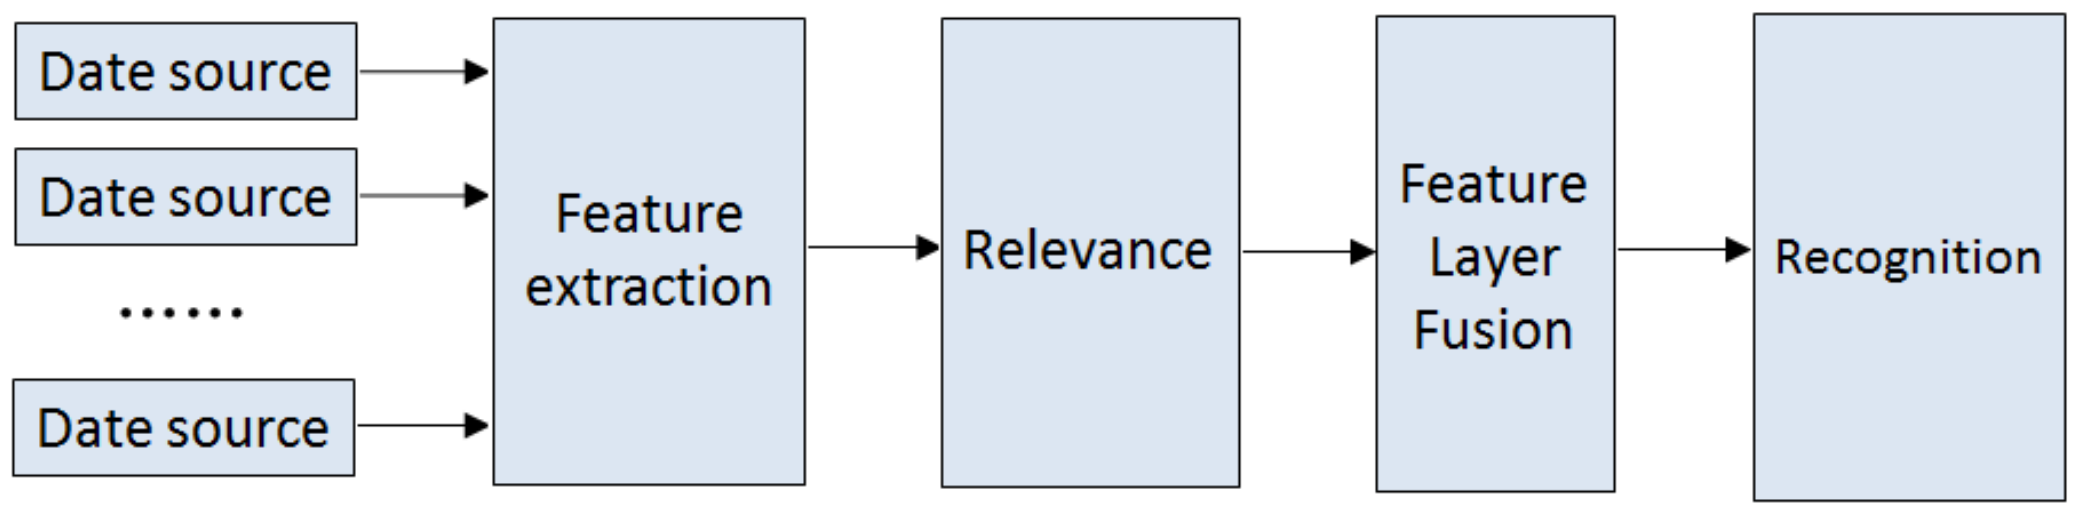
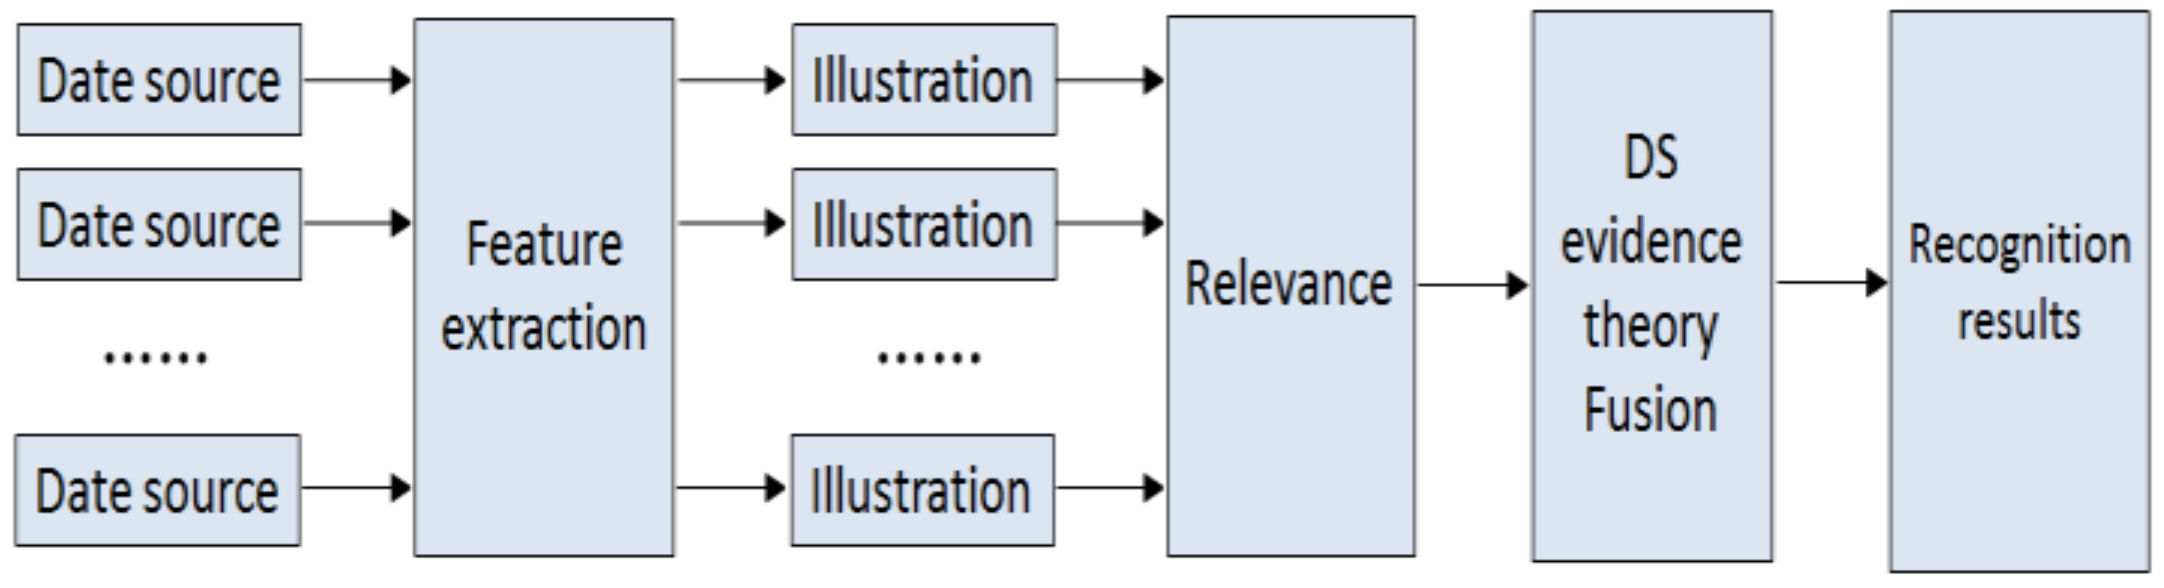
2.3. The Multi-Source Information Fusion Method
3. Results and Discussion
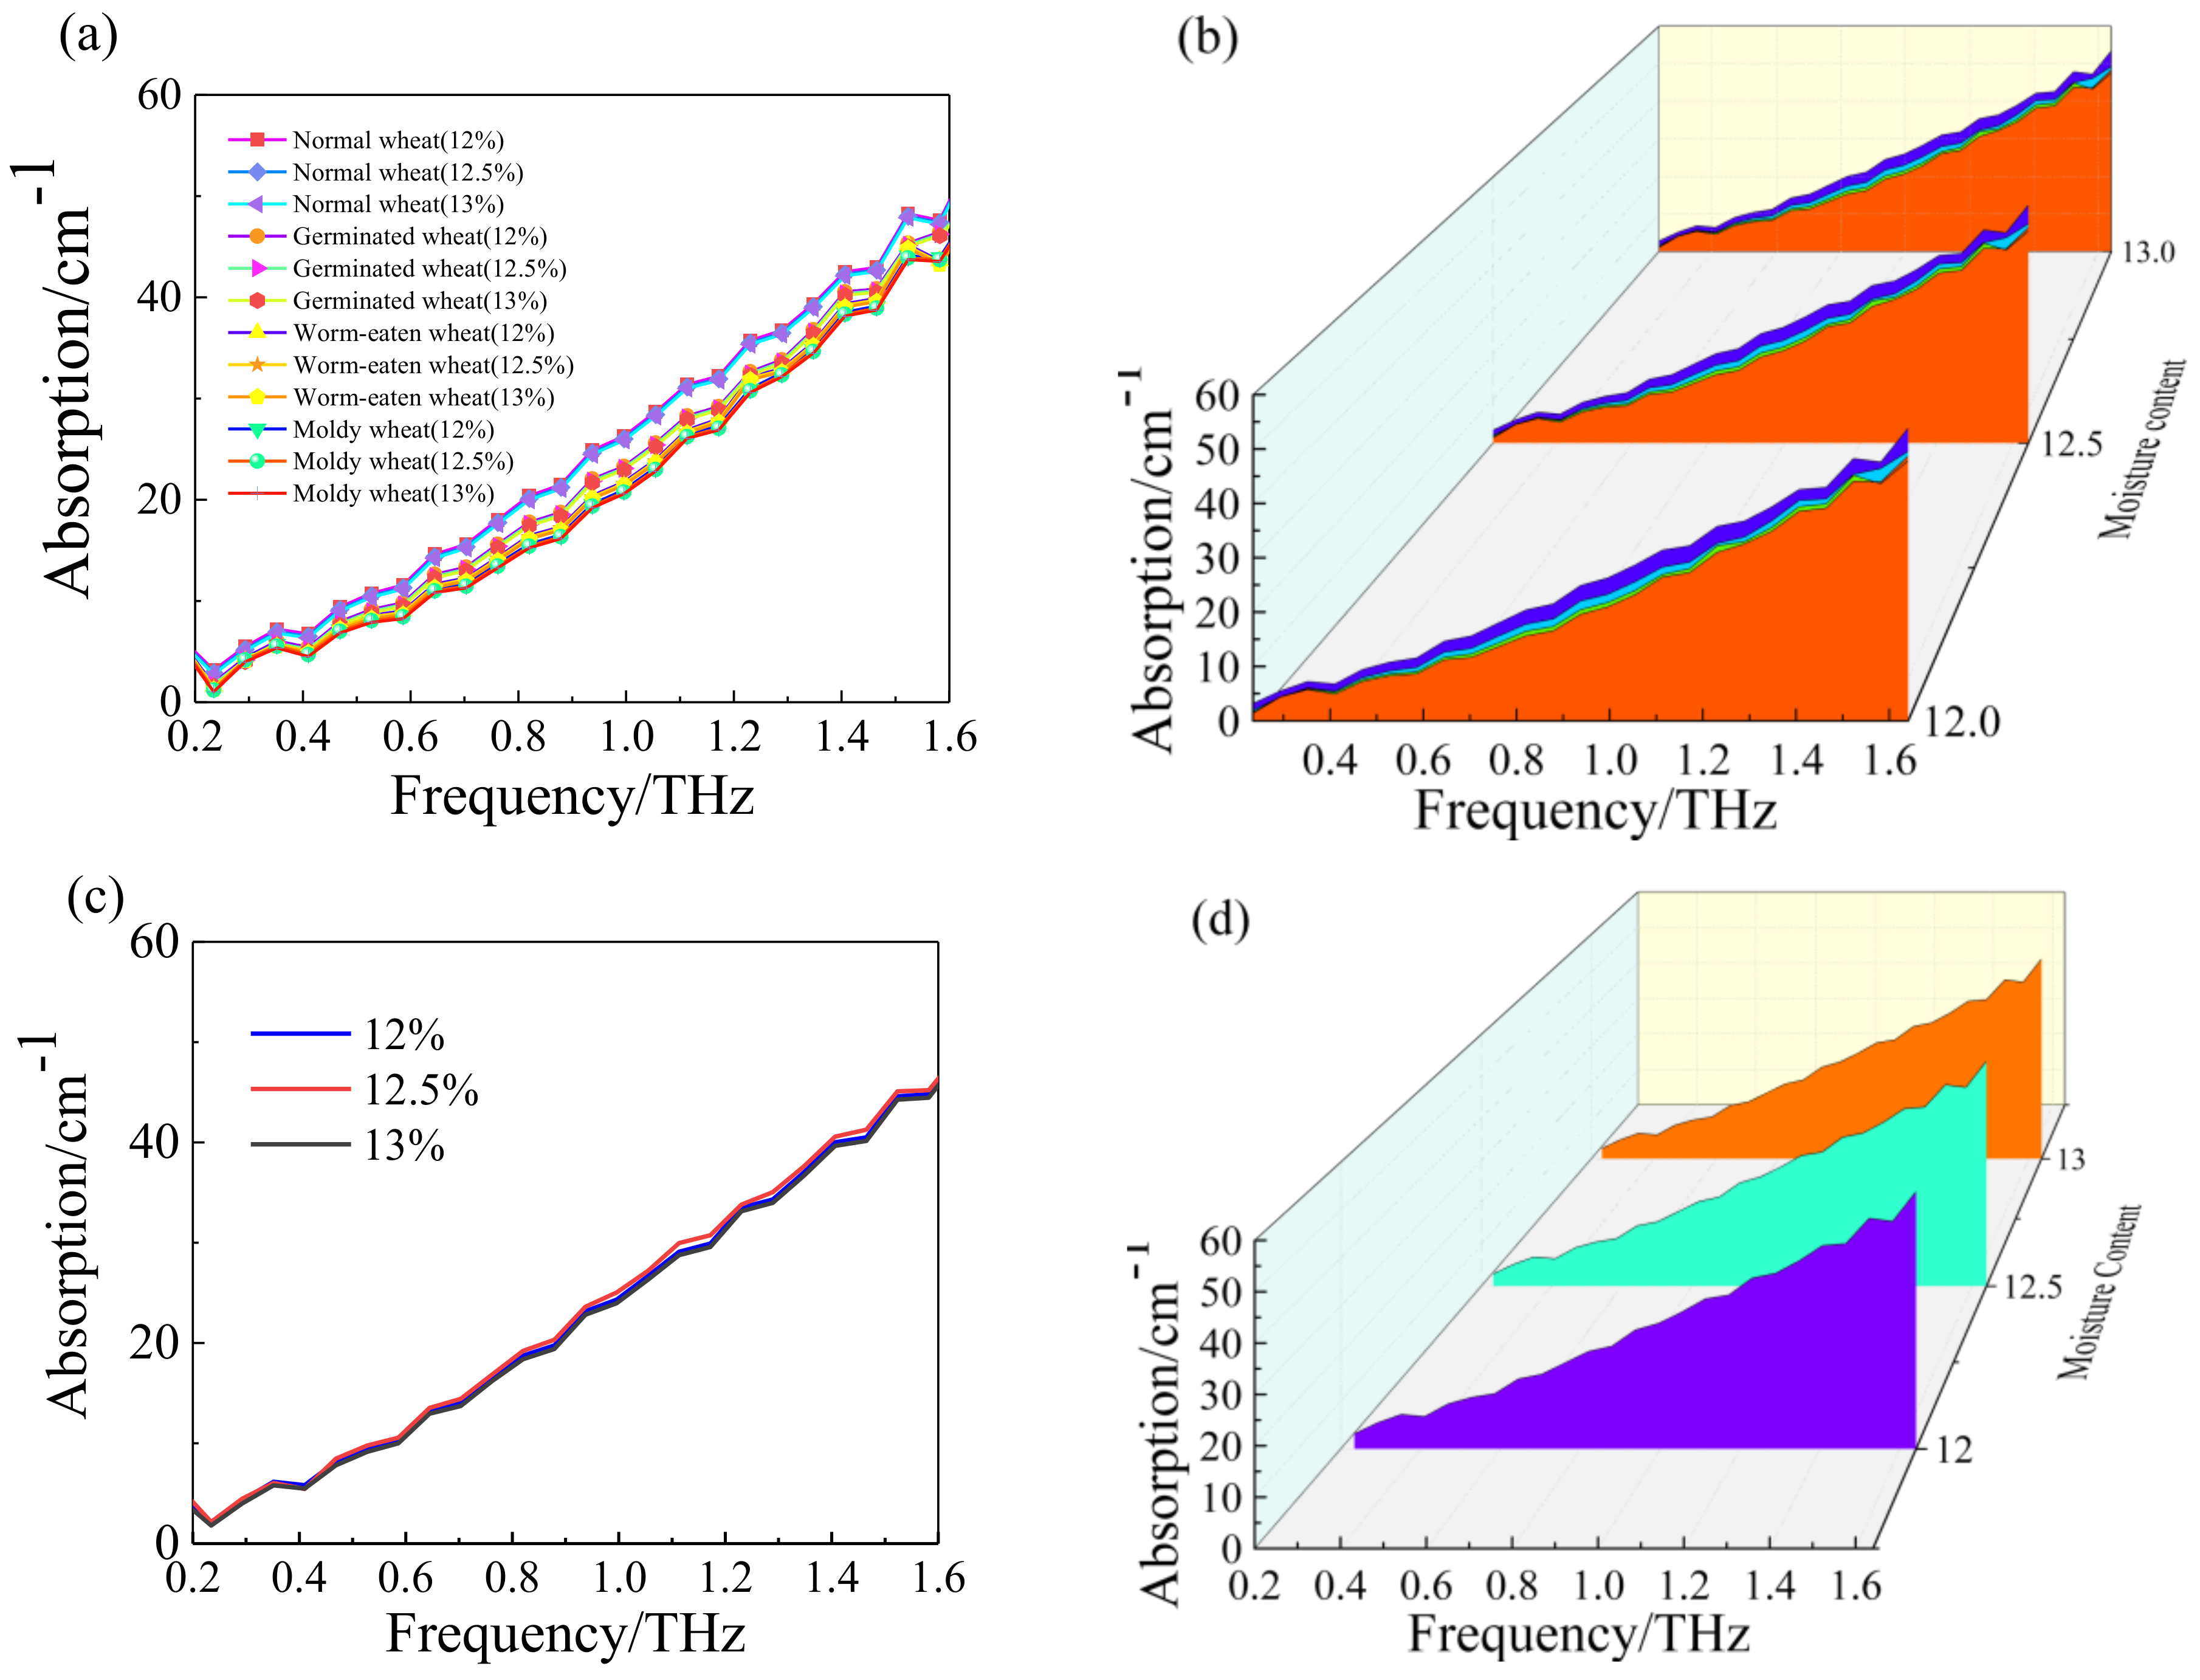
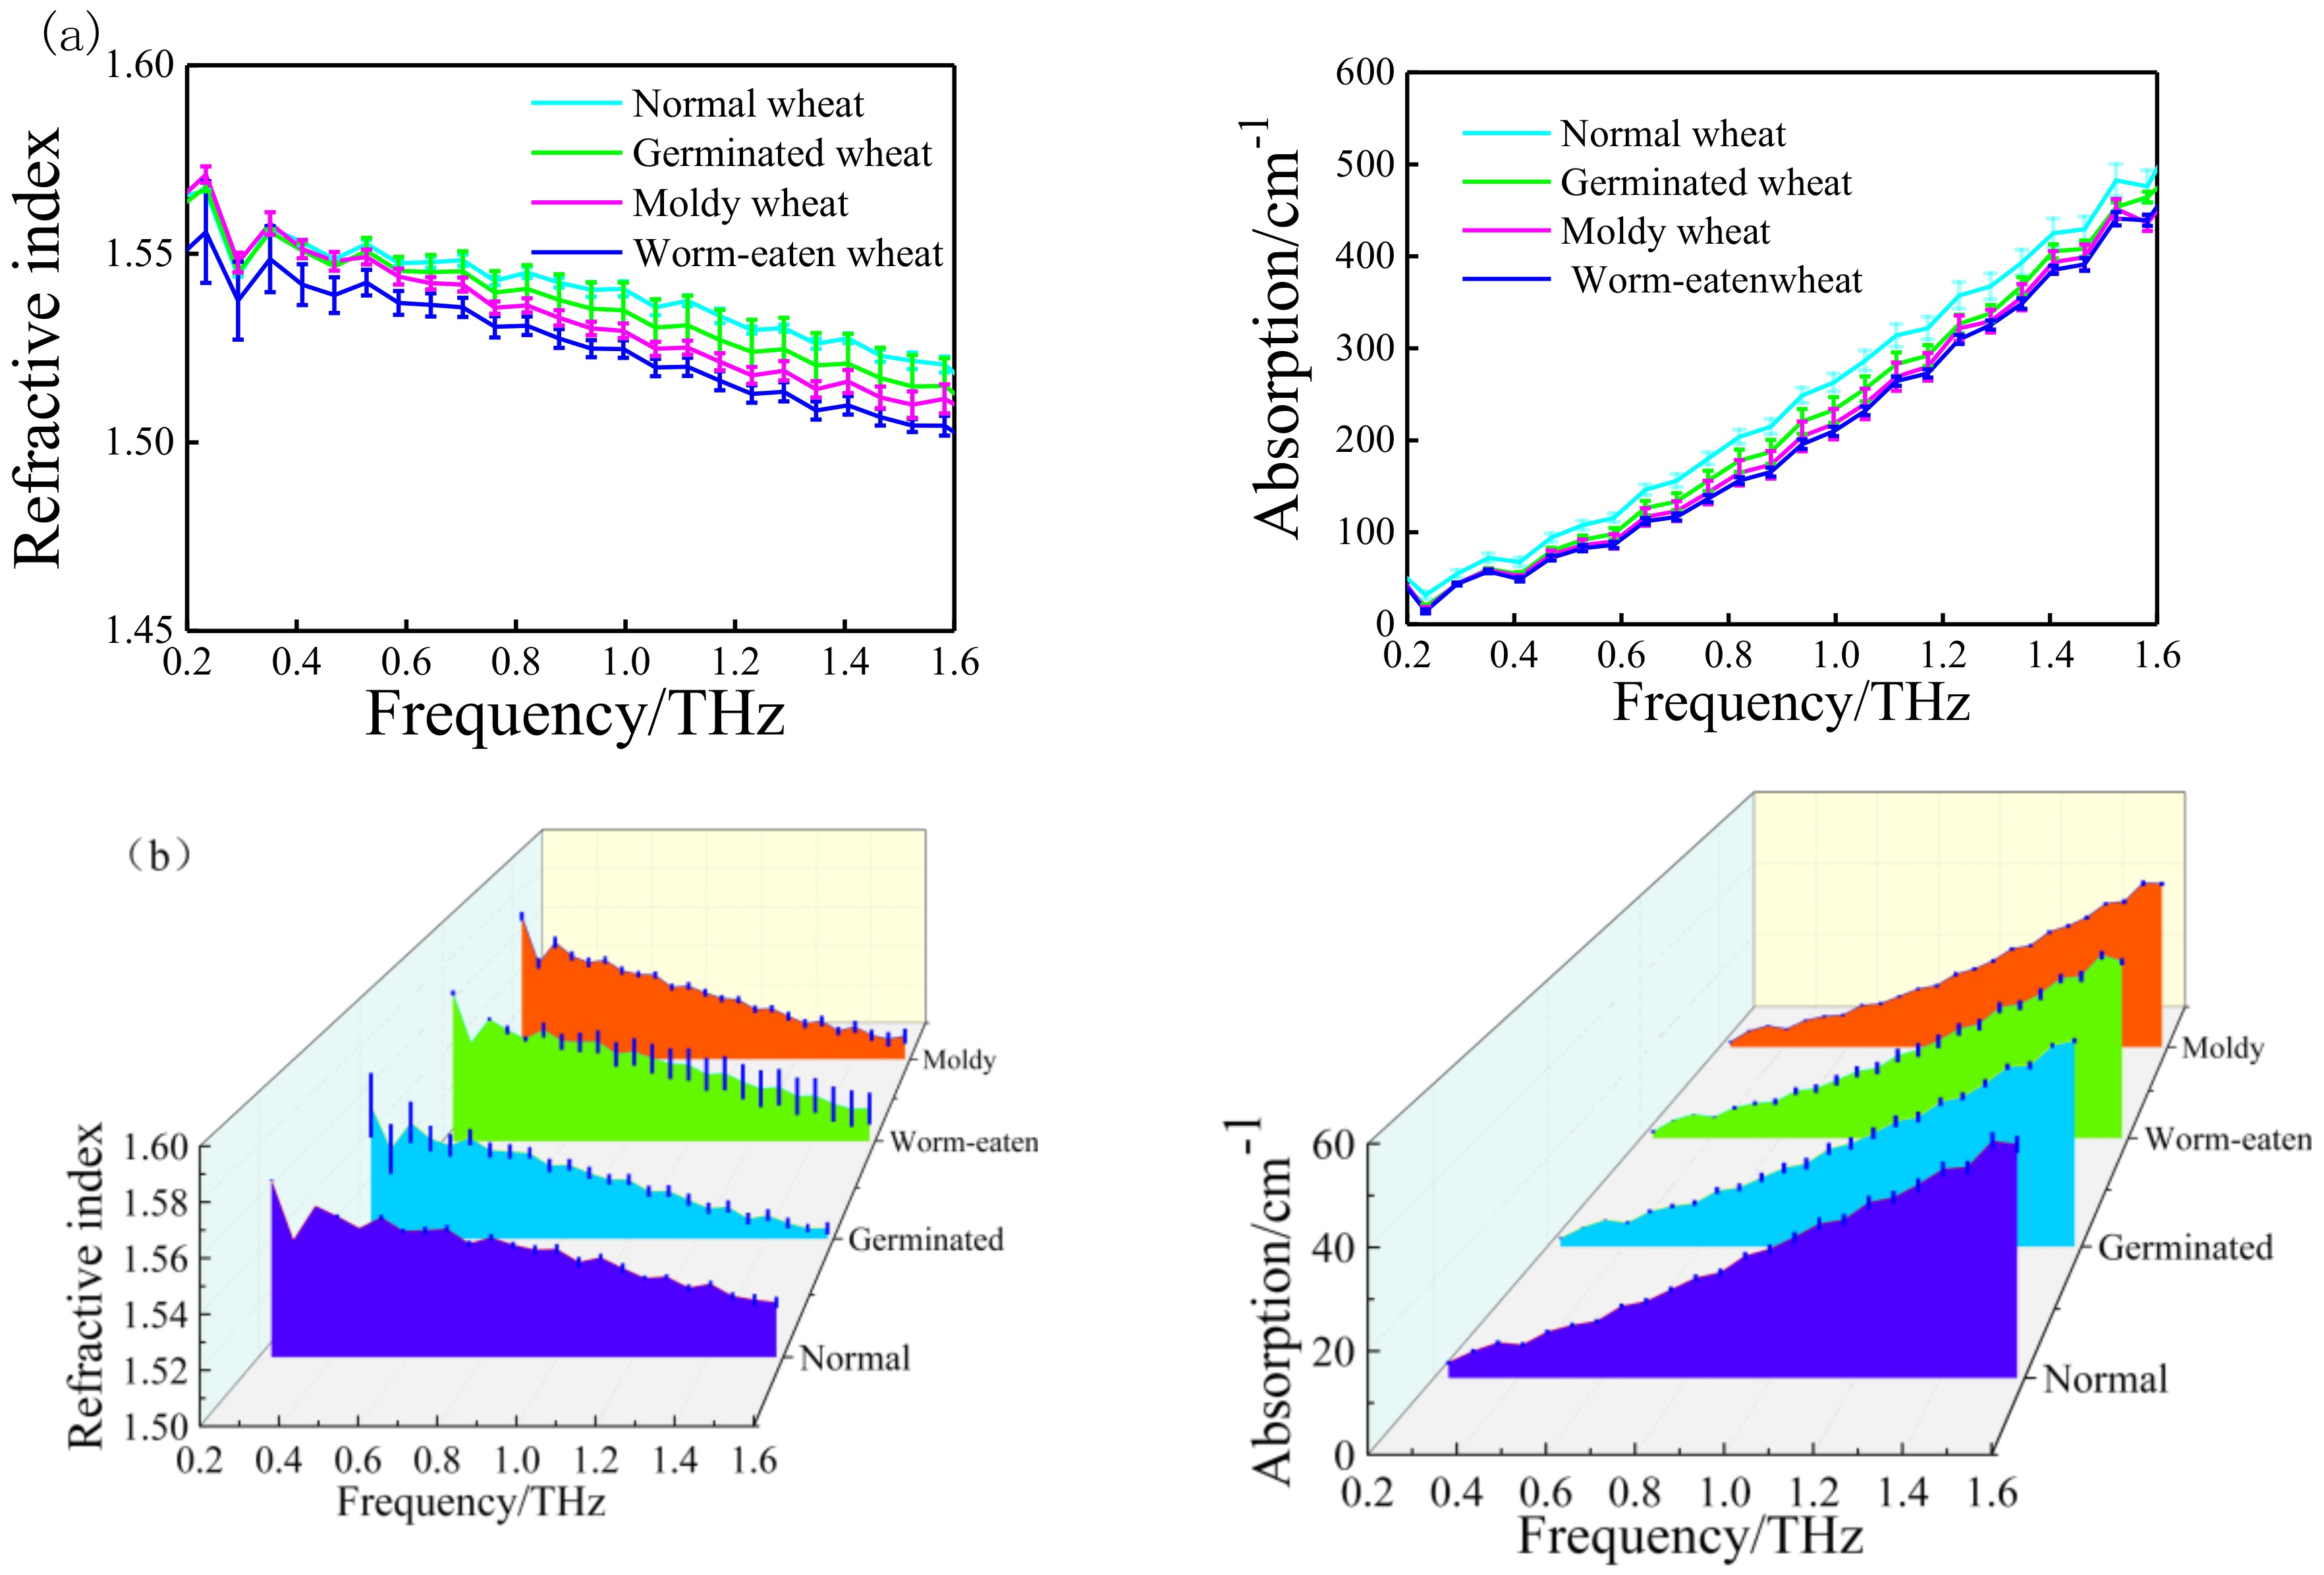
3.1. THz Spectrum Analysis of Wheat of Varying Quality
3.2. The Wheat Classification Model Based on Feature Layer Fusion
- (1)
- The establishment of the RBF-SVM fusion model
- (2)
- The linear/poly-SVM fusion model
3.3. The Decision Layer Fusion Model for Wheat Recognition Using DS Evidence Theory
- (1)
- Respectively established the classification probability output of wheat corresponding to the absorption spectra and refractive index spectra for wheat of different quality.
- (2)
- Established DS evidence fusion rules
- (3)
- Recognition results of the classification fusion model for wheat using DS evidence theory
3.4. Comparison of the Different Fusion Models
3.5. Discussion
4. Conclusions
Author Contributions
Funding
Conflicts of Interest
References
- Prinsen, P.; Gutierrez, A.; Faulds, C.B.; del Rio, J.C. Comprehensive Study of Valuable Lipophilic Phytochemicals in Wheat Bran. J. Agric. Food Chem. 2014, 62, 1664–1673. [Google Scholar] [CrossRef] [PubMed] [Green Version]
- Valipour, M. Land use policy and agricultural water management of the previous half of century in Africa. Appl. Water Sci. 2015, 5, 367–395. [Google Scholar] [CrossRef]
- Yannopoulos, S.I.; Lyberatos, G.; Theodossiou, N.; Li, W.; Valipour, M.; Tamburrino, A.; Angelakis, A.N. Evolution of Water Lifting Devices (Pumps) over the Centuries Worldwide. Water 2015, 7, 5031–5060. [Google Scholar] [CrossRef] [Green Version]
- Valipour, M. Global experience on irrigation management under different scenarios. J. Water Land Dev. 2017, 32, 95–102. [Google Scholar] [CrossRef] [Green Version]
- Oviedo, M.S.; Ramirez, M.L.; Barros, G.G.; Chulze, S.N. Influence of water activity and temperature on growth and mycotoxin production by Alternaria alternata on irradiated soya beans. Int. J. Food Microbiol. 2011, 149, 127–132. [Google Scholar] [CrossRef] [PubMed]
- Neethirajan, S.; Karunakaran, C.; Jayas, D.S.; White, N.D.G. Detection techniques for stored-product insects in grain. Food Control. 2007, 18, 157–162. [Google Scholar] [CrossRef]
- McMullin, D.; Mizaikoff, B.; Krska, R. Advancements in IR spectroscopic approaches for the determination of fungal derived contaminations in food crops. Anal. Bioanal. Chem. 2015, 407, 653–660. [Google Scholar] [CrossRef] [PubMed]
- Jaillais, B.; Roumet, P.; Pinson-Gadais, L.; Bertrand, D. Detection of Fusarium head blight contamination in wheat kernels by multivariate imaging. Food Control. 2015, 54, 250–258. [Google Scholar] [CrossRef]
- Niu, Y.H.; Hua, L.; Hardy, G.; Agarwal, M.; Ren, Y.L. Analysis of volatiles from stored wheat and Rhyzopertha dominica (F.) with solid phase microextraction-gas chromatography mass spectrometry. J. Sci. Food Agric. 2016, 96, 1697–1703. [Google Scholar] [CrossRef] [PubMed]
- Neethirajan, S. Jayas, D.S.; White, N.D.G. Detection of sprouted wheat kernels using soft X-ray image analysis. J. Food Eng. 2007, 81, 509–513. [Google Scholar] [CrossRef]
- Ferguson, B.; Zhang, X.C. Materials for terahertz science and technology. Nat. Mater. 2002, 1, 26–33. [Google Scholar] [CrossRef] [PubMed]
- Siegel, P.H. Terahertz technology in biology and medicine. IEEE Trans. Microw. Theory 2004, 52, 2438–2447. [Google Scholar] [CrossRef]
- Shimada, Y.; Iida, H.; Kinoshita, M. Recent Research Trends of Terahertz Measurement Standards. IEEE Trans. Terahertz Sci. Technol. 2015, 5, 1166–1172. [Google Scholar]
- Xie, L.J.; Gao, W.L.; Shu, J.; Ying, Y.B.; Kono, J.C. Extraordinary sensitivity enhancement by metasurfaces in terahertz detection of antibiotics. Sci. Rep. 2015, 5, 8671. [Google Scholar] [CrossRef] [PubMed] [Green Version]
- Gowen, A.A.; O’Sullivan, C.; O’Donnell, C.P. Terahertz time domain spectroscopy and imaging: Emerging techniques for food process monitoring and quality control. Trends Food Sci. Technol. 2012, 25, 40–46. [Google Scholar] [CrossRef] [Green Version]
- Ogawa, Y.; Kondo, N.; House, G. Feasibility of using attenuated totalreflectance terahertz (ATR-THz) spectroscopy for quantitative and qualitativestudy of vitamin C in aqueous solutions. In Proceedings of the ASABE Annual International Meeting, Louisville, KY, USA, 7–10 August 2011. [Google Scholar]
- Nishikiori, R.; Yamaguchi, M.; Takano, K.; Enatsu, T.; Tani, M.; de Silva, U.C.; Kawashita, N.; Taragi, T.; Morimoto, S.; Hangyo, M.; et al. Application of partial least square on quantitative analysis of L-, D-, and DL-tartaric acid by terahertz absorption spectra. Chem. Pharm. Bull. 2008, 56, 305–307. [Google Scholar] [CrossRef] [PubMed]
- Hua, Y.F.; Zhang, H.J. Qualitative and Quantitative Detection of Pesticides with Terahertz Time-Domain Spectroscopy. IEEE Trans. Microw. Theory 2010, 58, 2064–2070. [Google Scholar]
- Baek, S.H.; Kang, J.H.; Hwang, Y.H.; Ok, K.M.; Kwak, K.; Chun, H.S. Detection of Methomyl, a Carbamate Insecticide, in Food Matrices Using Terahertz Time-Domain Spectroscopy. J. Infrared Millim. Terahertz Waves 2016, 37, 486–497. [Google Scholar] [CrossRef]
- Qin, J.Y.; Xie, L.J.; Ying, Y.B. Feasibility of Terahertz Time-Domain Spectroscopy to Detect Tetracyclines Hydrochloride in Infant Milk Powder. Anal. Chem. 2014, 86, 11750–11757. [Google Scholar] [CrossRef] [PubMed]
- Smith, G.; Hussain, A.; Bukhari, N.I.; Ermolina, I. Quantification of residual crystallinity in ball milled commercially sourced lactose monohydrate by thermo-analytical techniques and terahertz spectroscopy. Eur. J. Pharm. Biopharm. 2015, 92, 180–191. [Google Scholar] [CrossRef] [PubMed]
- Sleiman, J.B.; Bousquet, B.; Palka, N.; Mounaix, P. Quantitative Analysis of Hexahydro-1,3,5-trinitro-1,3,5, Triazine/Pentaerythritol Tetranitrate (RDX-PETN) Mixtures by Terahertz Time Domain Spectroscopy. Appl. Spectrosc. 2015, 69, 1464–1471. [Google Scholar] [CrossRef] [PubMed]
- Ge, H.Y.; Jiang, Y.Y.; Xu, Z.H.; Lian, F.Y.; Zhang, Y.; Xia, S.H. Identification of wheat quality using THz spectrum. Opt. Express 2014, 22, 12533–12544. [Google Scholar] [CrossRef] [PubMed]
- Zhang, X.C.; Xu, J. Introduction to THz Wave Photonics; Springer: New York, NY, USA, 2009. [Google Scholar]
- Dorney, T.D.; Baraniuk, R.G.; Mittleman, D.M. Material parameter estimation with terahertz time-domain spectroscopy. J. Opt. Soc. Am. A 2001, 18, 1562–1571. [Google Scholar] [CrossRef]
- Shaddad, S.M.; Madrau, S.; Castrignano, A.; Mouazen, A.M. Data fusion techniques for delineation of site-specific management zones in a field in UK. Precis. Agric. 2016, 17, 200–217. [Google Scholar] [CrossRef]
- Liang, X.Y.; Li, X.Y.; Lei, T.W.; Wang, W.; Gao, Y. Study of sample temperature compensation in the measurement of soil moisture content. Measurement 2011, 44, 2200–2204. [Google Scholar] [CrossRef]
- Varshney, P.K. Distributed Detection and Data Fusion; Springer-Verlag: New York, NY, USA, 1996. [Google Scholar]
- Roussel, S.; Bellon-Maurel, V.; Roger, J.-M.; Grenier, P. Fusion of aroma, FT-IR and UV sensor data based on the Bayesian inference. Application to the discrimination of white grape varieties. Chemom. Intell. Lab. 2003, 65, 209–219. [Google Scholar] [CrossRef]
- Rudnitskaya, A.; Kirsanov, D.; Legin, A.; Beullens, K.; Lammertyn, J.; Nicolaï, B.M.; Irudayaraj, J. Analysis of apples varieties—Comparison of electronic tongue with different analytical techniques. Sens. Actuators B Chem. 2006, 116, 23–28. [Google Scholar] [CrossRef]
- Cristianini, N.; Shawe-Taylor, J. An Introduction to Support Vector Machines and Other Kernel-Based Learning Methods; Cambridge University Press: Cambridge, UK, 2000. [Google Scholar]
- Ge, H.Y.; Jiang, Y.Y.; Lian, F.Y.; Zhang, Y.; Xia, S.H. Quantitative determination of aflatoxin B1 concentration in acetonitrile by chemometric methods using terahertz spectroscopy. Food Chem. 2016, 209, 286–292. [Google Scholar] [CrossRef] [PubMed]
- Dempster, A.P. Upper and lower probabilities induced by a multi-valued mapping. Ann. Math. Stat. 1967, 38, 325–339. [Google Scholar] [CrossRef]
- Shafer, G. A Mathematical Theory of Evidence; Princeton University Press: Princeton, NJ, USA, 1976. [Google Scholar]
- Wickramarathne, T.L.; Premaratne, K.; Murthi, M.N. Toward Efficient Computation of the Dempster-Shafer Belief Theoretic Conditionals. IEEE Trans. Cybern. 2013, 43, 712–724. [Google Scholar] [CrossRef] [PubMed]
- Jiang, Y.Y.; Ge, H.Y.; Lian, F.Y.; Zhang, Y.; Xia, S.H. Early detection of germinated wheat grains using terahertz image and chemometrics. Sci. Rep. 2016, 6, 21299. [Google Scholar] [CrossRef] [PubMed]
- Cortes, C.; Vapnik, V. Support-vector networks. Mach. Learn. 1995, 20, 273–297. [Google Scholar] [CrossRef] [Green Version]
- Chua, H.S.; Upadhya, P.C.; Haigh, A.D.; Obradovic, J.; Gibson, A.A.P.; Linfield, E.H. Terahertz time-domain spectroscopy of wheat grain. In Proceedings of the Conference Digest of the 2004 Joint 29th International Conference on Infrared and Millimeter Waves and 12th International Conference on Terahertz Electronics, Karlsruhe, Germany, 27 September–1 October 2004; pp. 399–400. [Google Scholar]
- Guo, T.T.; Ding, Z.L.; Zhang, D.; Zhou, J.; Yang, Z.J.; Wang, X.L.; Yu, J.S.; Chen, X.D. Evaluation of wheat seeds by terahertz imaging. In Proceedings of the 2013 6th UK, Europe, China Millimeter Waves and THz Technology Workshop (UCMMT), Rome, Italy, 9–11 September 2013. [Google Scholar] [CrossRef]


| Performance Index | Parameter Values |
|---|---|
| Pump Source | Femtosecond fiber laser |
| Pumping capacity | <10 nJ |
| Spectral range | 0.1–3.5 THz |
| Frequency domain resolution | <5 GHz |
| Longest time delay | 1.3 ns |
| Dynamic range | >70 dB (peak value) |
| THz radiation source | LT-GaAs photoconductive antenna |
| THz detector | ZnTe electro-optic crystal |
| Sample Type | Determine Types | False Judgment Number | Recognition Rate of Each Type (%) | Overall Recognition Rate (%) | |||||
|---|---|---|---|---|---|---|---|---|---|
| Normal | Germinated | Moldy | Worm-Eaten | ||||||
| Training set | Normal | 38 | 38 | 0 | 0 | 0 | 0 | 100 | 100 |
| Germinated | 46 | 0 | 46 | 0 | 0 | 0 | 100 | ||
| Moldy | 39 | 0 | 0 | 39 | 0 | 0 | 100 | ||
| Worm-eaten | 37 | 0 | 0 | 0 | 37 | 0 | 100 | ||
| Test set | Normal | 22 | 22 | 0 | 0 | 0 | 0 | 100 | 97.5 |
| Germinated | 14 | 0 | 14 | 0 | 0 | 0 | 100 | ||
| Moldy | 21 | 0 | 0 | 20 | 1 | 1 | 95.24 | ||
| Worm-eaten | 23 | 1 | 0 | 0 | 22 | 1 | 96.65 | ||
| Sample Type | Determine Types | False Judgment Number | Recognition Rate of Each Type (%) | Overall Recognition Rate (%) | |||||
|---|---|---|---|---|---|---|---|---|---|
| Normal | Germinated | Moldy | Worm-Eaten | ||||||
| Training set | Normal | 38 | 38 | 0 | 0 | 0 | 0 | 100 | 100 |
| Germinated | 46 | 0 | 46 | 0 | 0 | 0 | 100 | ||
| Moldy | 39 | 0 | 0 | 39 | 0 | 0 | 100 | ||
| Worm-eaten | 37 | 0 | 0 | 0 | 37 | 0 | 100 | ||
| Test set | Normal | 22 | 22 | 0 | 0 | 0 | 0 | 100 | 93.75 |
| Germinated | 14 | 0 | 13 | 0 | 1 | 1 | 92.86 | ||
| Moldy | 21 | 1 | 0 | 19 | 1 | 2 | 90.48 | ||
| Worm-eaten | 23 | 1 | 0 | 1 | 21 | 2 | 91.3 | ||
| Sample Type | Determine Types | False Judgment Number | Recognition Rate of Each Type (%) | Overall Recognition Rate (%) | |||||
|---|---|---|---|---|---|---|---|---|---|
| Normal | Germinated | Moldy | Worm-Eaten | ||||||
| Training set | Normal | 38 | 38 | 0 | 0 | 0 | 0 | 100 | 100 |
| Germinated | 46 | 0 | 46 | 0 | 0 | 0 | 100 | ||
| Moldy | 39 | 0 | 0 | 39 | 0 | 0 | 100 | ||
| Worm-eaten | 37 | 0 | 0 | 0 | 37 | 0 | 100 | ||
| Test set | Normal | 22 | 22 | 0 | 0 | 0 | 0 | 100 | 90 |
| Germinated | 14 | 0 | 12 | 0 | 1 | 2 | 92.86 | ||
| Moldy | 21 | 1 | 0 | 18 | 2 | 3 | 85.71 | ||
| Worm-eaten | 23 | 1 | 0 | 2 | 20 | 3 | 86.96 | ||
| Sample Type | Determine Types | False Judgment Number | Recognition Rate of Each Type (%) | Overall Recognition Rate (%) | |||||
|---|---|---|---|---|---|---|---|---|---|
| Normal | Germinated | Moldy | Worm-Eaten | ||||||
| Training set | Normal | 38 | 38 | 0 | 0 | 0 | 0 | 100 | 100 |
| Germinated | 46 | 0 | 46 | 0 | 0 | 0 | 100 | ||
| Moldy | 39 | 0 | 0 | 39 | 0 | 0 | 100 | ||
| Worm-eaten | 37 | 0 | 0 | 0 | 37 | 0 | 100 | ||
| Test set | Normal | 22 | 22 | 0 | 0 | 0 | 0 | 100 | 96.25 |
| Germinated | 14 | 0 | 14 | 0 | 0 | 0 | 100 | ||
| Moldy | 21 | 0 | 0 | 20 | 1 | 1 | 95.24 | ||
| Worm-eaten | 23 | 0 | 1 | 1 | 21 | 2 | 91.3 | ||
© 2018 by the authors. Licensee MDPI, Basel, Switzerland. This article is an open access article distributed under the terms and conditions of the Creative Commons Attribution (CC BY) license (http://creativecommons.org/licenses/by/4.0/).
Share and Cite
Ge, H.; Jiang, Y.; Zhang, Y. THz Spectroscopic Investigation of Wheat-Quality by Using Multi-Source Data Fusion. Sensors 2018, 18, 3945. https://doi.org/10.3390/s18113945
Ge H, Jiang Y, Zhang Y. THz Spectroscopic Investigation of Wheat-Quality by Using Multi-Source Data Fusion. Sensors. 2018; 18(11):3945. https://doi.org/10.3390/s18113945
Chicago/Turabian StyleGe, Hongyi, Yuying Jiang, and Yuan Zhang. 2018. "THz Spectroscopic Investigation of Wheat-Quality by Using Multi-Source Data Fusion" Sensors 18, no. 11: 3945. https://doi.org/10.3390/s18113945
APA StyleGe, H., Jiang, Y., & Zhang, Y. (2018). THz Spectroscopic Investigation of Wheat-Quality by Using Multi-Source Data Fusion. Sensors, 18(11), 3945. https://doi.org/10.3390/s18113945