Non-Intrusive Cable Fault Diagnosis Based on Inductive Directional Coupling


Abstract
1. Introduction
2. Theory of Inductive Directional Non-Intrusive Cable Fault Diagnosis
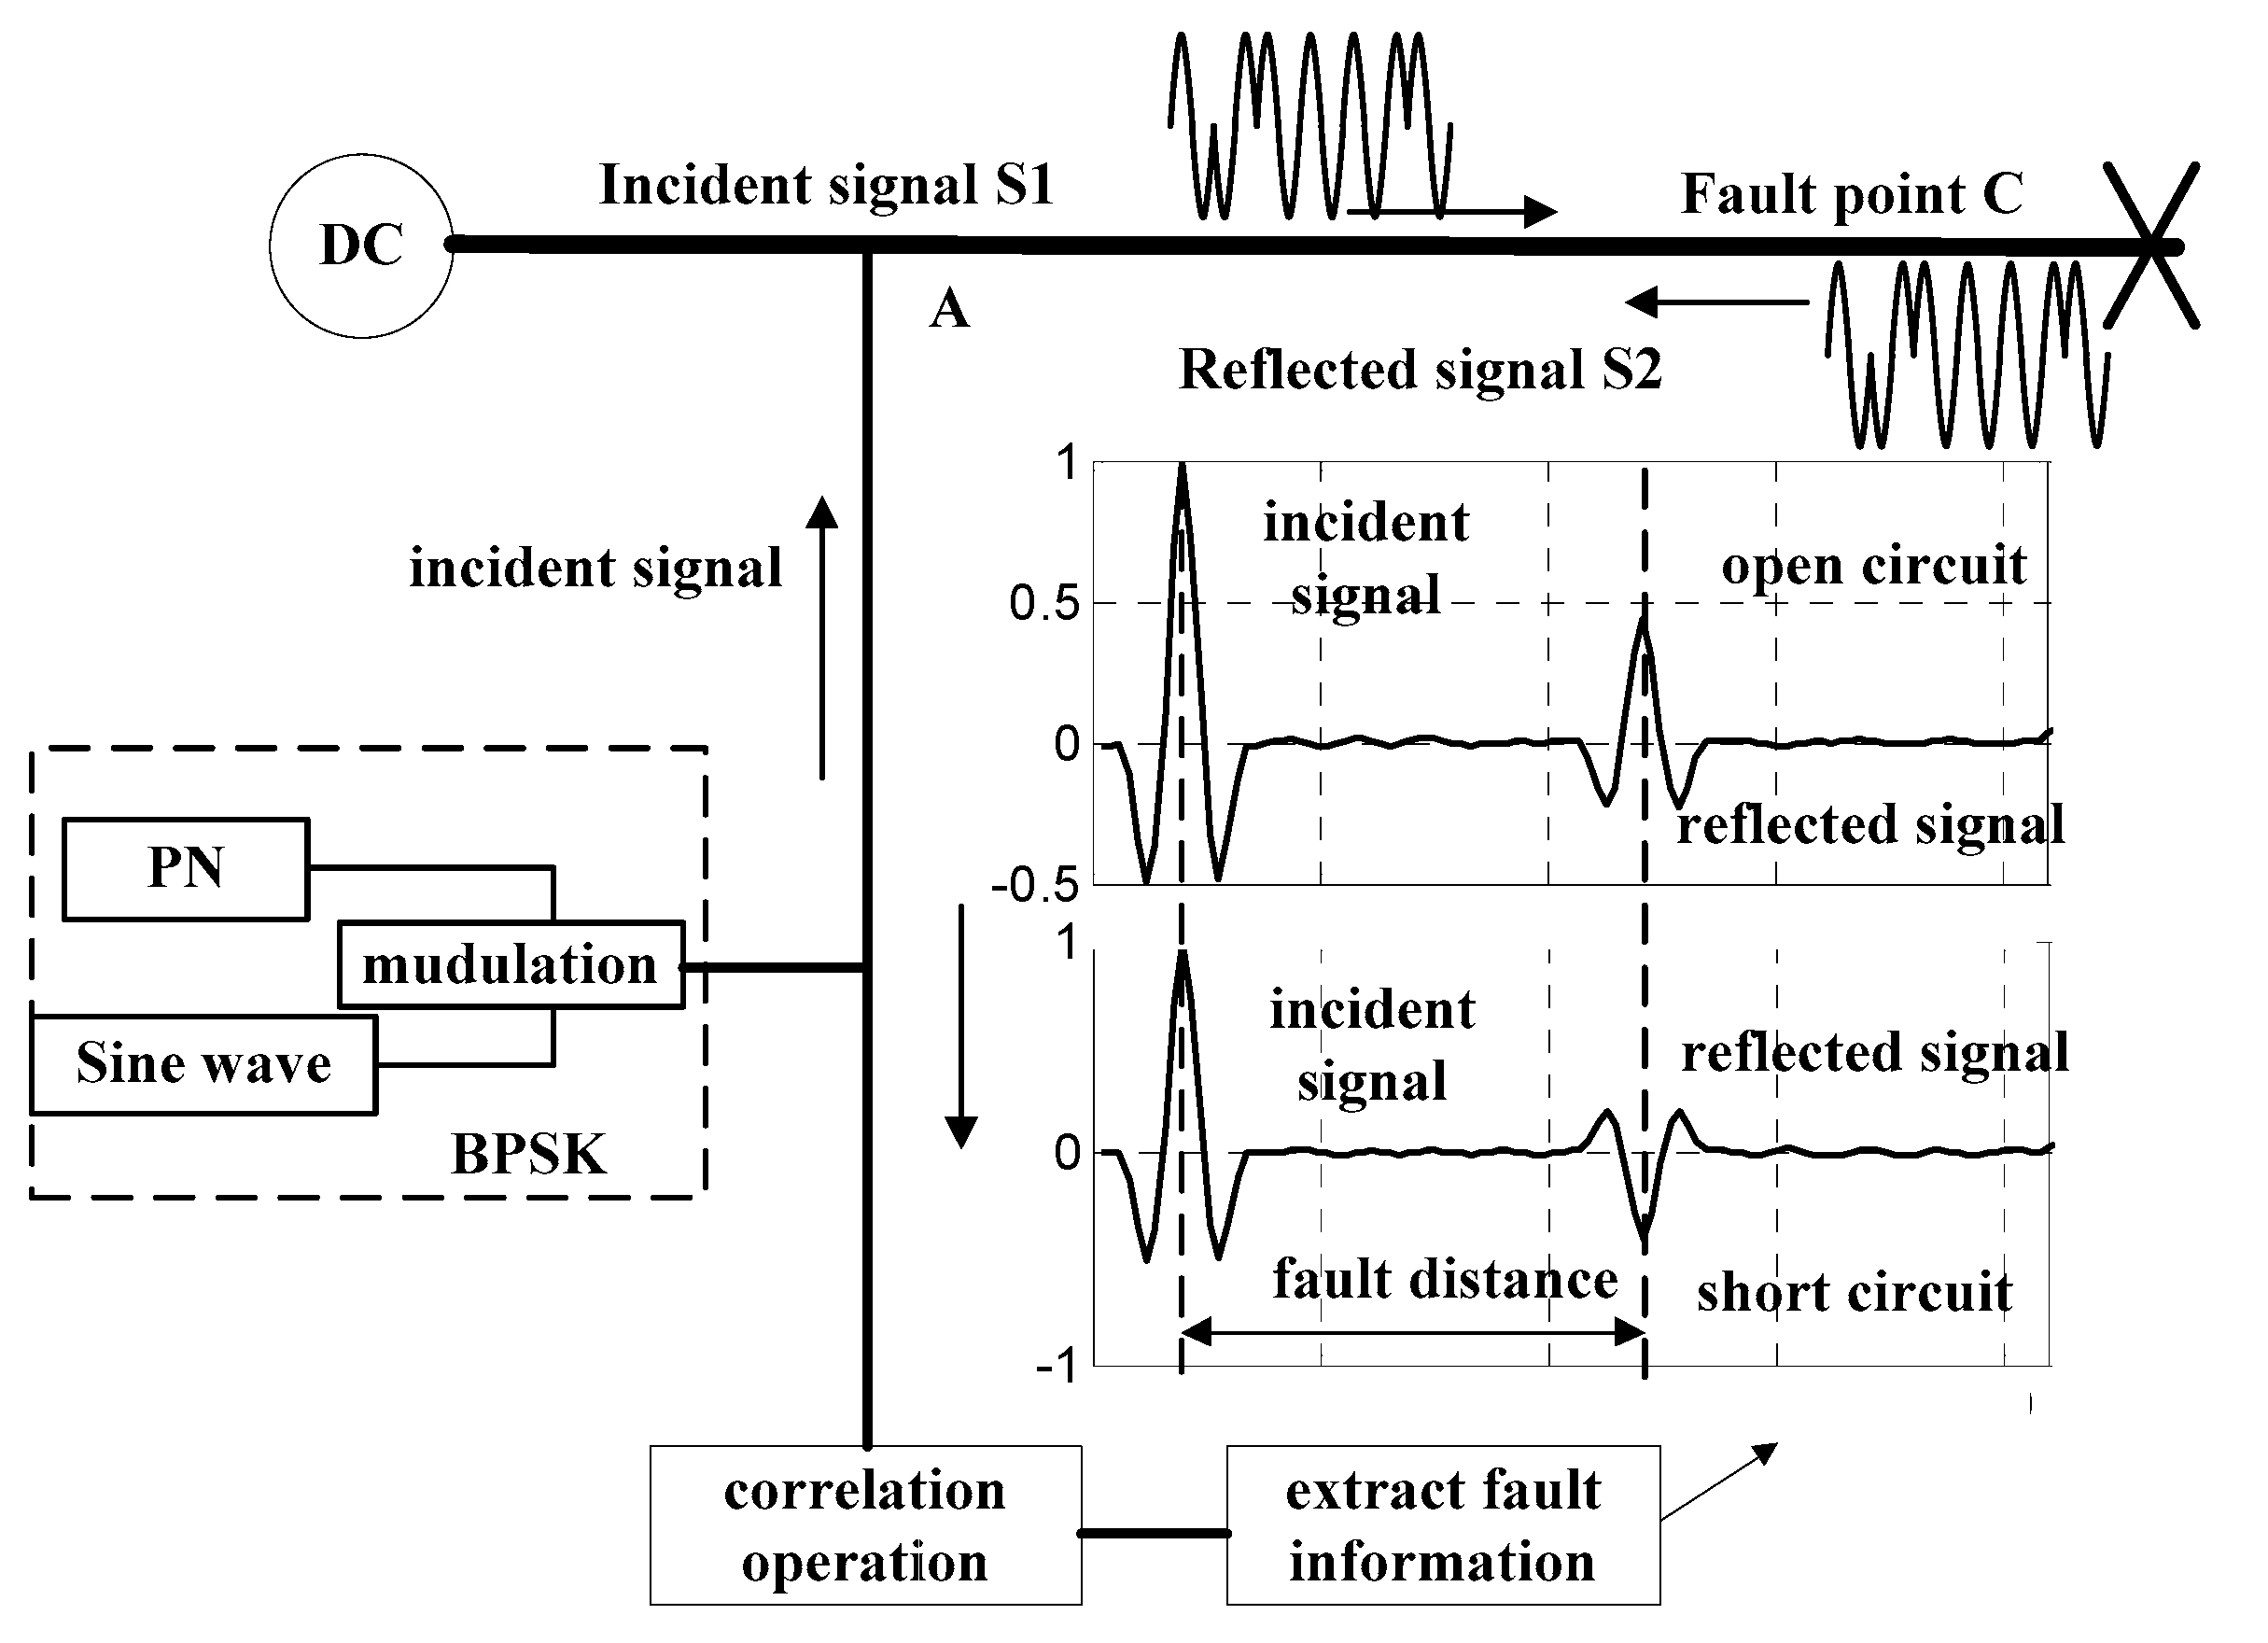
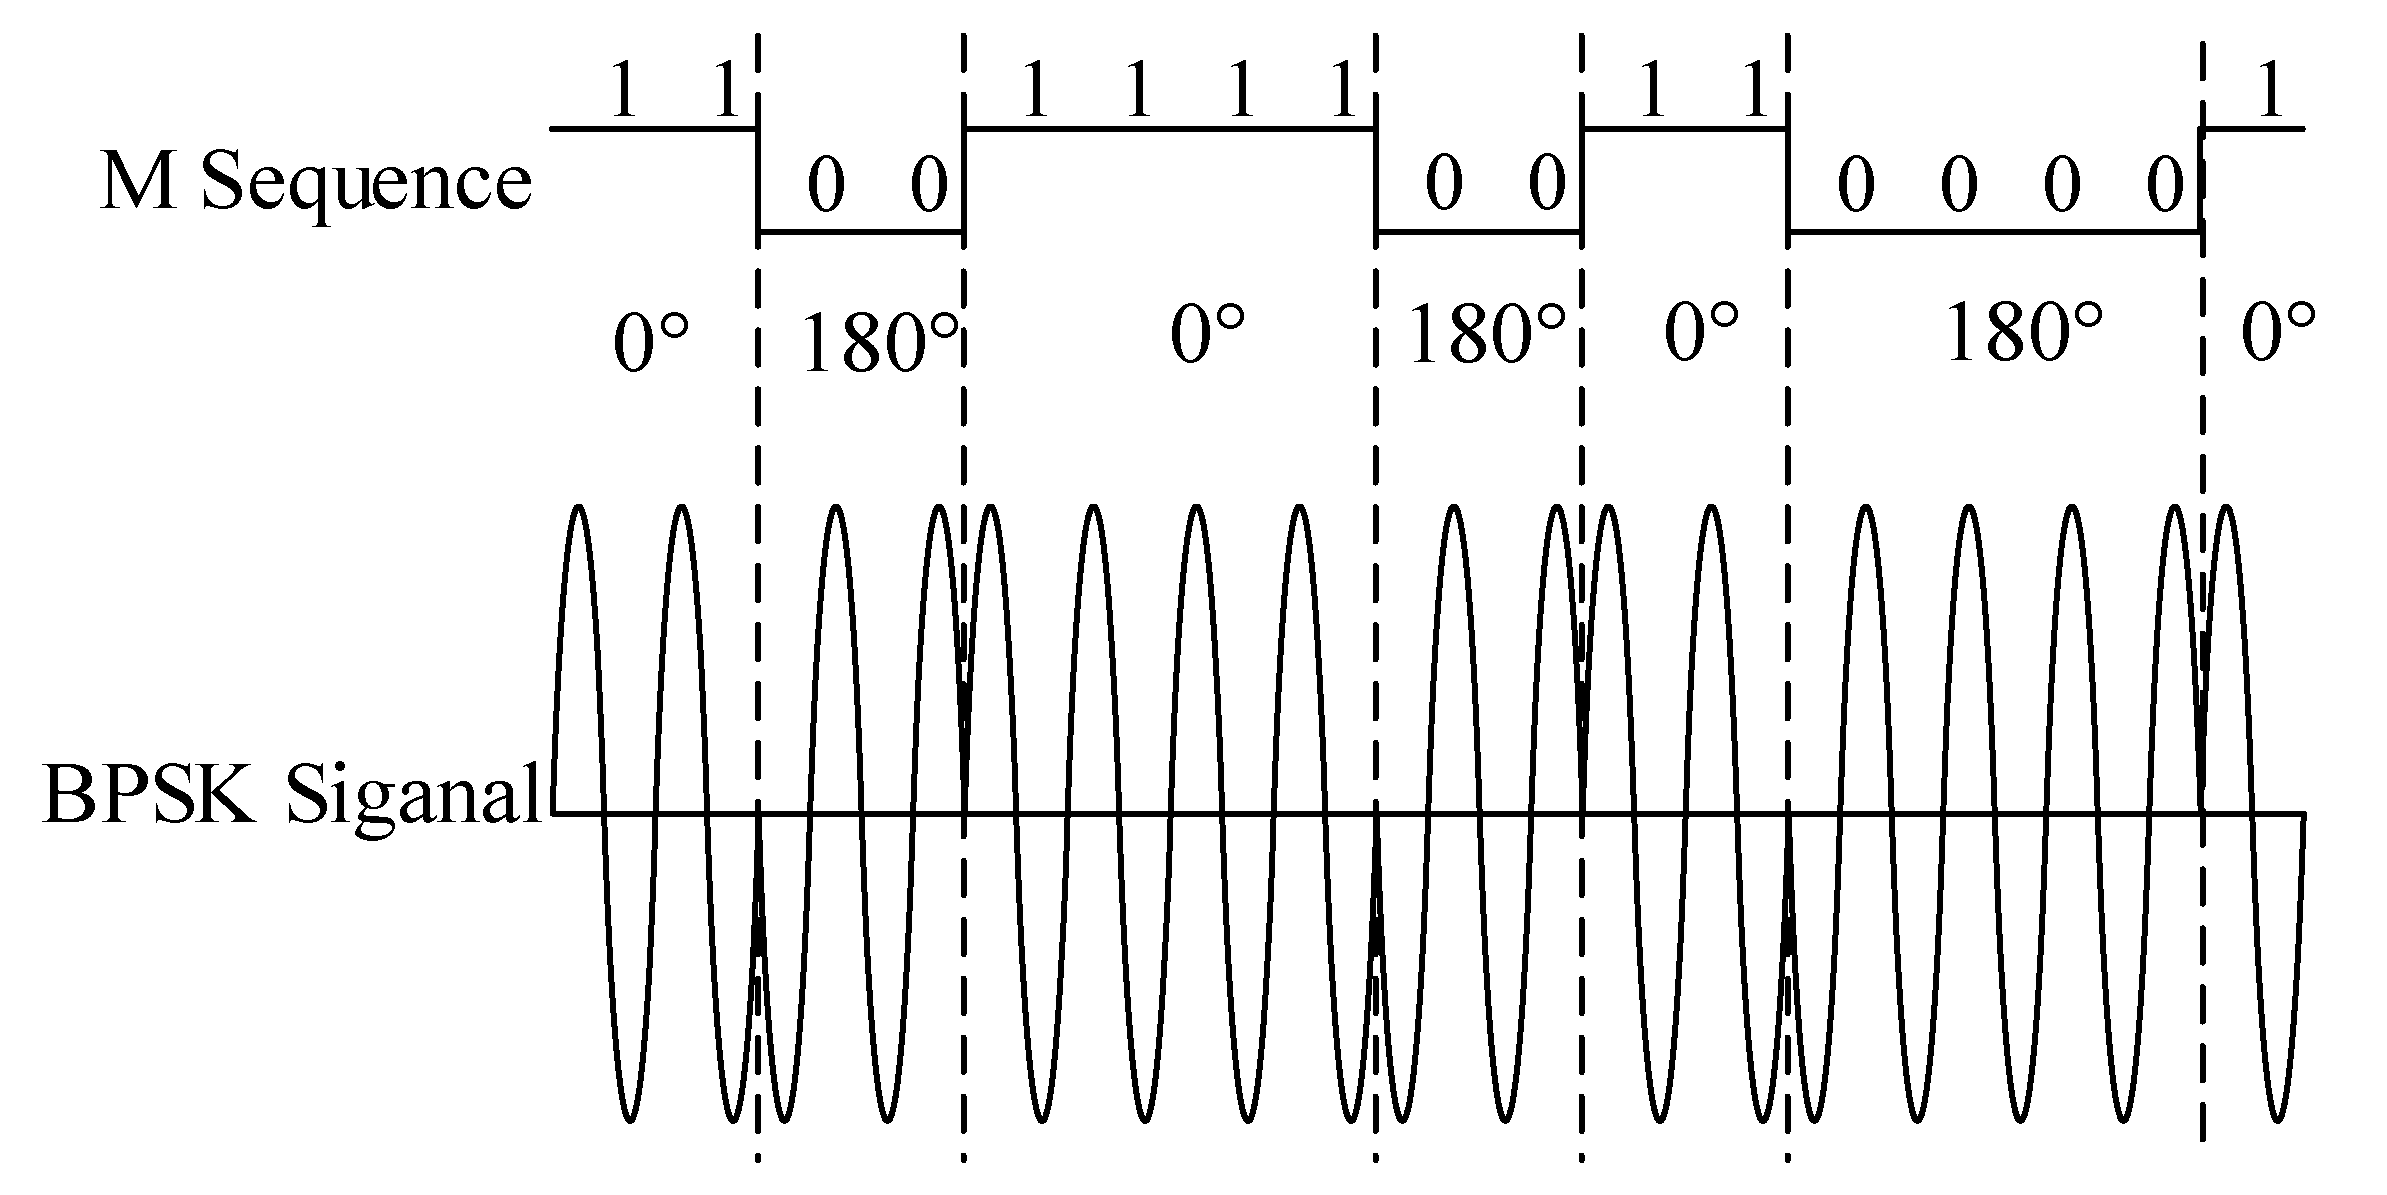
2.1. Theory of Cable Fault Diagnosis by SSTDR
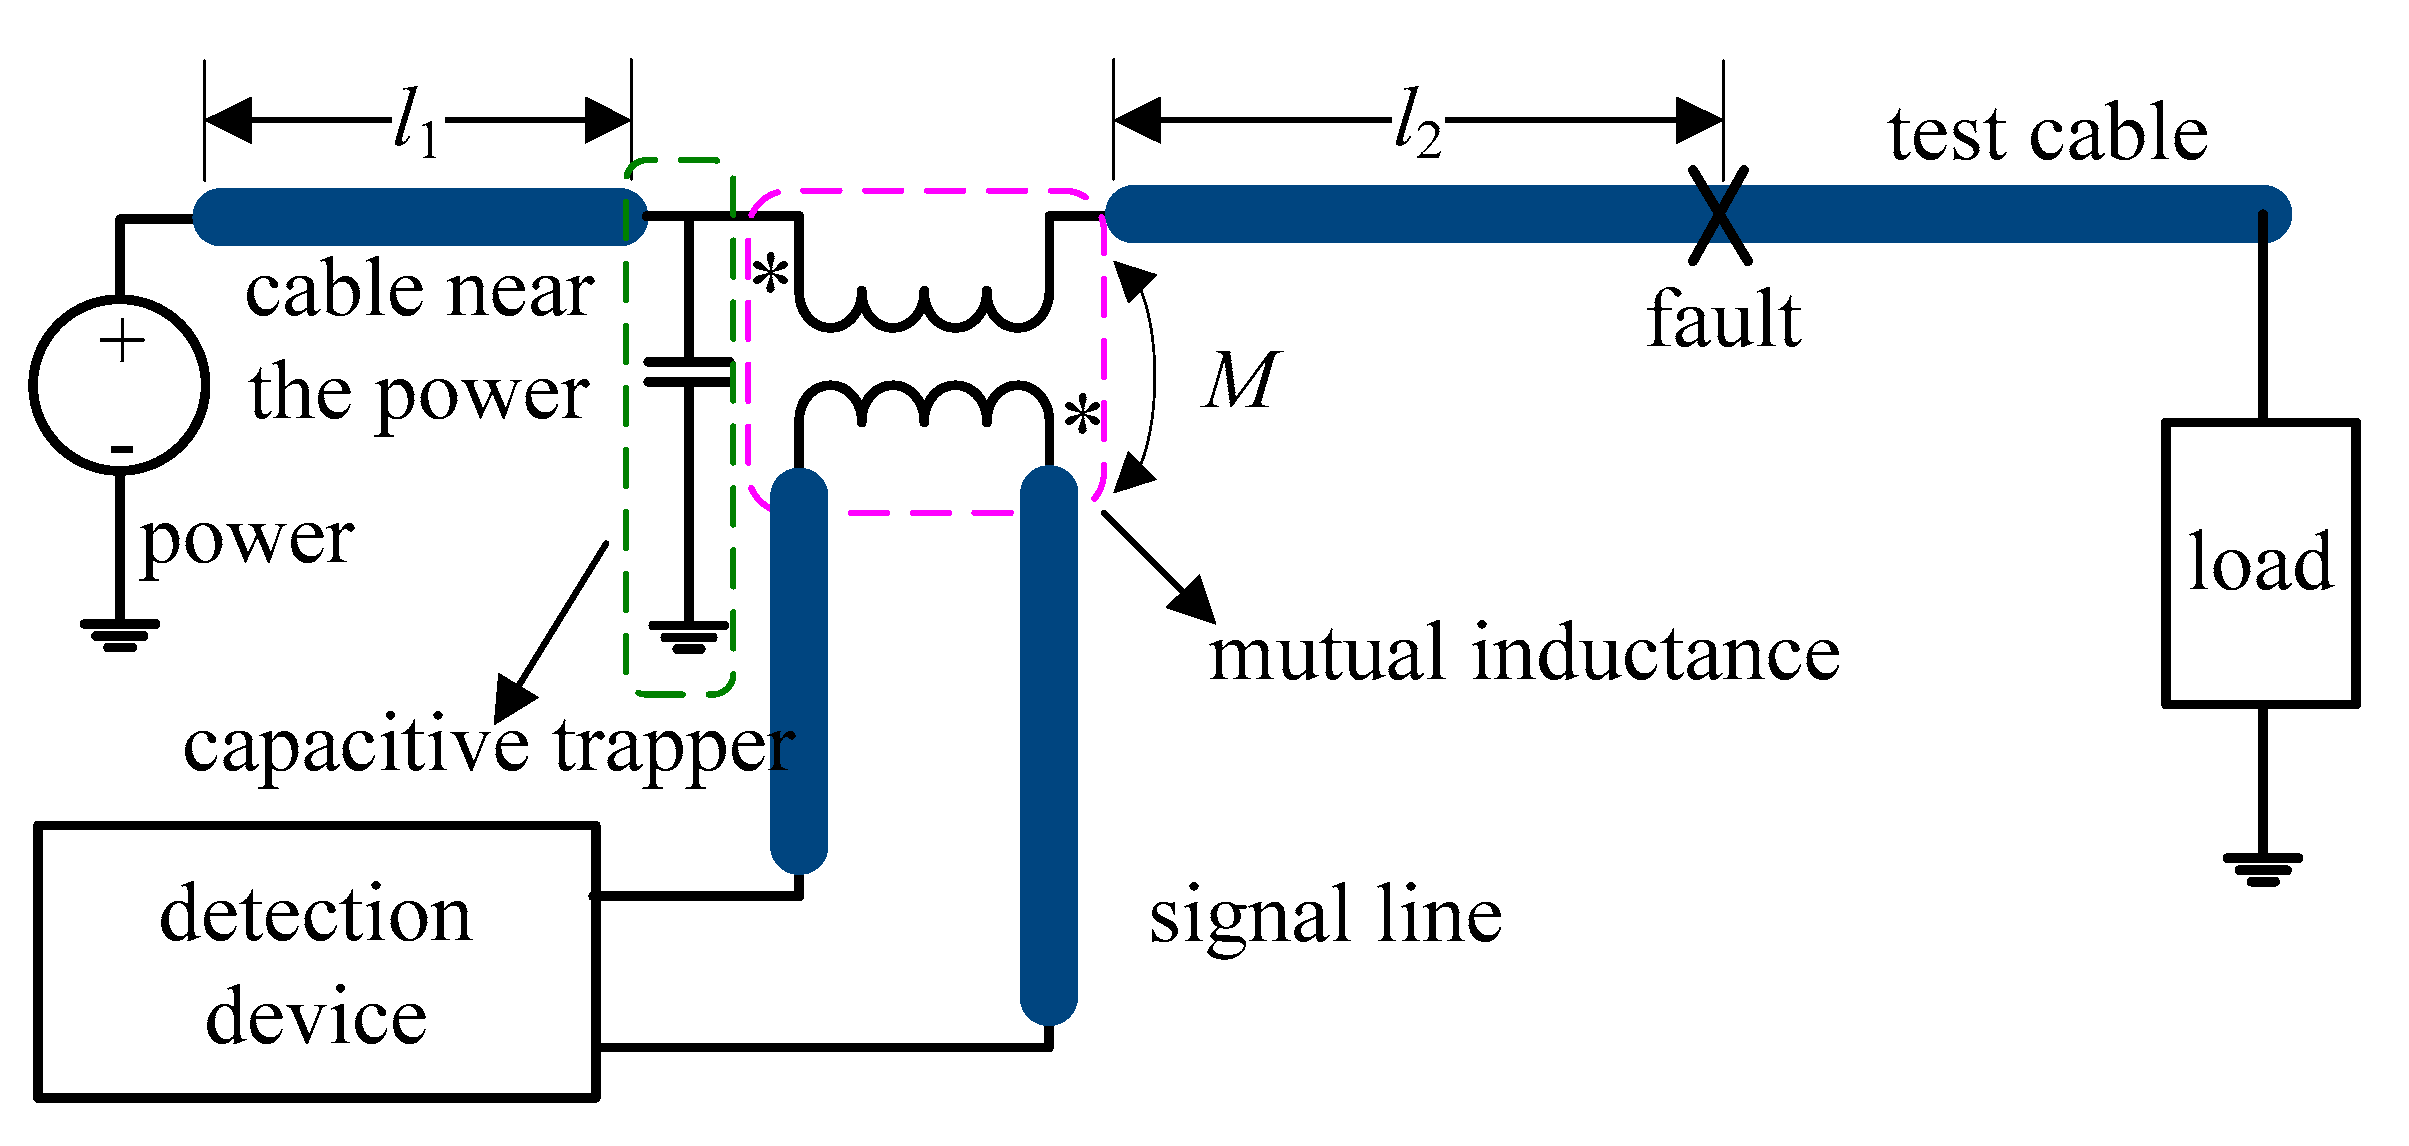
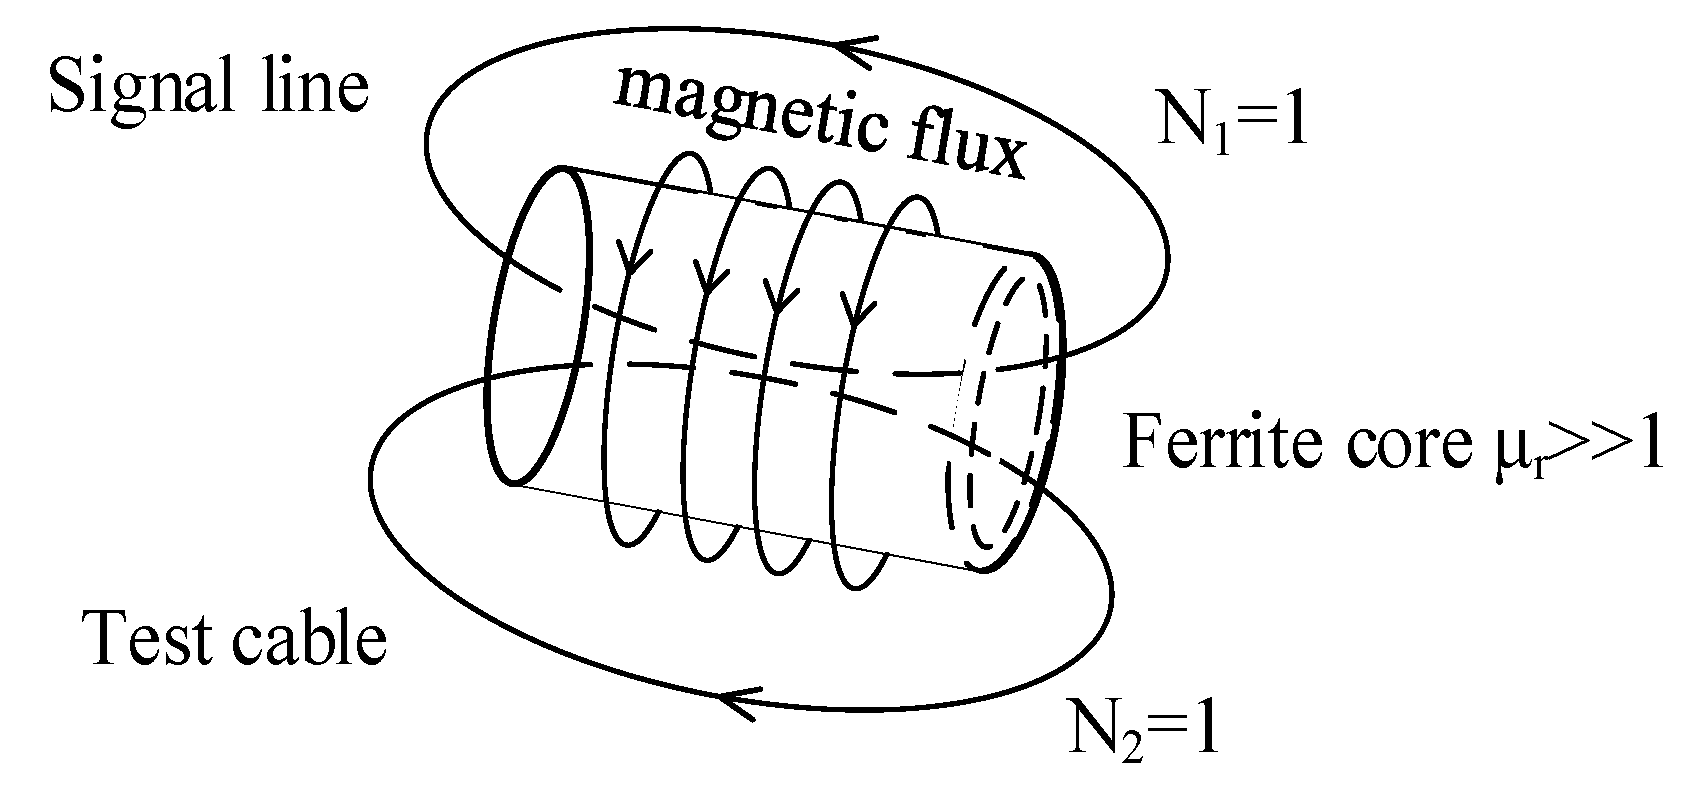
2.2. Non-Intrusive Inductive Coupling
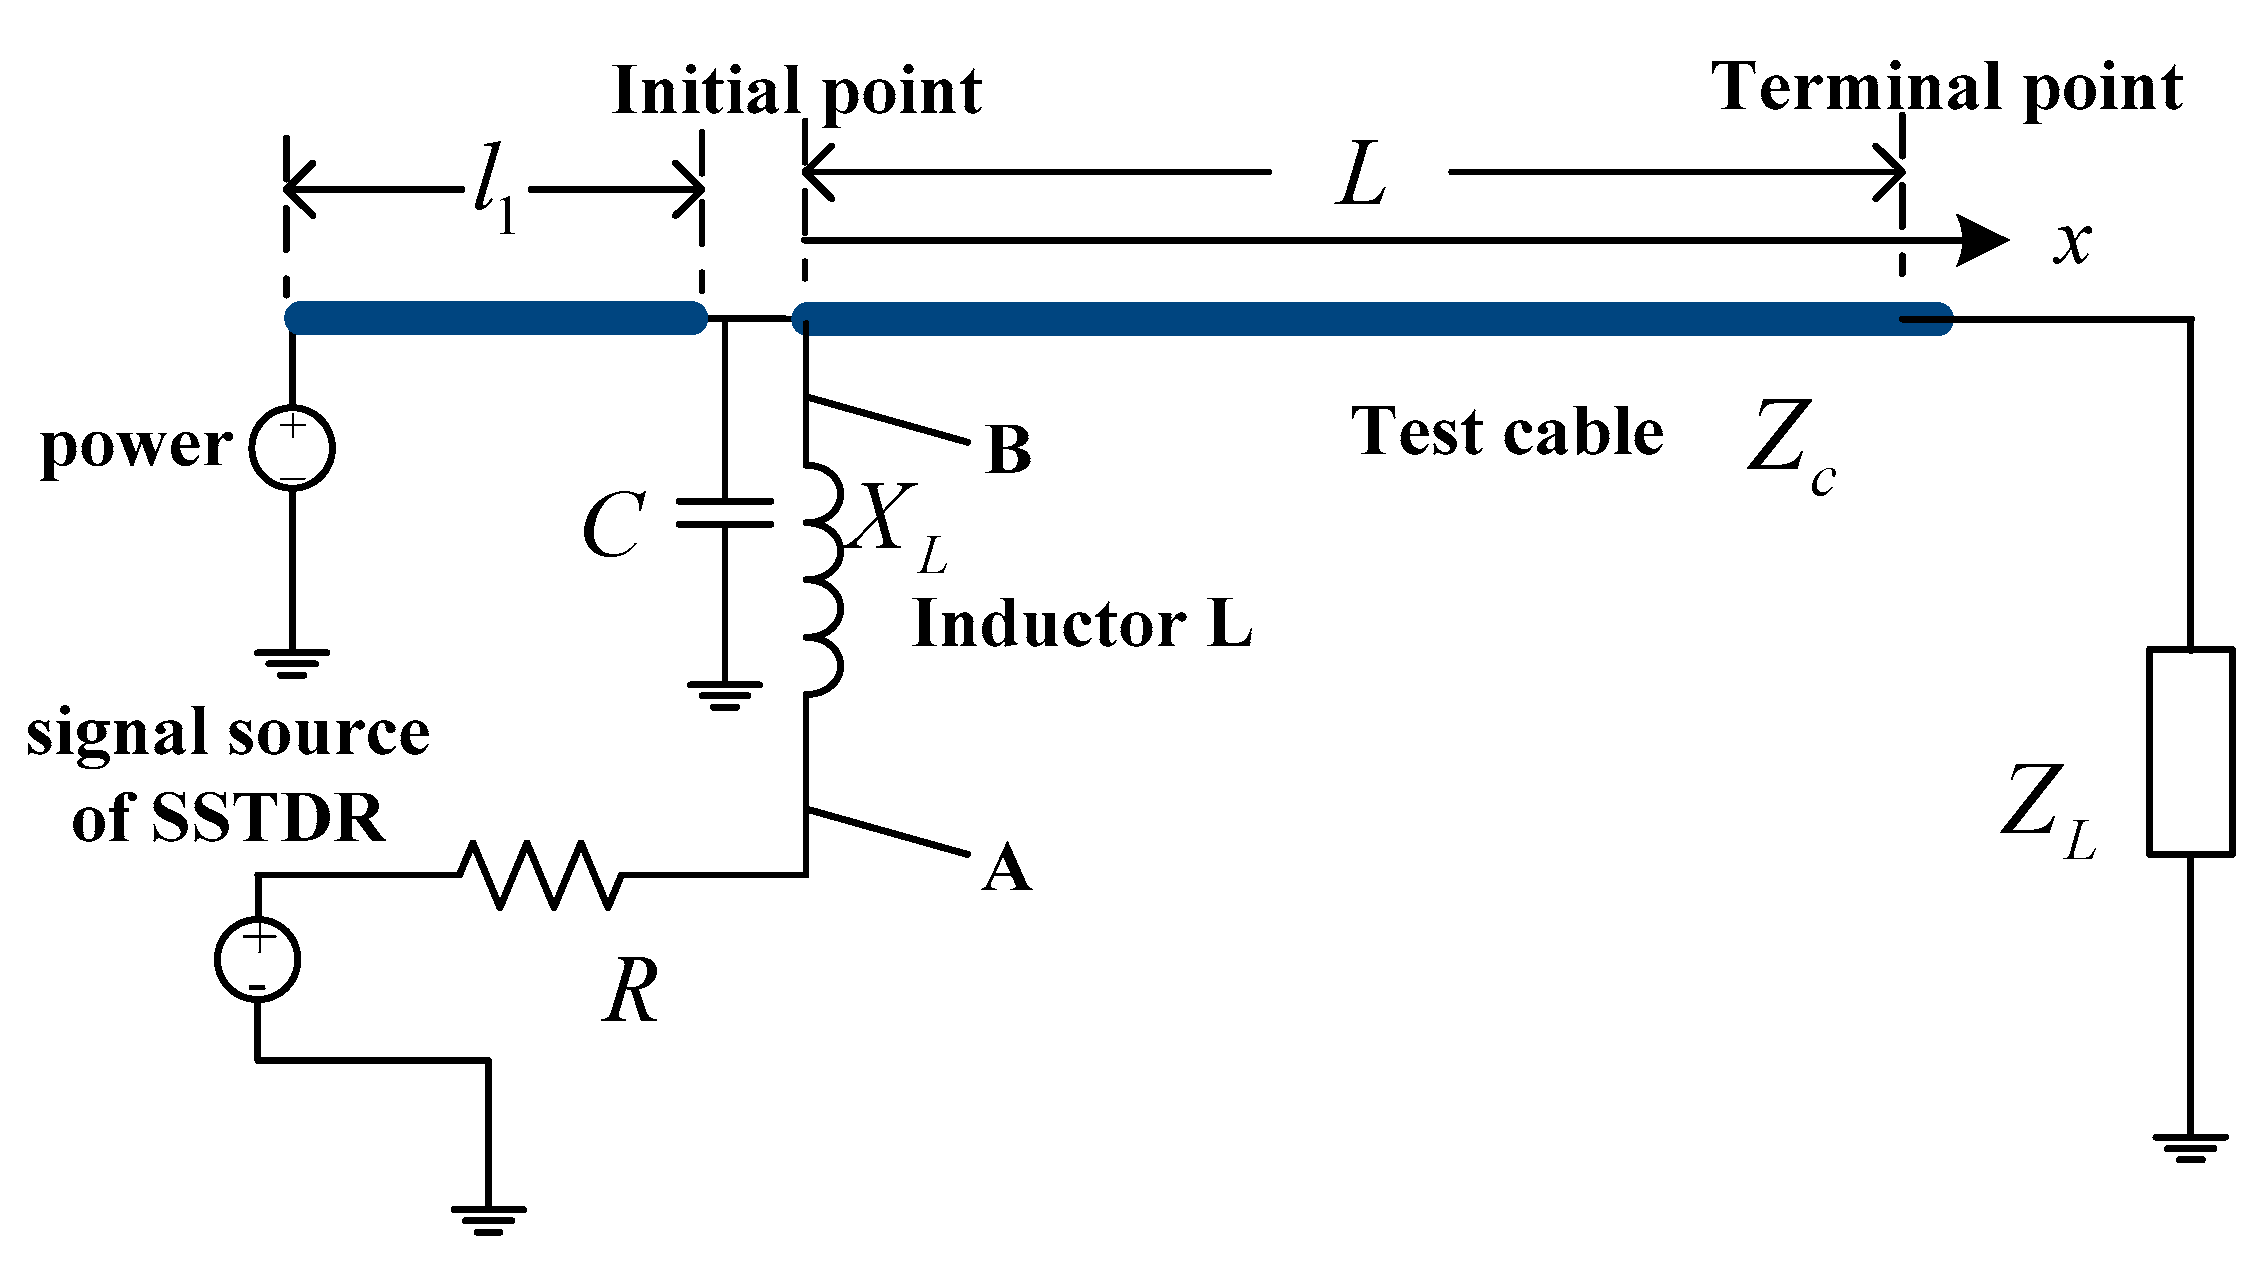
2.3. Directional Coupling
3. Simulation of Inductive Directional Cable Fault Diagnosis
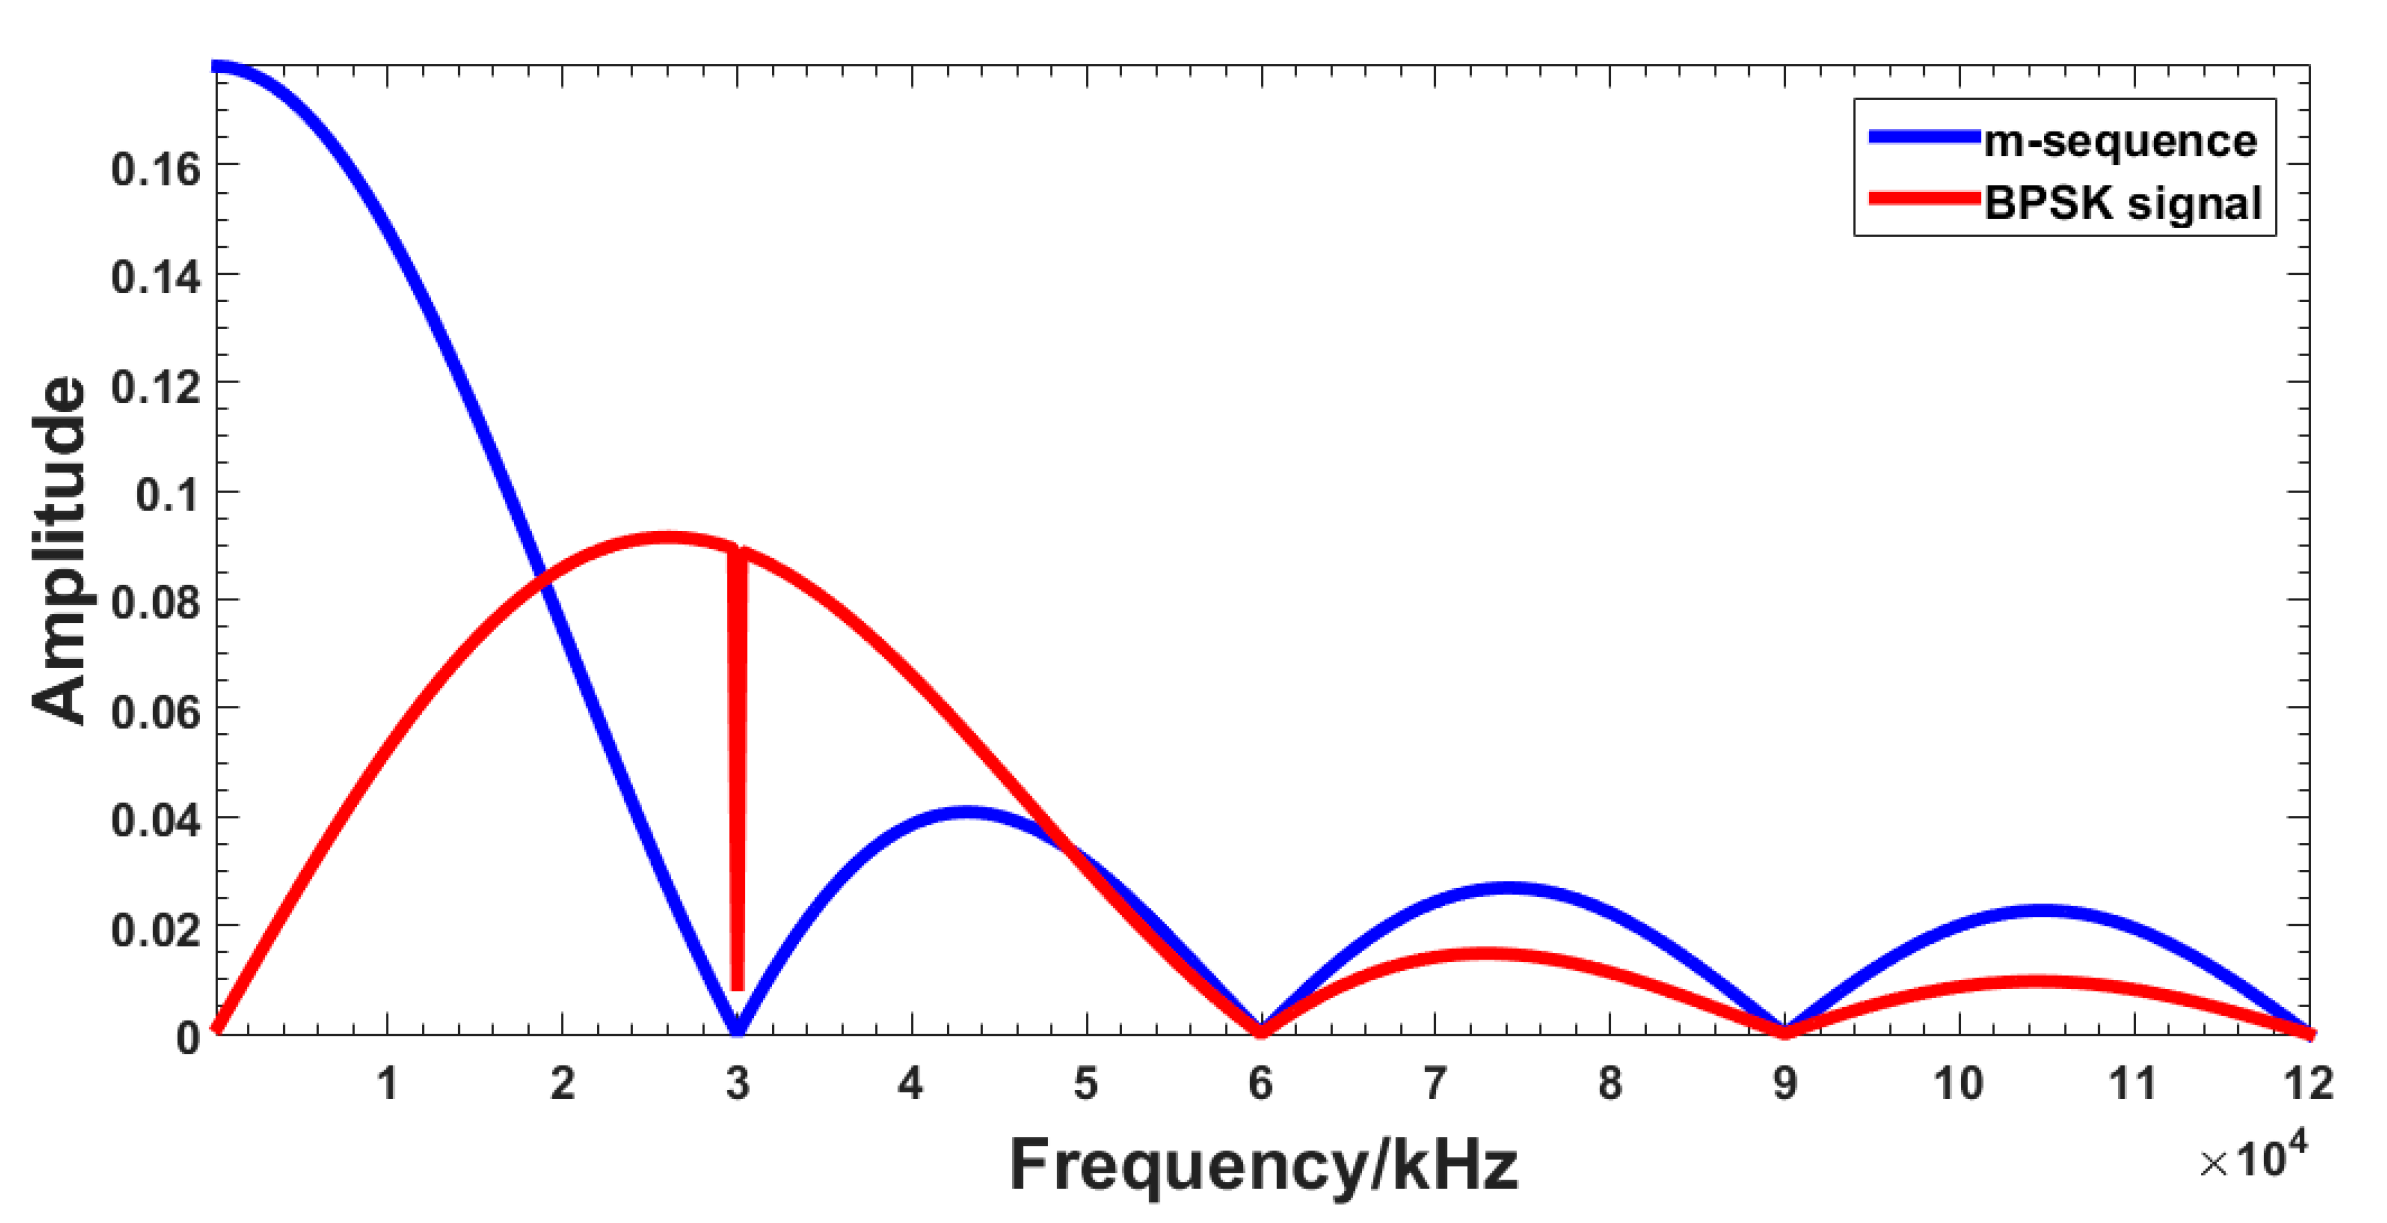
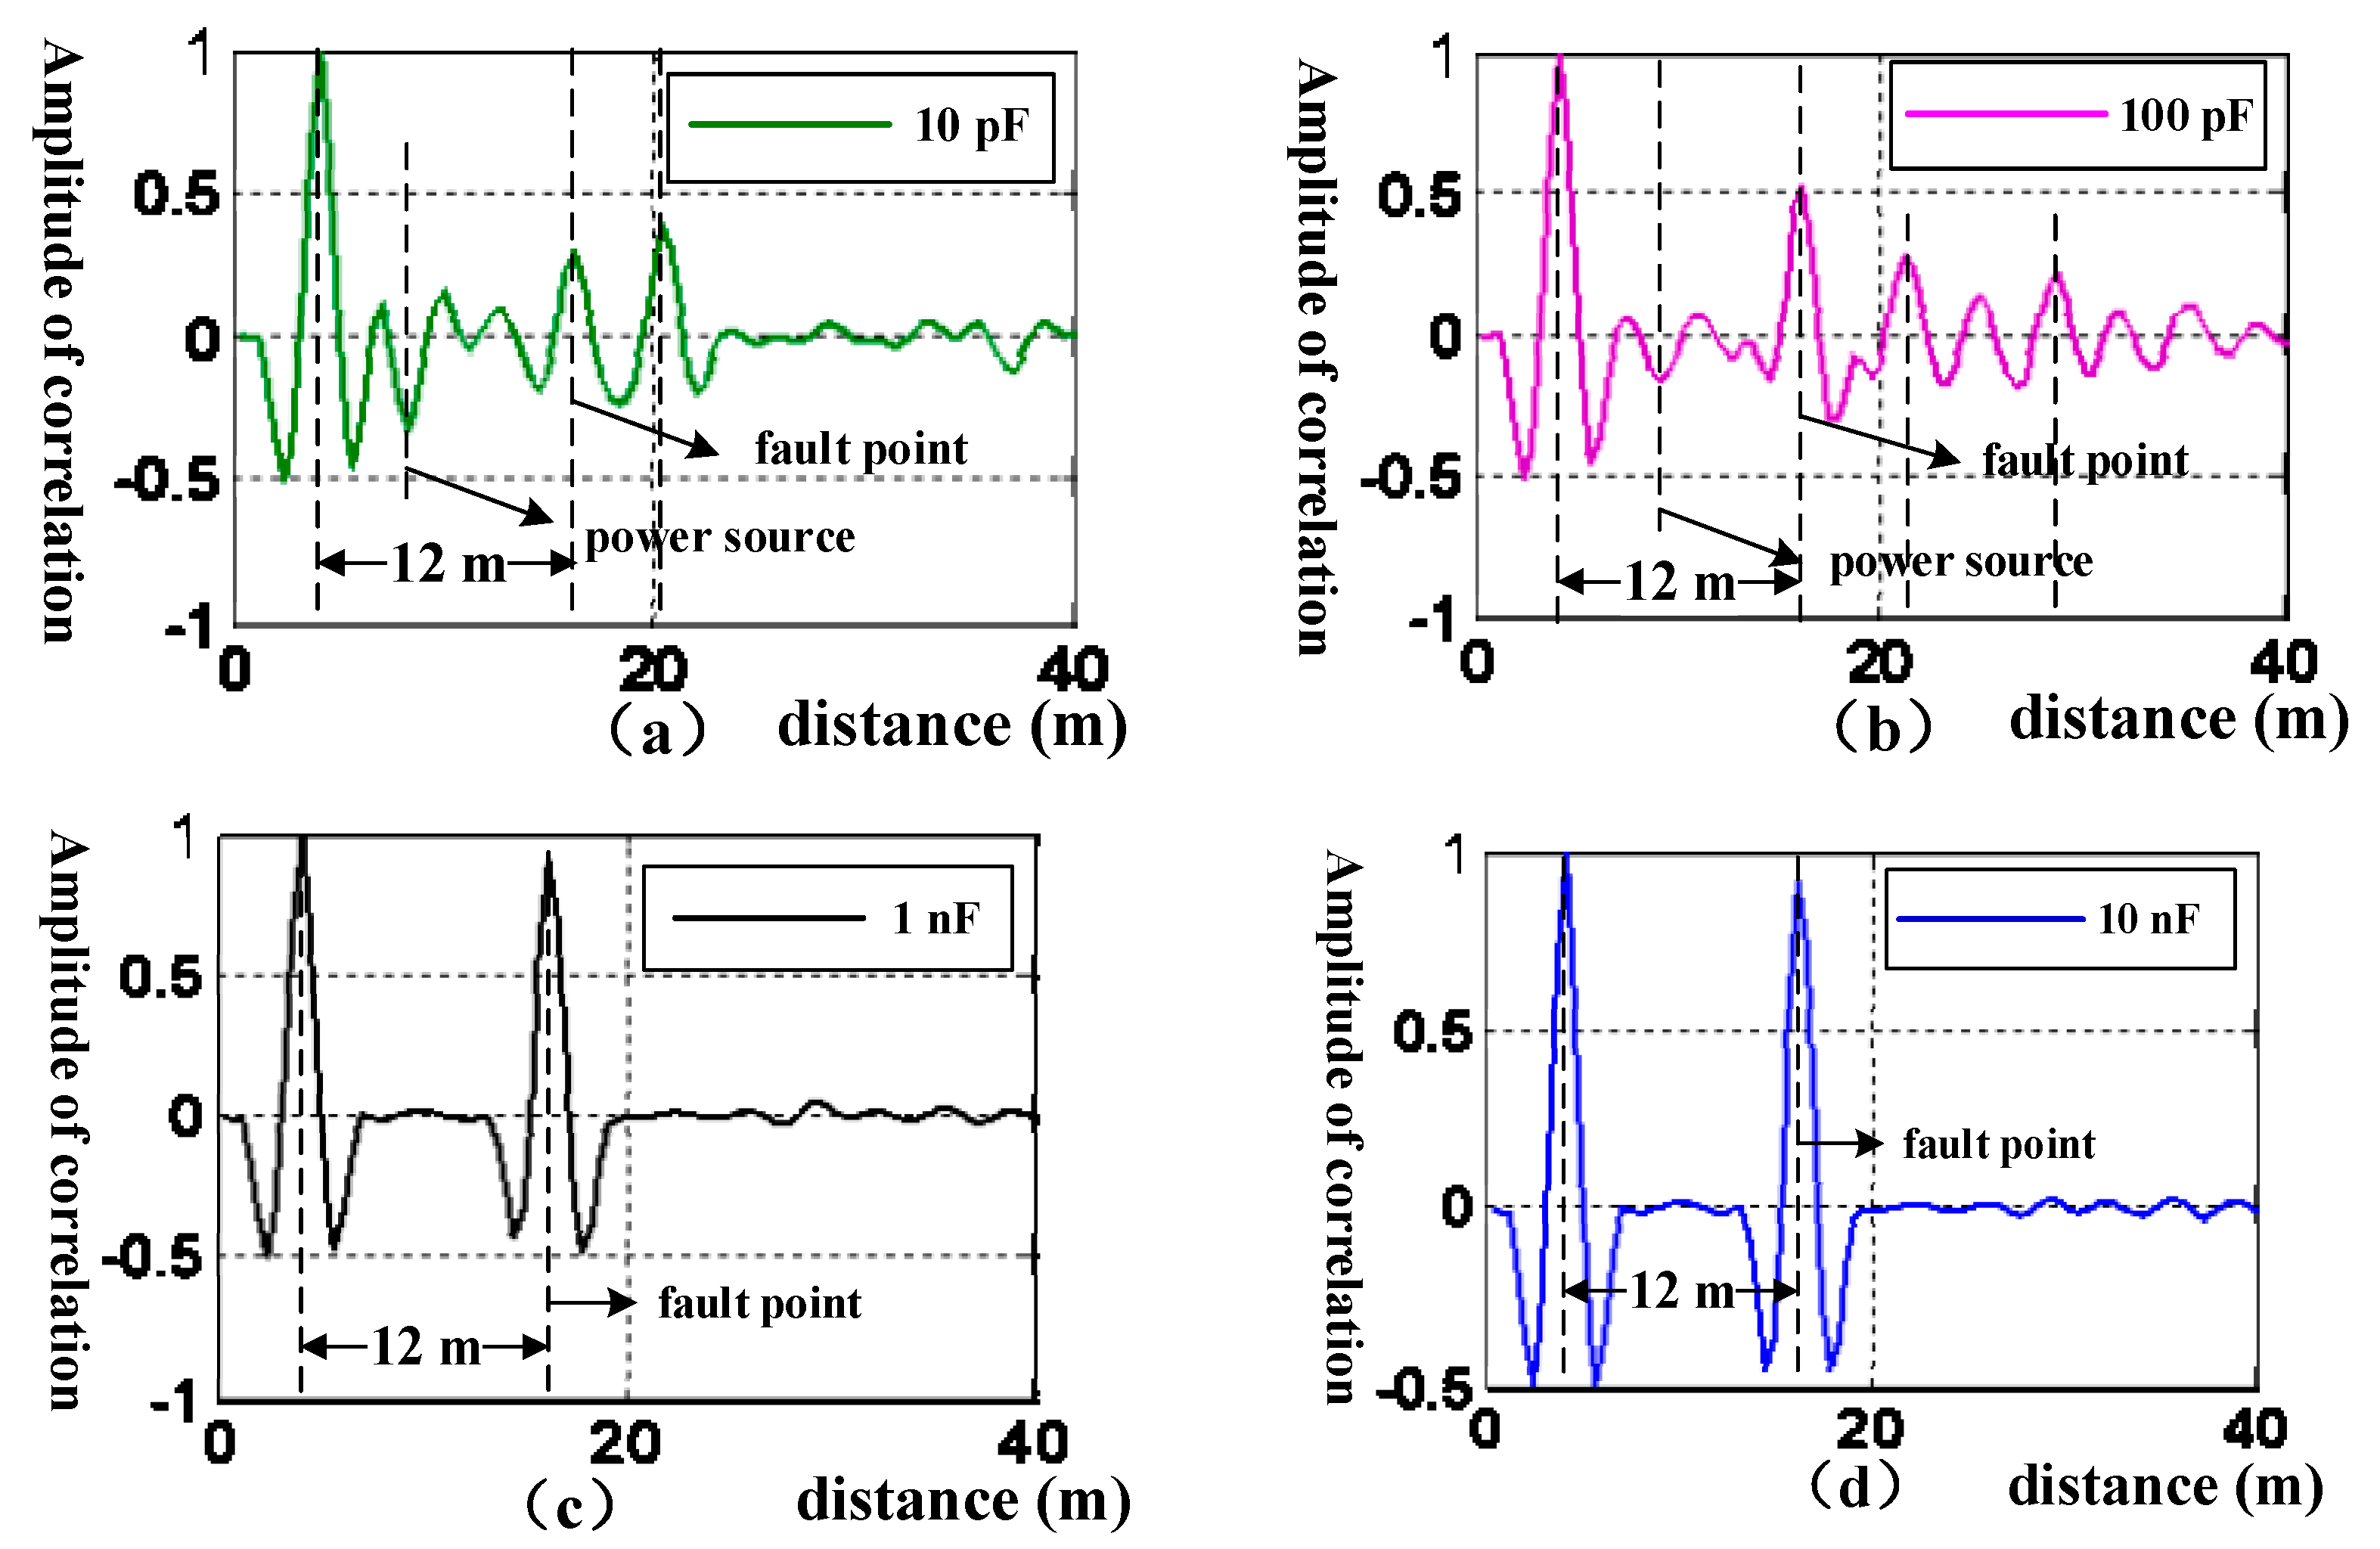
3.1. Attenuation Characteristics of Non-Intrusive Coupling Cable Fault Diagnosis
3.2. Simulation of Inductive Non-Intrusive Coupling Cable Fault Diagnosis
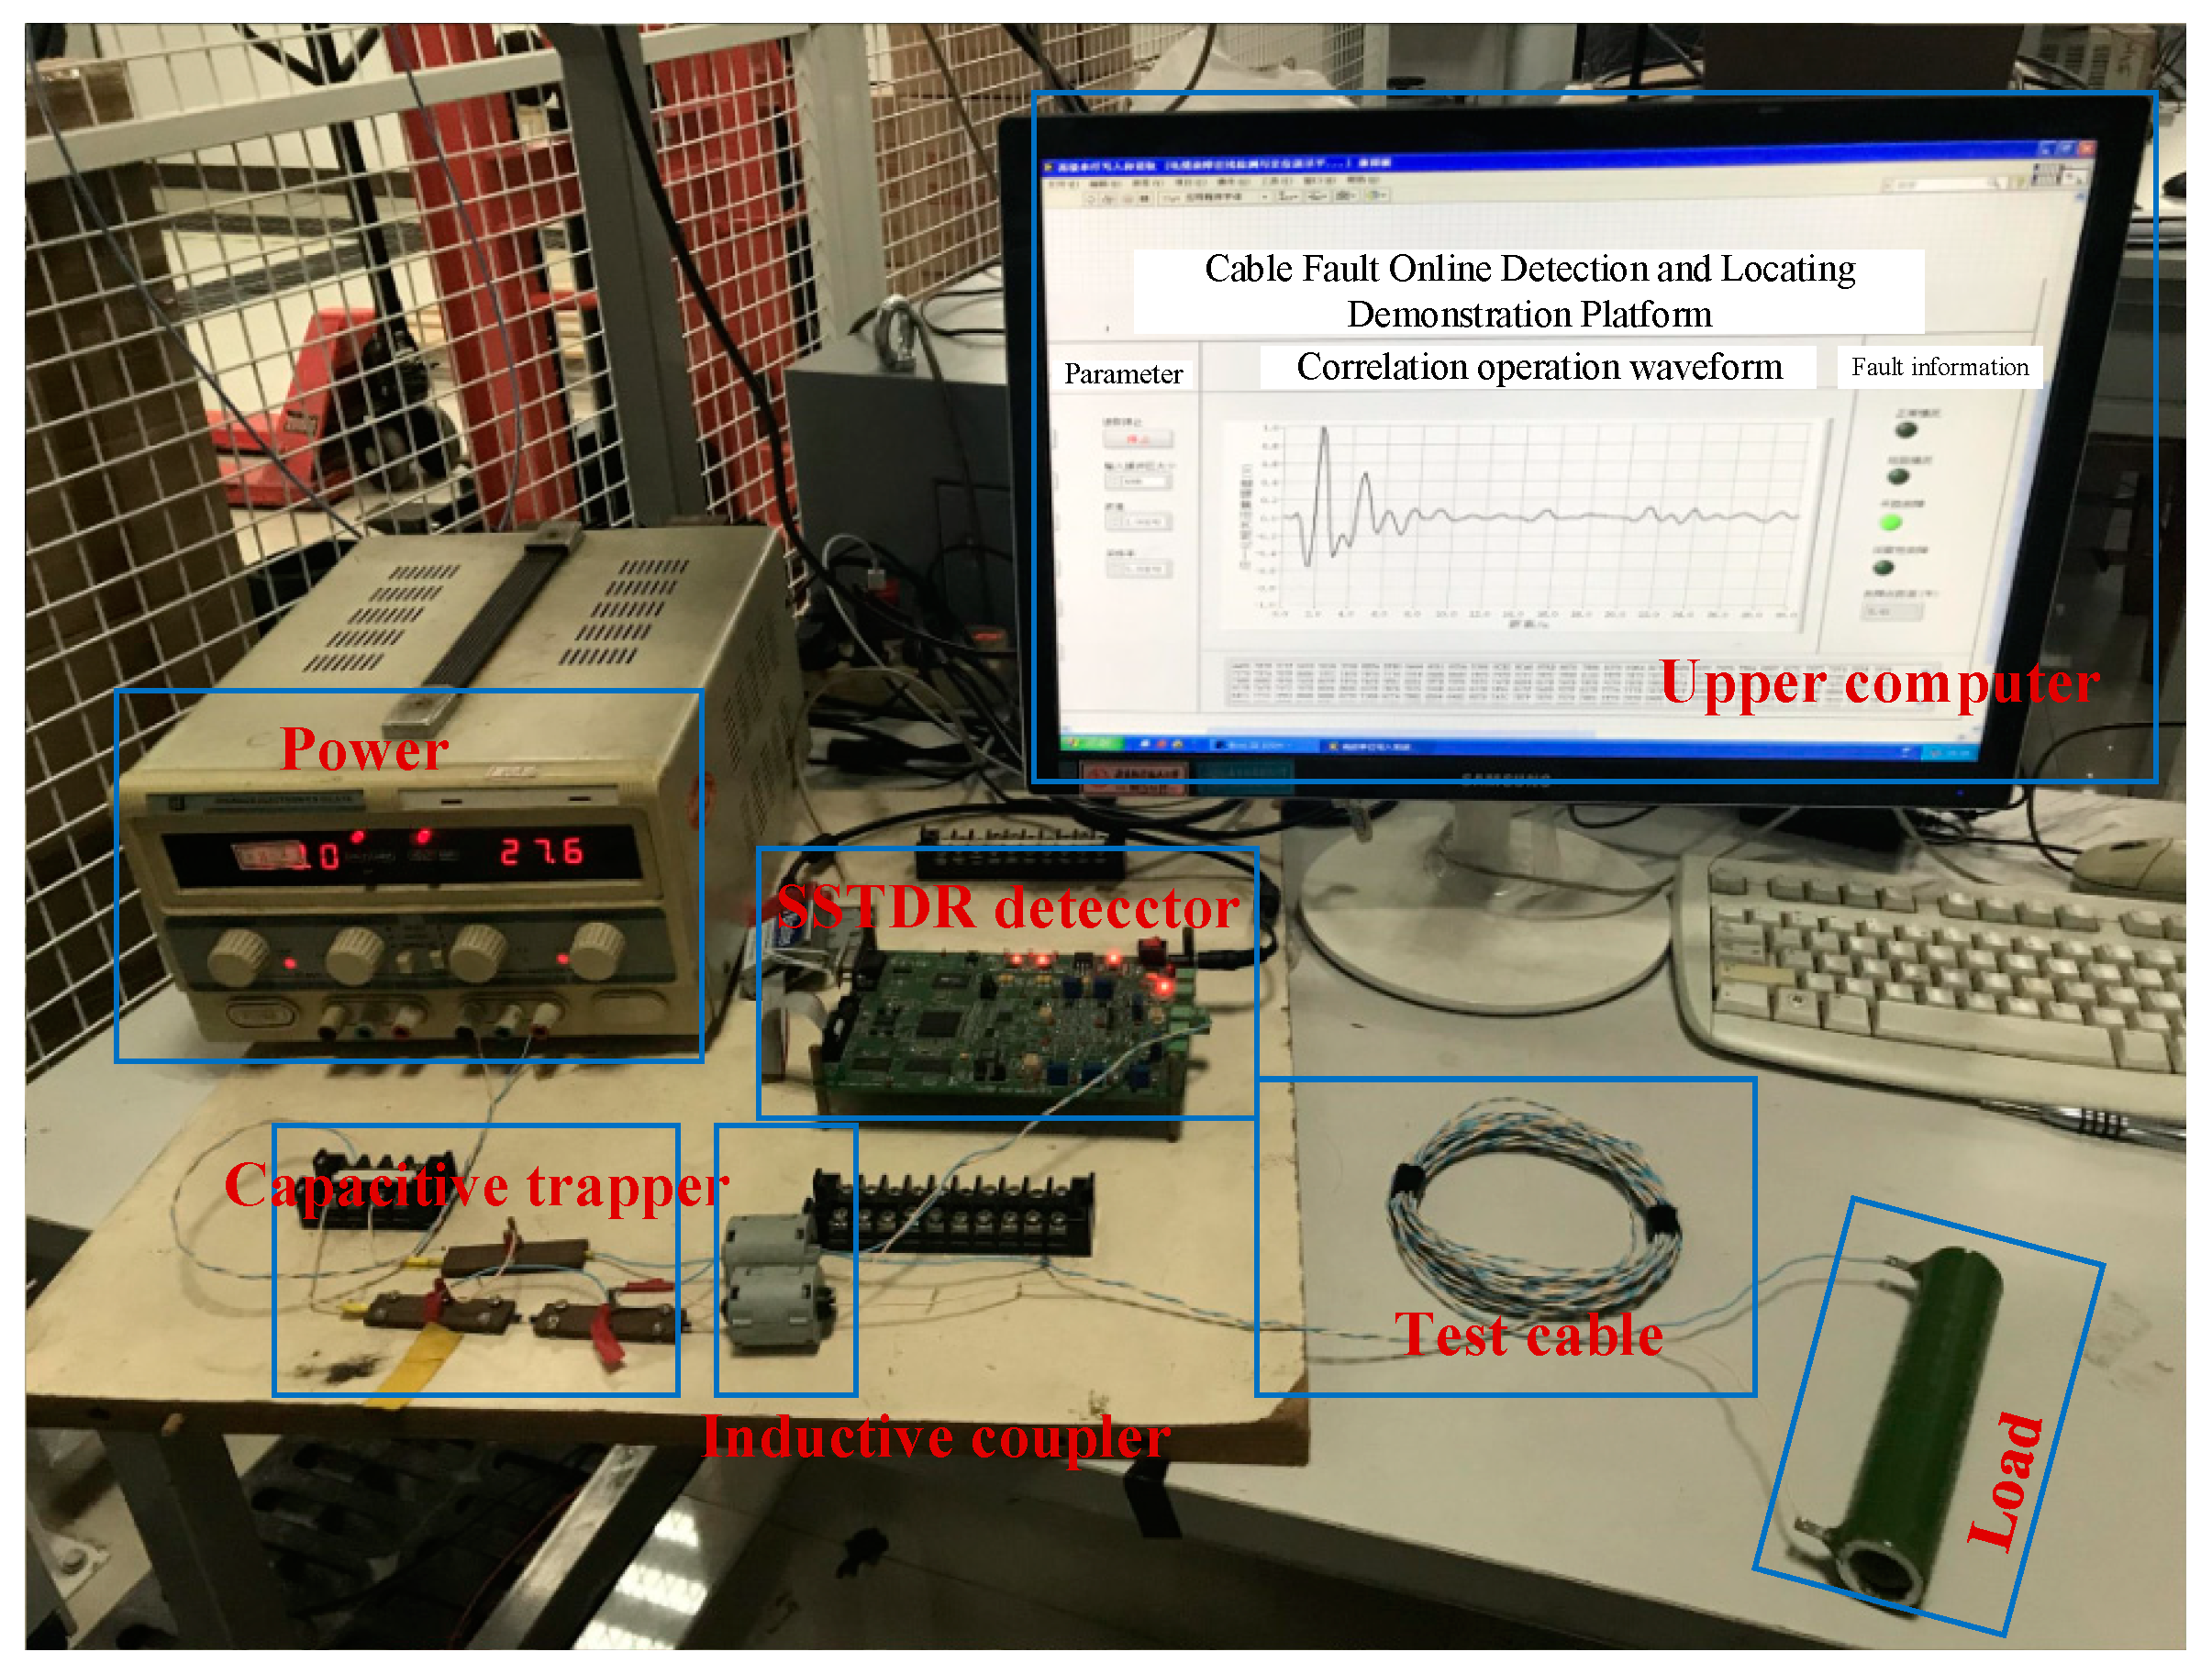
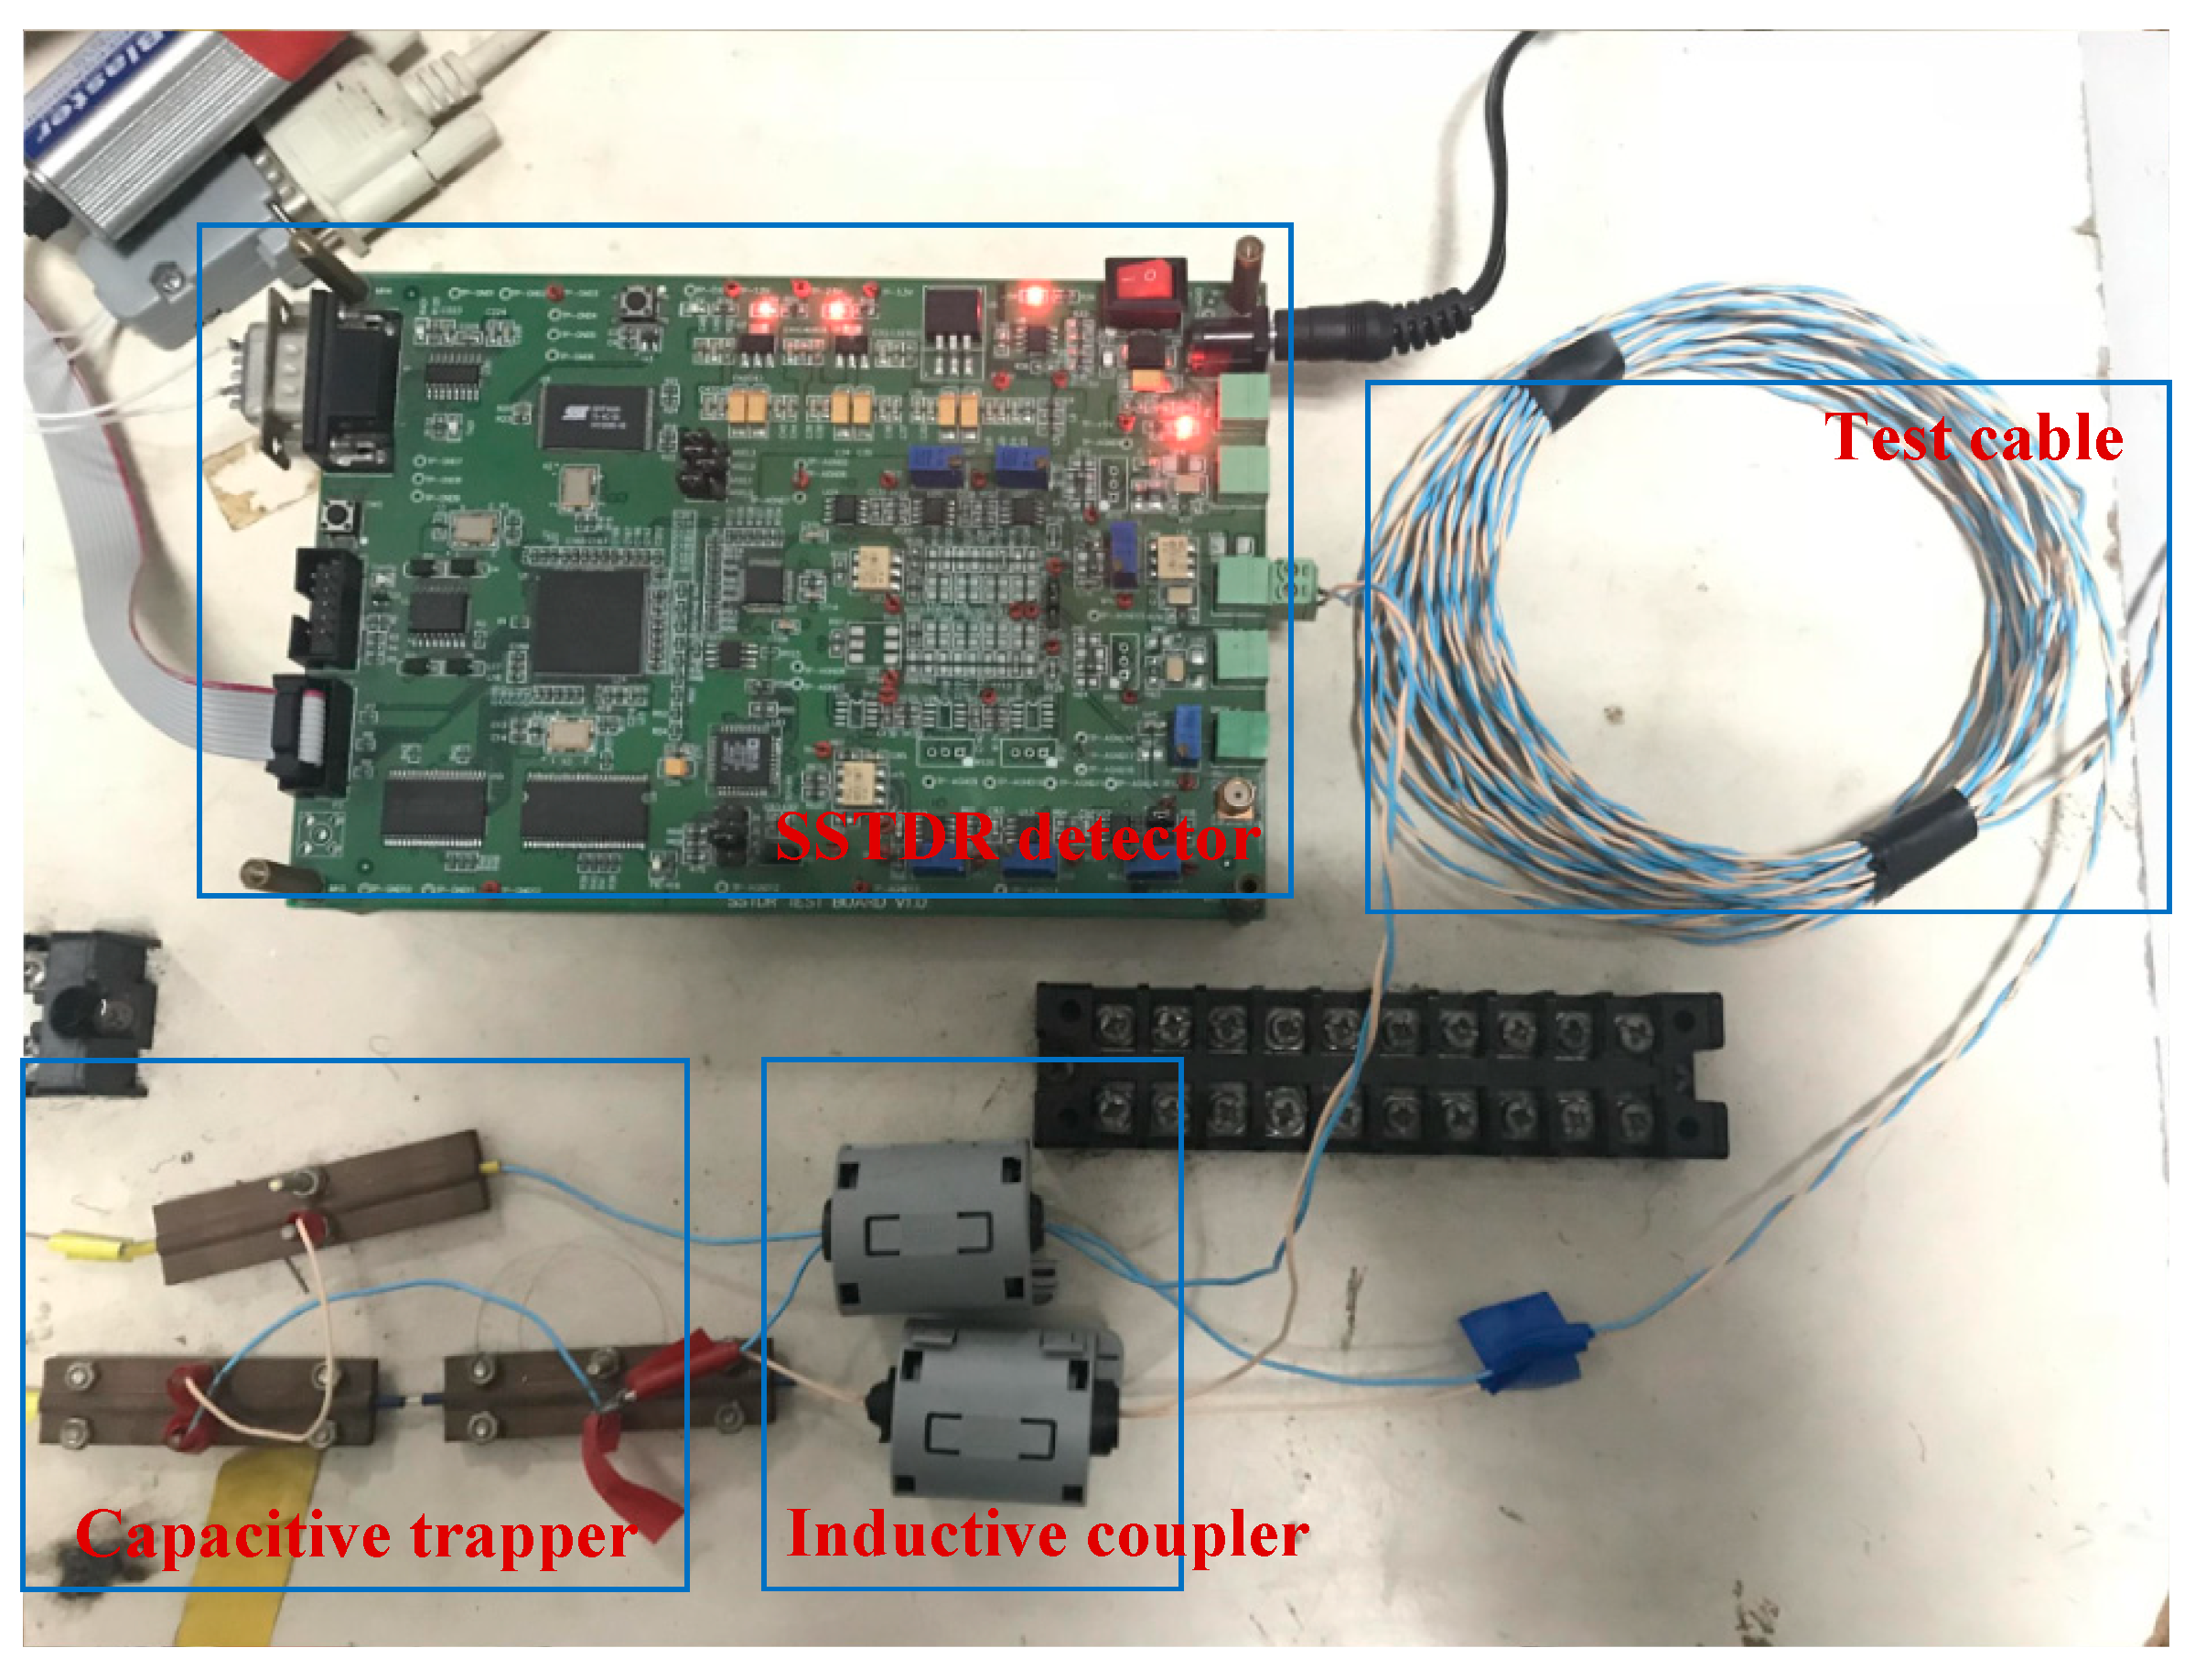
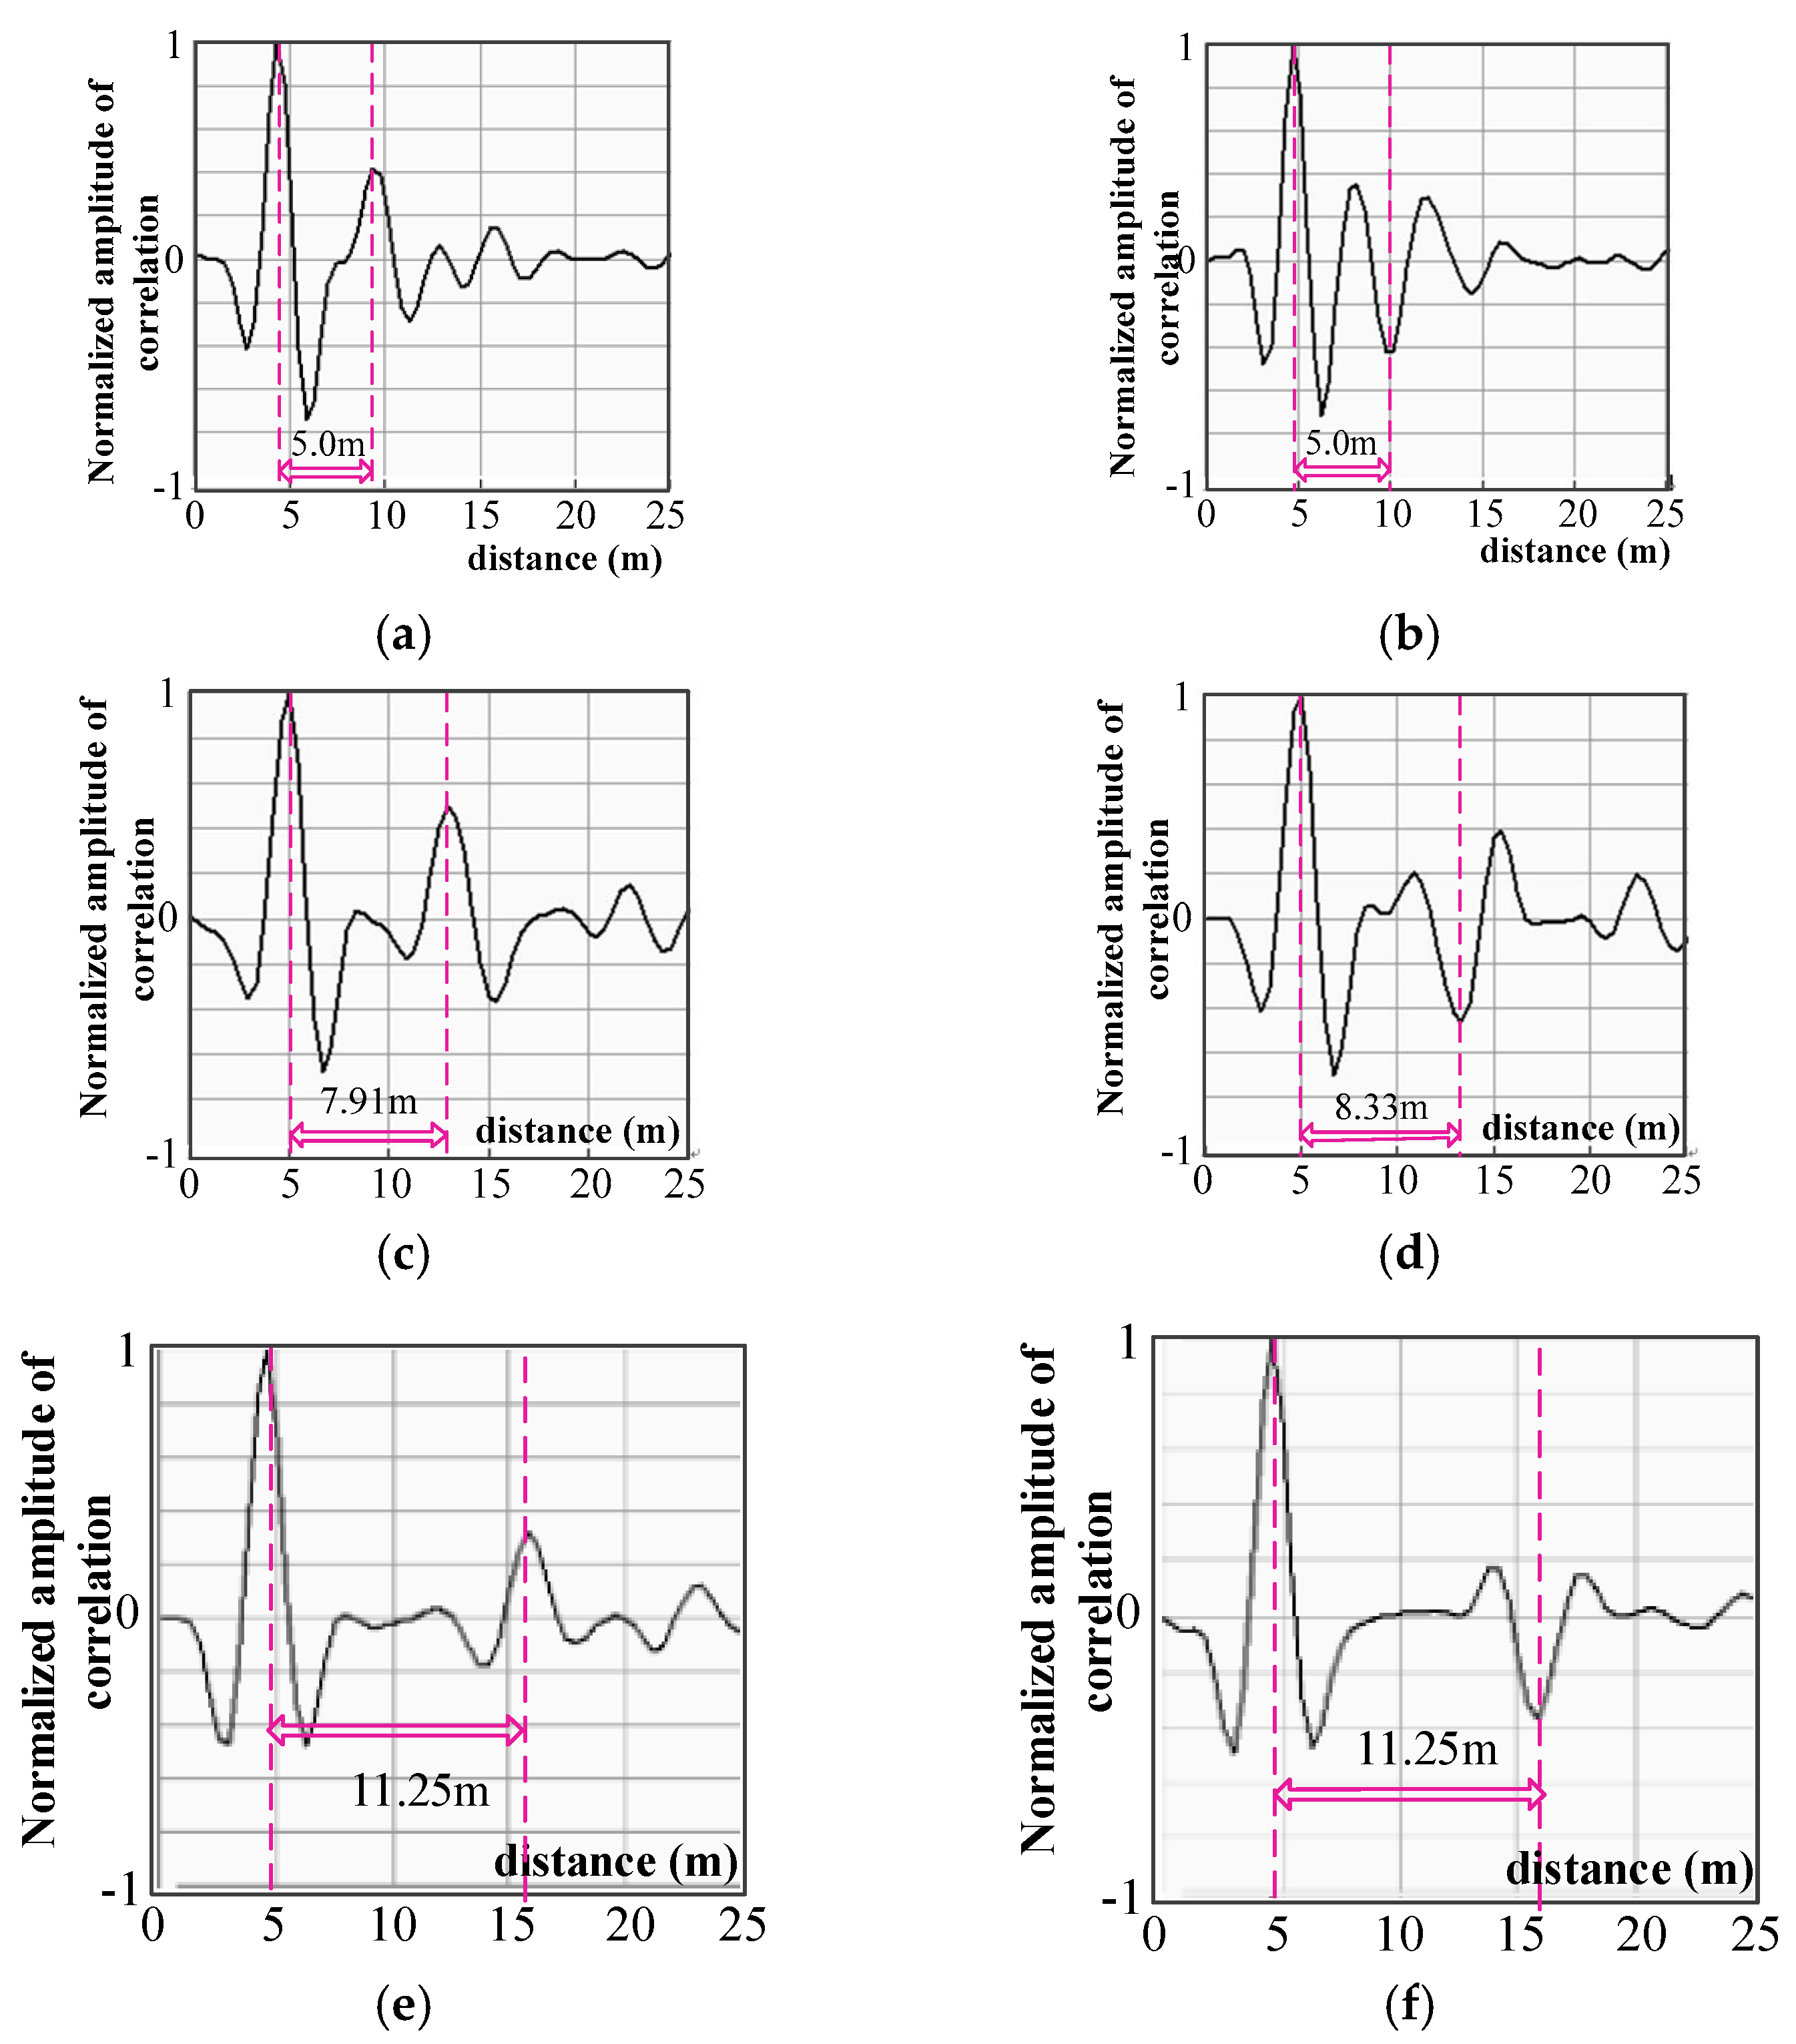
4. Experiment of Inductive Directional Cable Fault Diagnosis
5. Conclusions
- (1)
- The inductive coupling has the advantage over the capacitive coupling in that it results in small signal attenuation;
- (2)
- For the non-intrusive inductive coupling cable fault diagnosis, although the inductive coupler is needed for signal coupling, the capacitive trappers are required to restrict the detection signal from transmitting to the power source and to eliminate the effect of the power source impedance mismatch.
Author Contributions
Funding
Conflicts of Interest
References
- Tan, Y. Aircraft wiring malfunction and its solutions. Aviat. Maint. Eng. 2006, 2, 62–63. [Google Scholar]
- Jiang, J.; Shi, H. Robust Fail-safe Systems with Fault Location Capability. Chin. J. Electron. 2000, 28, 35–42. [Google Scholar]
- Paulter, N.G. Long-term repeatability of a TDR-based printed wiring board dielectric constant measurement system. IEEE Trans. Instrum. Meas. 1998, 47, 1469–1473. [Google Scholar] [CrossRef]
- Schuet, S.; Timucin, D.; Wheeler, K. A model-based probabilistic inversion framework for characterizing wire fault detection using TDR. IEEE Trans. Instrum. Meas. 2011, 60, 1654–1663. [Google Scholar] [CrossRef]
- Kim, S.M.; Sung, J.H.; Park, W.; Ha, J.H.; Lee, Y.J.; Kim, H.B. Development of a Monitoring System for Multichannel Cables Using TDR. IEEE Trans. Instrum. Meas. 2014, 63, 1966–1974. [Google Scholar] [CrossRef]
- Furse, C.; Chung, Y.C.; Dangol, R.; Nielsen, M.; Mabey, G.; Woodward, R. Frequency-domain reflectometry for on-board testing of aging aircraft wiring. IEEE Trans. Electromagn. Compat. 2003, 45, 306–315. [Google Scholar] [CrossRef]
- Smith, P.; Furse, C.; Gunther, J. Analysis of spread spectrum time domain reflectometry for wire fault location. IEEE Sens. J. 2005, 5, 1469–1478. [Google Scholar] [CrossRef]
- Smith, P.S. Spread Spectrum Time Domain Reflectometry. Ph.D. Thesis, Utah State University, Logan, UT, USA, 2003. [Google Scholar]
- Wang, J.; Crapse, P.; Shin, Y.J.; Dougal, R. Diagnostics and Prognostics of Electric Cables in Ship Power Systems via Joint Time-Frequency Domain Reflectometry. In Proceedings of the 2008 Instrumentation and Measurement Technology Conference, Victoria, BC, Canada, 12–15 May 2008; pp. 917–921. [Google Scholar]
- Lo, C.; Furse, C. Noise-domain reflectometry for locating wiring faults. IEEE Trans. Electromagn. Compat. 2005, 47, 97–104. [Google Scholar] [CrossRef]
- Shin, Y.J.; Powers, E.J.; Choe, T.S.; Hong, C.-Y.; Song, E.-S.; Yook, J.-G.; Park, J.B. Application of time-frequency domain reflectometry for detection and localization of a fault on a coaxial cable. IEEE Trans. Instrum. Meas. 2005, 54, 2493–2500. [Google Scholar] [CrossRef]
- Alam, M.K.; Khan, F.; Johnson, J.; Flicker, J. PV ground-fault detection using spread spectrum time domain reflectometry (SSTDR). In Proceedings of the 2013 IEEE Energy Conversion Congress and Exposition, Denver, CO, USA, 15–19 September 2013; pp. 1015–1102. [Google Scholar]
- Hong, B.; Wang, L.; Mao, J.; Yin, J.; Shu, D. An Online Detection and Location Method for Spacecraft Bus Fault. Trans. China Electrotech. Soc. 2016, 5, 118–125. [Google Scholar]
- Wang, J.; Stone, P.E.C.; Coats, D.; Shin, Y.J.; Dougal, R.A. Health Monitoring of Power Cable via Joint Time-Frequency Domain Reflectometry. IEEE Trans. Instrum. Meas. 2011, 60, 1047–1053. [Google Scholar] [CrossRef]
- Zhang, Q.; Zheng, J. Choice of Chaotic Spreading Sequences for Asynchronous DS-CDMA Communication. Chin. J. Electron. 2001, 29, 865–867. [Google Scholar]
- Mamishev, A.V.; Short, S.X.; Kao, T.-W.; Russell, B.D. Nonintrusive sensing techniques for the discrimination of energized electric cables. IEEE Trans. Instrum. Meas. 2002, 45, 457–461. [Google Scholar] [CrossRef]
- Li, J.; Hu, L.; Mi, S. Broadband coupling technology and its equipment of low voltage power line carrier communication. Power Syst. Commun. 2004, 25, 7–10. [Google Scholar]
- Wang, L.; Zha, W.; Hong, B.; Sun, J. Integrated Directional Non-Contact Cable Fault Detection and Location Sensor Device. China Patent CN103,592,577A, 19 February 2014. [Google Scholar]
- Wu, S.; Furse, C.; Lo, C. Noncontact probes for wire fault location with reflectometry. IEEE Sens. J. 2006, 6, 1716–1721. [Google Scholar] [CrossRef]
- Wu, S.; Furse, C.; Lo, C. Non-Contact Reflectometry System and Method. U.S. Patent 7,622,931B2, 24 November 2009. [Google Scholar]
- Taofeng, L.; Jian, X.; Jian, W.; Hui, O.; Hongtao, S. A new testing method for high-frequency power wave trapper measurement based on correlation theory. In Proceedings of the 2009 International Conference on Industrial Mechatronics and Automation, Chengdu, China, 15–16 May 2009; pp. 340–342. [Google Scholar]


| Fault Setting | Result of Simulation | ||||||
|---|---|---|---|---|---|---|---|
| Distance (m) | Type | Capacitive Coupling | Inductive Coupling | ||||
| Type | Distance (m) | Error (m) | Type | Distance (m) | Error (m) | ||
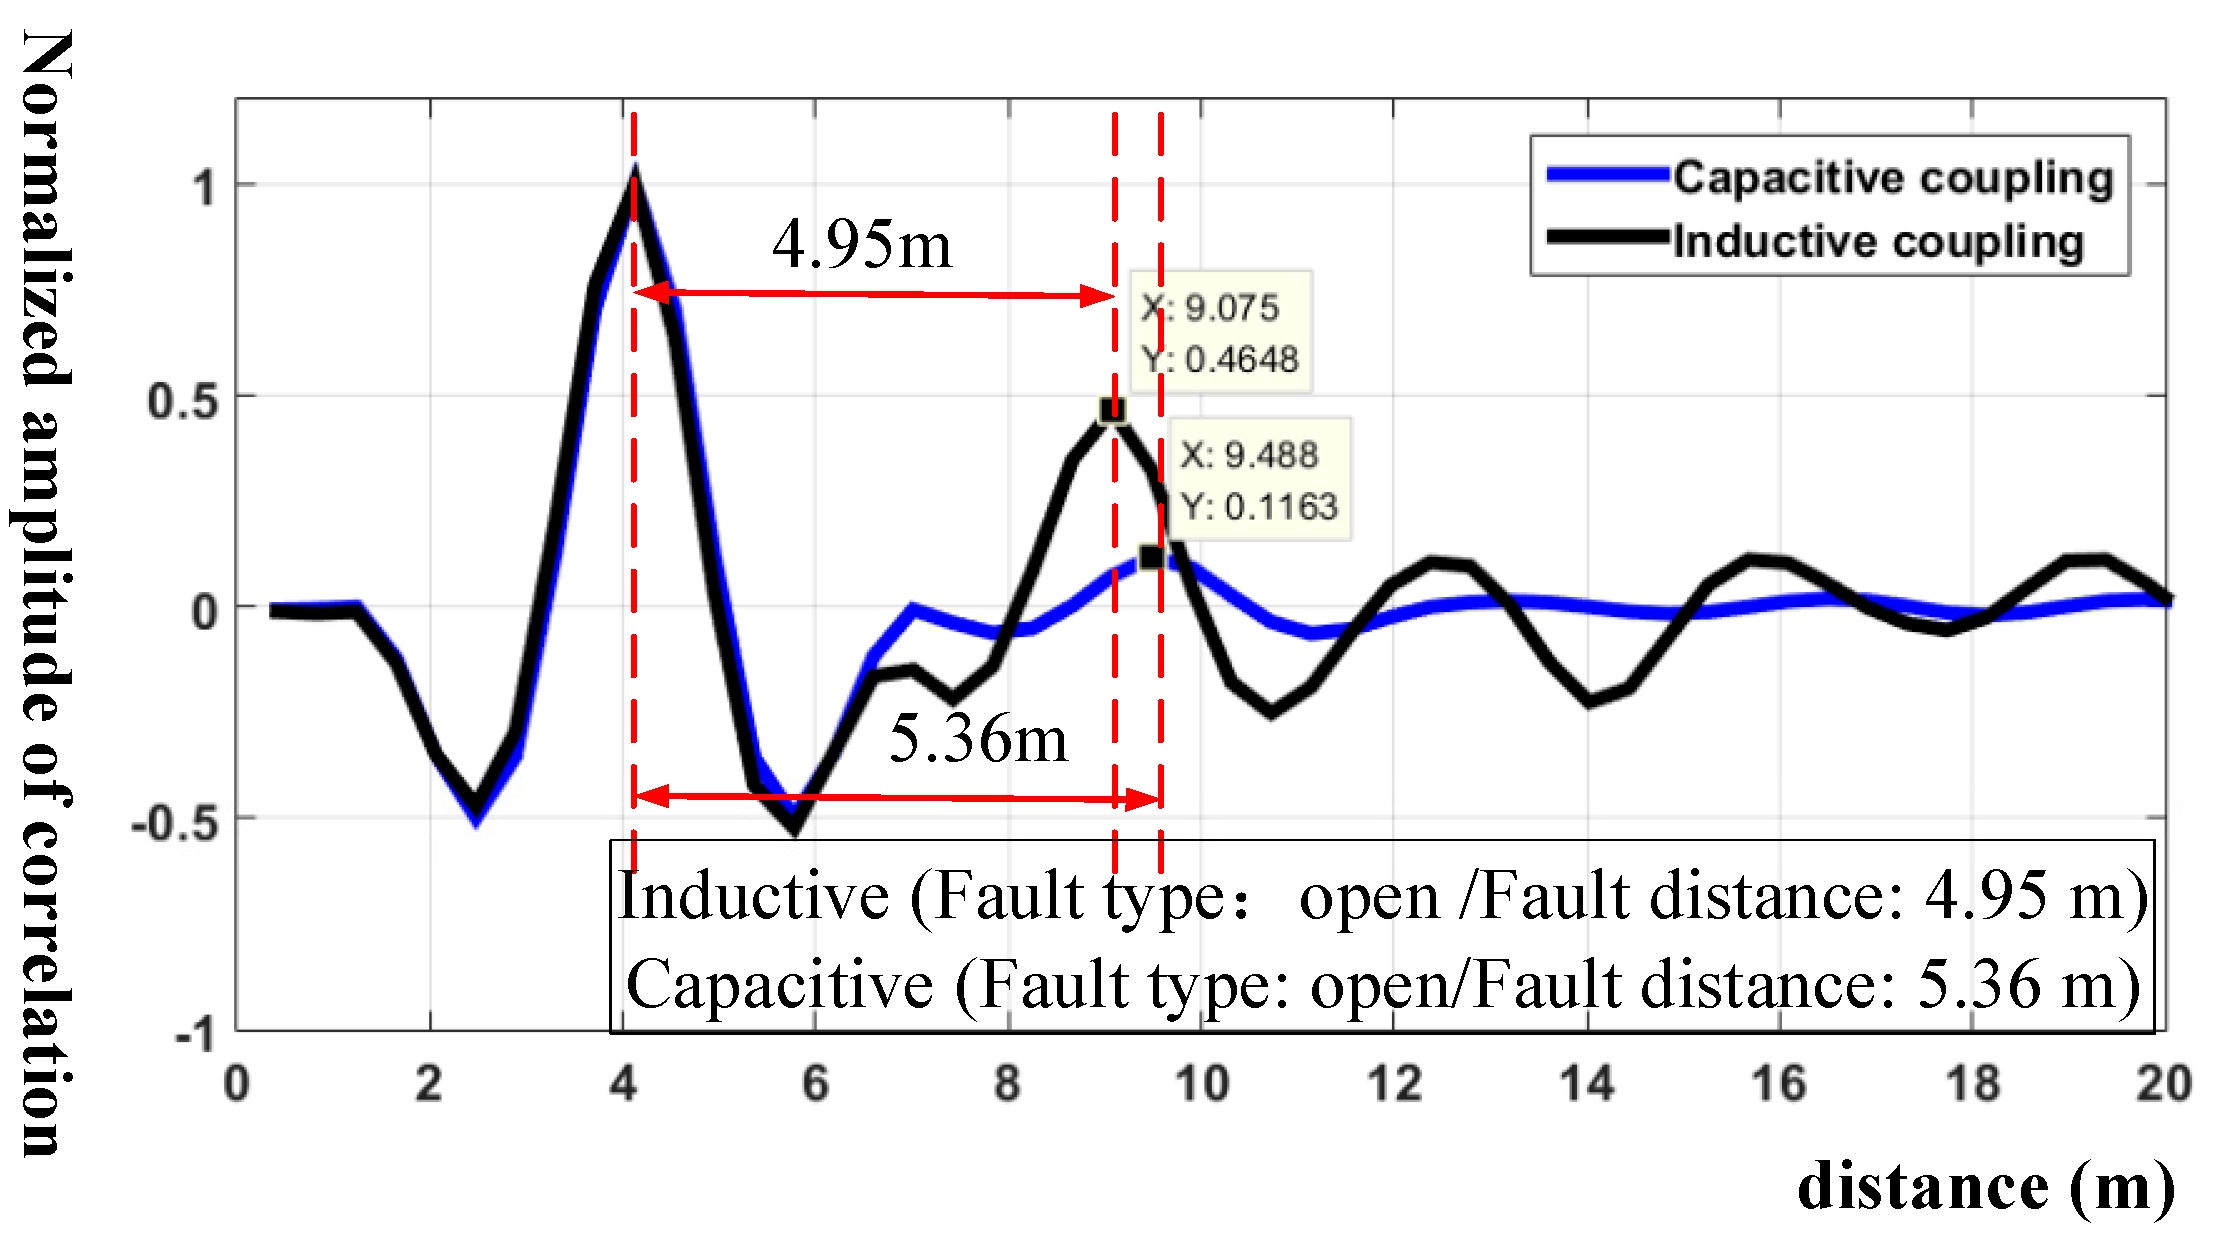
| 4.75 | Open | Open | 4.95 | 0.2 | Open | 5.36 | 0.61 |
| 5.70 | Short | Short | 5.75 | 0.05 | Short | 5.87 | 0.17 |
| 6.77 | Open | Open | 6.54 | −0.23 | Open | 7.15 | 0.35 |
| 8.10 | Short | Short | 8.35 | 0.25 | Short | 8.60 | 0.50 |
| 10.14 | Open | Open | 9.81 | −0.33 | Open | 9.69 | −0.45 |
| 15.10 | Short | Short | 14.7 | −0.40 | Short | 14.57 | −0.53 |
| 20.18 | Open | Open | 20.03 | 0.15 | Open | 20.65 | 0.47 |
| Fault Setting | Result of Experiment | |||||
|---|---|---|---|---|---|---|
| Distance (m) | Type | Times | Type | Distance (m) | Error (m) | Detection rate |
| 4.75 | Open | 100 | Open | 4.58/5.00 | −0.17/0.25 | 90% |
| Short | 100 | Short | 4.58/5.00 | −0.17/0.25 | 90% | |
| 5.70 | Open | 100 | Open | 5.41/5.83 | −0.29/0.13 | 93% |
| Short | 100 | Short | 5.41/5.83 | −0.29/0.13 | 90% | |
| 6.77 | Open | 100 | Open | 6.66/6.90 | −0.11/0.13 | 93% |
| Short | 100 | Short | 6.66/6.90 | −0.11/0.13 | 91% | |
| 8.10 | Open | 100 | Open | 7.91/8.33 | −0.19/0.23 | 92% |
| Short | 100 | Short | 7.91/8.33 | −0.19/0.23 | 91% | |
| 10.14 | Open | 100 | Open | 9.91/10.33 | −0.23/0.19 | 92% |
| Short | 100 | Short | 9.91/10.33 | −0.23/0.19 | 90% | |
| 15.10 | Open | 100 | Open | 14.9/15.32 | −0.2/0.22 | 91% |
| Short | 100 | Short | 14.9/15.32 | −0.2/0.22 | 90% | |
| 20.18 | Open | 100 | Open | 20.00/20.42 | −0.18/0.24 | 91% |
| Short | 100 | Short | 20.00/20.42 | −0.18/0.24 | 92% | |
© 2018 by the authors. Licensee MDPI, Basel, Switzerland. This article is an open access article distributed under the terms and conditions of the Creative Commons Attribution (CC BY) license (http://creativecommons.org/licenses/by/4.0/).
Share and Cite
Hu, S.; Wang, L.; Gao, C.; Zhang, B.; Liu, Z.; Yang, S. Non-Intrusive Cable Fault Diagnosis Based on Inductive Directional Coupling. Sensors 2018, 18, 3724. https://doi.org/10.3390/s18113724
Hu S, Wang L, Gao C, Zhang B, Liu Z, Yang S. Non-Intrusive Cable Fault Diagnosis Based on Inductive Directional Coupling. Sensors. 2018; 18(11):3724. https://doi.org/10.3390/s18113724
Chicago/Turabian StyleHu, Suyang, Li Wang, Chuang Gao, Bin Zhang, Zhichan Liu, and Shanshui Yang. 2018. "Non-Intrusive Cable Fault Diagnosis Based on Inductive Directional Coupling" Sensors 18, no. 11: 3724. https://doi.org/10.3390/s18113724
APA StyleHu, S., Wang, L., Gao, C., Zhang, B., Liu, Z., & Yang, S. (2018). Non-Intrusive Cable Fault Diagnosis Based on Inductive Directional Coupling. Sensors, 18(11), 3724. https://doi.org/10.3390/s18113724