Adaptive Object Tracking via Multi-Angle Analysis Collaboration


Abstract
1. Introduction
- We confirm that tracking research should focus on the nature of the tracking problem, not just the classification method or network structure.
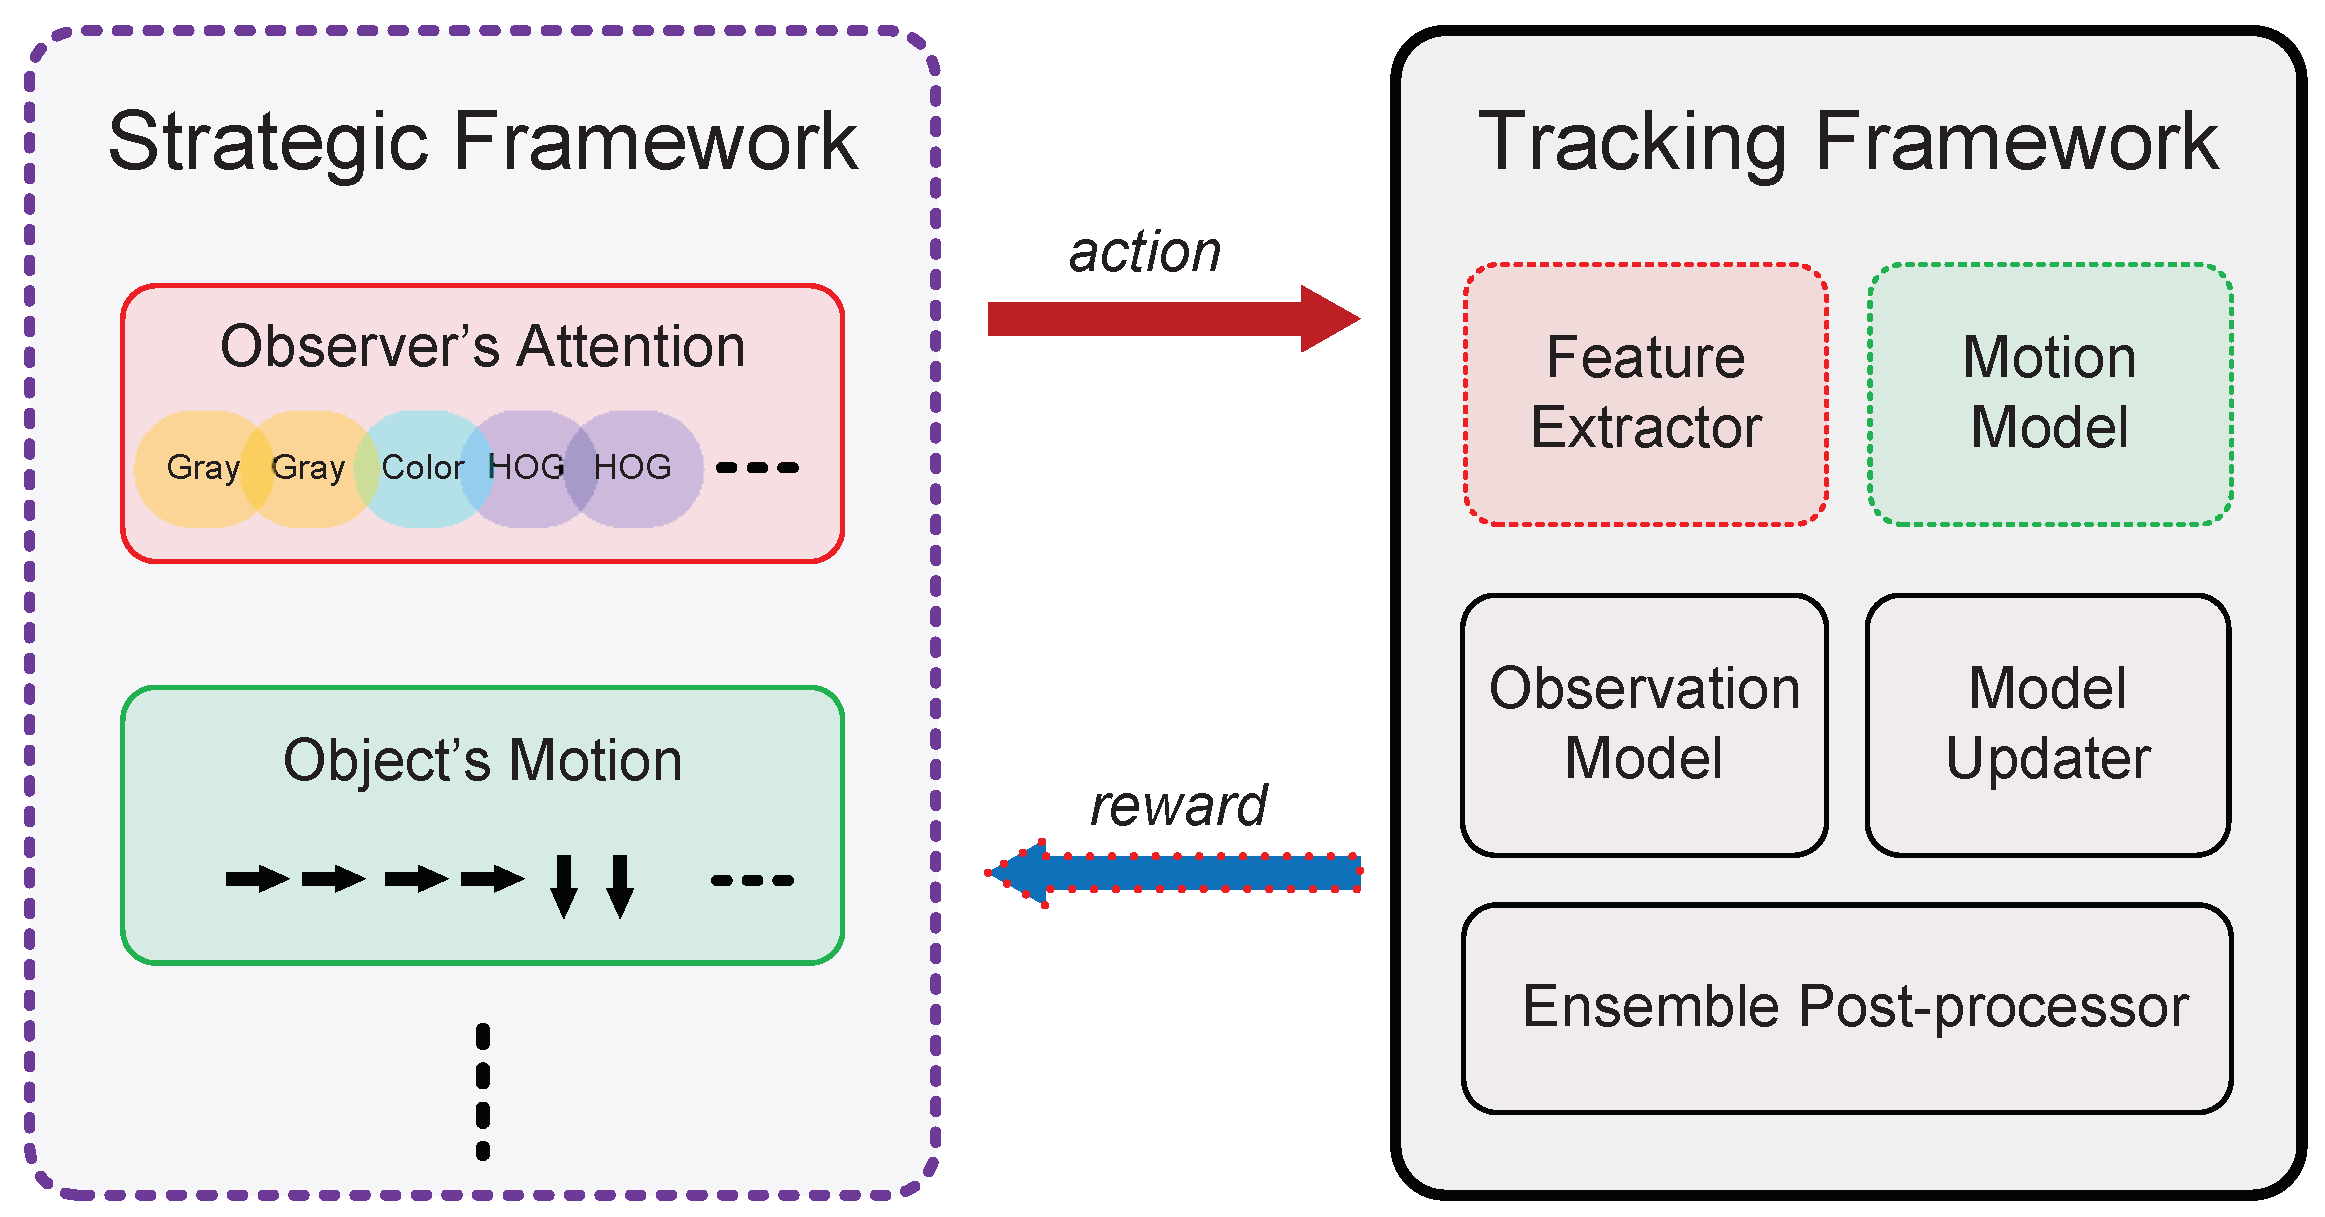
- We propose a strategic framework that forms a one-to-one correspondence between the details of different perspectives and the action space of multi-dimensional state–action space reinforcement learning. This strategic framework can be extended according to different tracking tasks.
- We obtain strategies from multi-angle analysis with reinforcement learning and apply them to specific traditional tracking frameworks.
2. Related Work
2.1. Visual Object Tracking
2.2. Visual Tracking with Reinforcement Learning
3. Our Method
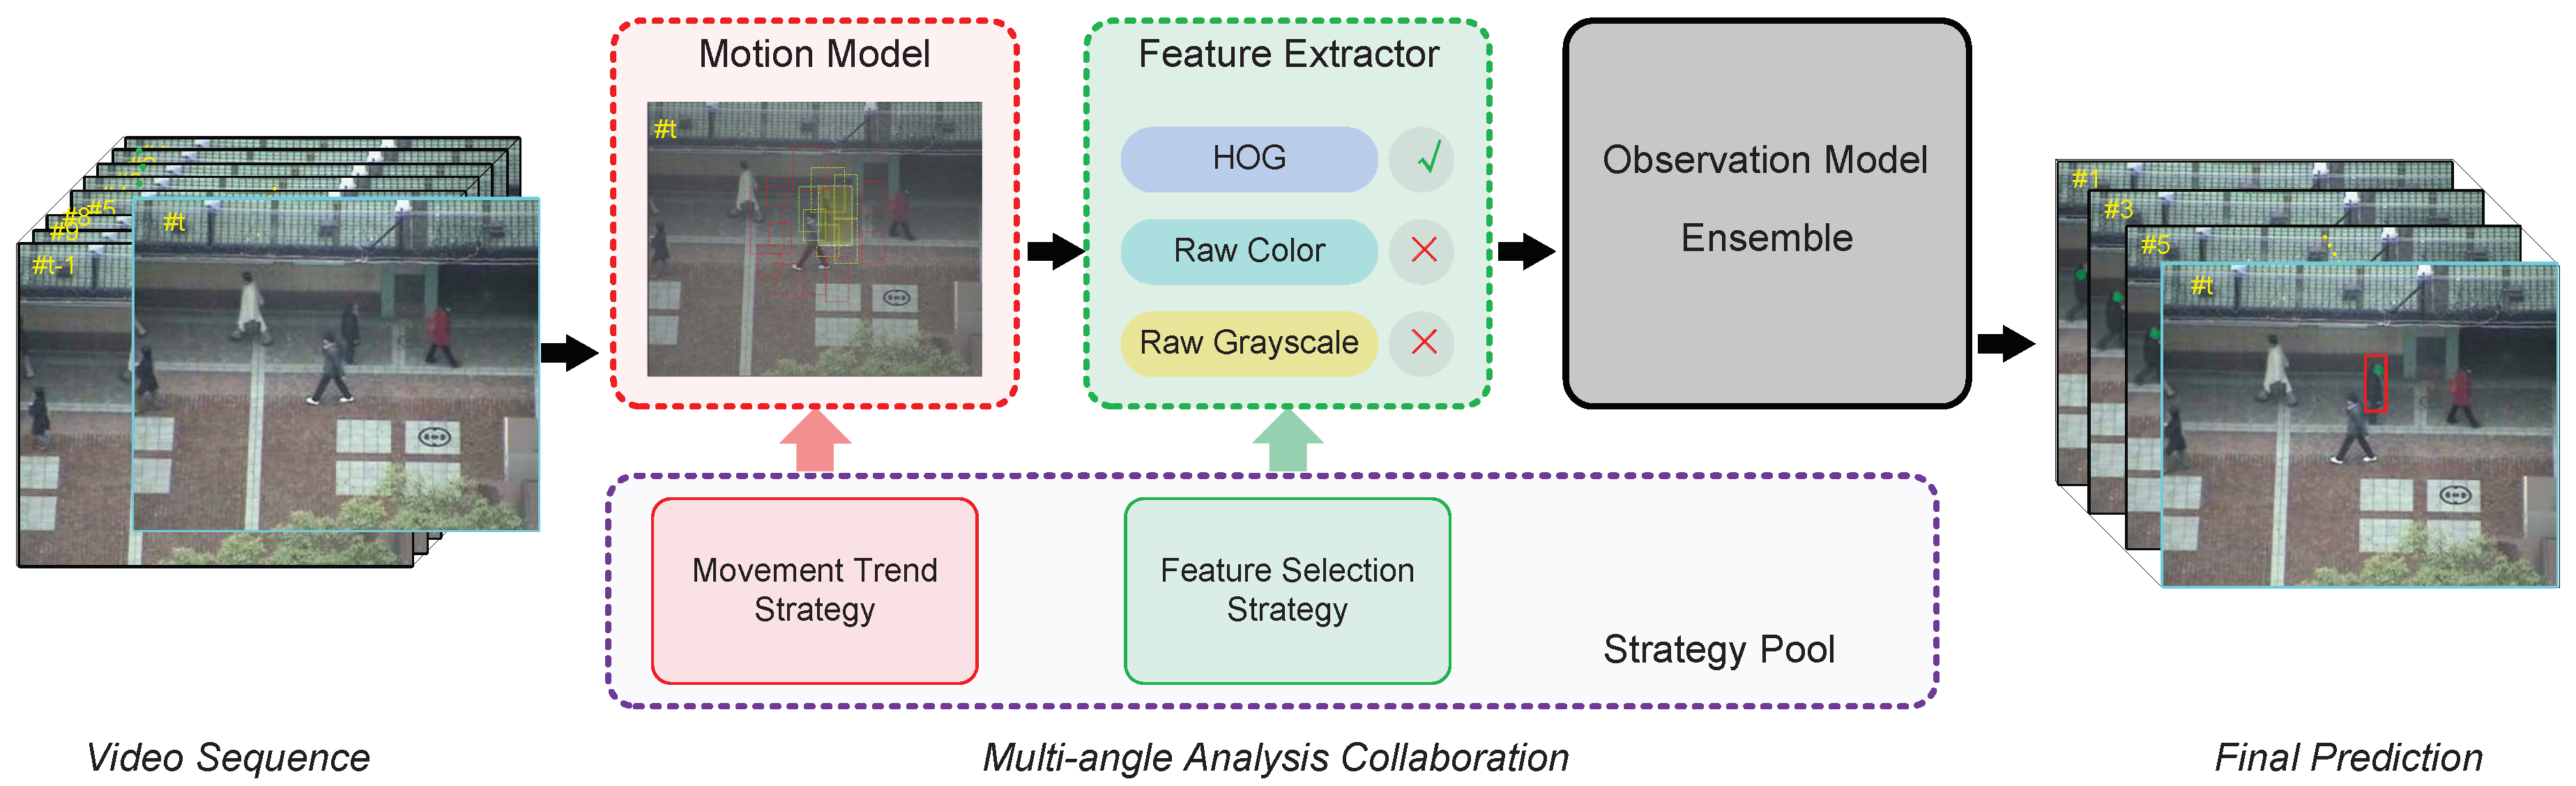
3.1. Tracking Framework with Basic Tracker
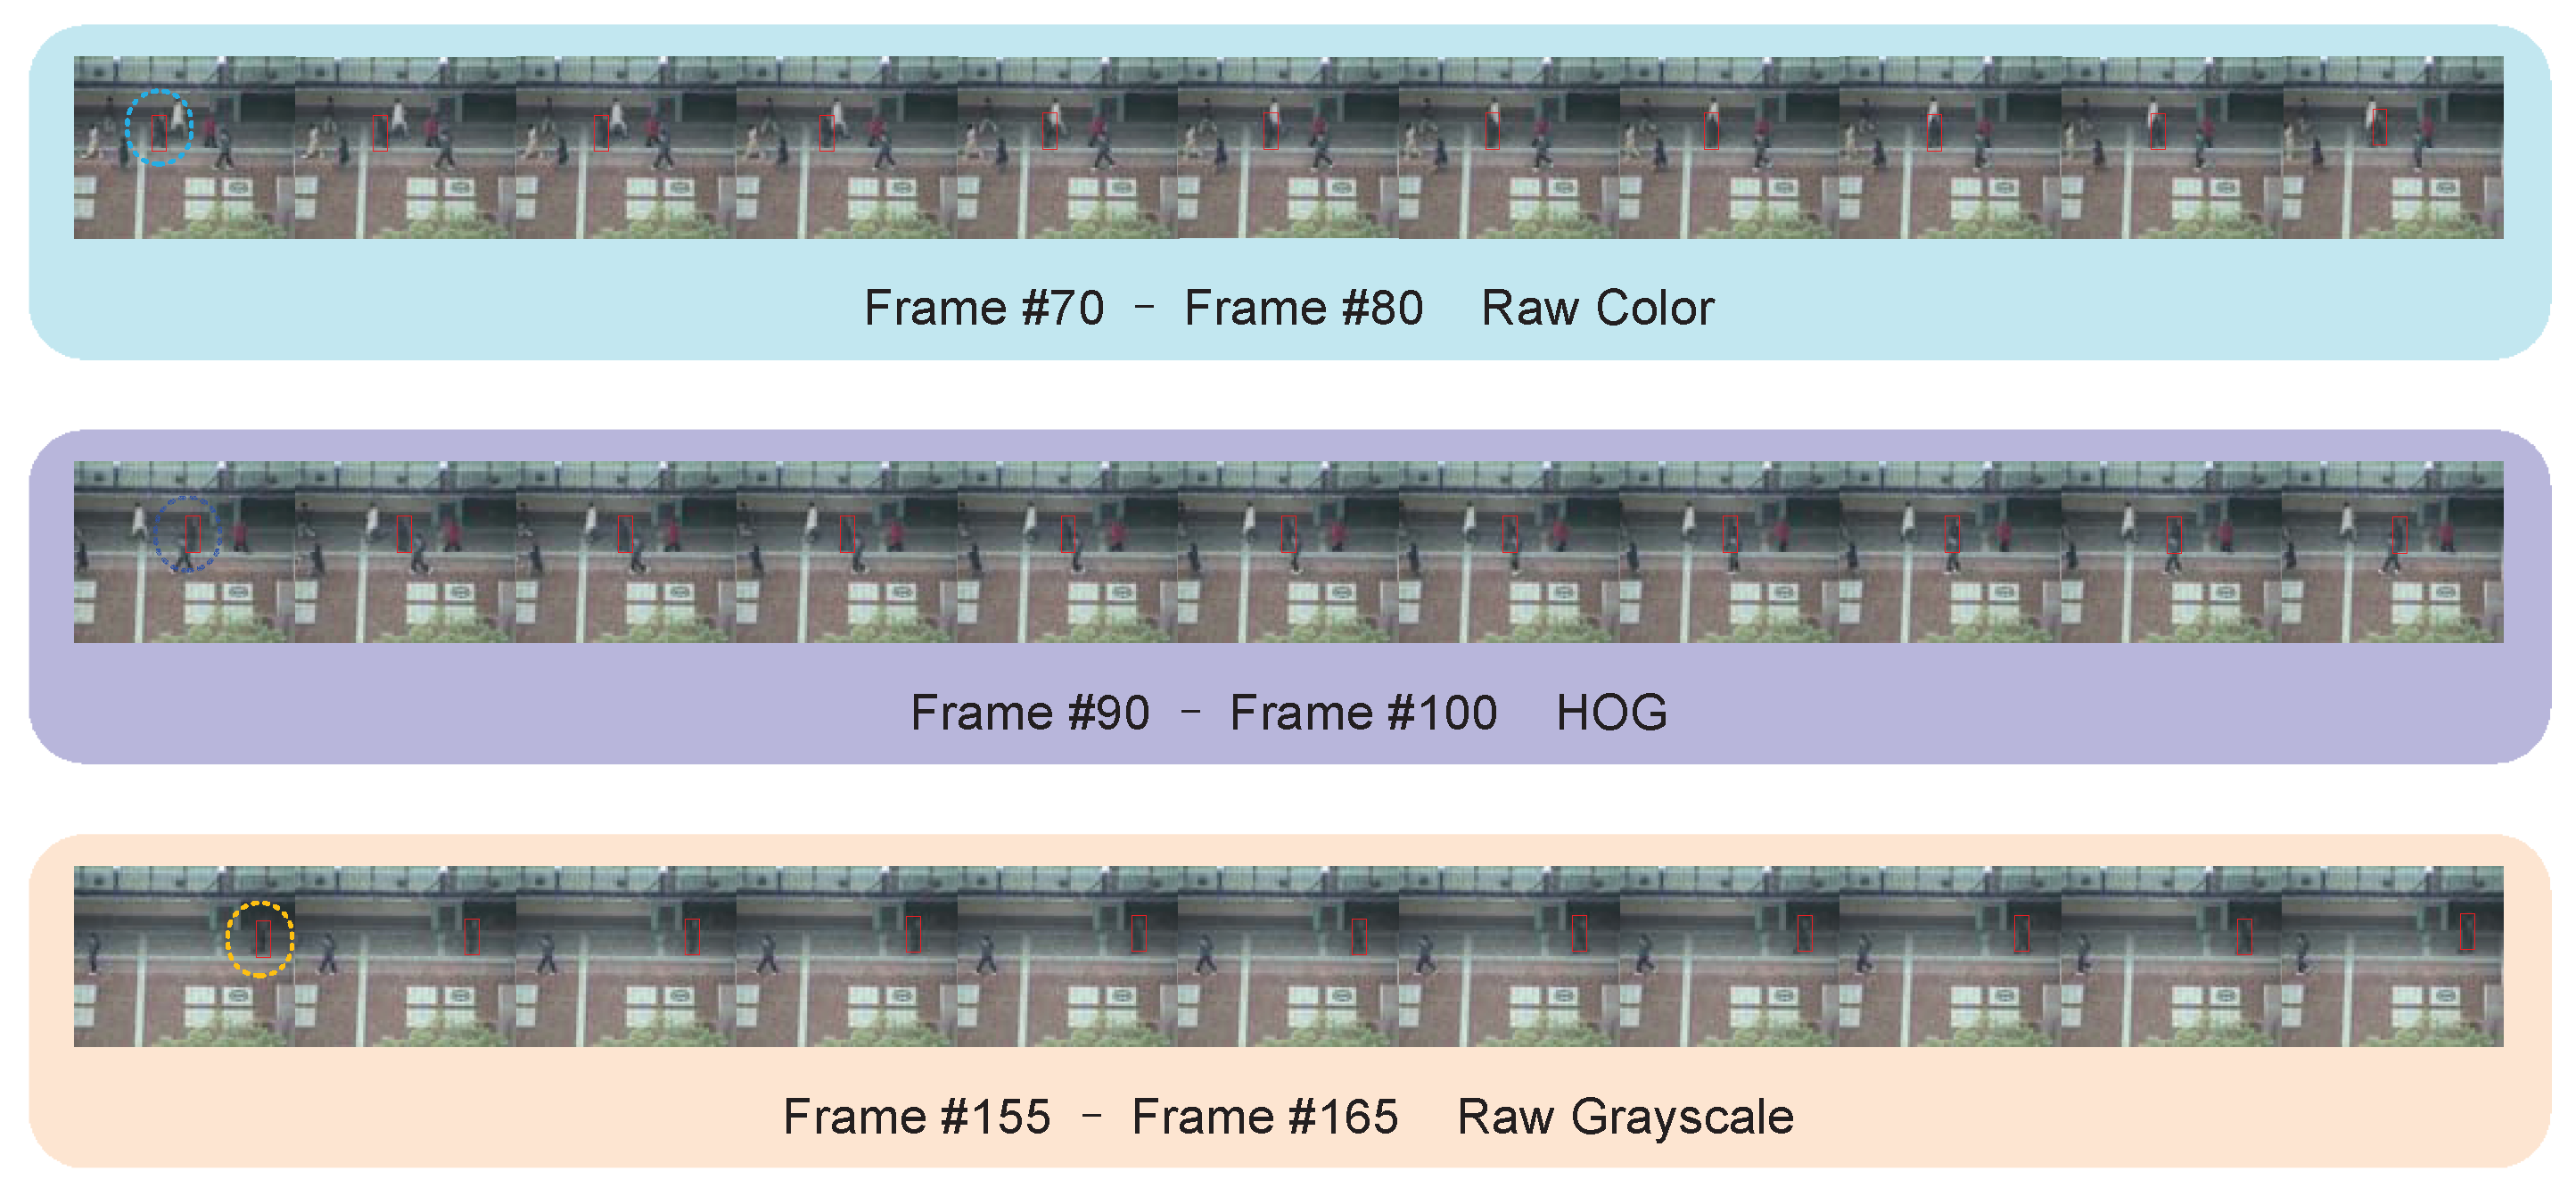
- For the feature extractor component in MACT, multiple feature (HOG, Raw Color and Raw Grayscale) selections replace fixed single feature.
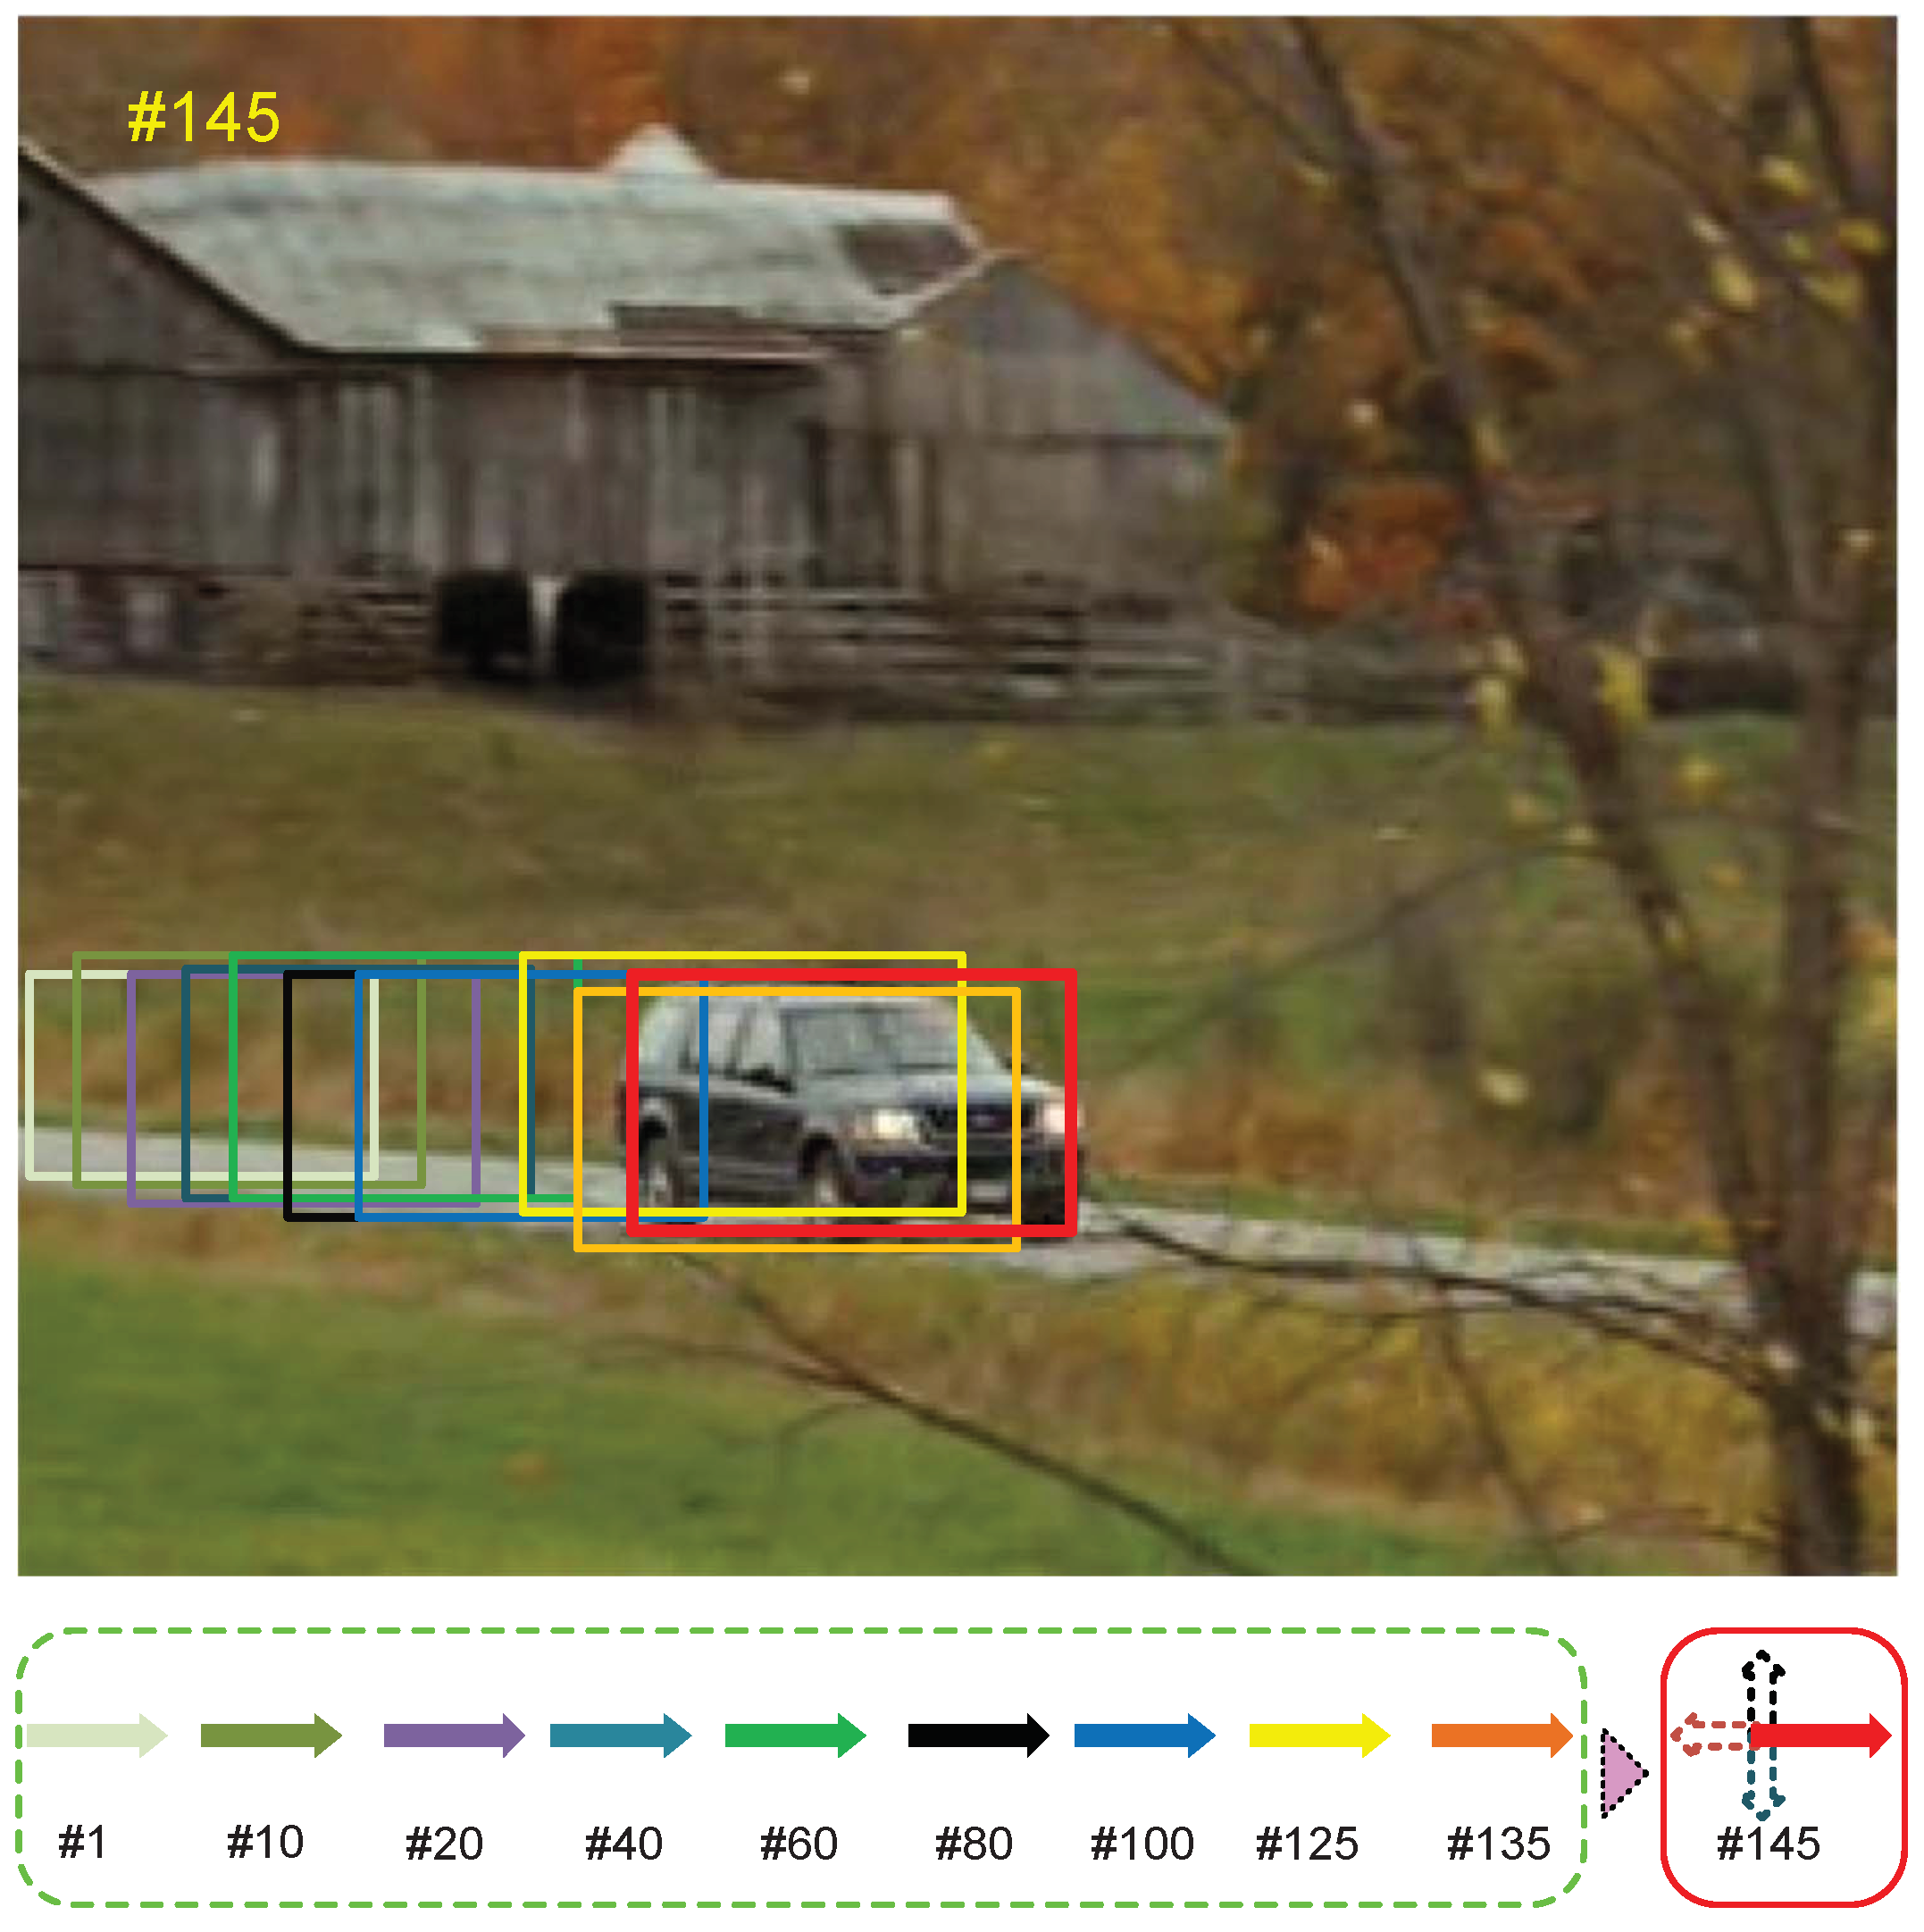
- For the motion model component in MACT, the selection of possible candidates evolves from random screening to purposeful selection.
- First, for the observation model component, we use the simplest logistic regression with regularization, and only employ the simple gradient descent to achieve online update of the model.
- Second, for model updater component, we adopt the common practice of setting a threshold [30]. The model is updated when the difference between the confidence of the target and the confidence of the background is below the threshold.
- Finally, for the ensemble post-processor component, we consider the reliability of each tracker as a hidden variable with reference to the study by Wang et al. [31], and then solve the problem of determining the tracking result by a factorial hidden Markov model.
3.2. Strategic Framework with Reinforcement Learning
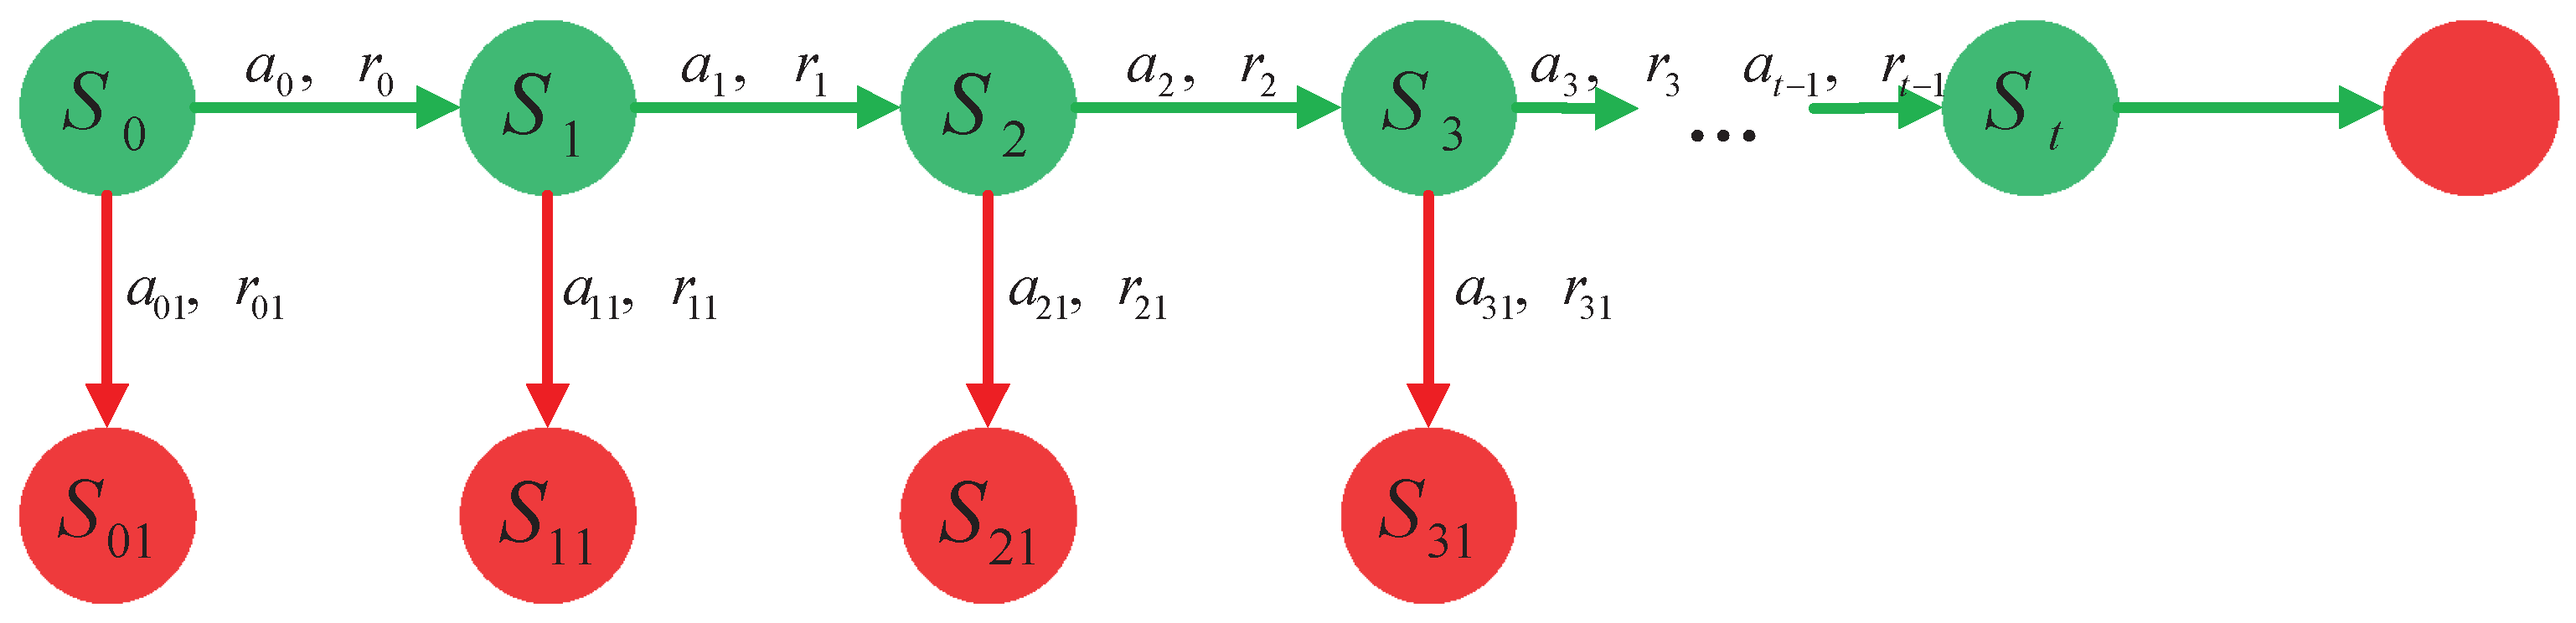
3.2.1. States and Action Space Design
3.2.2. Q-learning and Exploration Strategy
| Algorithm 1Q-Learning: An Off-policy TD Control Algorithm |
|
3.2.3. Reward Function Design
3.2.4. Mutual Cooperative
3.2.5. Discussion
4. Experimental Results
4.1. Dataset and Evaluation
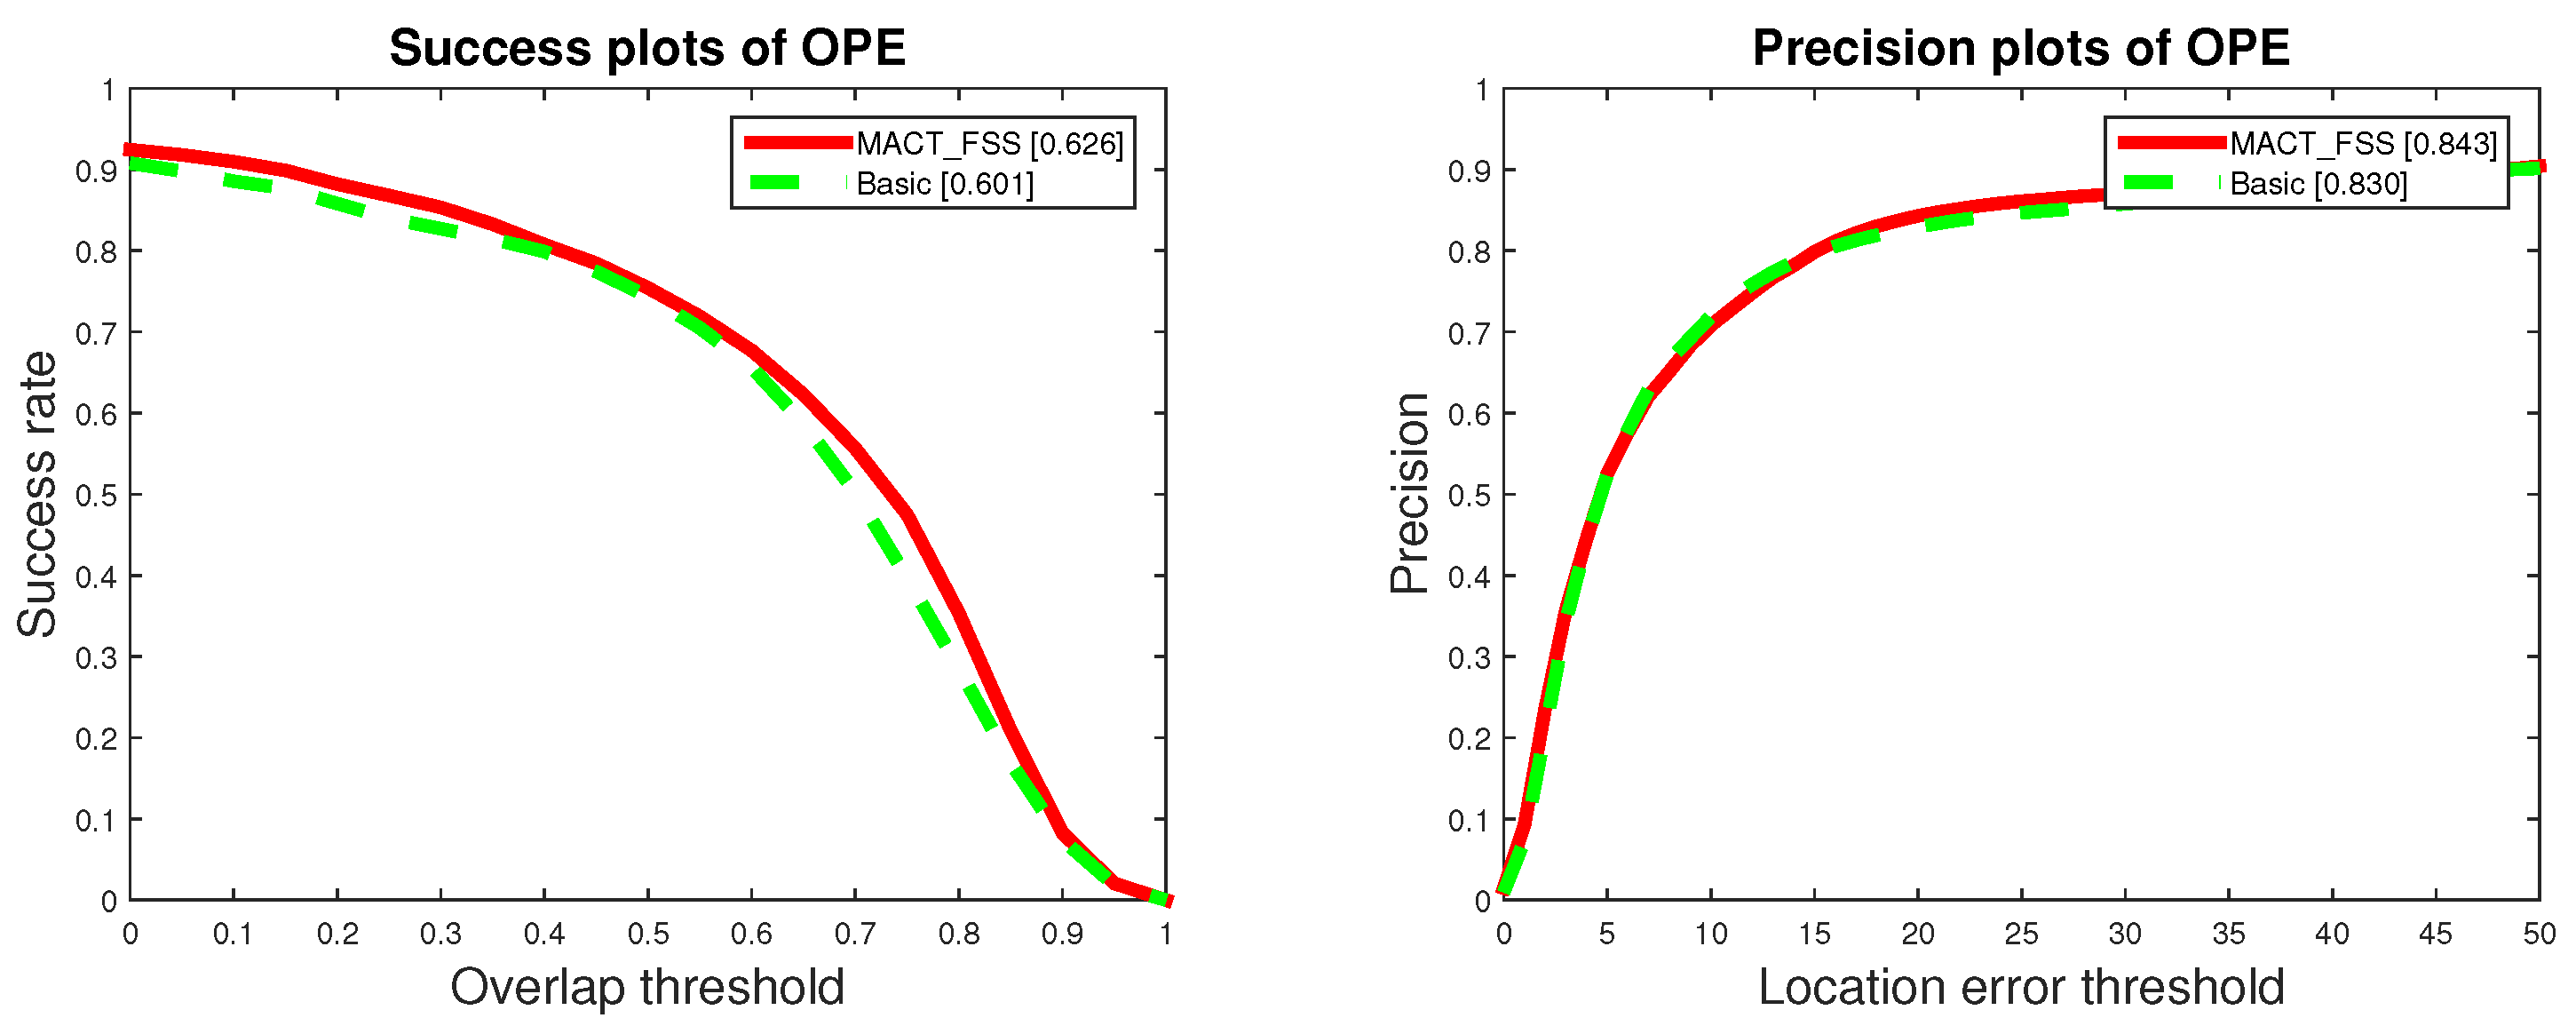
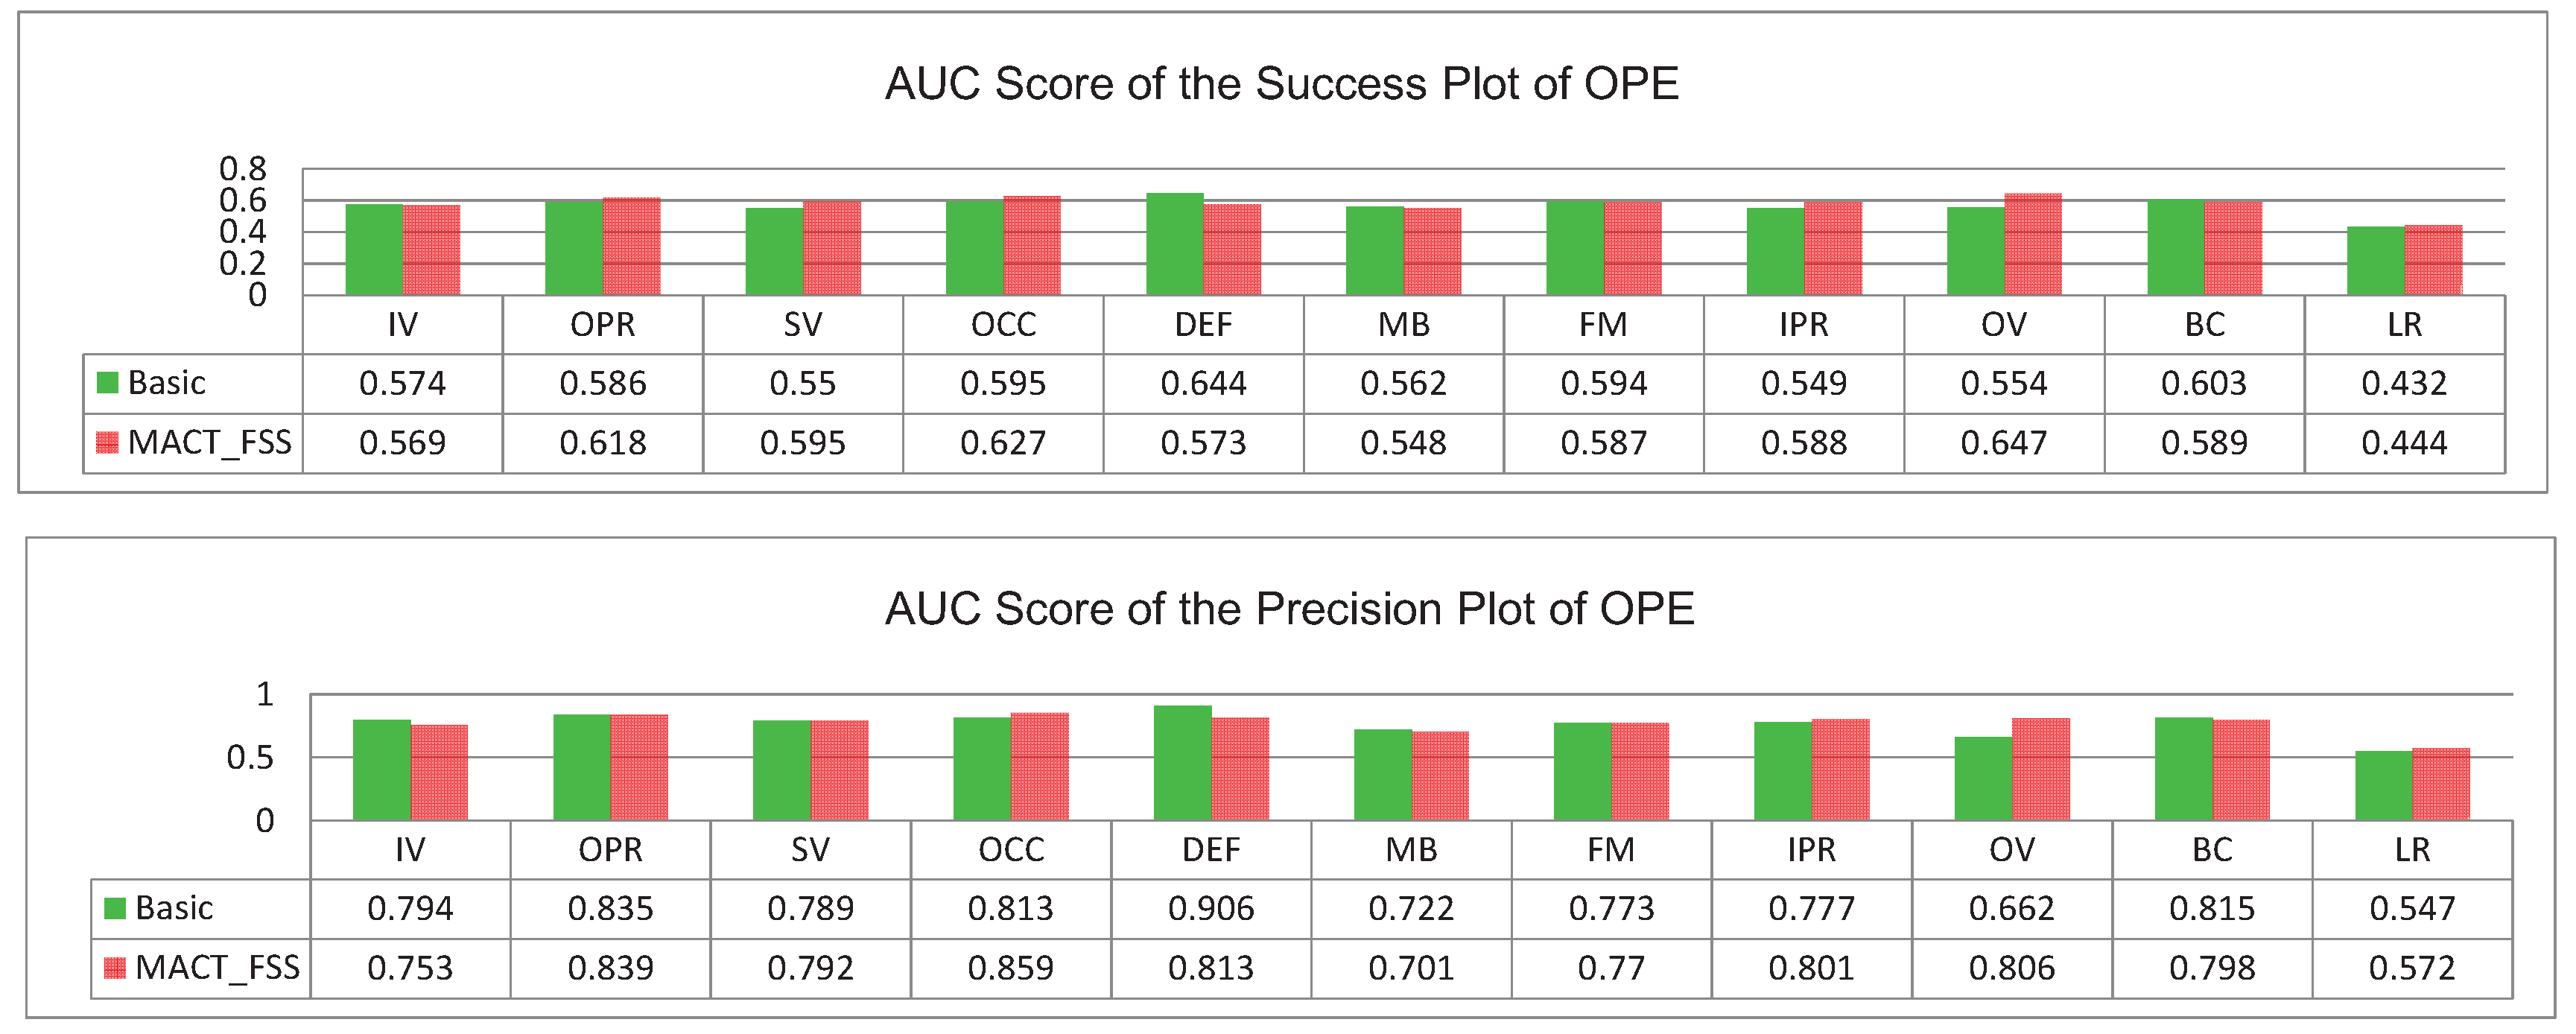
4.2. Strategic Framework Test
4.3. MACT Tracker Test
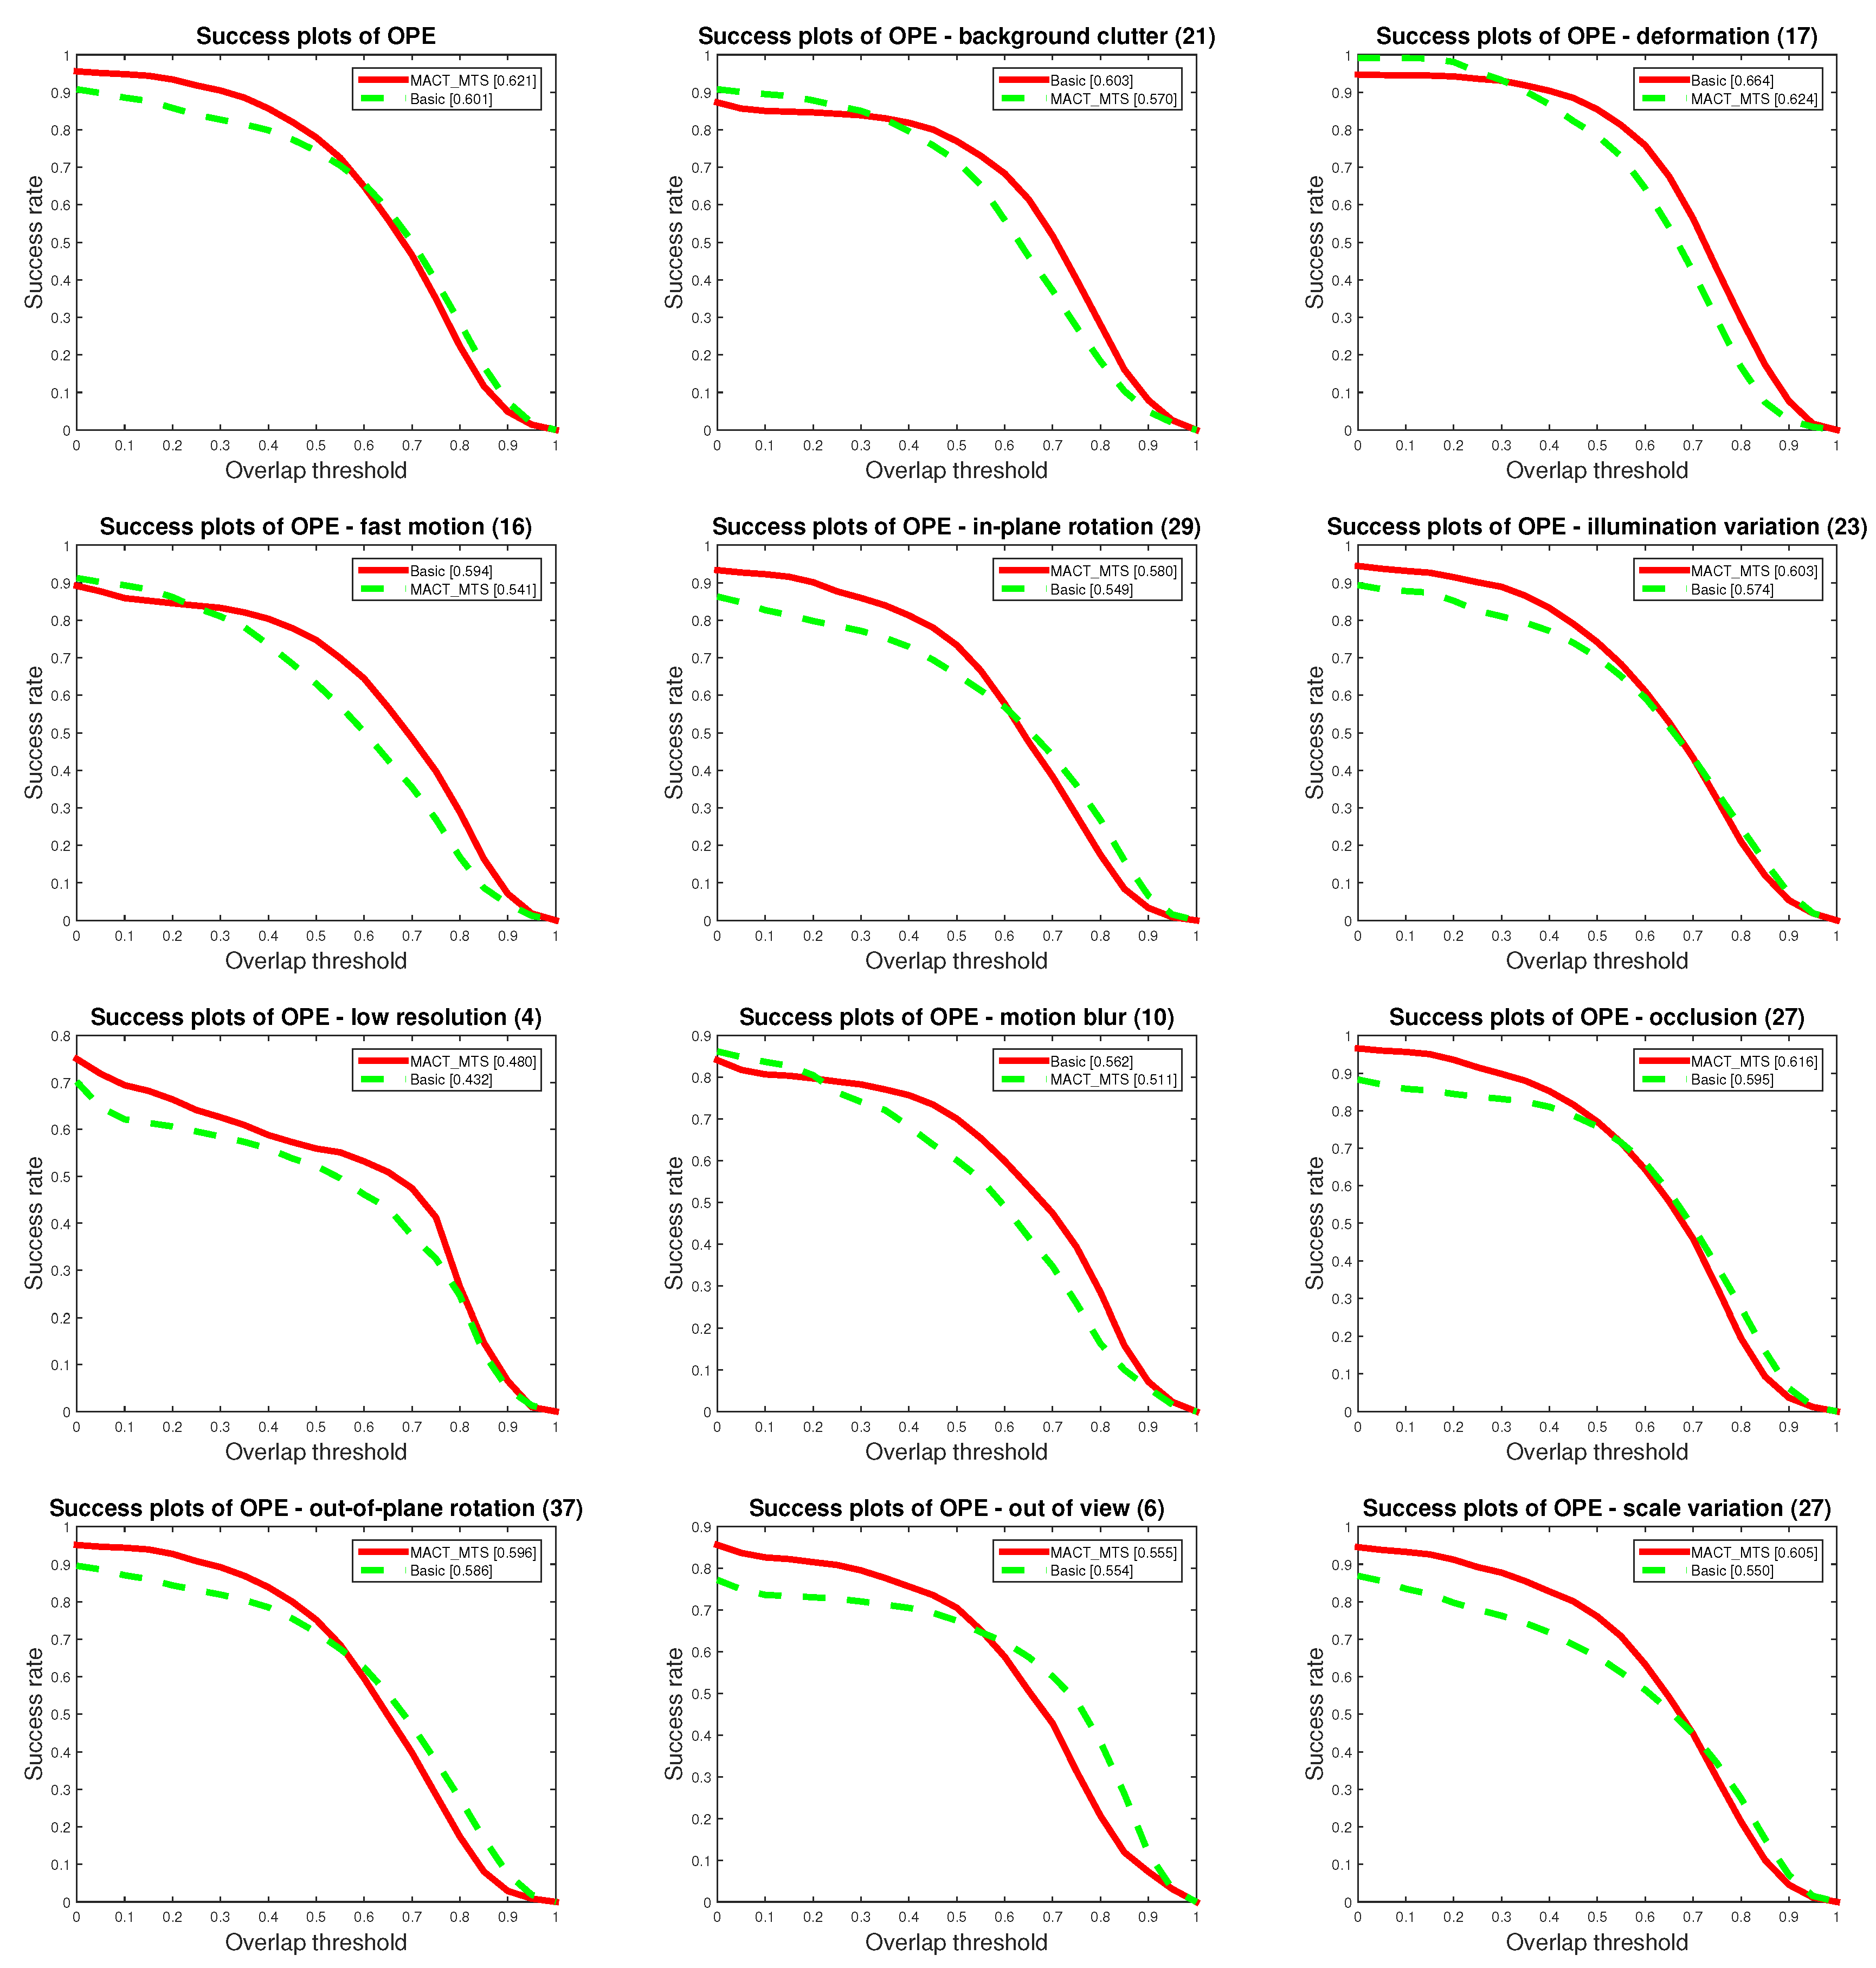
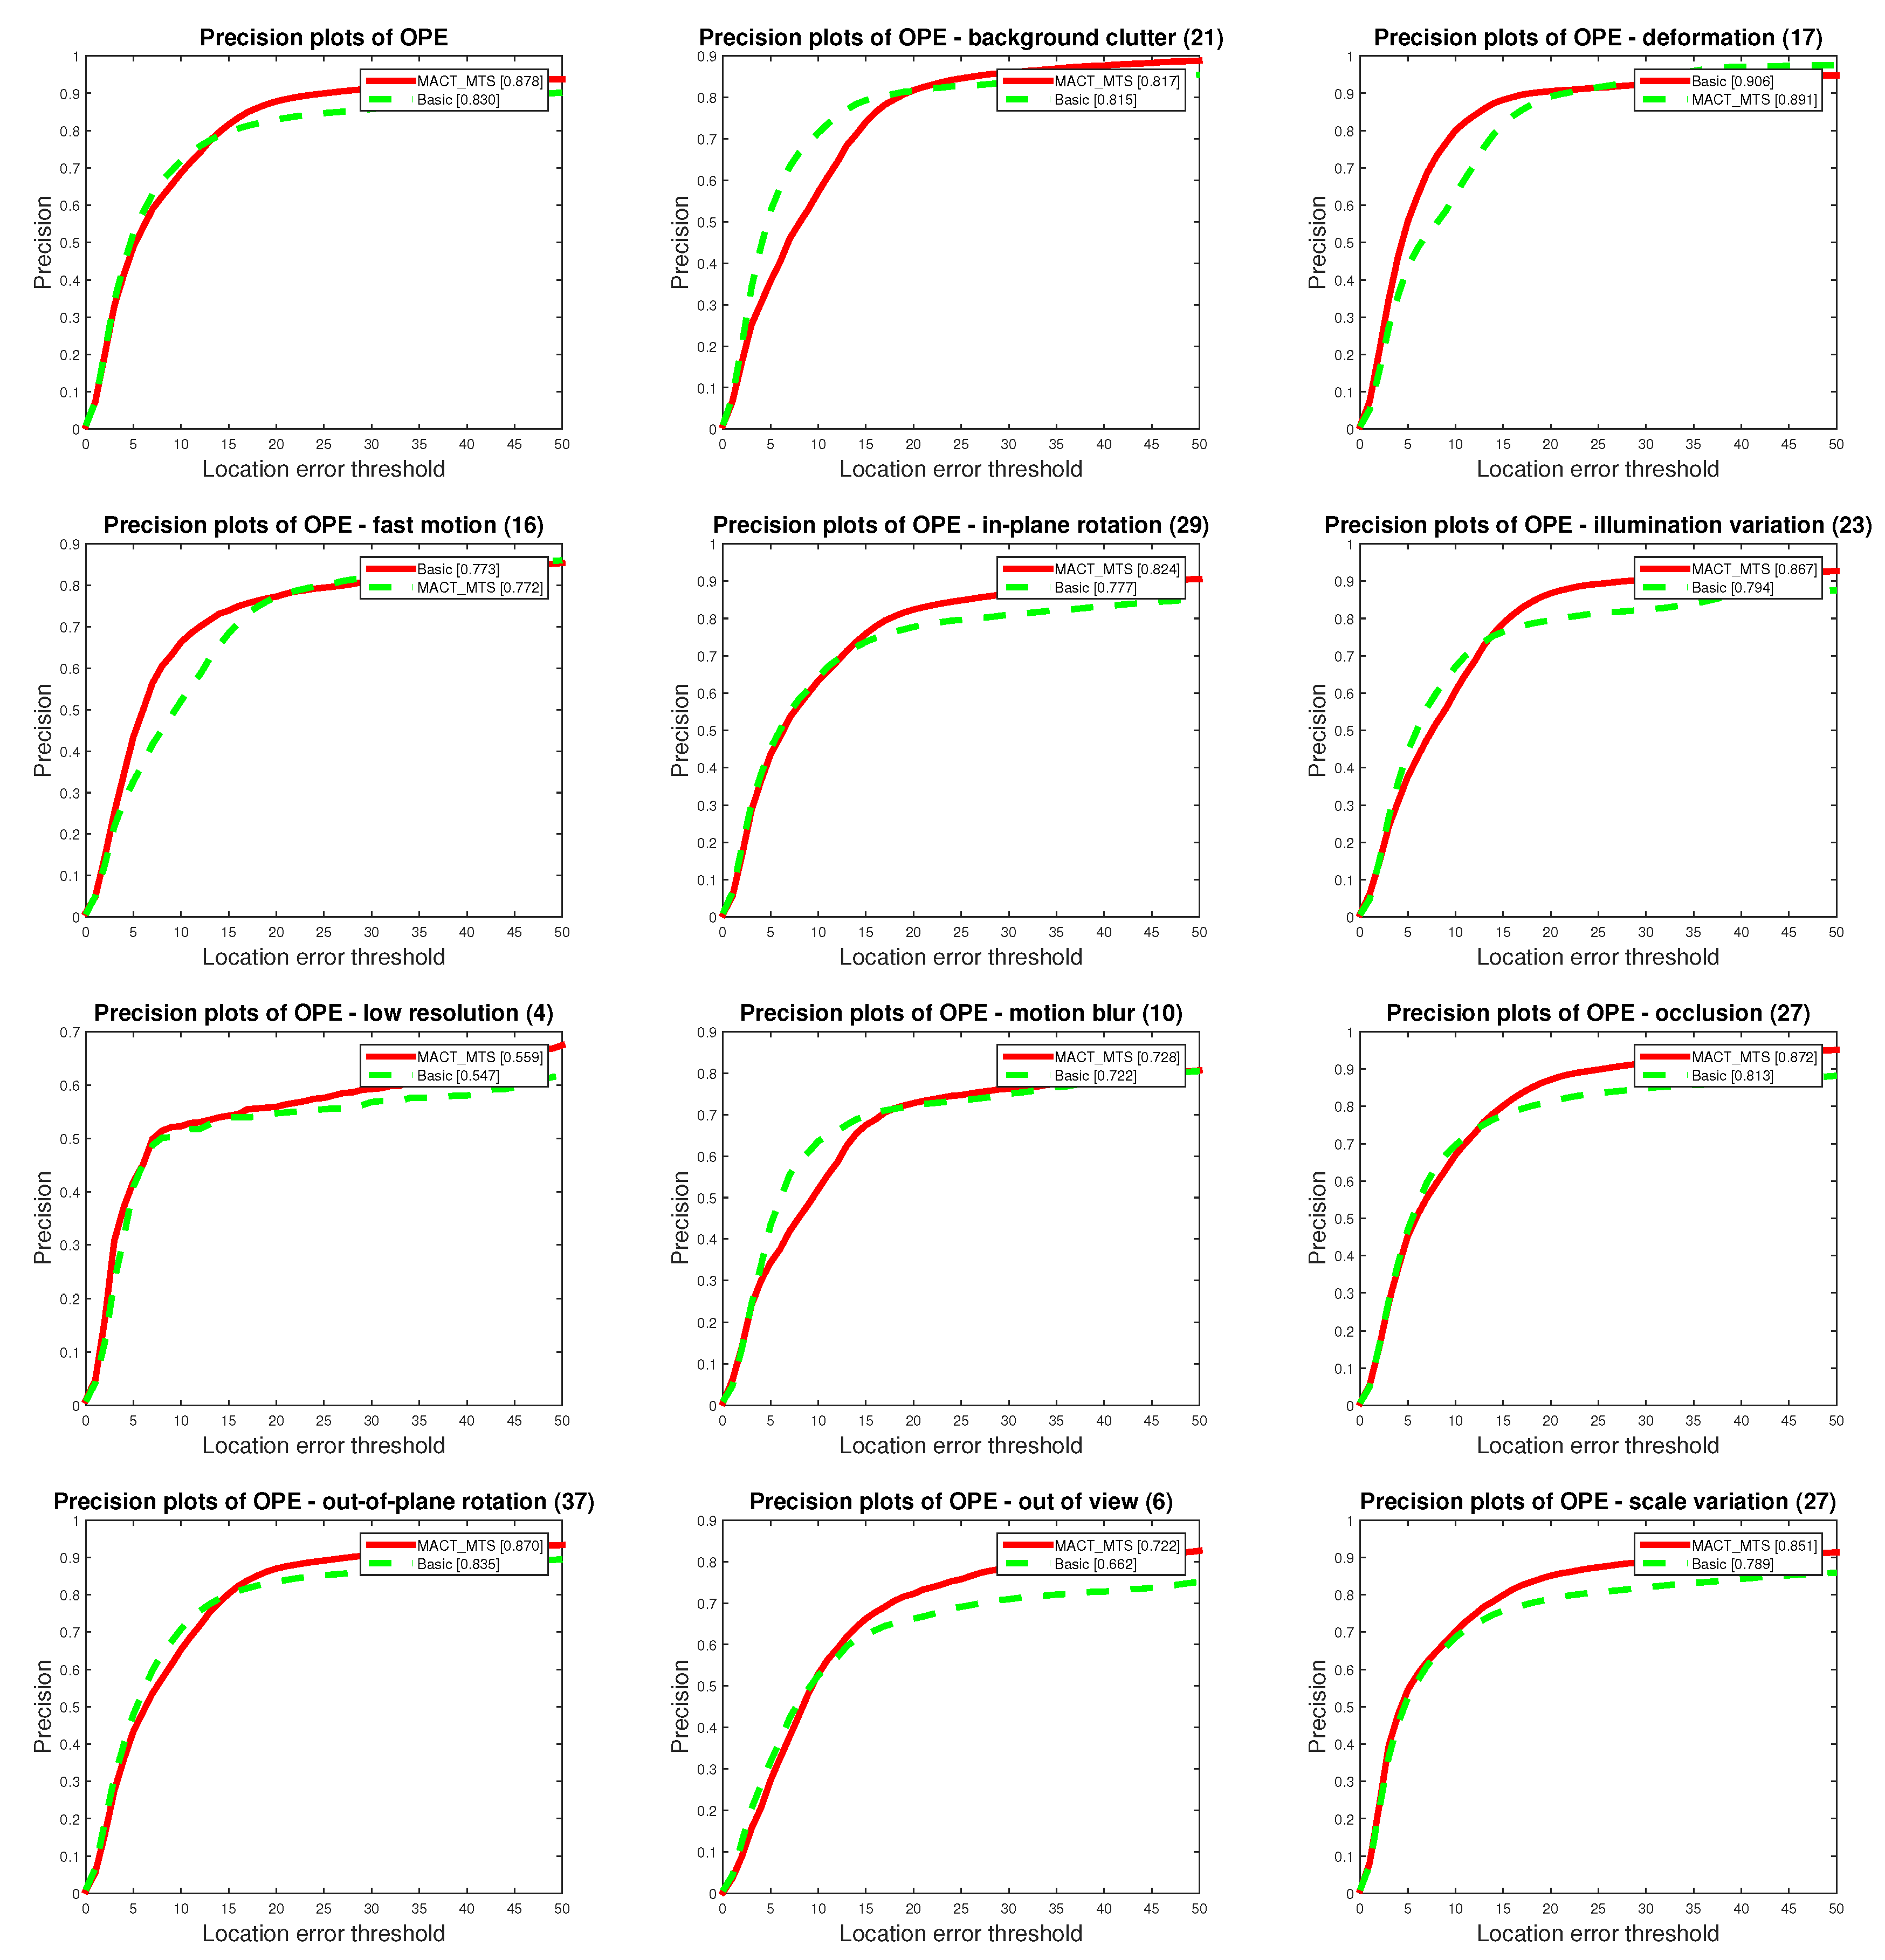
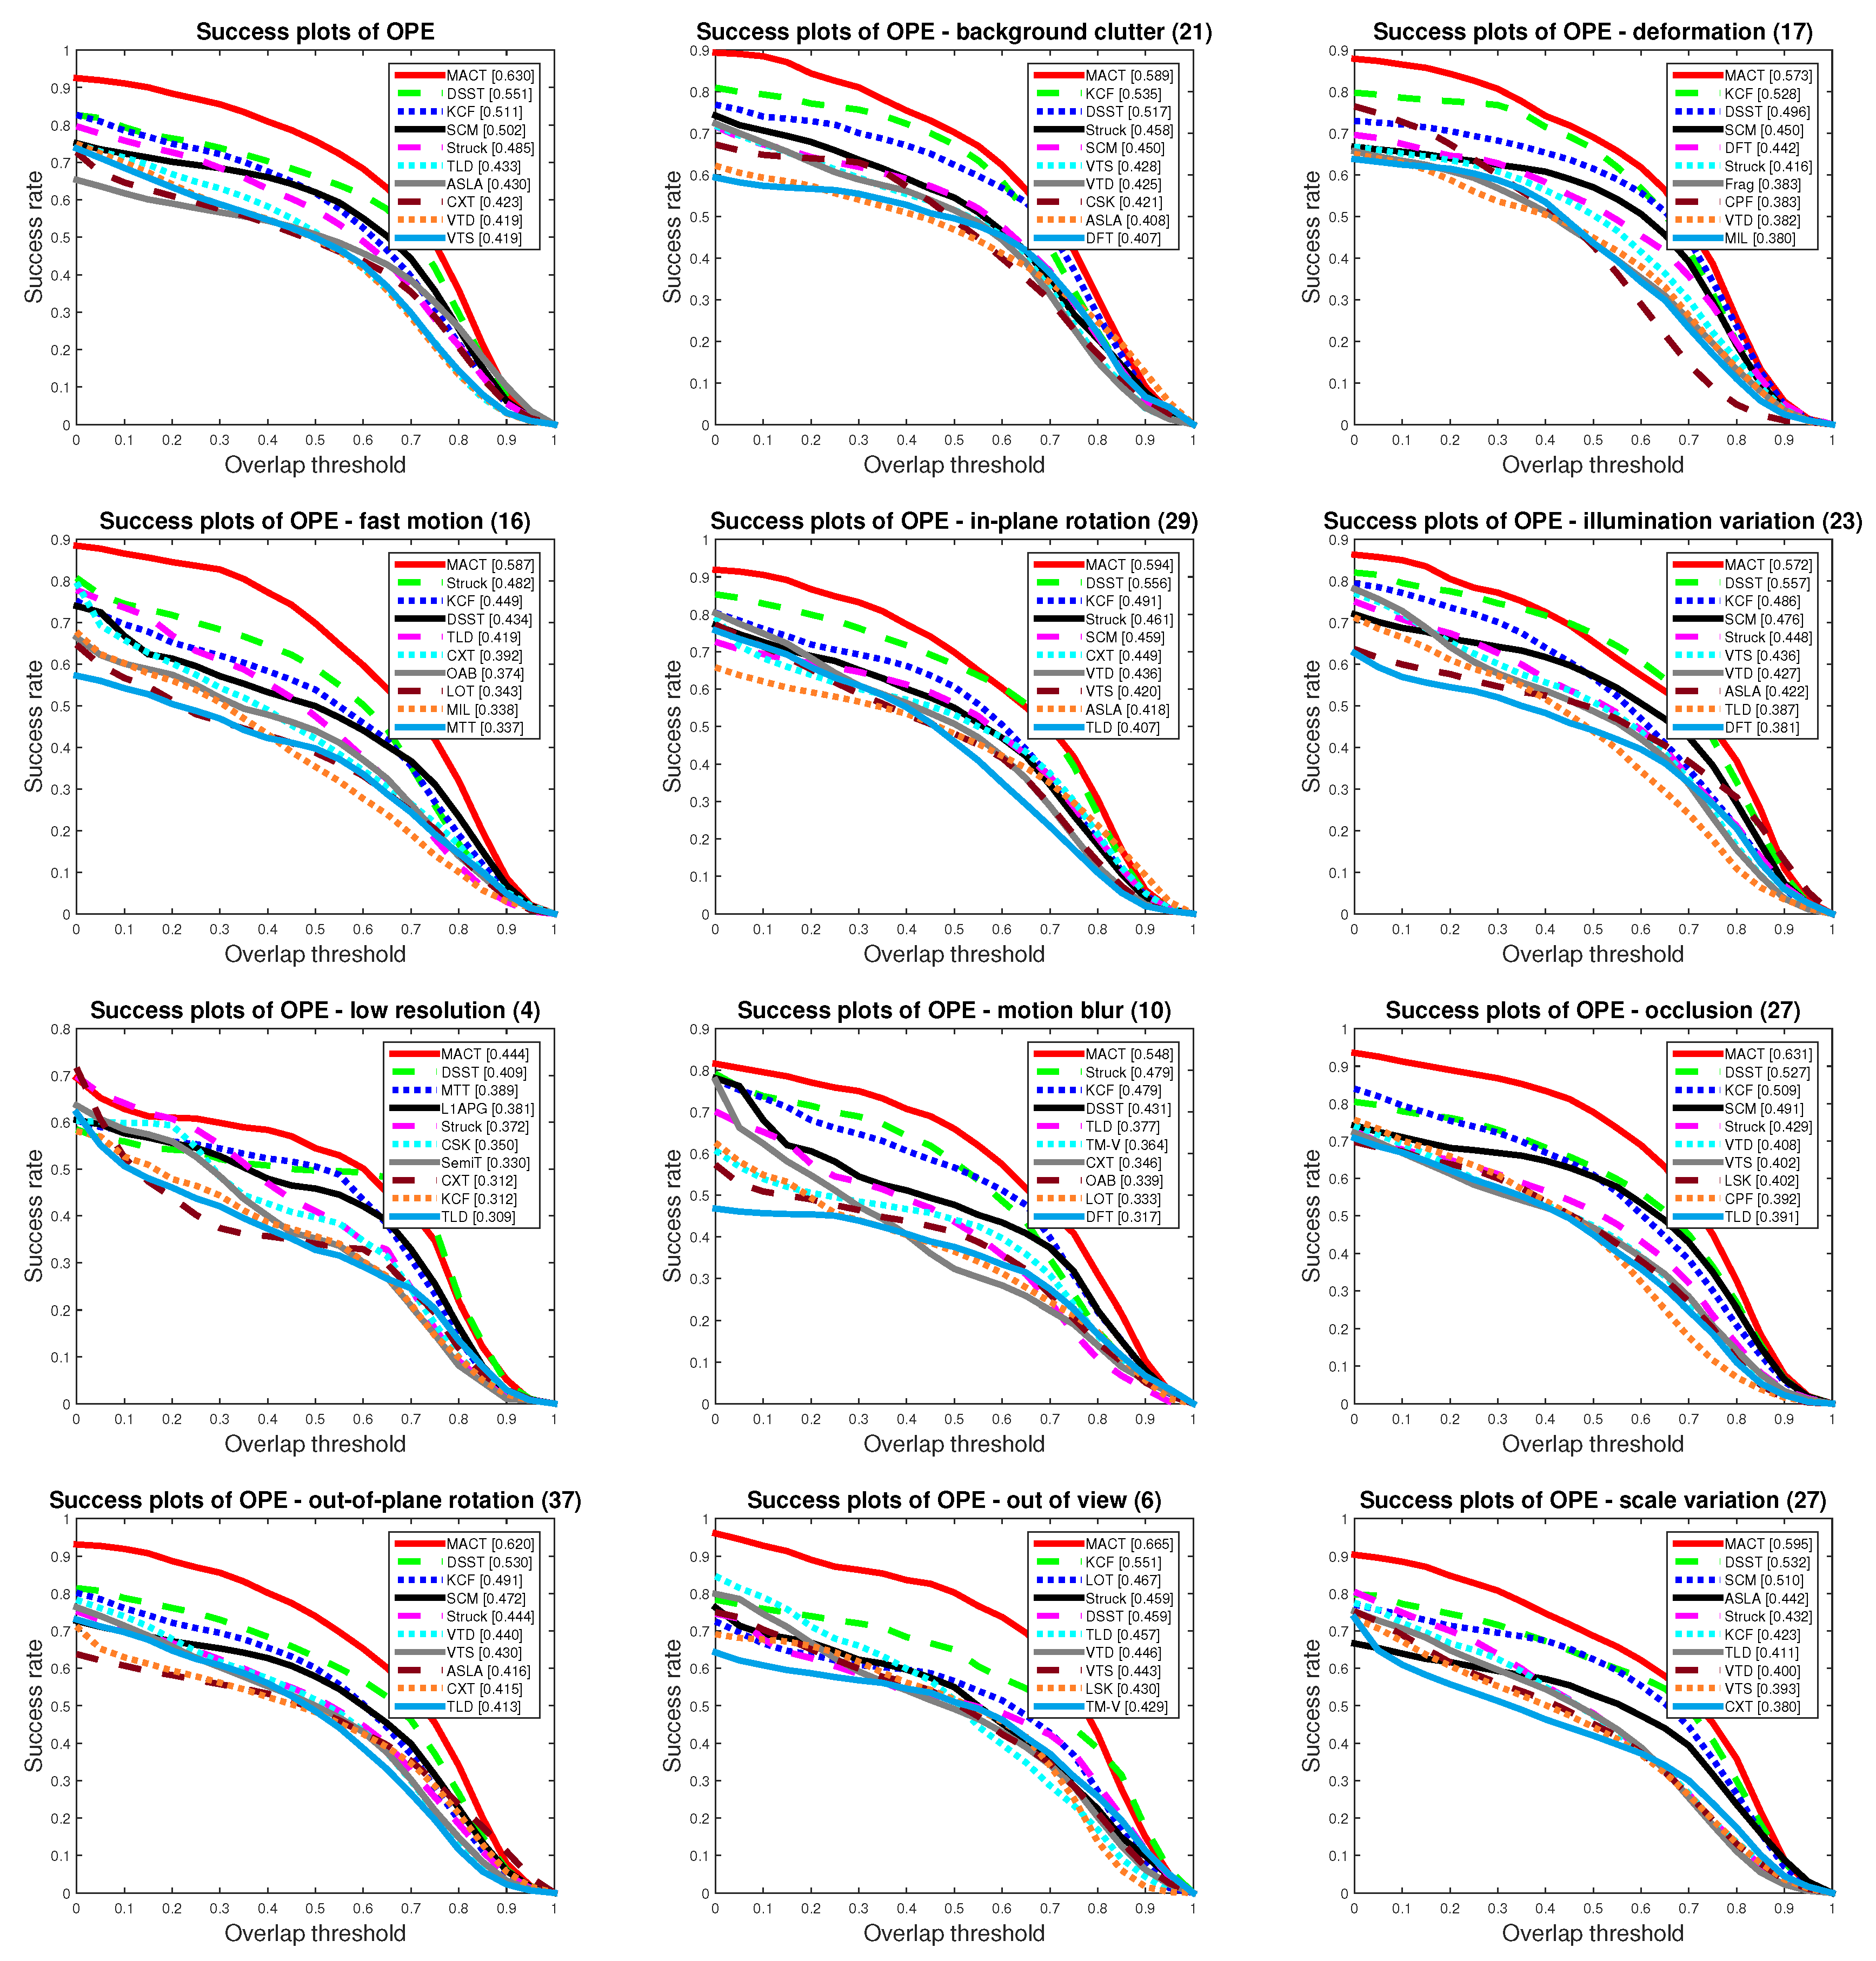
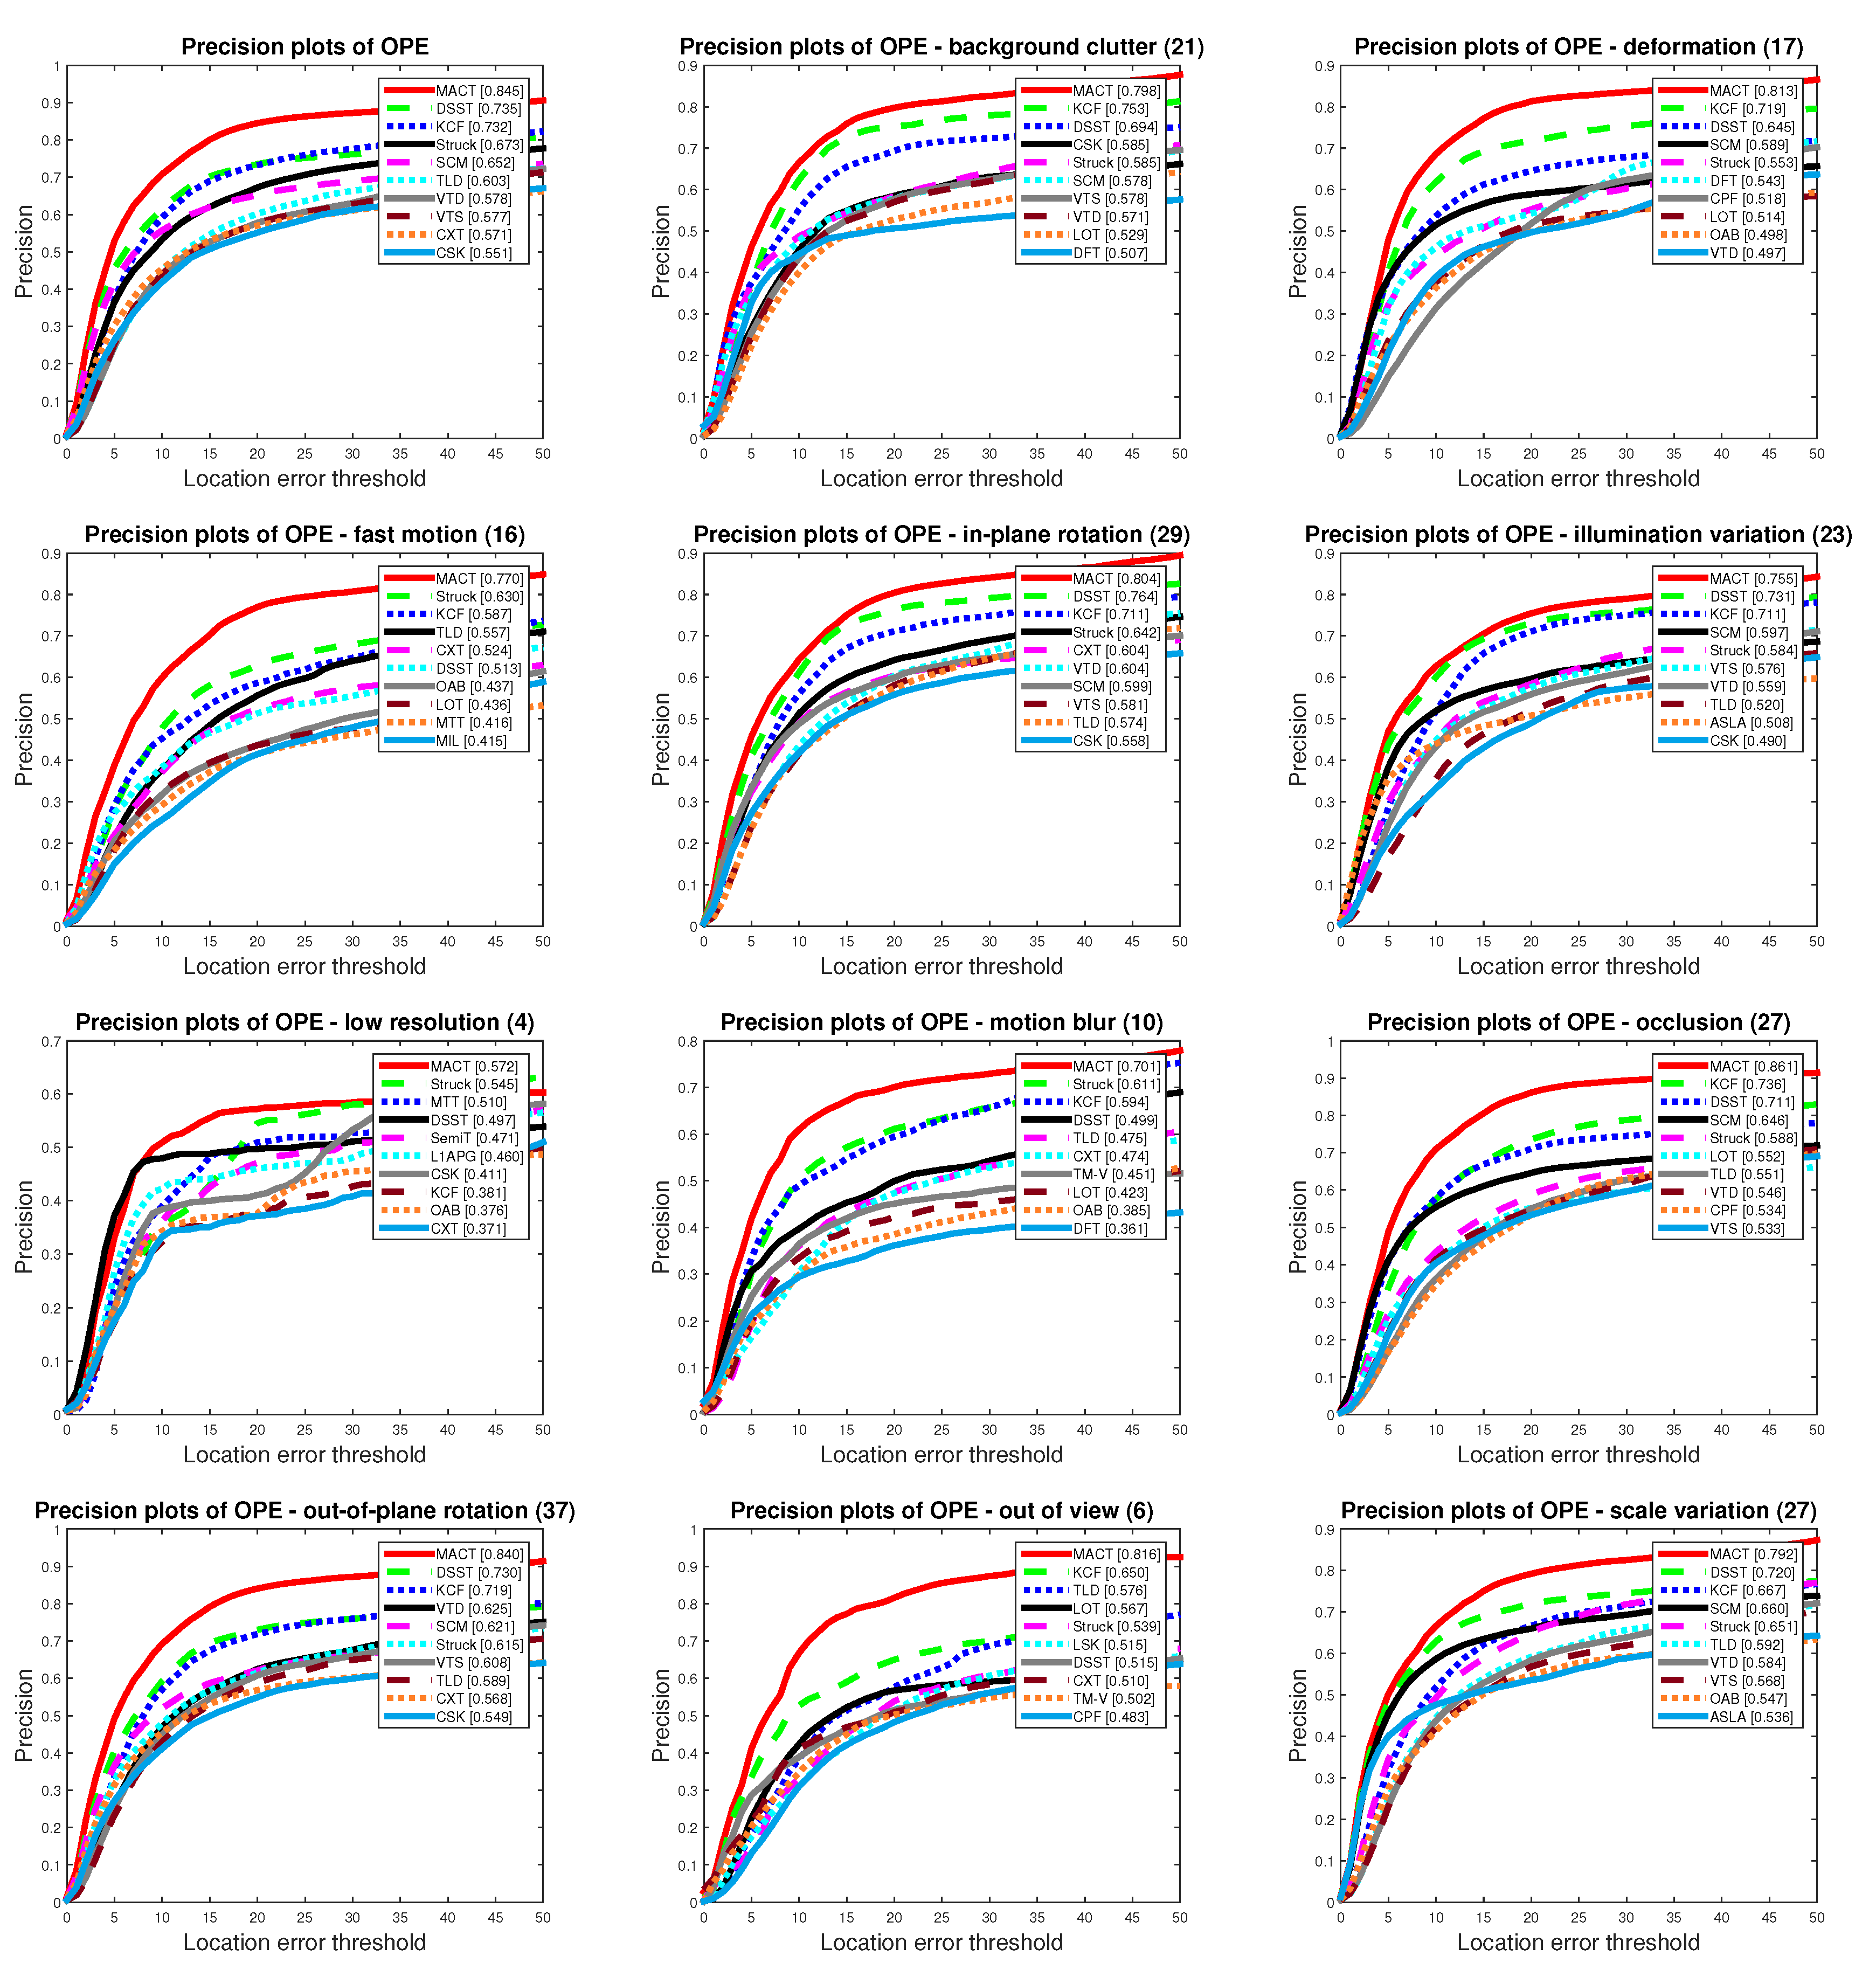
4.3.1. Quantitative Comparison
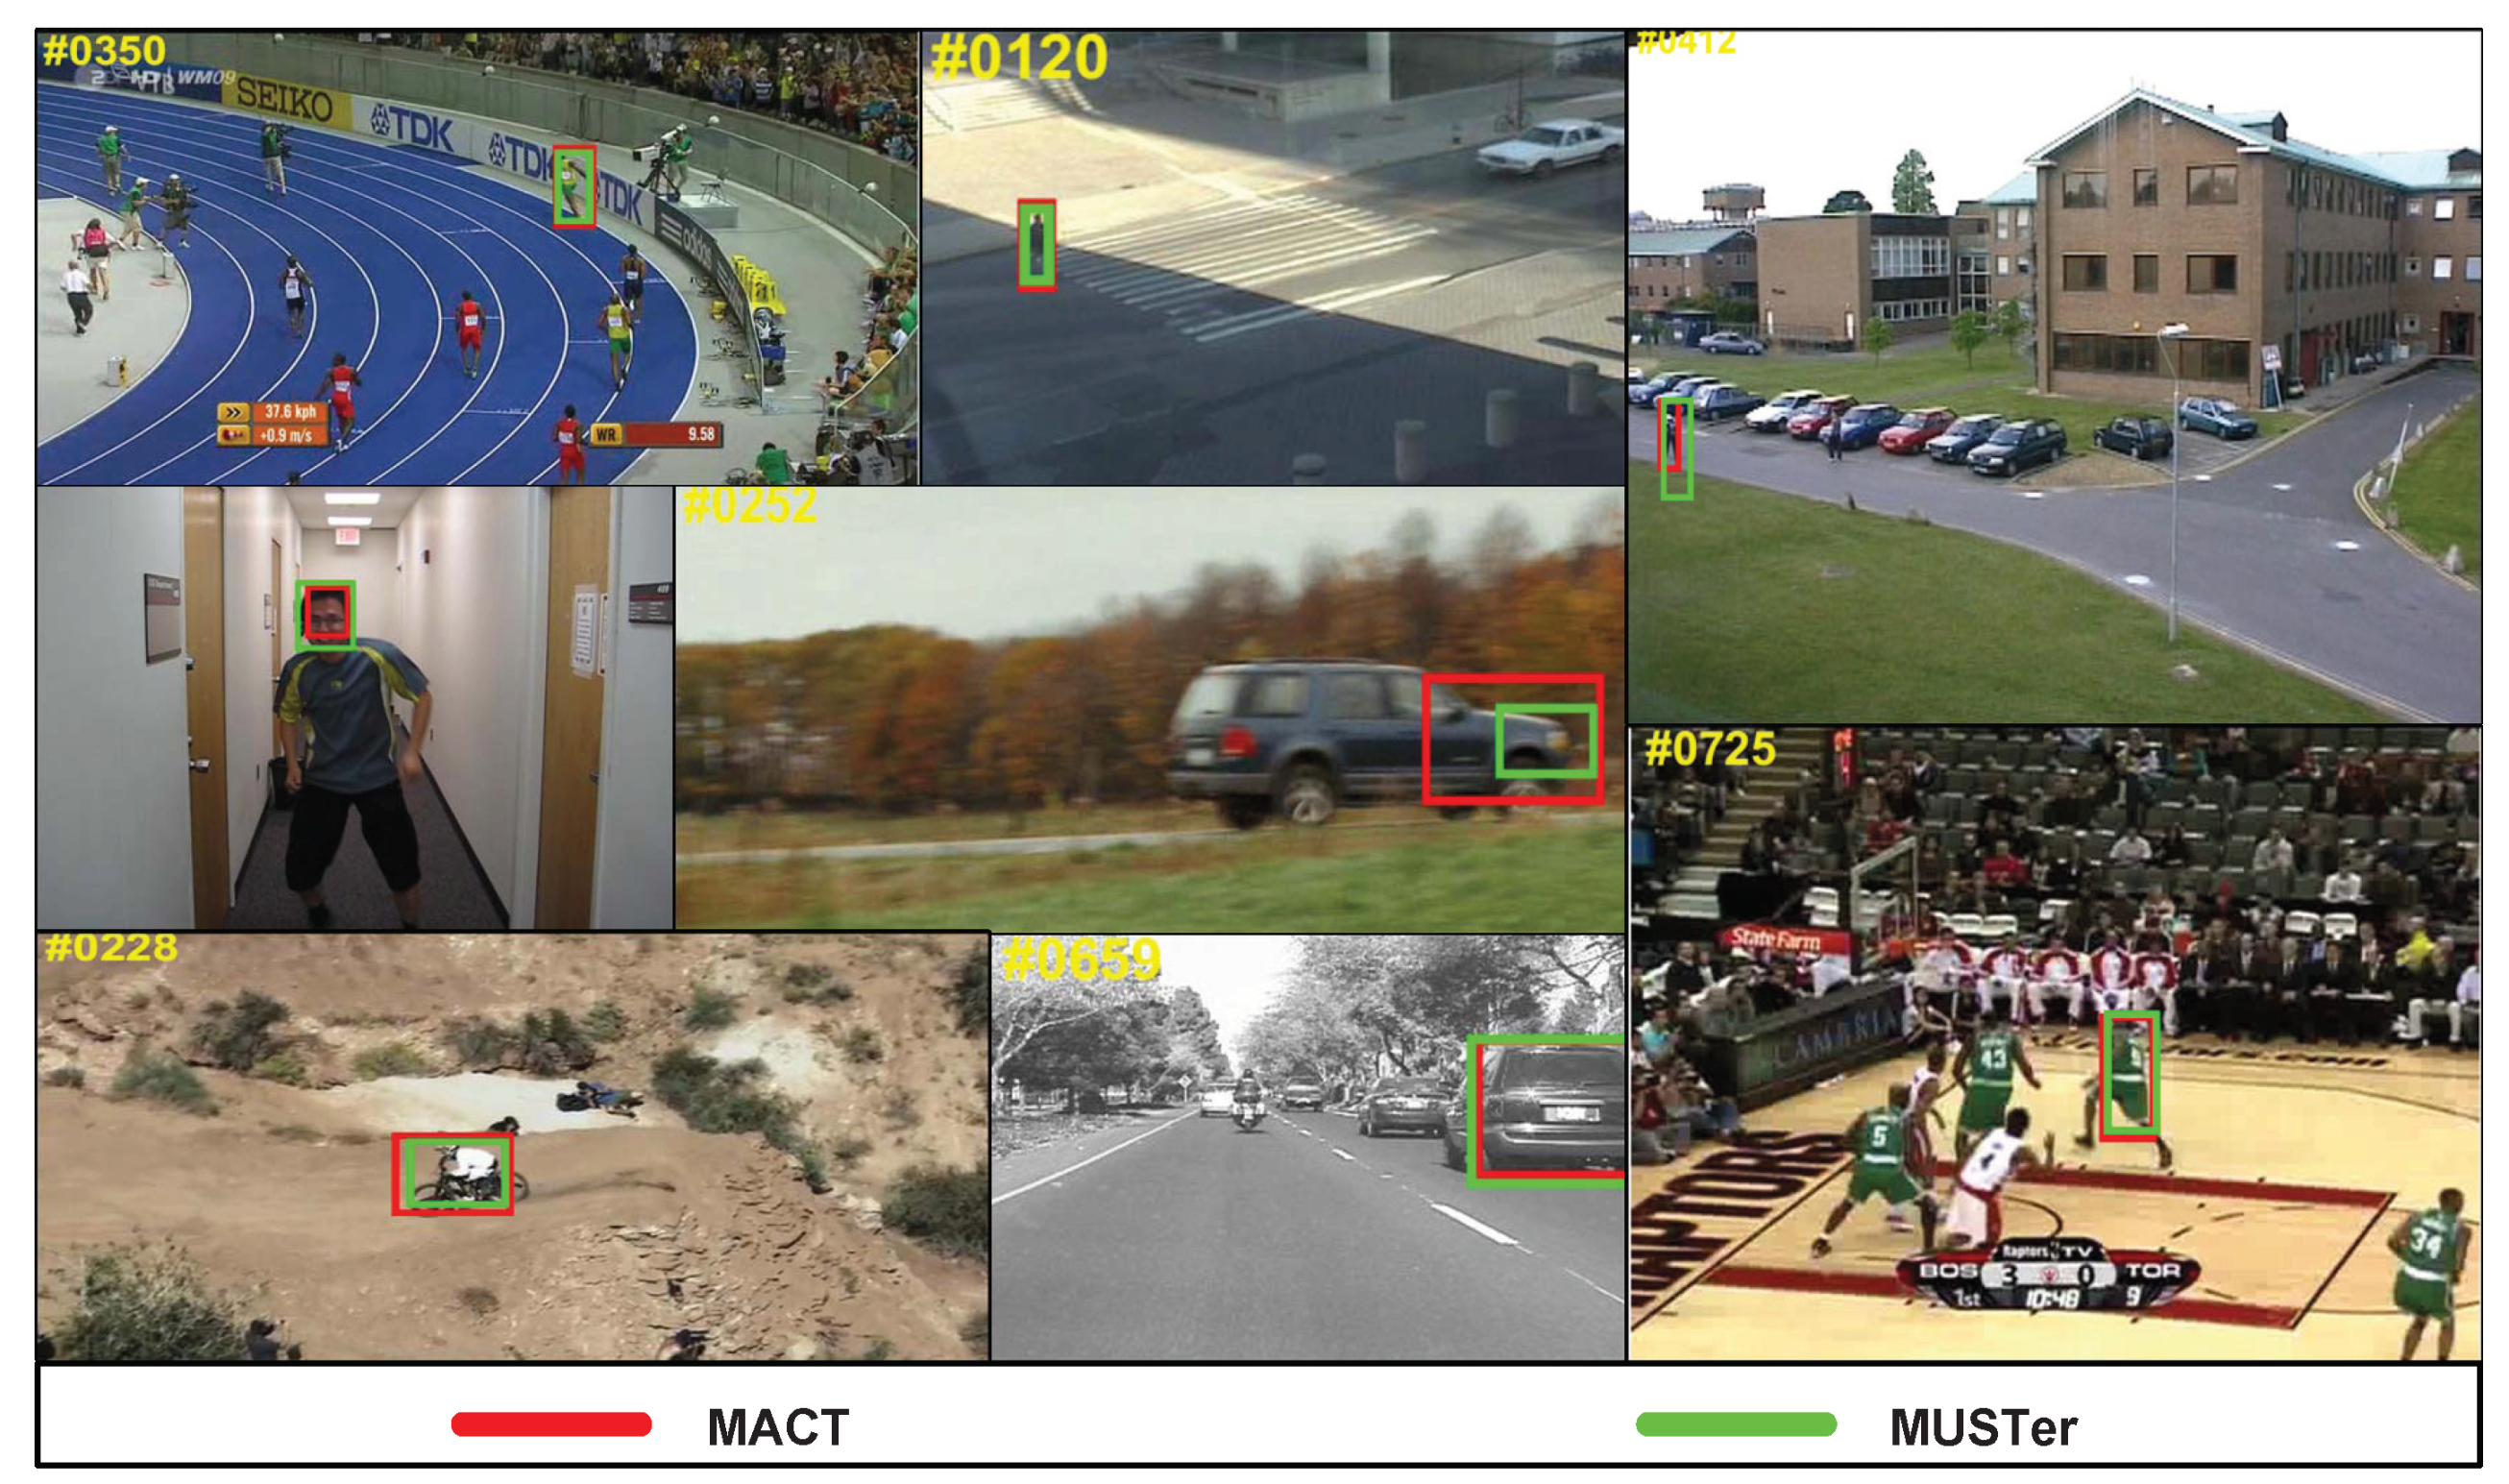
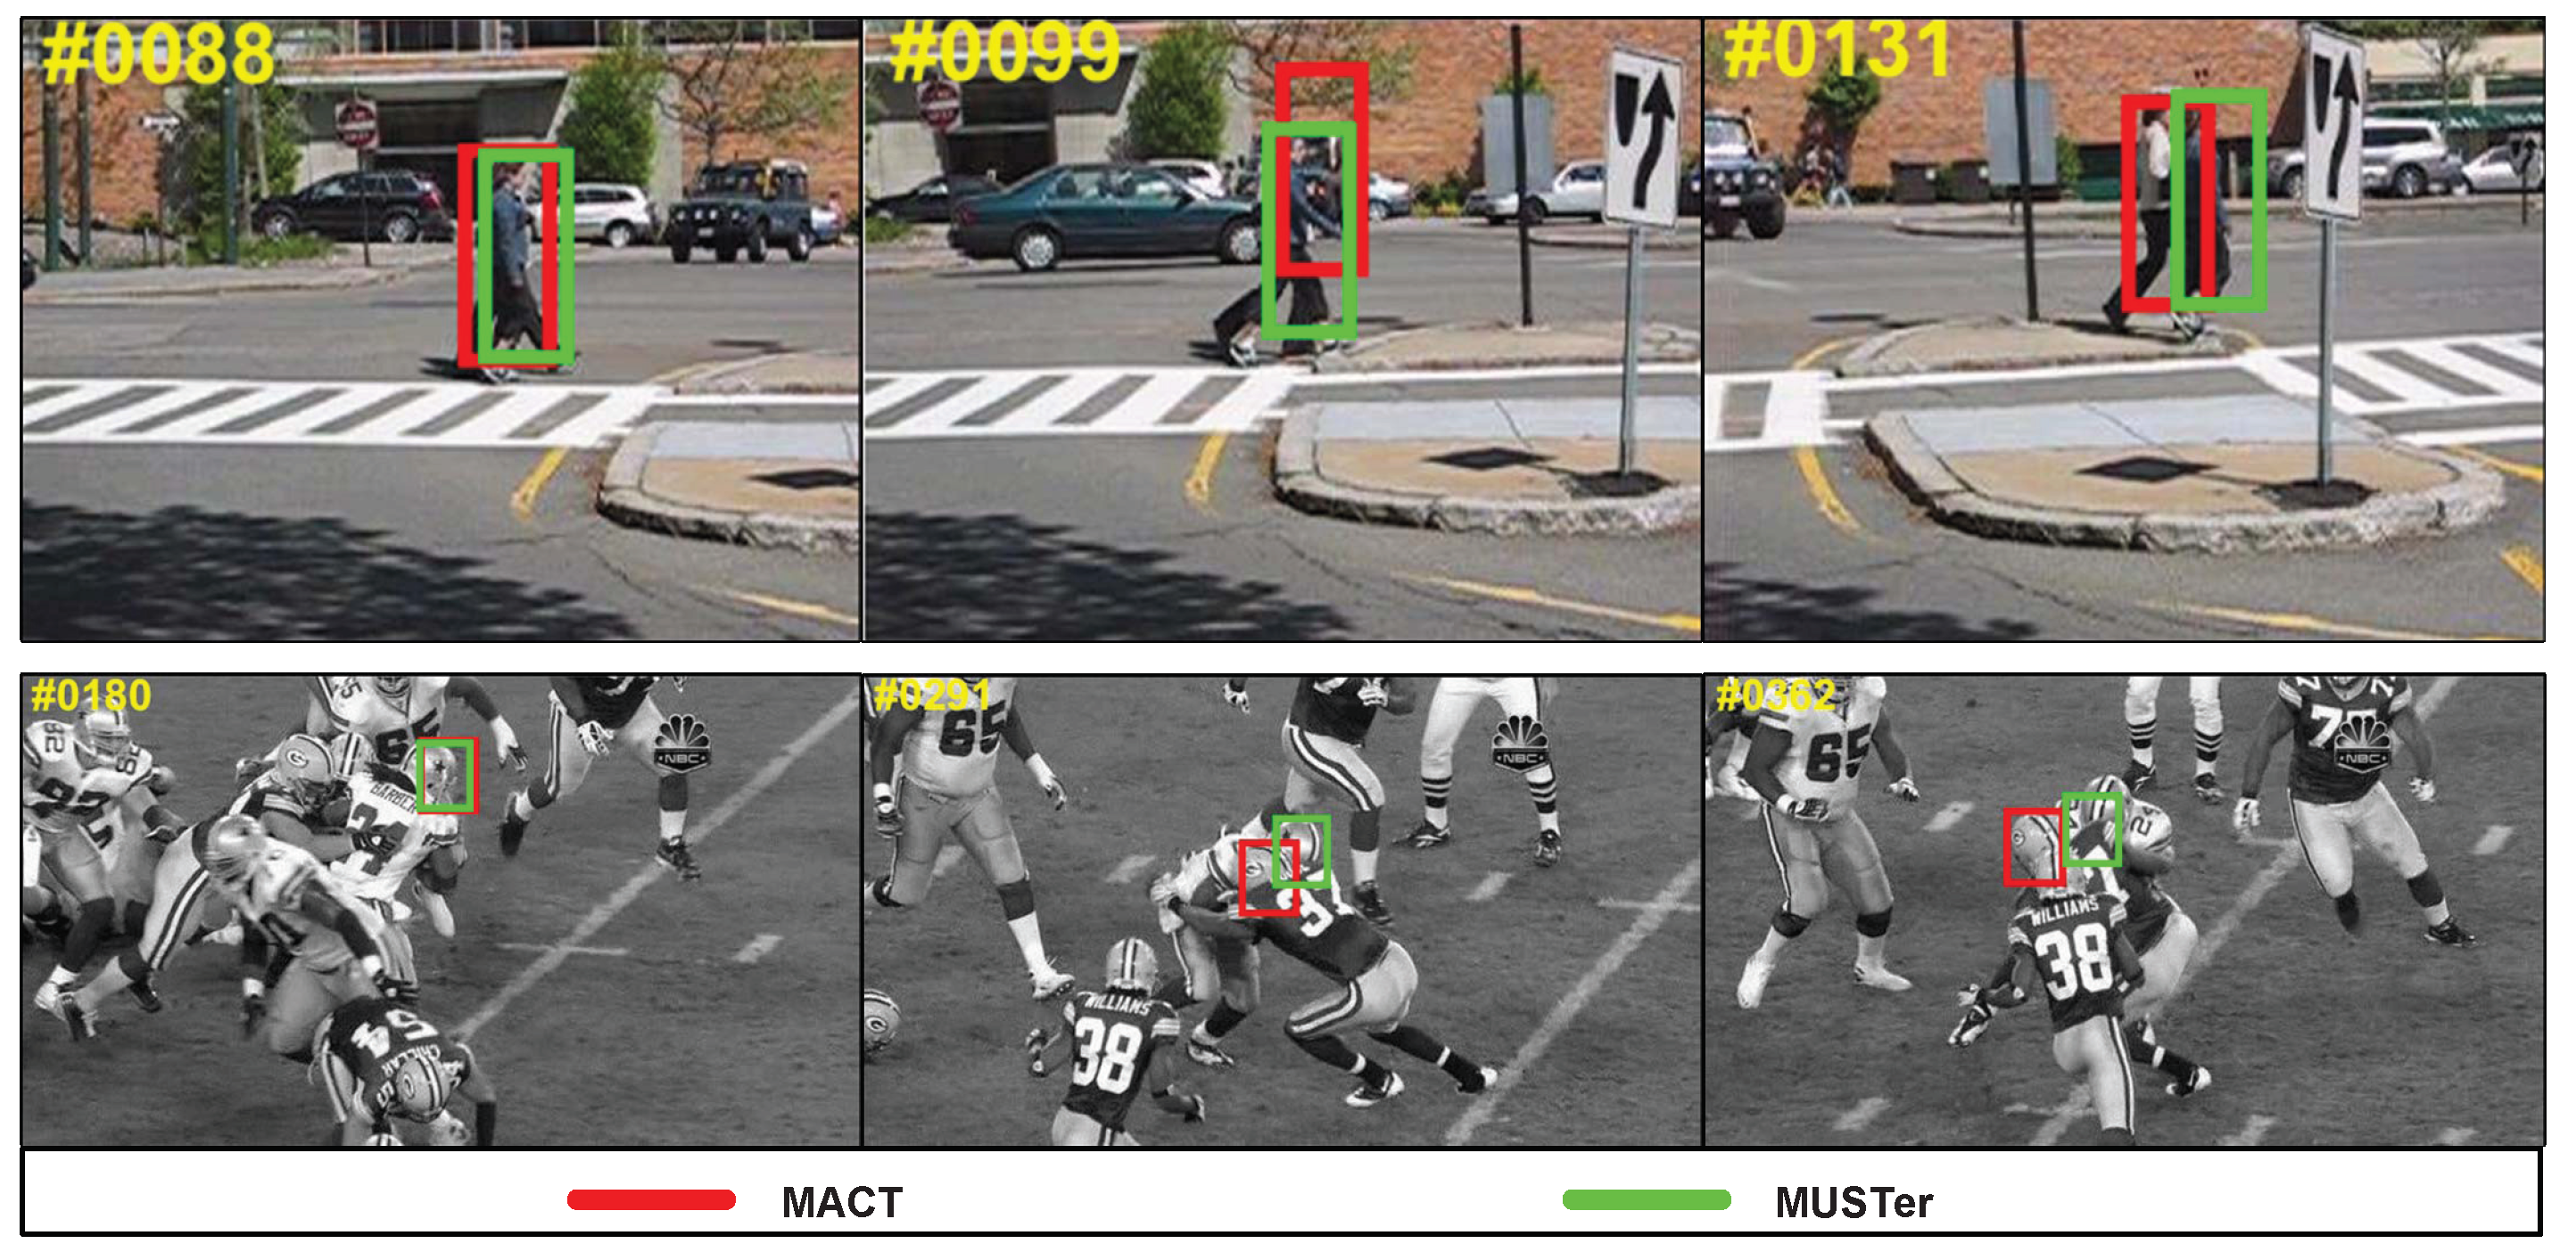
4.3.2. Qualitative Comparison
5. Conclusions
Author Contributions
Funding
Conflicts of Interest
References
- Wu, Y.; Lim, J.; Yang, M.H. Online object tracking: A benchmark. In Proceedings of the IEEE Conference on Computer Vision and Pattern Recognition, Portland, OR, USA, 23–28 June 2013; pp. 2411–2418. [Google Scholar]
- Wang, N.; Shi, J.; Yeung, D.Y.; Jia, J. Understanding and diagnosing visual tracking systems. In Proceedings of the IEEE International Conference on Computer Vision, Santiago, Chile, 7–13 December 2015; pp. 3101–3109. [Google Scholar]
- Dalal, N.; Triggs, B. Histograms of oriented gradients for human detection. In Proceedings of the 2005 IEEE Computer Society Conference on Computer Vision and Pattern Recognition (CVPR’05), San Diego, CA, USA, 20–25 June 2005; Volume 1, pp. 886–893. [Google Scholar]
- Smeulders, A.W.M.; Chu, D.M.; Cucchiara, R.; Calderara, S.; Dehghan, A.; Shah, M. Visual Tracking: An Experimental Survey. IEEE Trans. Pattern Anal. Mach. Intell. 2014, 36, 1442–1468. [Google Scholar] [PubMed]
- Yang, H.; Shao, L.; Zheng, F.; Wang, L.; Song, Z. Recent advances and trends in visual tracking: A review. Neurocomputing 2011, 74, 3823–3831. [Google Scholar] [CrossRef]
- Peng, X.; Feris, R.S.; Wang, X.; Metaxas, D.N. A Recurrent Encoder-Decoder Network for Sequential Face Alignment. In Proceedings of the European Conference on Computer Vision, Amsterdam, The Netherlands, 11–14 October 2016; pp. 38–56. [Google Scholar]
- Kristan, M.; Pflugfelder, R.P.; Leonardis, A.; Matas, J.; Cehovin, L.; Nebehay, G.; Vojir, T.; Fernandez, G.; Lukezic, A.; Dimitriev, A.; et al. The visual object tracking VOT2014 challenge results. In Proceedings of the IEEE International Conference on Computer Vision (ICCV), Santiago, Chile, 7–13 December 2015; pp. 191–217. [Google Scholar]
- Li, A.; Lin, M.; Wu, Y.; Yang, M.; Yan, S. NUS-PRO: A new visual tracking challenge. IEEE Trans. Pattern Anal. Mach. Intell. 2016, 38, 335–349. [Google Scholar] [CrossRef] [PubMed]
- Xue, W.; Xu, C.; Feng, Z. Robust visual tracking via multi-scale spatio-temporal context learning. IEEE Trans. Circuits Syst. Video Technol. 2017. [Google Scholar] [CrossRef]
- Li, W.; Li, W.; Fan, M.; Wang, D.; Ye, X. Multi-modality tracker aggregation: From generative to discriminative. In Proceedings of the International Conference on Artificial Intelligence, Buenos Aires, Argentina, 25–31 July 2015; pp. 1937–1943. [Google Scholar]
- Comaniciu, D.; Ramesh, V.; Meer, P. Real-time tracking of non-rigid objects using mean shift. In Proceedings of the IEEE Conference on Computer Vision and Pattern Recognition (CVPR 2000), Hilton Head Island, SC, USA, 15–15 June 2000; Volume 2, pp. 142–149. [Google Scholar]
- Arulampalam, M.S.; Maskell, S.; Gordon, N.J.; Clapp, T. A tutorial on particle filters for online nonlinear/ non-Gaussian Bayesian tracking. IEEE Trans. Signal Process. 2002, 50, 174–188. [Google Scholar] [CrossRef]
- Weng, S.; Kuo, C.; Tu, S. Video object tracking using adaptive Kalman filter. J. Vis. Commun. Image Represent. 2006, 17, 1190–1208. [Google Scholar] [CrossRef]
- Tang, M.; Peng, X. Robust tracking with discriminative ranking lists. In Proceedings of the Asian Conference on Computer Vision, Queenstown, New Zealand, 8–12 November 2010; pp. 283–295. [Google Scholar]
- Kalal, Z.; Mikolajczyk, K.; Matas, J. Tracking-Learning-Detection. IEEE Trans. Pattern Anal. Mach. Intell. 2012, 34, 1409–1422. [Google Scholar] [CrossRef] [PubMed]
- Hare, S.; Saffari, A.; Torr, P.H.S. Struck: Structured output tracking with kernels. In Proceedings of the 2011 International Conference on Computer Vision, Barcelona, Spain, 6–13 November 2011; pp. 263–270. [Google Scholar]
- Henriques, J.F.; Caseiro, R.; Martins, P.; Batista, J. Exploiting the circulant structure of tracking-by-detection with kernels. In Proceedings of the 12th European Conference on Computer Vision, Florence, Italy, 7–13 October 2012; pp. 702–715. [Google Scholar]
- Henriques, J.F.; Caseiro, R.; Martins, P.; Batista, J. High-Speed Tracking with Kernelized Correlation Filters. IEEE Trans. Pattern Anal. Mach. Intell. 2015, 37, 583–596. [Google Scholar] [CrossRef] [PubMed]
- Danelljan, M.; Häger, G.; Khan, F.; Felsberg, M. Accurate scale estimation for robust visual tracking. In Proceedings of the British Machine Vision Conference, Nottingham, UK, 1–5 September 2014. [Google Scholar]
- Danelljan, M.; Hager, G.; Khan, F.S.; Felsberg, M. Learning spatially regularized correlation filters for visual tracking. In Proceedings of the International Conference on Computer Vision, Santiago, Chile, 7–13 December 2015; pp. 4310–4318. [Google Scholar]
- Danelljan, M.; Robinson, A.; Khan, F.S.; Felsberg, M. Beyond correlation filters: Learning continuous convolution operators for visual tracking. In Proceedings of the European Conference on Computer Vision, Amsterdam, The Netherlands, 11–14 October 2016; pp. 472–488. [Google Scholar]
- Danelljan, M.; Bhat, G.; Khan, F.S.; Felsberg, M. ECO: Efficient convolution operators for tracking. In Proceedings of the 2017 IEEE Conference on Computer Vision and Pattern Recognition (CVPR), Honolulu, HI, USA, 21–26 July 2017; pp. 6931–6939. [Google Scholar]
- Held, D.; Thrun, S.; Savarese, S. Learning to track at 100 FPS with deep regression networks. In Proceedings of the 14th European Conference, Amsterdam, The Netherlands, 11–14 October 2016; pp. 749–765. [Google Scholar]
- Bertinetto, L.; Valmadre, J.; Henriques, J.F.; Vedaldi, A.; Torr, P.H.S. Fully-convolutional siamese networks for object tracking. In Proceedings of the European Conference on Computer Vision, Amsterdam, The Netherlands, 11–14 October 2016; pp. 850–865. [Google Scholar]
- Valmadre, J.; Bertinetto, L.; Henriques, J.F.; Vedaldi, A.; Torr, P.H.S. End-to-end representation learning for correlation filter based tracking. In Proceedings of the 2017 IEEE Conference on Computer Vision and Pattern Recognition (CVPR), Honolulu, HI, USA, 21–26 July 2017; pp. 5000–5008. [Google Scholar]
- Mnih, V.; Kavukcuoglu, K.; Silver, D.; Rusu, A.A.; Veness, J.; Bellemare, M.G.; Graves, A.; Riedmiller, M.A.; Fidjeland, A.K.; Ostrovski, G.; et al. Human-level control through deep reinforcement learning. Nature 2015, 518, 529–533. [Google Scholar] [CrossRef] [PubMed]
- Yun, S.; Choi, J.; Yoo, Y.; Yun, K.; Choi, J.Y. Action-decision networks for visual tracking with deep reinforcement learning. In Proceedings of the 2017 IEEE Conference on Computer Vision and Pattern Recognition (CVPR), Honolulu, HI, USA, 21–26 July 2017; pp. 1349–1358. [Google Scholar]
- Zhang, D.; Maei, H.; Wang, X.; Wang, Y.F. Deep reinforcement learning for visual object tracking in videos. arXiv, 2017; arXiv:1701.08936. [Google Scholar]
- Huang, C.; Lucey, S.; Ramanan, D. Learning policies for adaptive tracking with deep feature cascades. In Proceedings of the IEEE International Conference on Computer Vision (ICCV), Venice, Italy, 22–29 October 2017; pp. 105–114. [Google Scholar]
- Supancic, J.S.; Ramanan, D. Self-paced learning for long-term tracking. In Proceedings of the IEEE Conference on Computer Vision and Pattern Recognition (CVPR), Portland, OR, USA, 23–28 June 2013; pp. 2379–2386. [Google Scholar]
- Wang, N.; Yeung, D.Y. Ensemble-based tracking: Aggregating crowdsourced structured time series data. In Proceedings of the 31st International Conference on Machine Learning, Beijing, China, 21–26 June 2014; pp. 1107–1115. [Google Scholar]
- Xue, W.; Feng, Z.; Xu, C.; Liu, T.; Meng, Z.; Zhang, C. Visual tracking via improving motion model and model updater. Int. J. Adv. Robot. Syst. 2018, 15, 172988141875623. [Google Scholar] [CrossRef]
- Watkins, C.; Dayan, P. Technical note Q-learning. Mach. Learn. 1992, 8, 279–292. [Google Scholar] [CrossRef]
- Sutton, R.S.; Barto, A.G. Reinforcement Learning: An Introduction; The MIT Press: Cambridge, MA, USA, 1999. [Google Scholar]
- Wolfe, J.M.; Horowitz, T.S. What attributes guide the deployment of visual attention and how do they do it. Nat. Rev. Neurosci. 2004, 5, 495–501. [Google Scholar] [CrossRef] [PubMed]
- Cheng, M.; Zhang, G.; Mitra, N.J.; Huang, X.; Hu, S. Global contrast based salient region detection. In Proceedings of the IEEE Computer Vision and Pattern Recognition (CVPR), Colorado Springs, CO, USA, 20–25 June 2011; Volume 37, pp. 409–416. [Google Scholar]
- Zhong, W.; Lu, H.; Yang, M.H. Robust object tracking via sparsity-based collaborative model. In Proceedings of the IEEE Conference on Computer Vision and Pattern Recognition (CVPR), Providence, RI, USA, 16–21 June 2012; pp. 1838–1845. [Google Scholar]
- Jia, X.; Lu, H.; Yang, M.H. Visual tracking via adaptive structural local sparse appearance model. In Proceedings of the IEEE Conference on Computer Vision and Pattern Recognition (CVPR), Providence, RI, USA, 16–21 June 2012; pp. 1822–1829. [Google Scholar]
- Dinh, T.B.; Vo, N.; Medioni, G. Context tracker: Exploring supporters and distracters in unconstrained environments. In Proceedings of the IEEE Computer Vision and Pattern Recognition (CVPR), Colorado Springs, CO, USA, 20–25 June 2011; pp. 1177–1184. [Google Scholar]
- Kwon, J.; Lee, K.M. Visual tracking decomposition. In Proceedings of the IEEE Computer Vision and Pattern Recognition (CVPR), San Francisco, CA, USA, 13–18 June 2010; pp. 1269–1276. [Google Scholar]
- Kwon, J.; Lee, K. Tracking by sampling trackers. In Proceedings of the 2011 International Conference on Computer Vision, Barcelona, Spain, 6–13 November 2011; pp. 1195–1202. [Google Scholar]
- Sevilla-Lara, L.; Learned-Miller, E. Distribution fields for tracking. In Proceedings of the IEEE Conference on Computer Vision and Pattern Recognition (CVPR), Providence, RI, USA, 16–21 June 2012; pp. 1910–1917. [Google Scholar]
- Pérez, P.; Hue, C.; Vermaak, J.; Gangnet, M. Color-based probabilistic tracking. In Proceedings of the 7th European Conference on Computer Vision, Copenhagen, Denmark, 28–31 May 2002; Springer: London, UK, 2002; pp. 661–675. [Google Scholar]
- Babenko, B.; Yang, M.H.; Belongie, S. Visual tracking with online multiple instance learning. In Proceedings of the IEEE Conference on Computer Vision and Pattern Recognition (CVPR), Miami, FL, USA, 20–25 June 2009; pp. 983–990. [Google Scholar]
- Grabner, H.; Grabner, M.; Bischof, H. Real-time tracking via on-line boosting. BMVC 2006, 1, 6. [Google Scholar]
- Liu, B.; Huang, J.; Yang, L.; Kulikowsk, C. Robust tracking using local sparse appearance model and k-selection. In Proceedings of the 2011 International Conference on Computer Vision, Barcelona, Spain, 6–13 November 2011; pp. 1313–1320. [Google Scholar]
- Zhang, T.; Ghanem, B.; Liu, S.; Ahuja, N. Robust visual tracking via multi-task sparse learning. In Proceedings of the IEEE Conference on Computer Vision and Pattern Recognition (CVPR), Providence, RI, USA, 16–21 June 2012; pp. 2042–2049. [Google Scholar]
- Kristan, M.; Matas, J.; Leonardis, A.; Felsberg, M.; Cehovin, L.; Fernandez, G.; Vojir, T.; Hager, G.; Nebehay, G.; Pflugfelder, R. The visual object tracking vot2015 challenge results. In Proceedings of the International Conference on Computer Vision, Santiago, Chile, 7–13 December 2015; pp. 1–23. [Google Scholar]
- Nam, H.; Han, B. Learning multi-domain convolutional neural networks for visual tracking. In Proceedings of the European Conference on Computer Vision, Amsterdam, The Netherlands, 11–14 October 2016; pp. 4293–4302. [Google Scholar]
- Bertinetto, L.; Valmadre, J.; Golodetz, S.; Miksik, O.; Torr, P.H. Staple: Complementary learners for real-time tracking. In Proceedings of the European Conference on Computer Vision, Amsterdam, The Netherlands, 11–14 October 2016; pp. 1401–1409. [Google Scholar]
- Zhang, J.; Ma, S.; Sclaroff, S. MEEM: Robust tracking via multiple experts using entropy minimization. In Proceedings of the European Conference on Computer Vision, Zurich, Switzerland, 6–12 September 2014; Springer: Basel, Switzerland, 2014; pp. 188–203. [Google Scholar]
- Hong, Z.; Chen, Z.; Wang, C.; Mei, X.; Prokhorov, D.; Tao, D. Multi-store tracker (muster): A cognitive psychology inspired approach to object tracking. In Proceedings of the International Conference on Computer Vision and Pattern Recognition (CVPR), Santiago, Chile, 7–13 December 2015; pp. 749–758. [Google Scholar]


| FSS Reward | Raw Color | HOG | Raw Grayscale |
|---|---|---|---|
| tracking success: | 10 | 8 | 10 |
| tracking failure: | −1 | −5 | −1 |
| MTS Reward | Up | Down | Right | Left |
|---|---|---|---|---|
| tracking success: | 10 | 10 | 10 | 10 |
| tracking failure: | −5 | −5 | −5 | −5 |
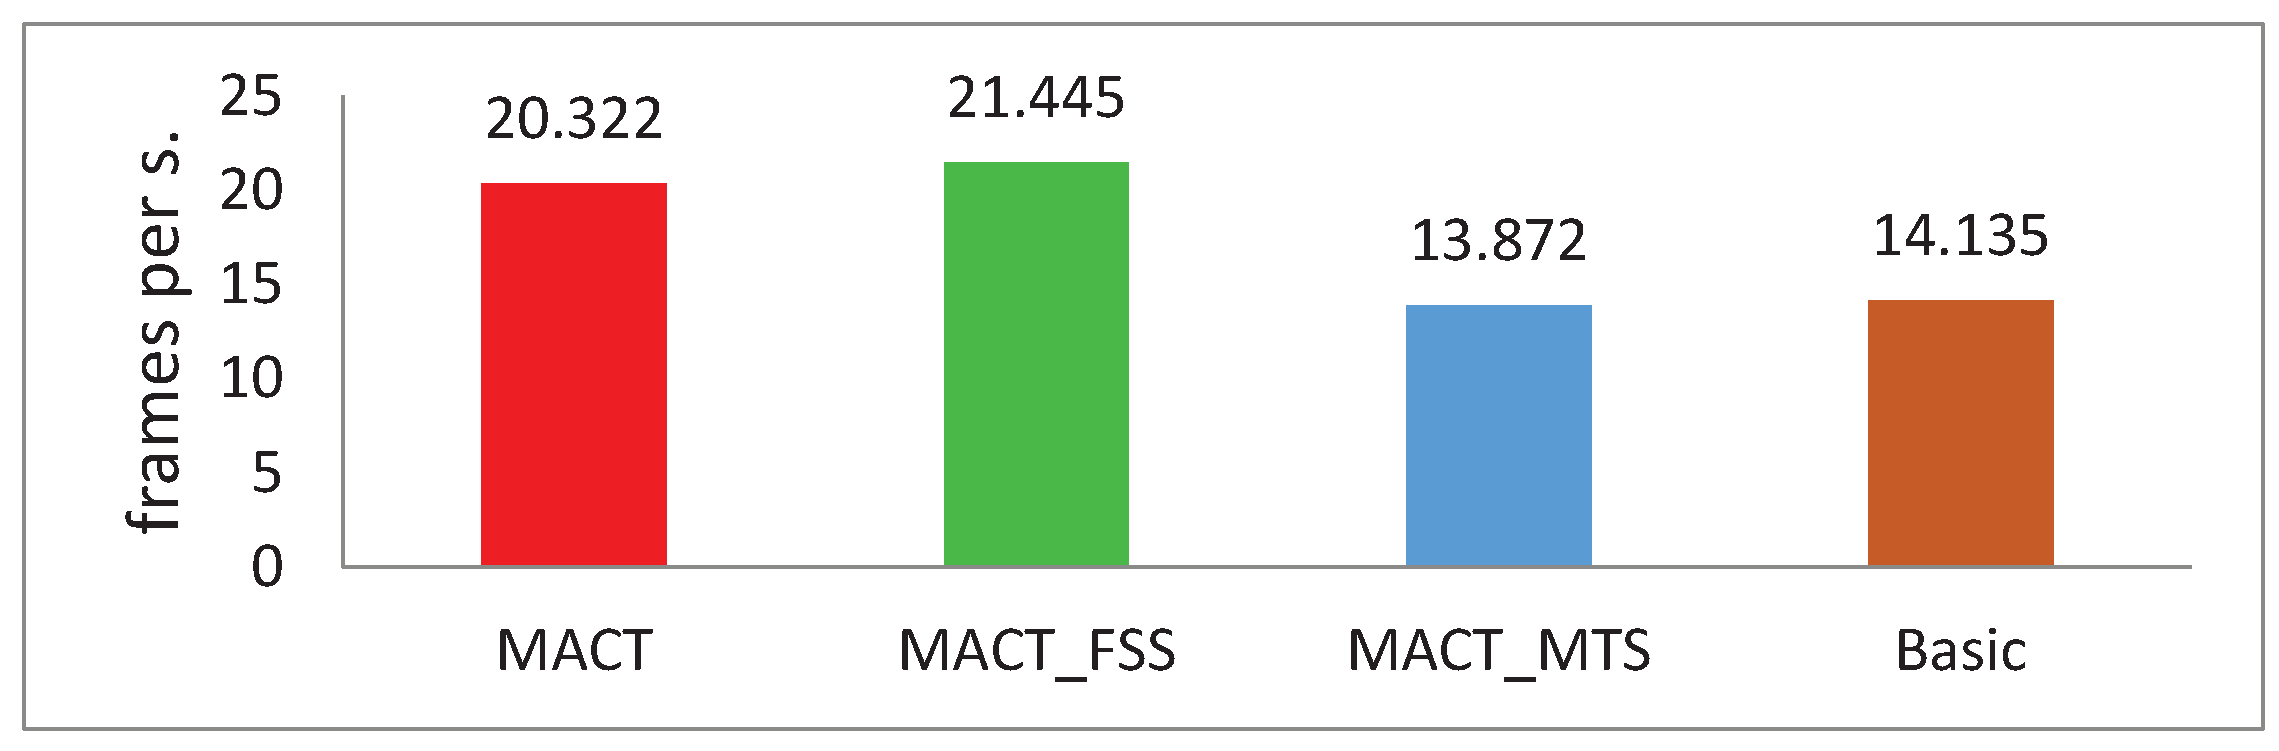
| MACT | MACT_FSS | MACT_MTS | Basic | |
|---|---|---|---|---|
| feature selection strategy (FSS) | Yes | Yes | No | No |
| movement trend strategy (MTS) | Yes | No | Yes | No |
| Trackers | Accuracy | Overlap | Speed |
|---|---|---|---|
| MDNet | 0.5607 | 0.3489 | 0.7928 |
| Staple | 0.5339 | 0.2651 | 10.5469 |
| MACT | 0.5099 | 0.2107 | 14.613 |
| DSST | 0.5071 | 0.1663 | 6.7001 |
| MEEM | 0.4811 | 0.2083 | 4.8127 |
© 2018 by the authors. Licensee MDPI, Basel, Switzerland. This article is an open access article distributed under the terms and conditions of the Creative Commons Attribution (CC BY) license (http://creativecommons.org/licenses/by/4.0/).
Share and Cite
Xue, W.; Feng, Z.; Xu, C.; Meng, Z.; Zhang, C. Adaptive Object Tracking via Multi-Angle Analysis Collaboration. Sensors 2018, 18, 3606. https://doi.org/10.3390/s18113606
Xue W, Feng Z, Xu C, Meng Z, Zhang C. Adaptive Object Tracking via Multi-Angle Analysis Collaboration. Sensors. 2018; 18(11):3606. https://doi.org/10.3390/s18113606
Chicago/Turabian StyleXue, Wanli, Zhiyong Feng, Chao Xu, Zhaopeng Meng, and Chengwei Zhang. 2018. "Adaptive Object Tracking via Multi-Angle Analysis Collaboration" Sensors 18, no. 11: 3606. https://doi.org/10.3390/s18113606
APA StyleXue, W., Feng, Z., Xu, C., Meng, Z., & Zhang, C. (2018). Adaptive Object Tracking via Multi-Angle Analysis Collaboration. Sensors, 18(11), 3606. https://doi.org/10.3390/s18113606