Comparison between Scalp EEG and Behind-the-Ear EEG for Development of a Wearable Seizure Detection System for Patients with Focal Epilepsy

 , and
, and
Abstract
:1. Introduction
2. Materials and Methods
2.1. Patients
2.2. Clinical EEG Recordings
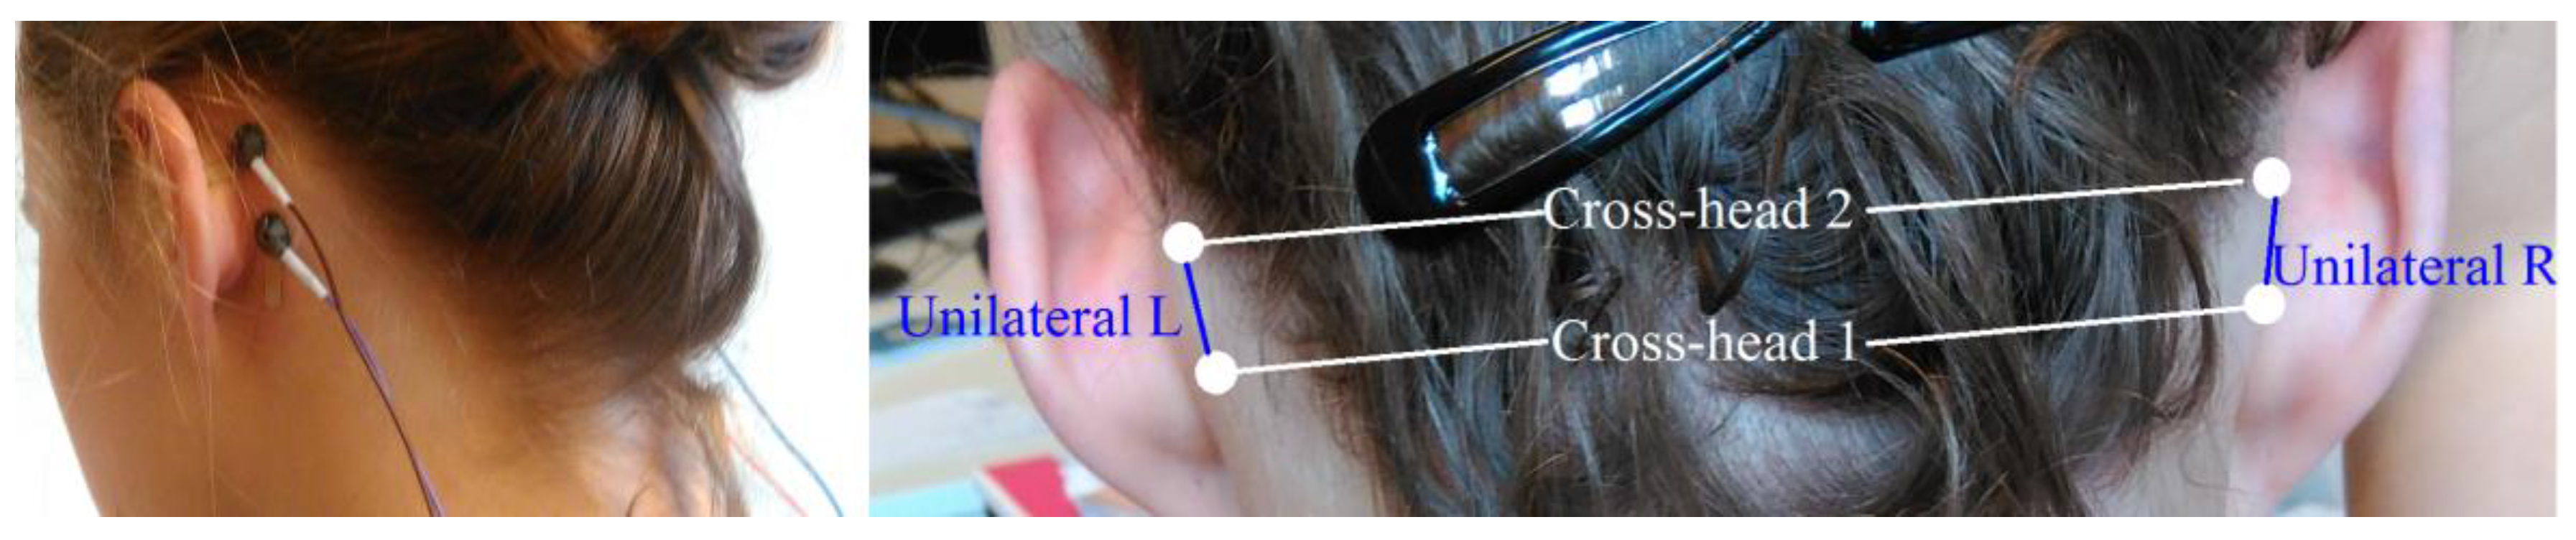
2.3. Behind-the-Ear EEG Setup
2.4. Preprocessing
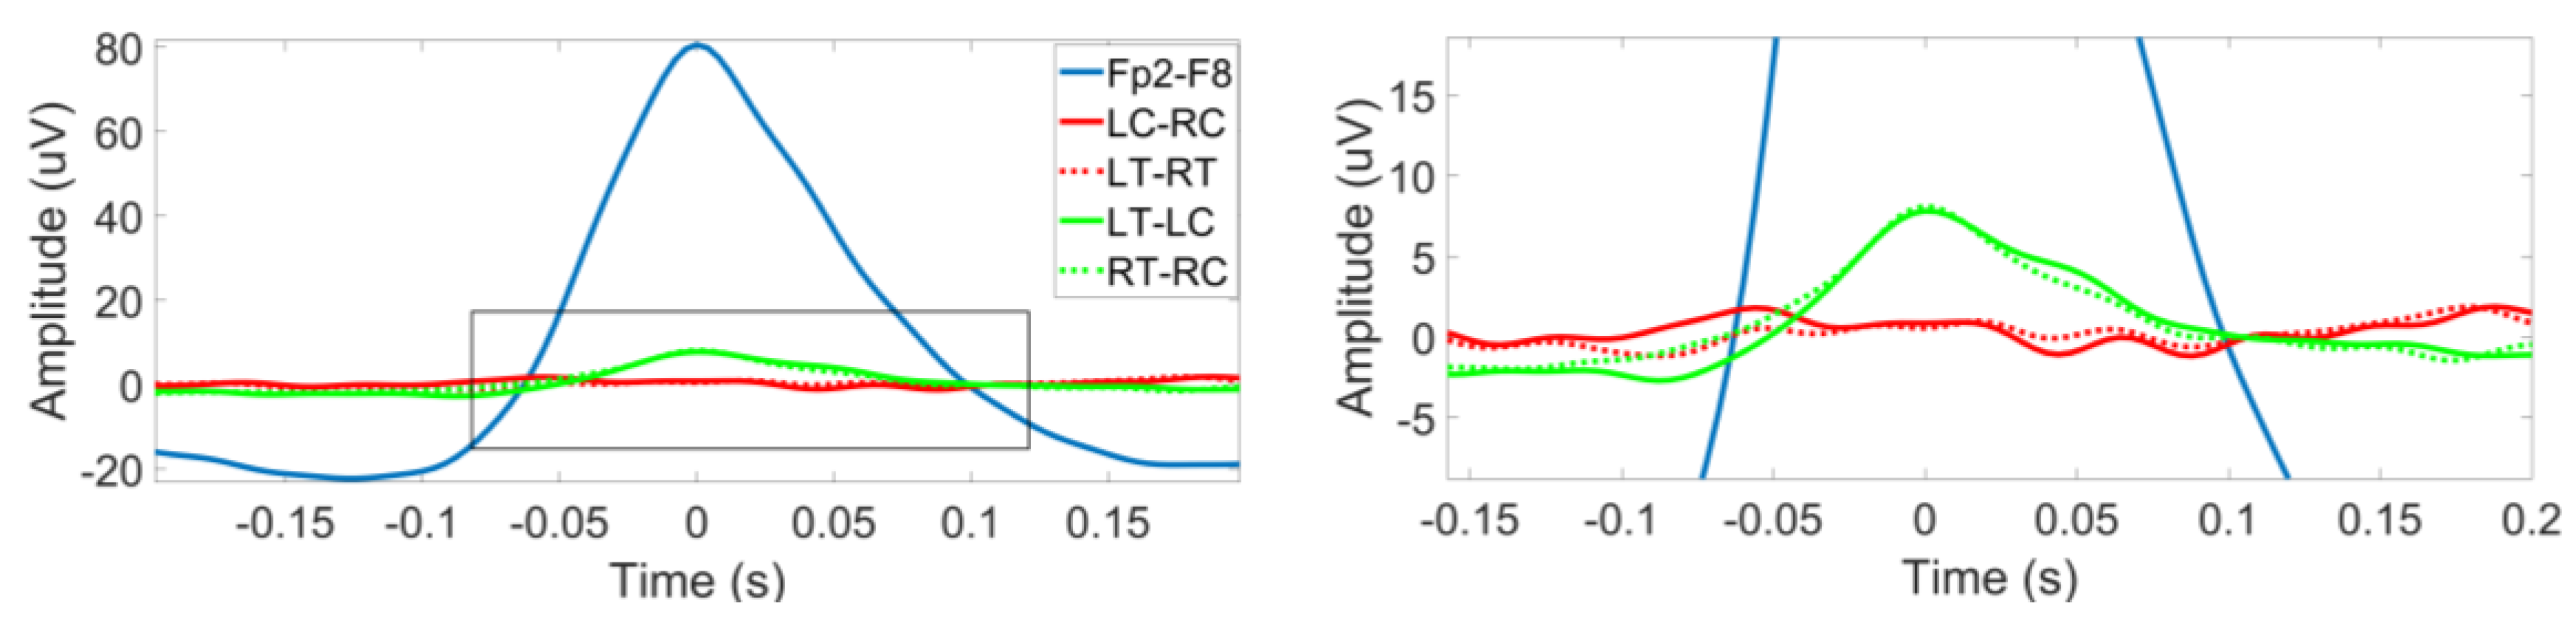
2.5. Comparison of Electrooculography (EOG) between Scalp EEG Channels and Behind-the-Ear EEG Channels
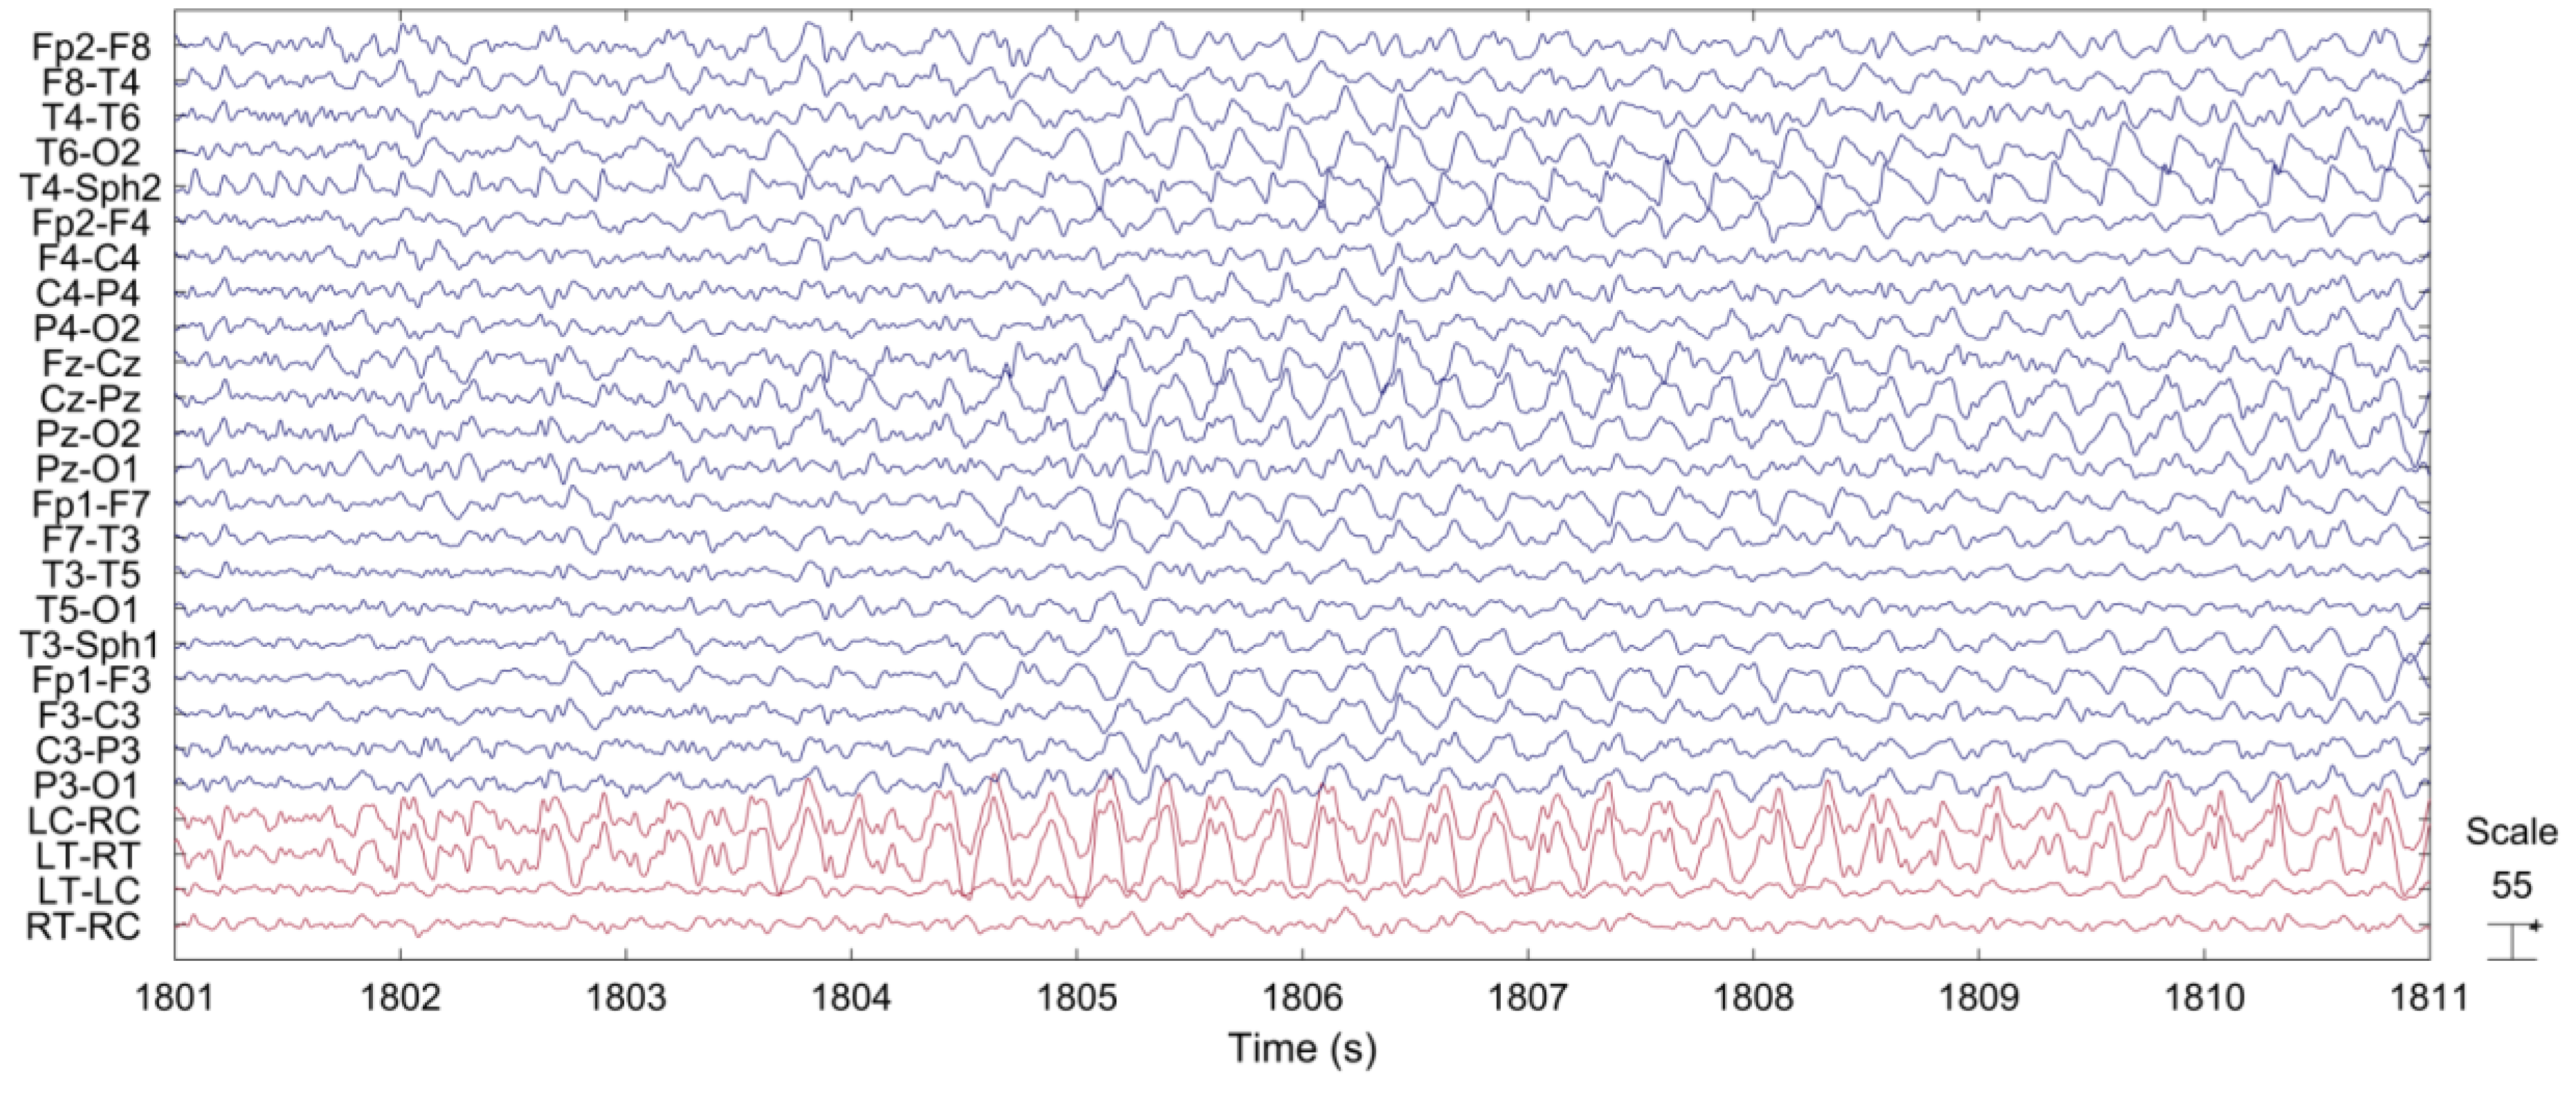
2.6. Comparison between Scalp EEG and Behind-the-Ear EEG during Seizure
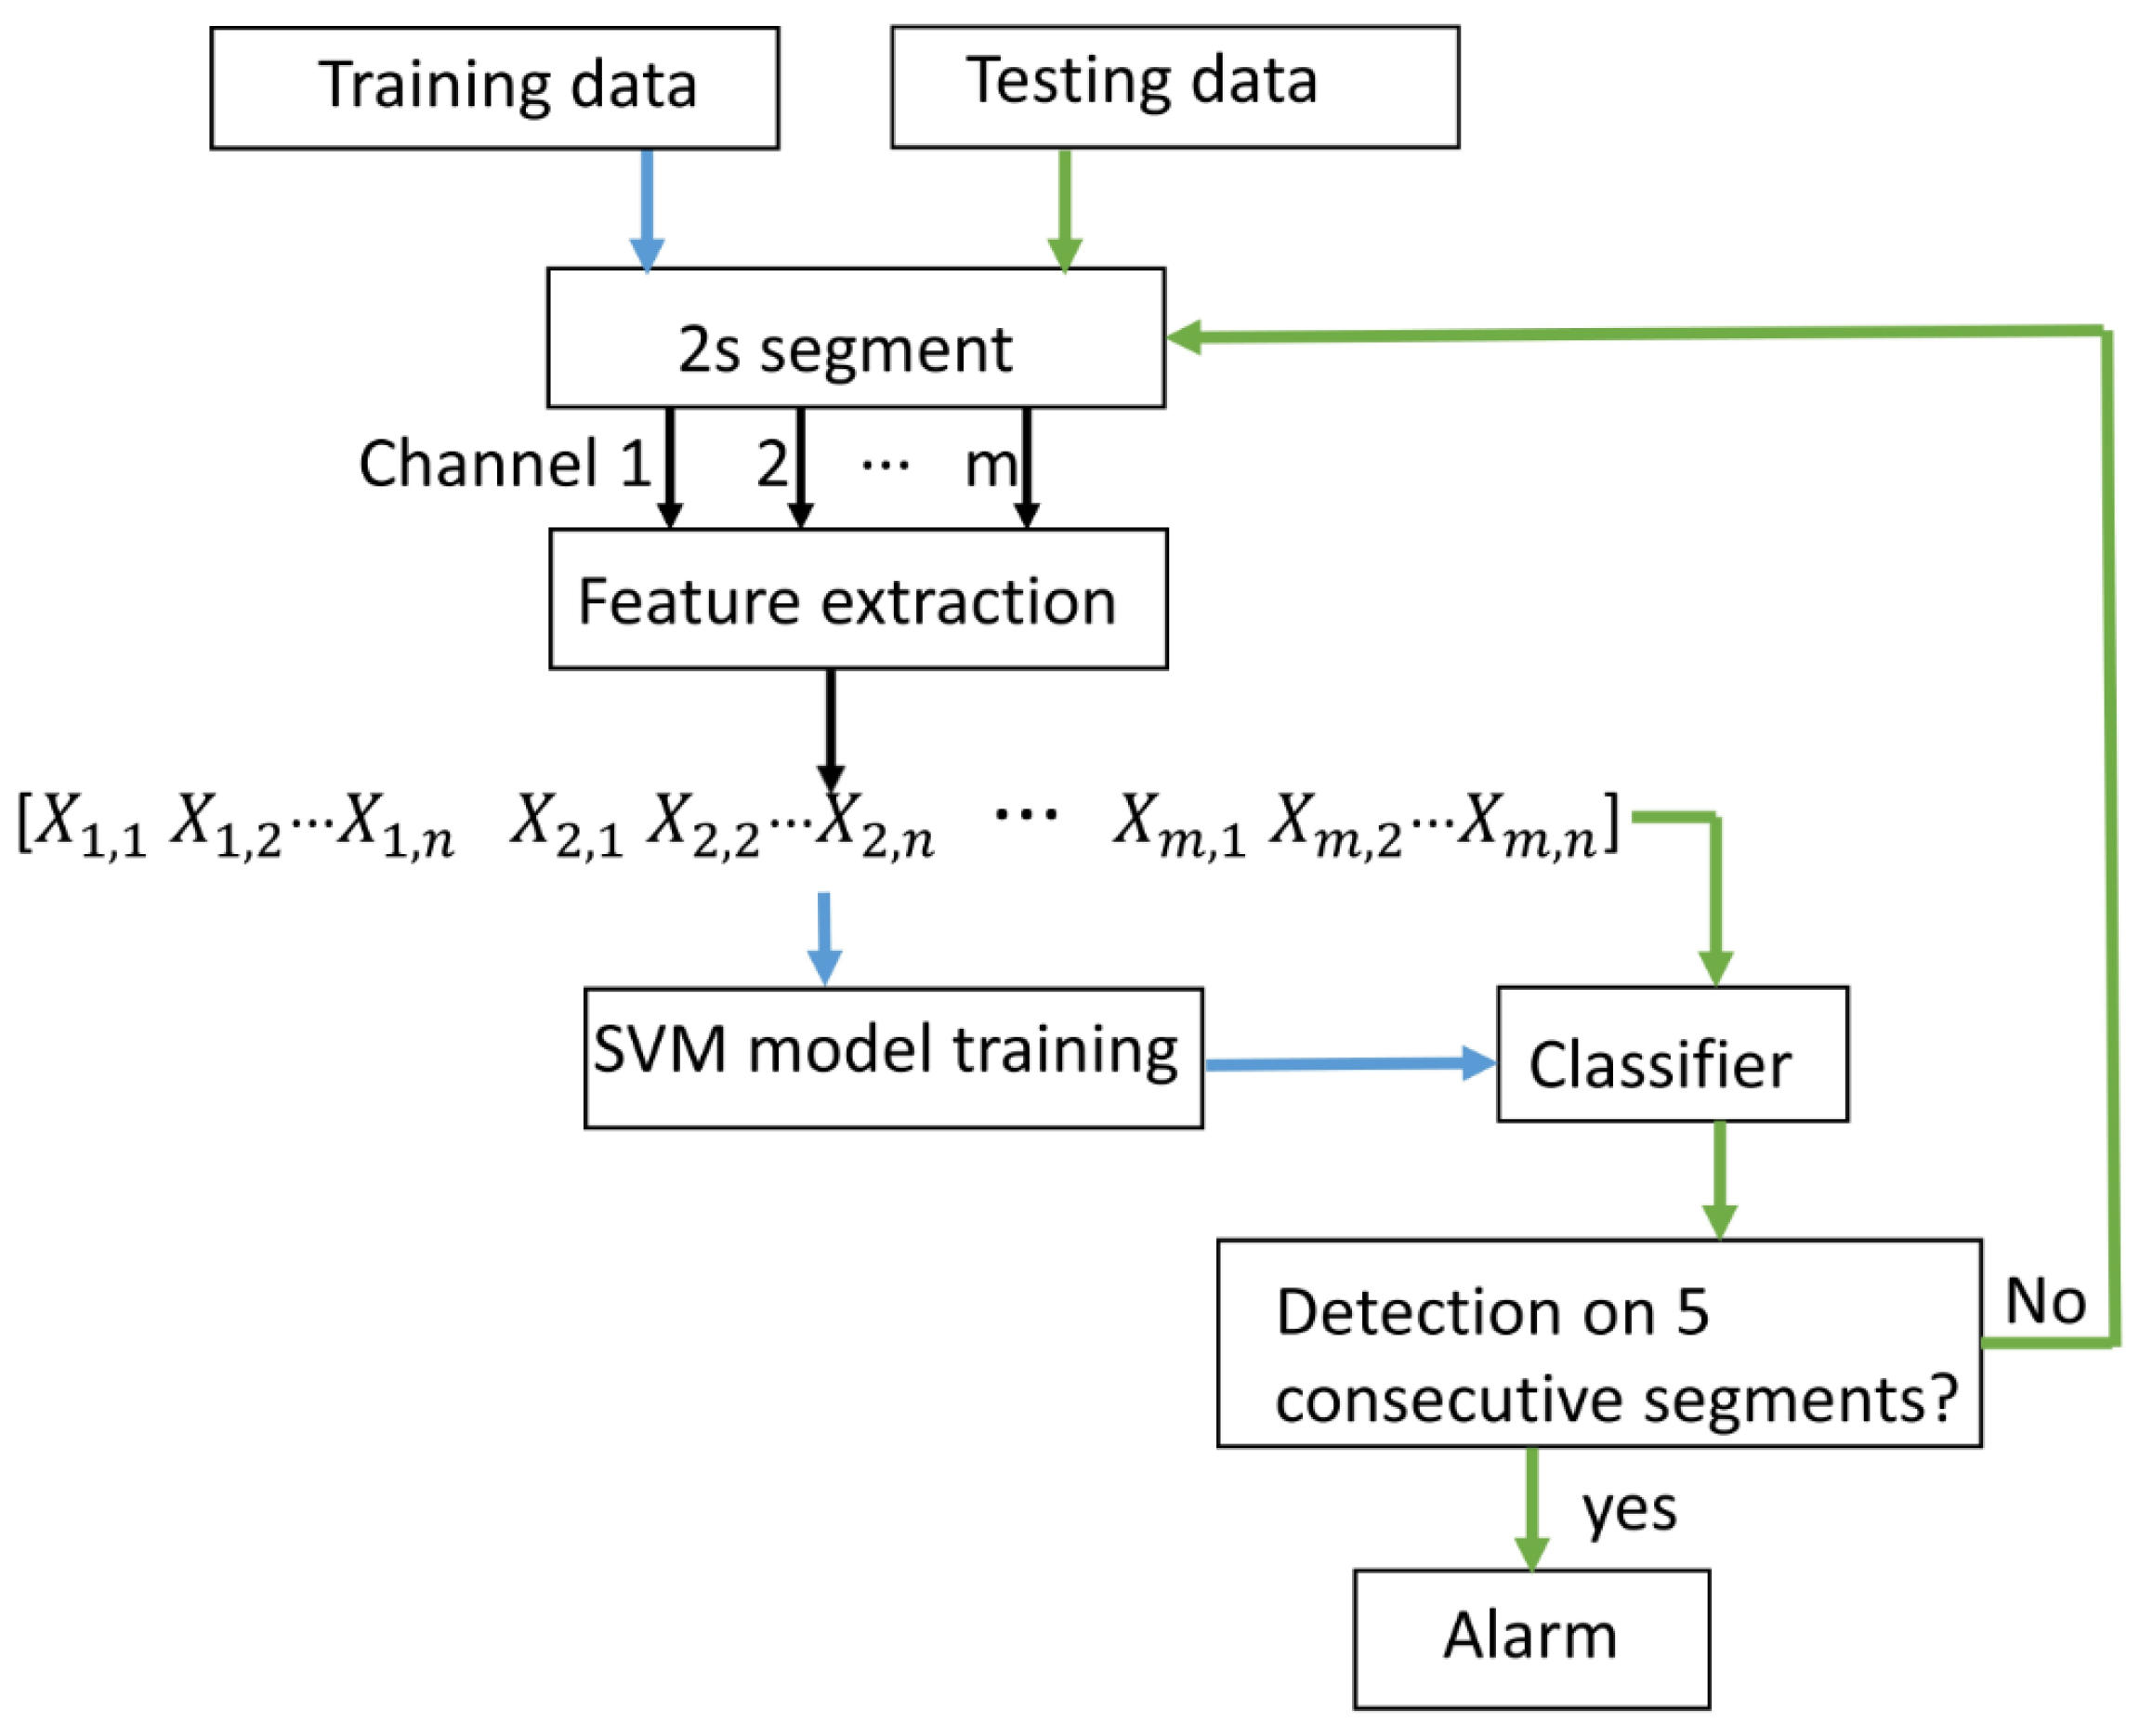
2.7. Seizure Detection
2.7.1. Feature Extraction
2.7.2. SVM Classification
2.8. Comparison of Seizure Detection between Cross-Head Channels and Unilateral Channels
3. Results
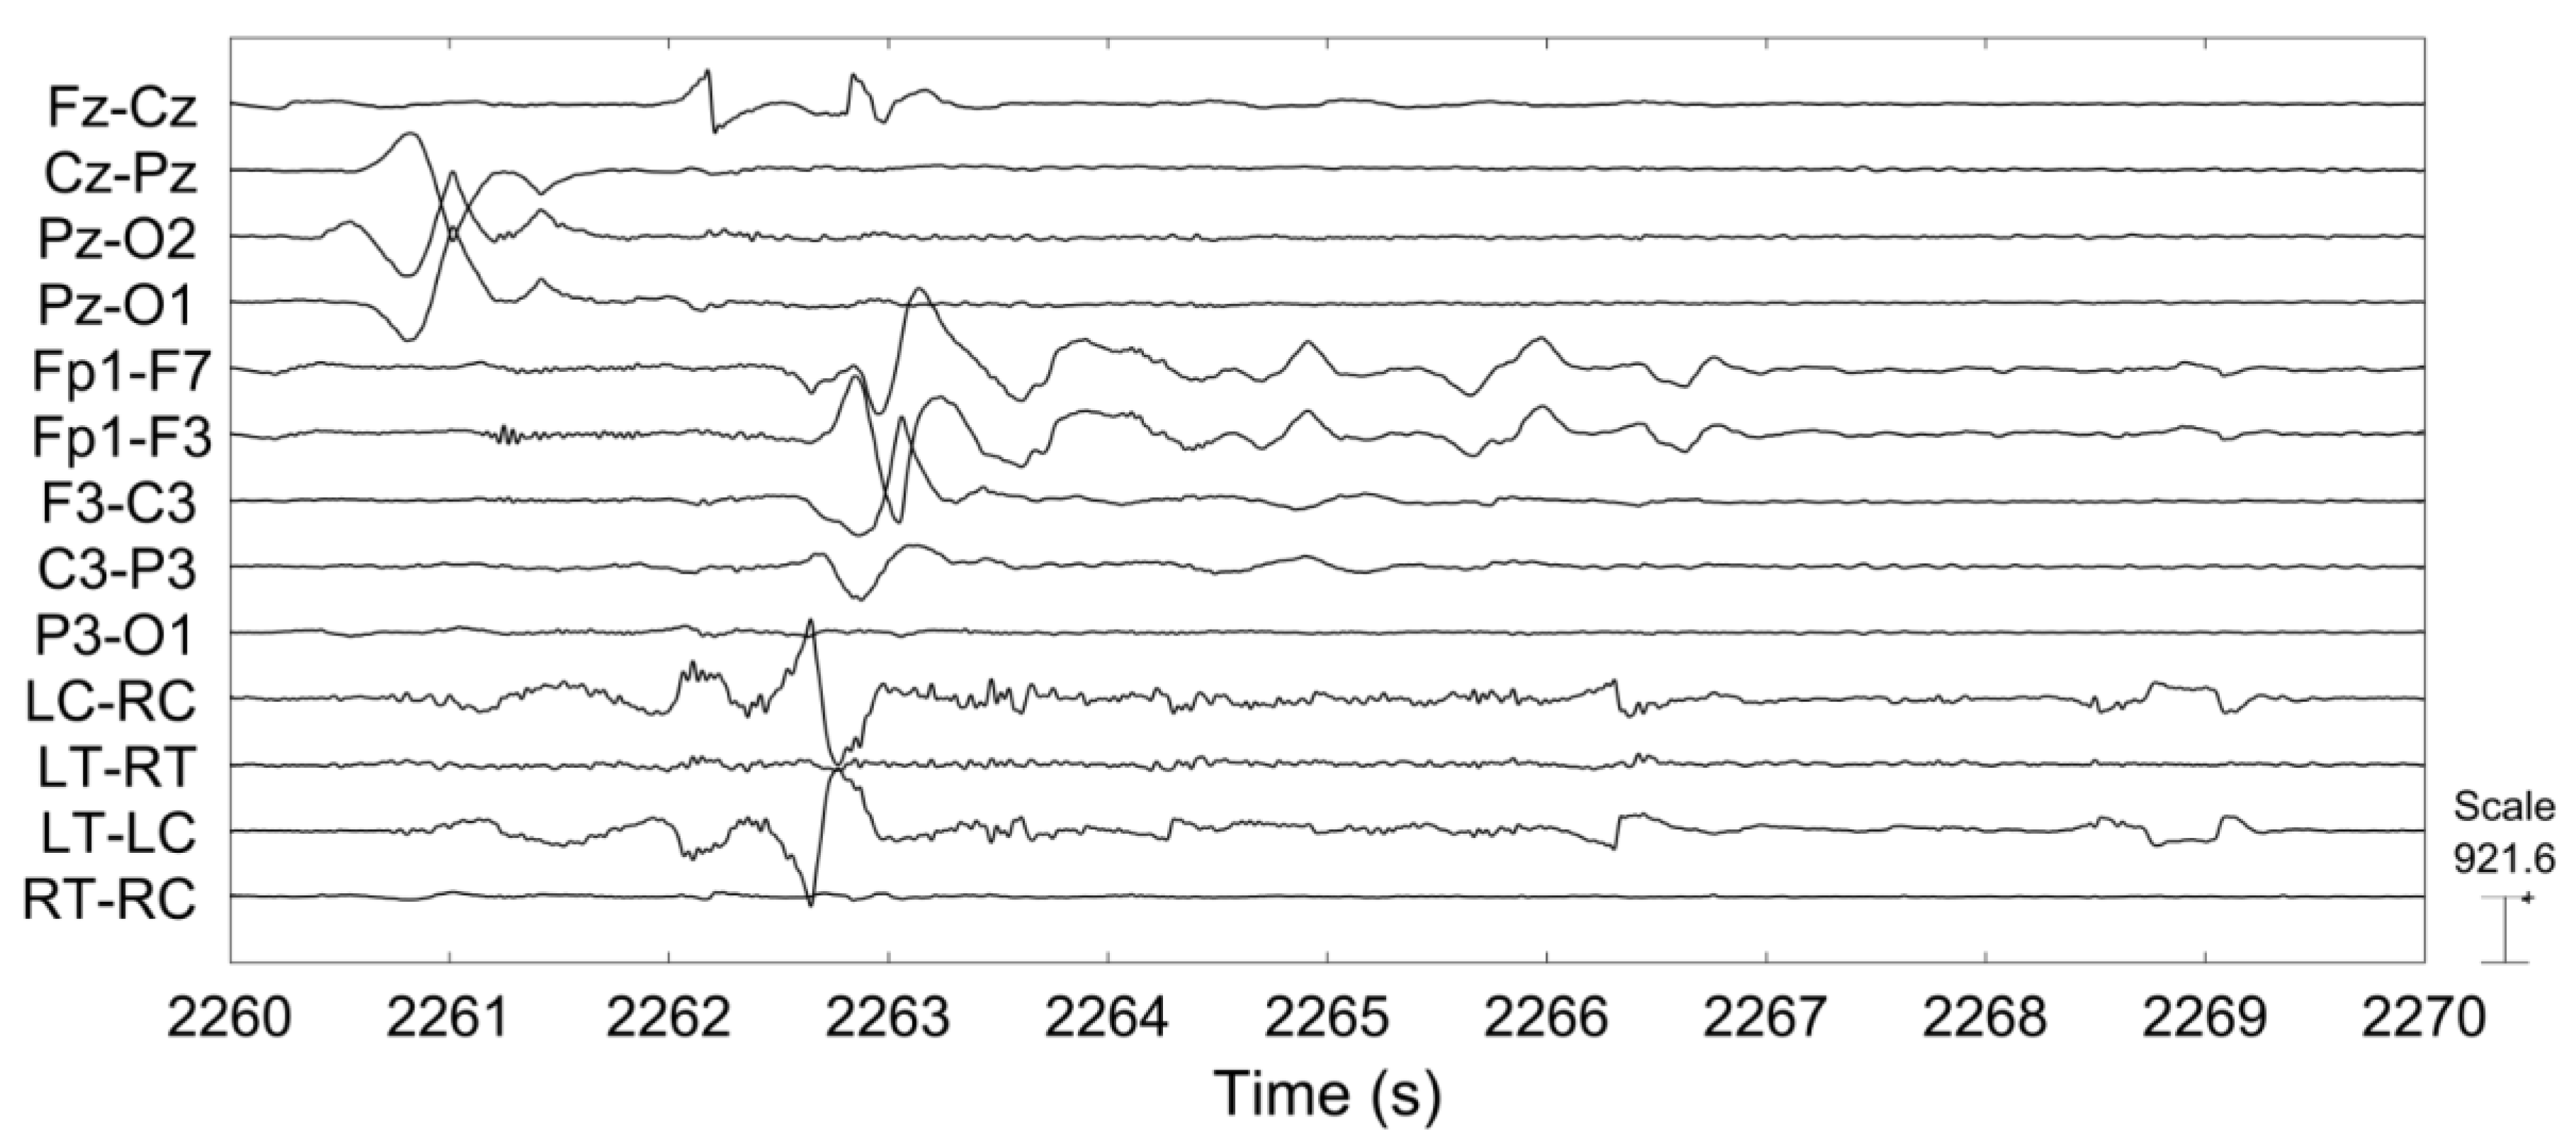
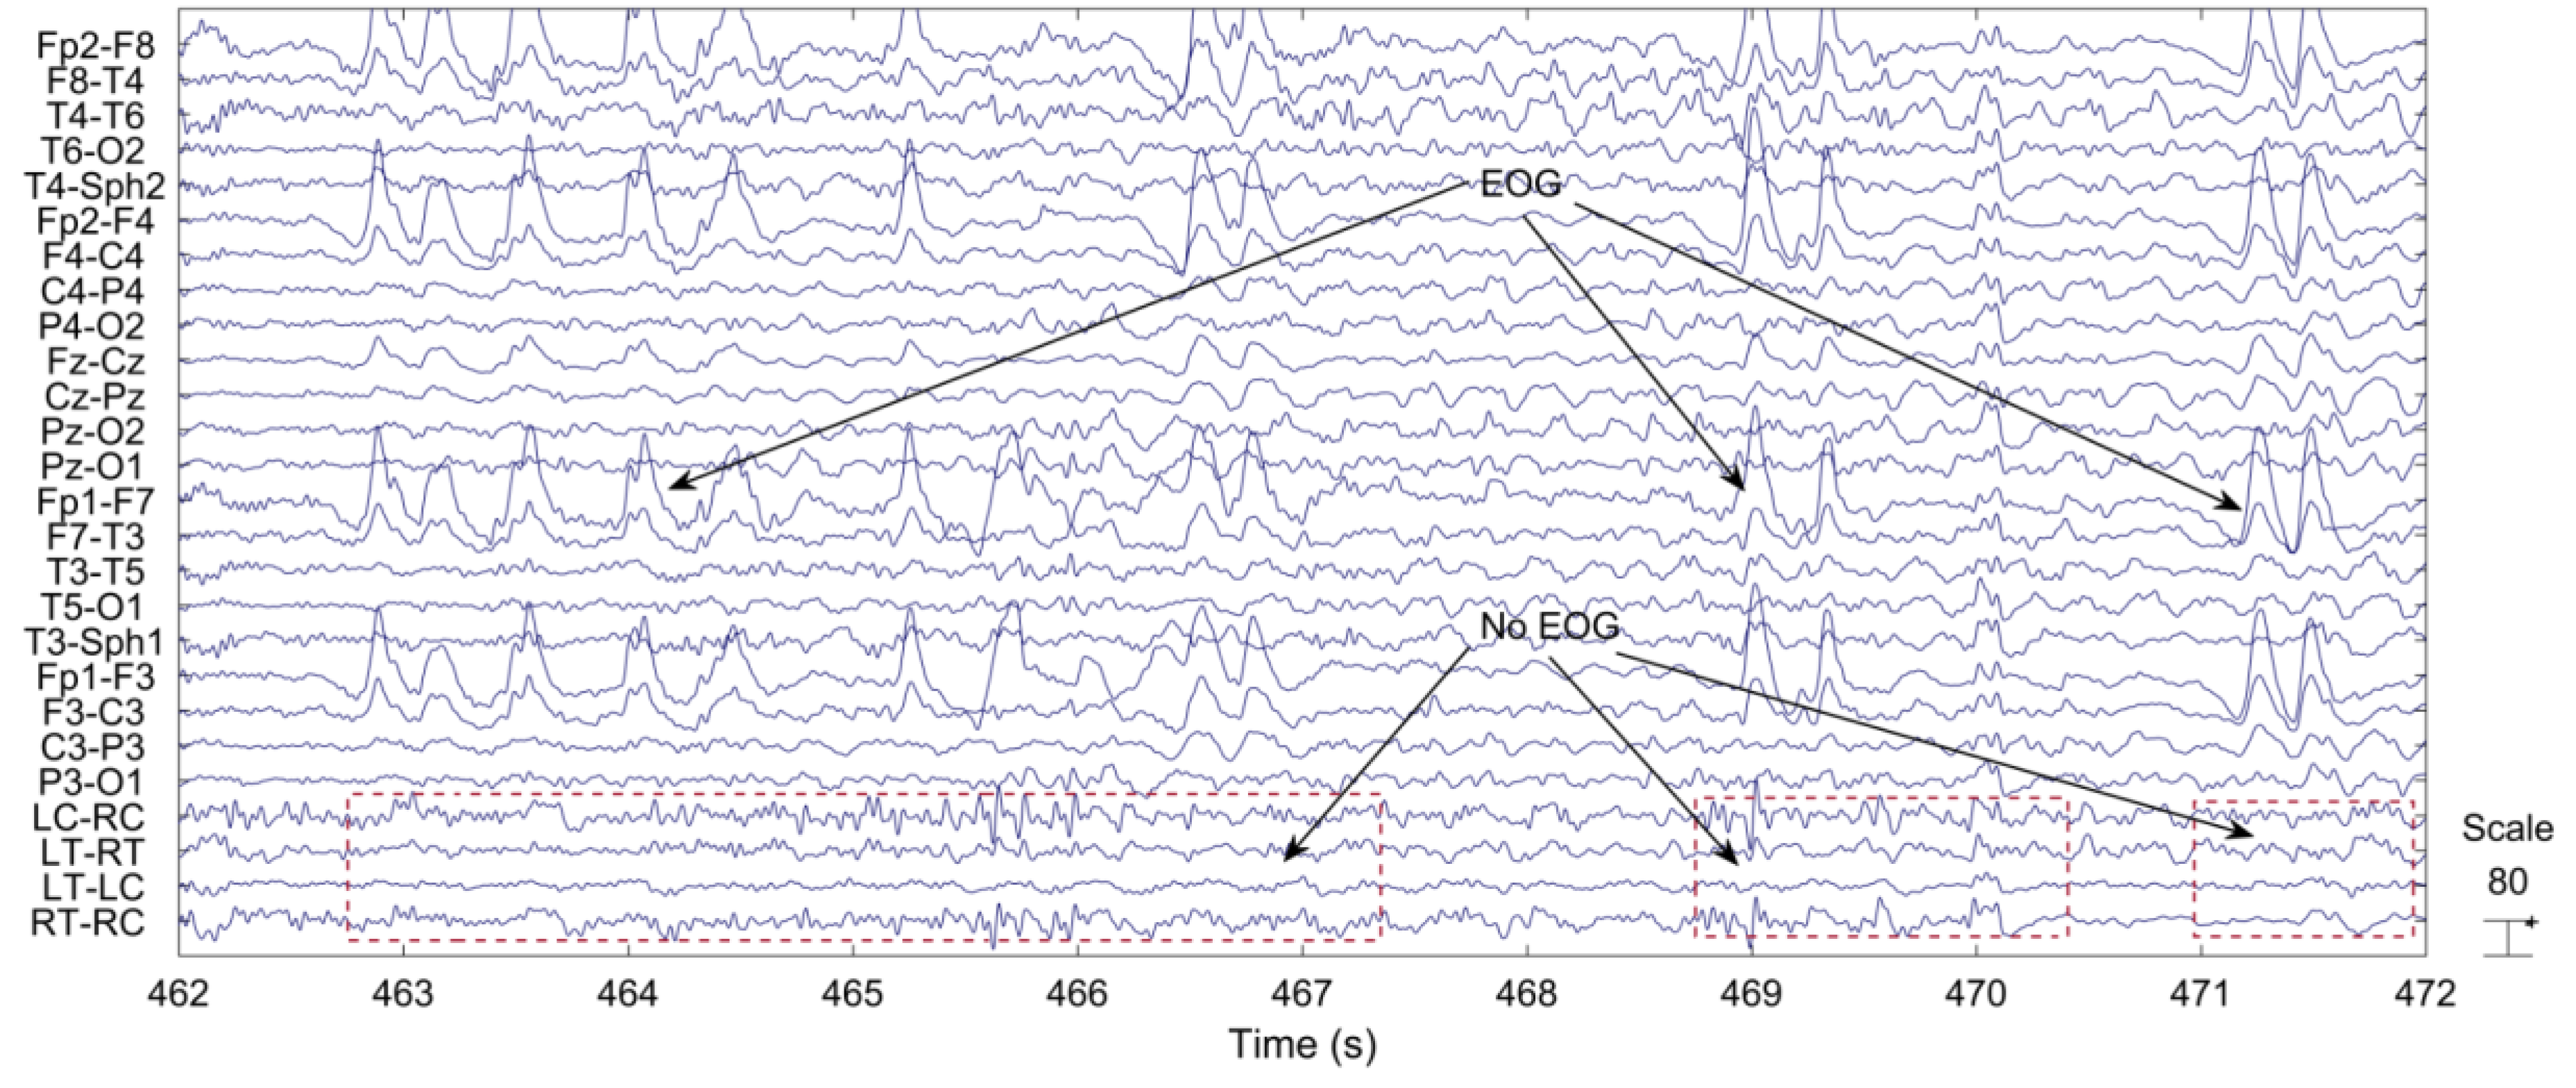
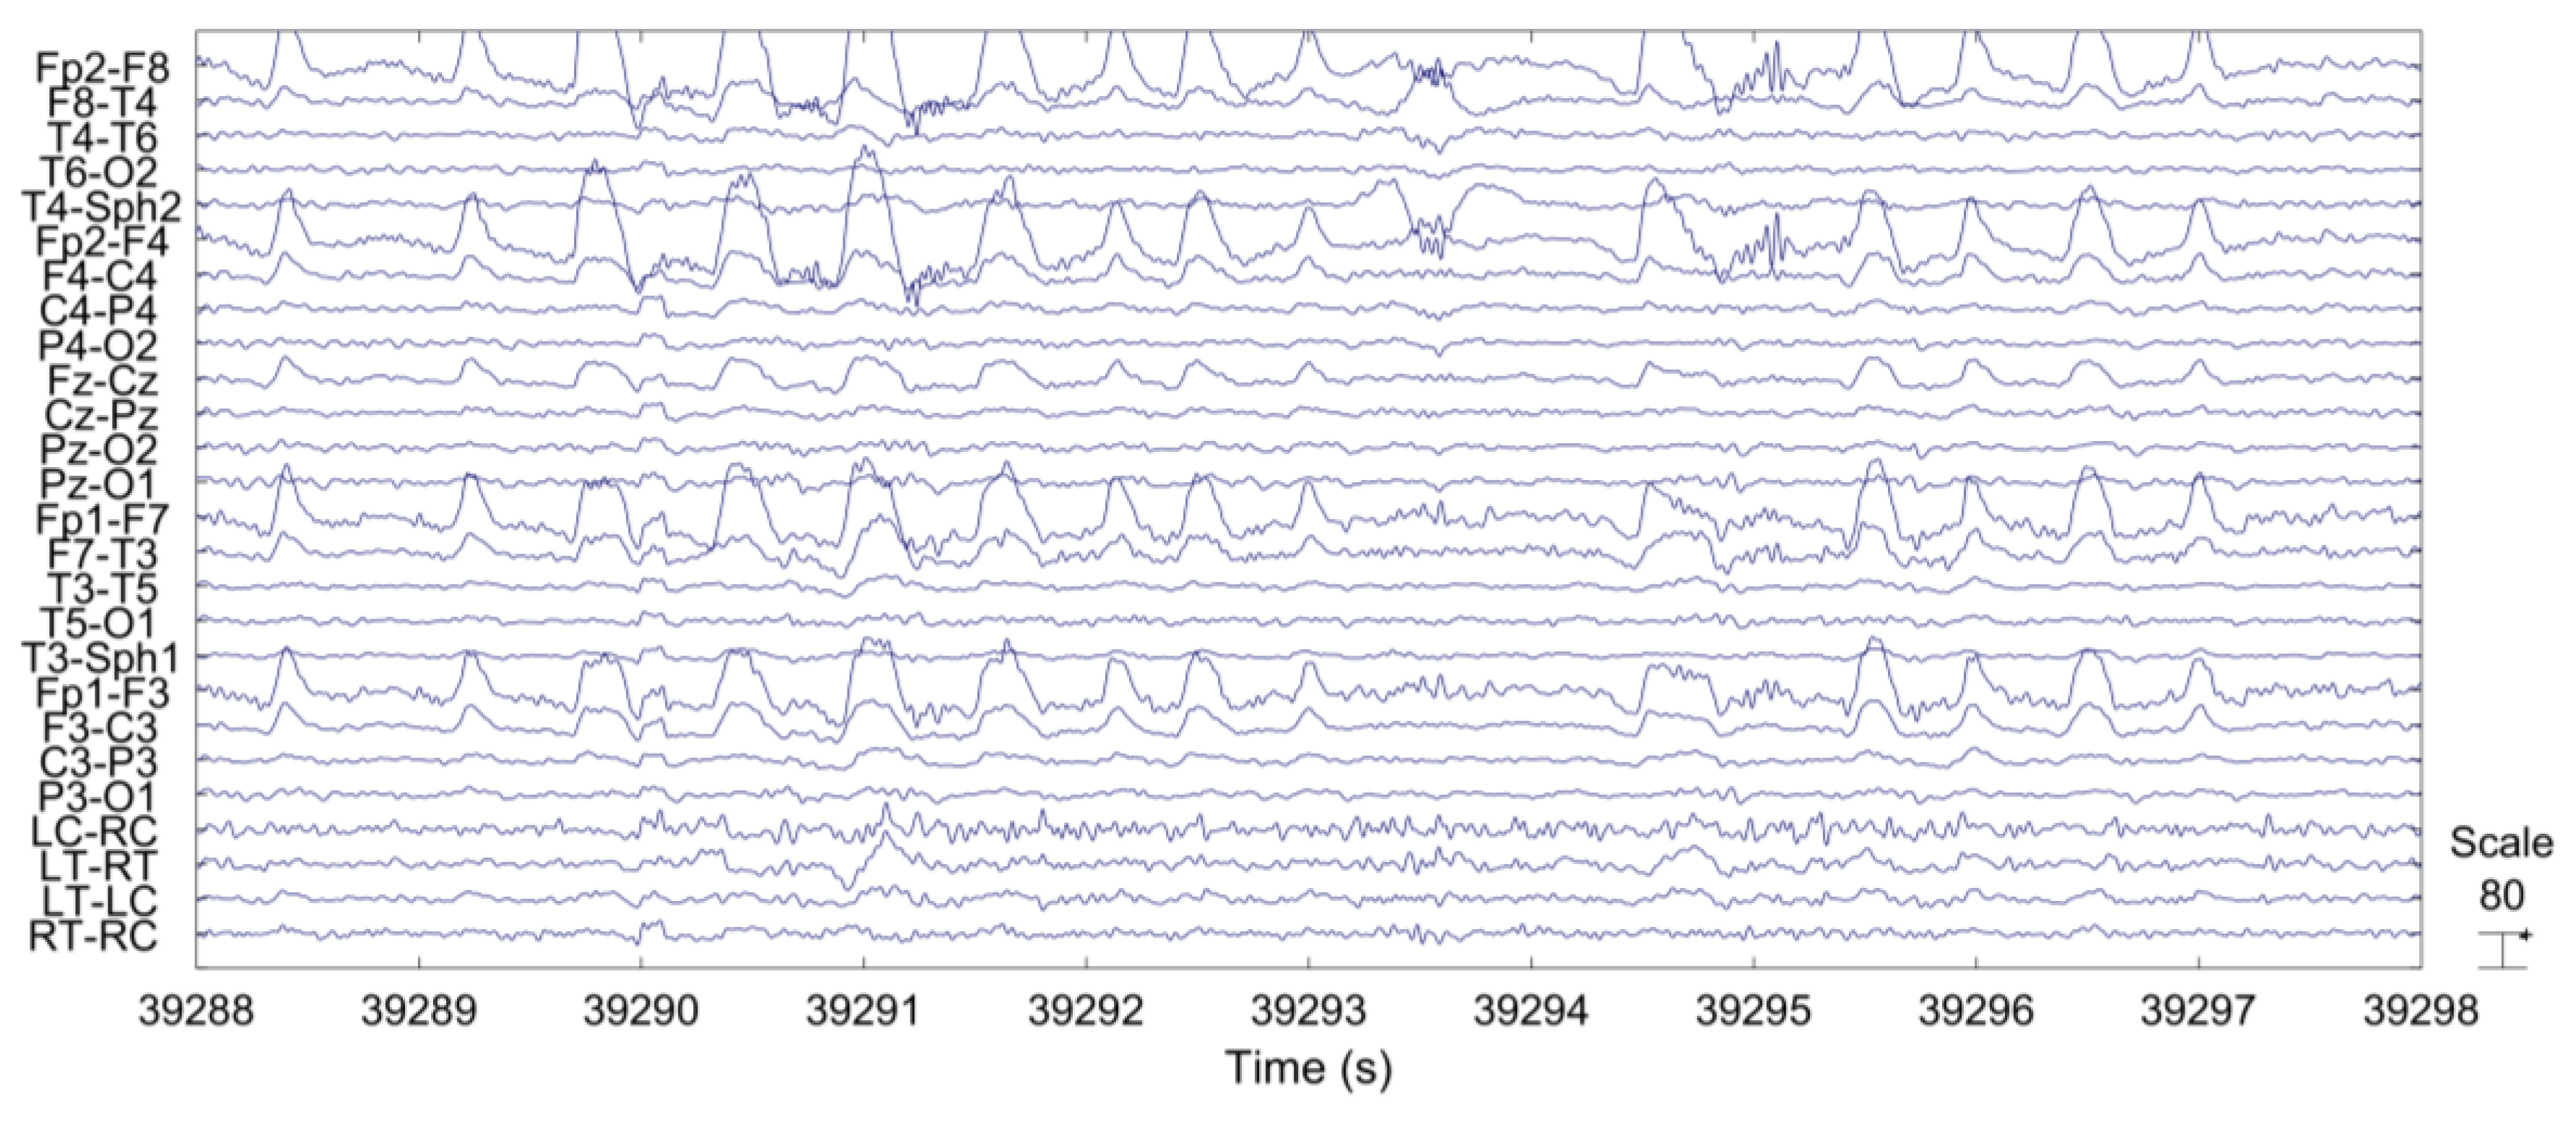
3.1. Artifacts
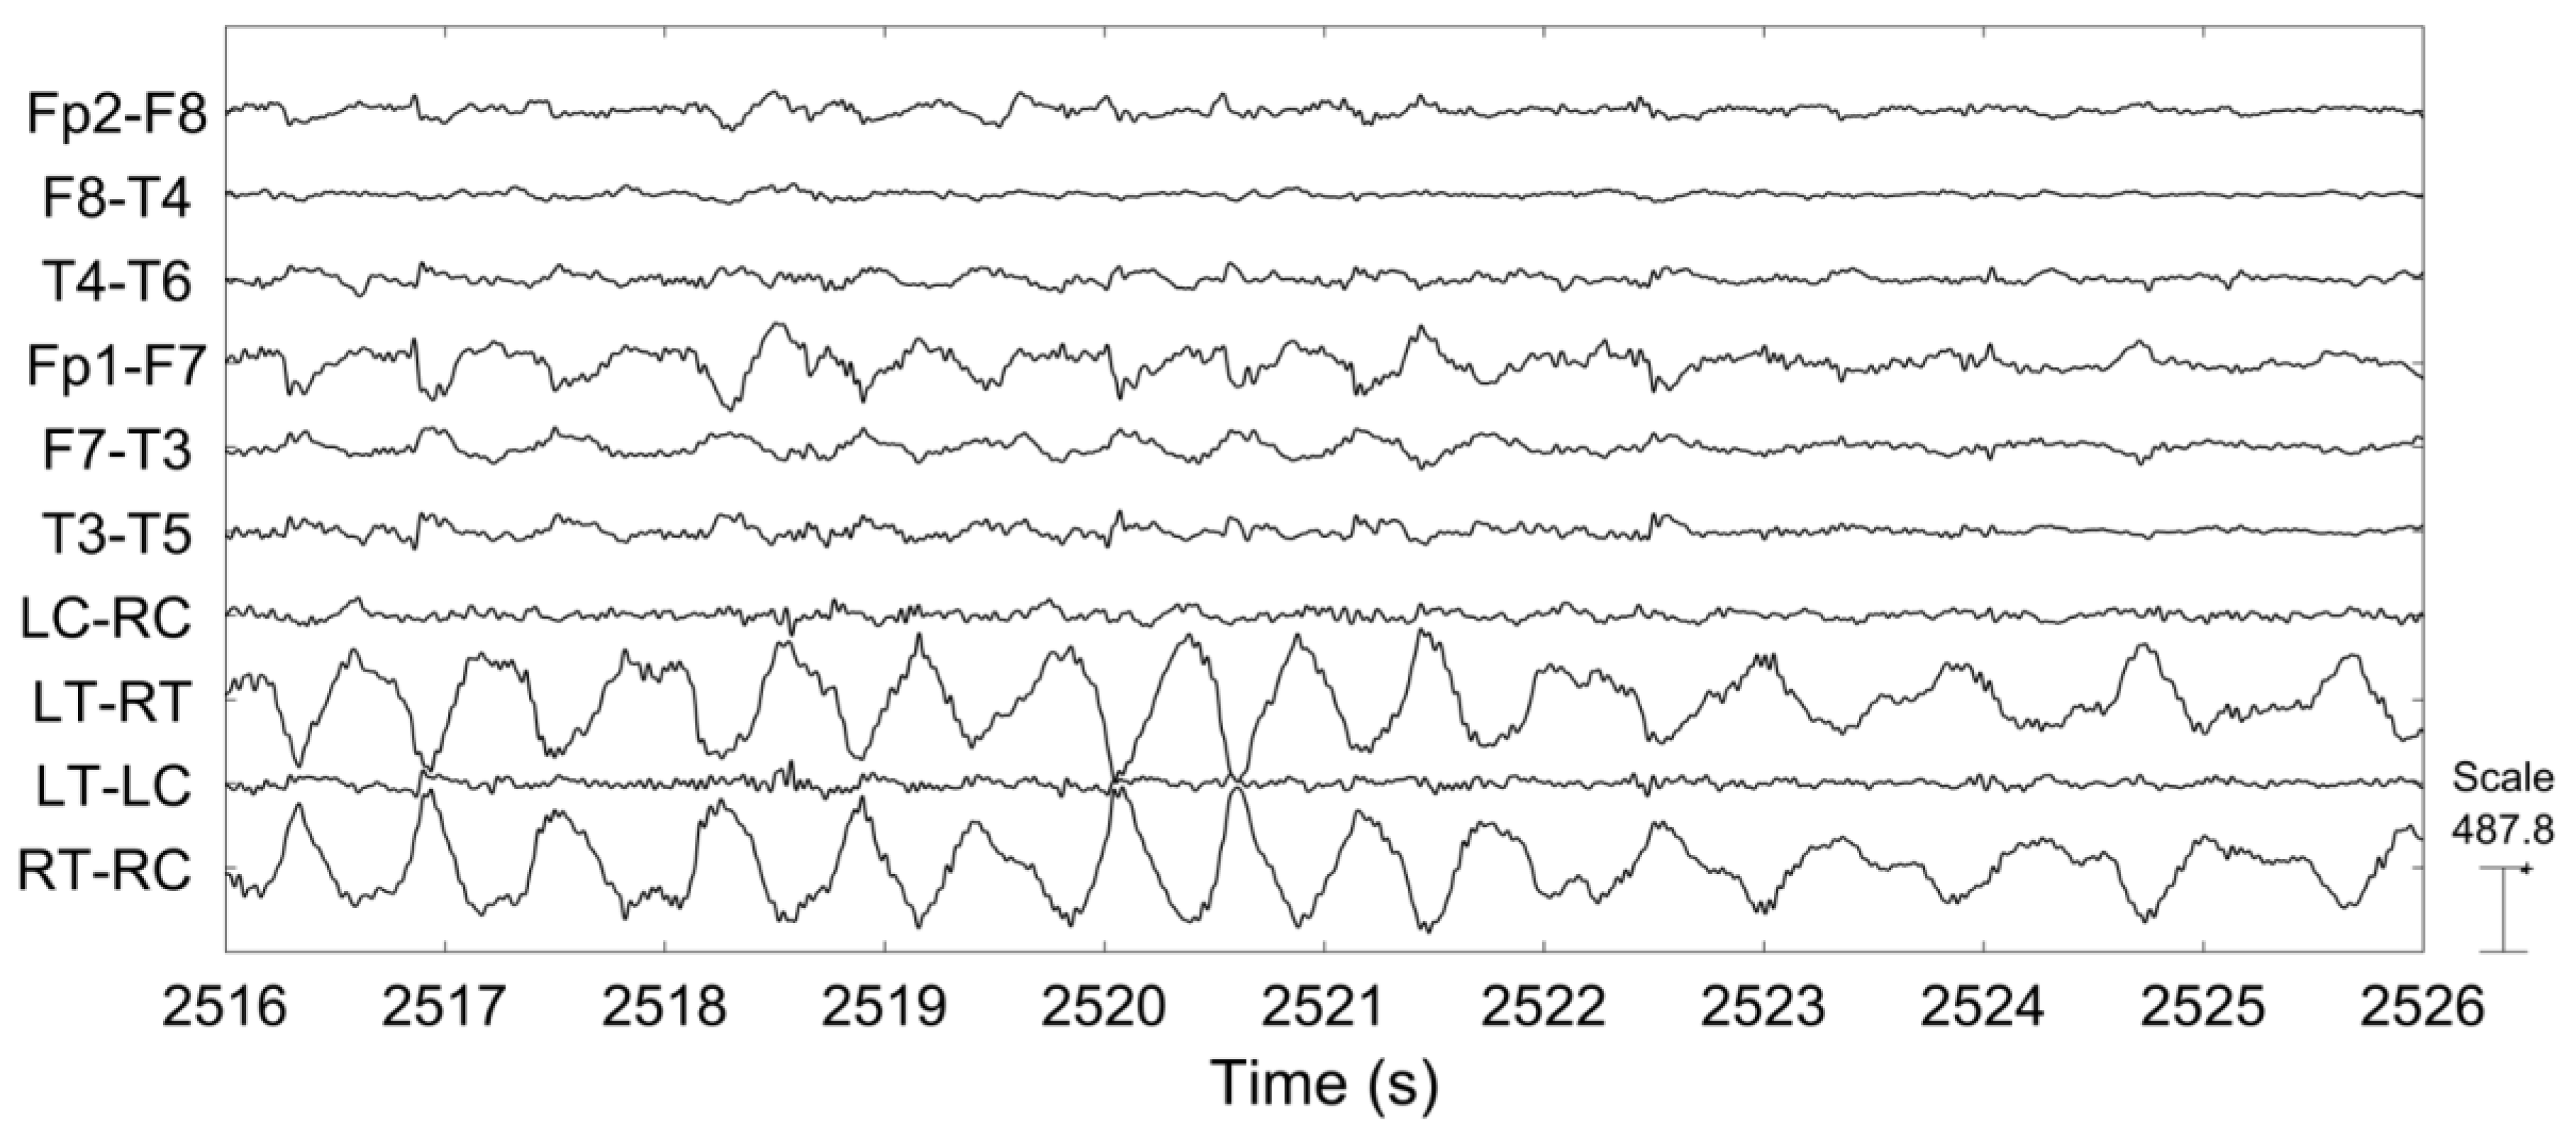
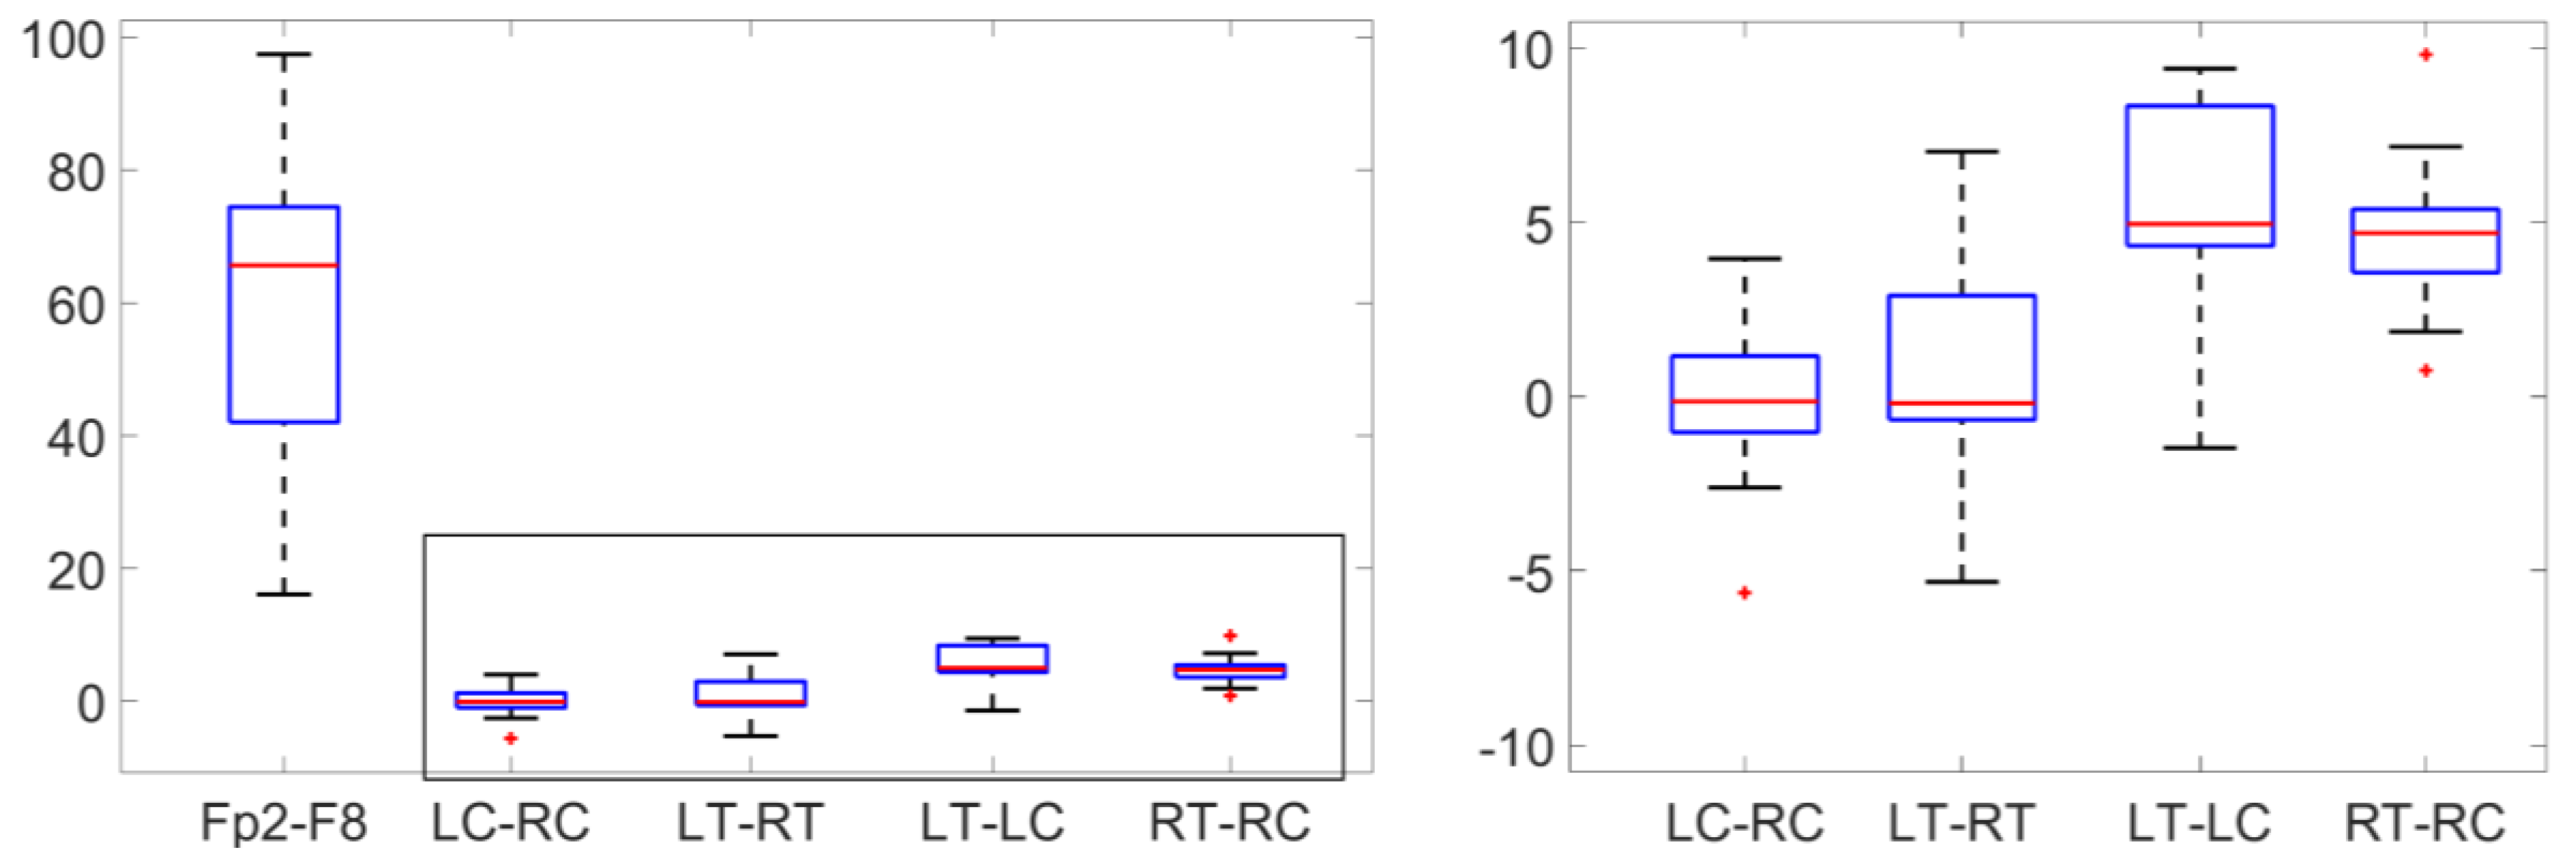
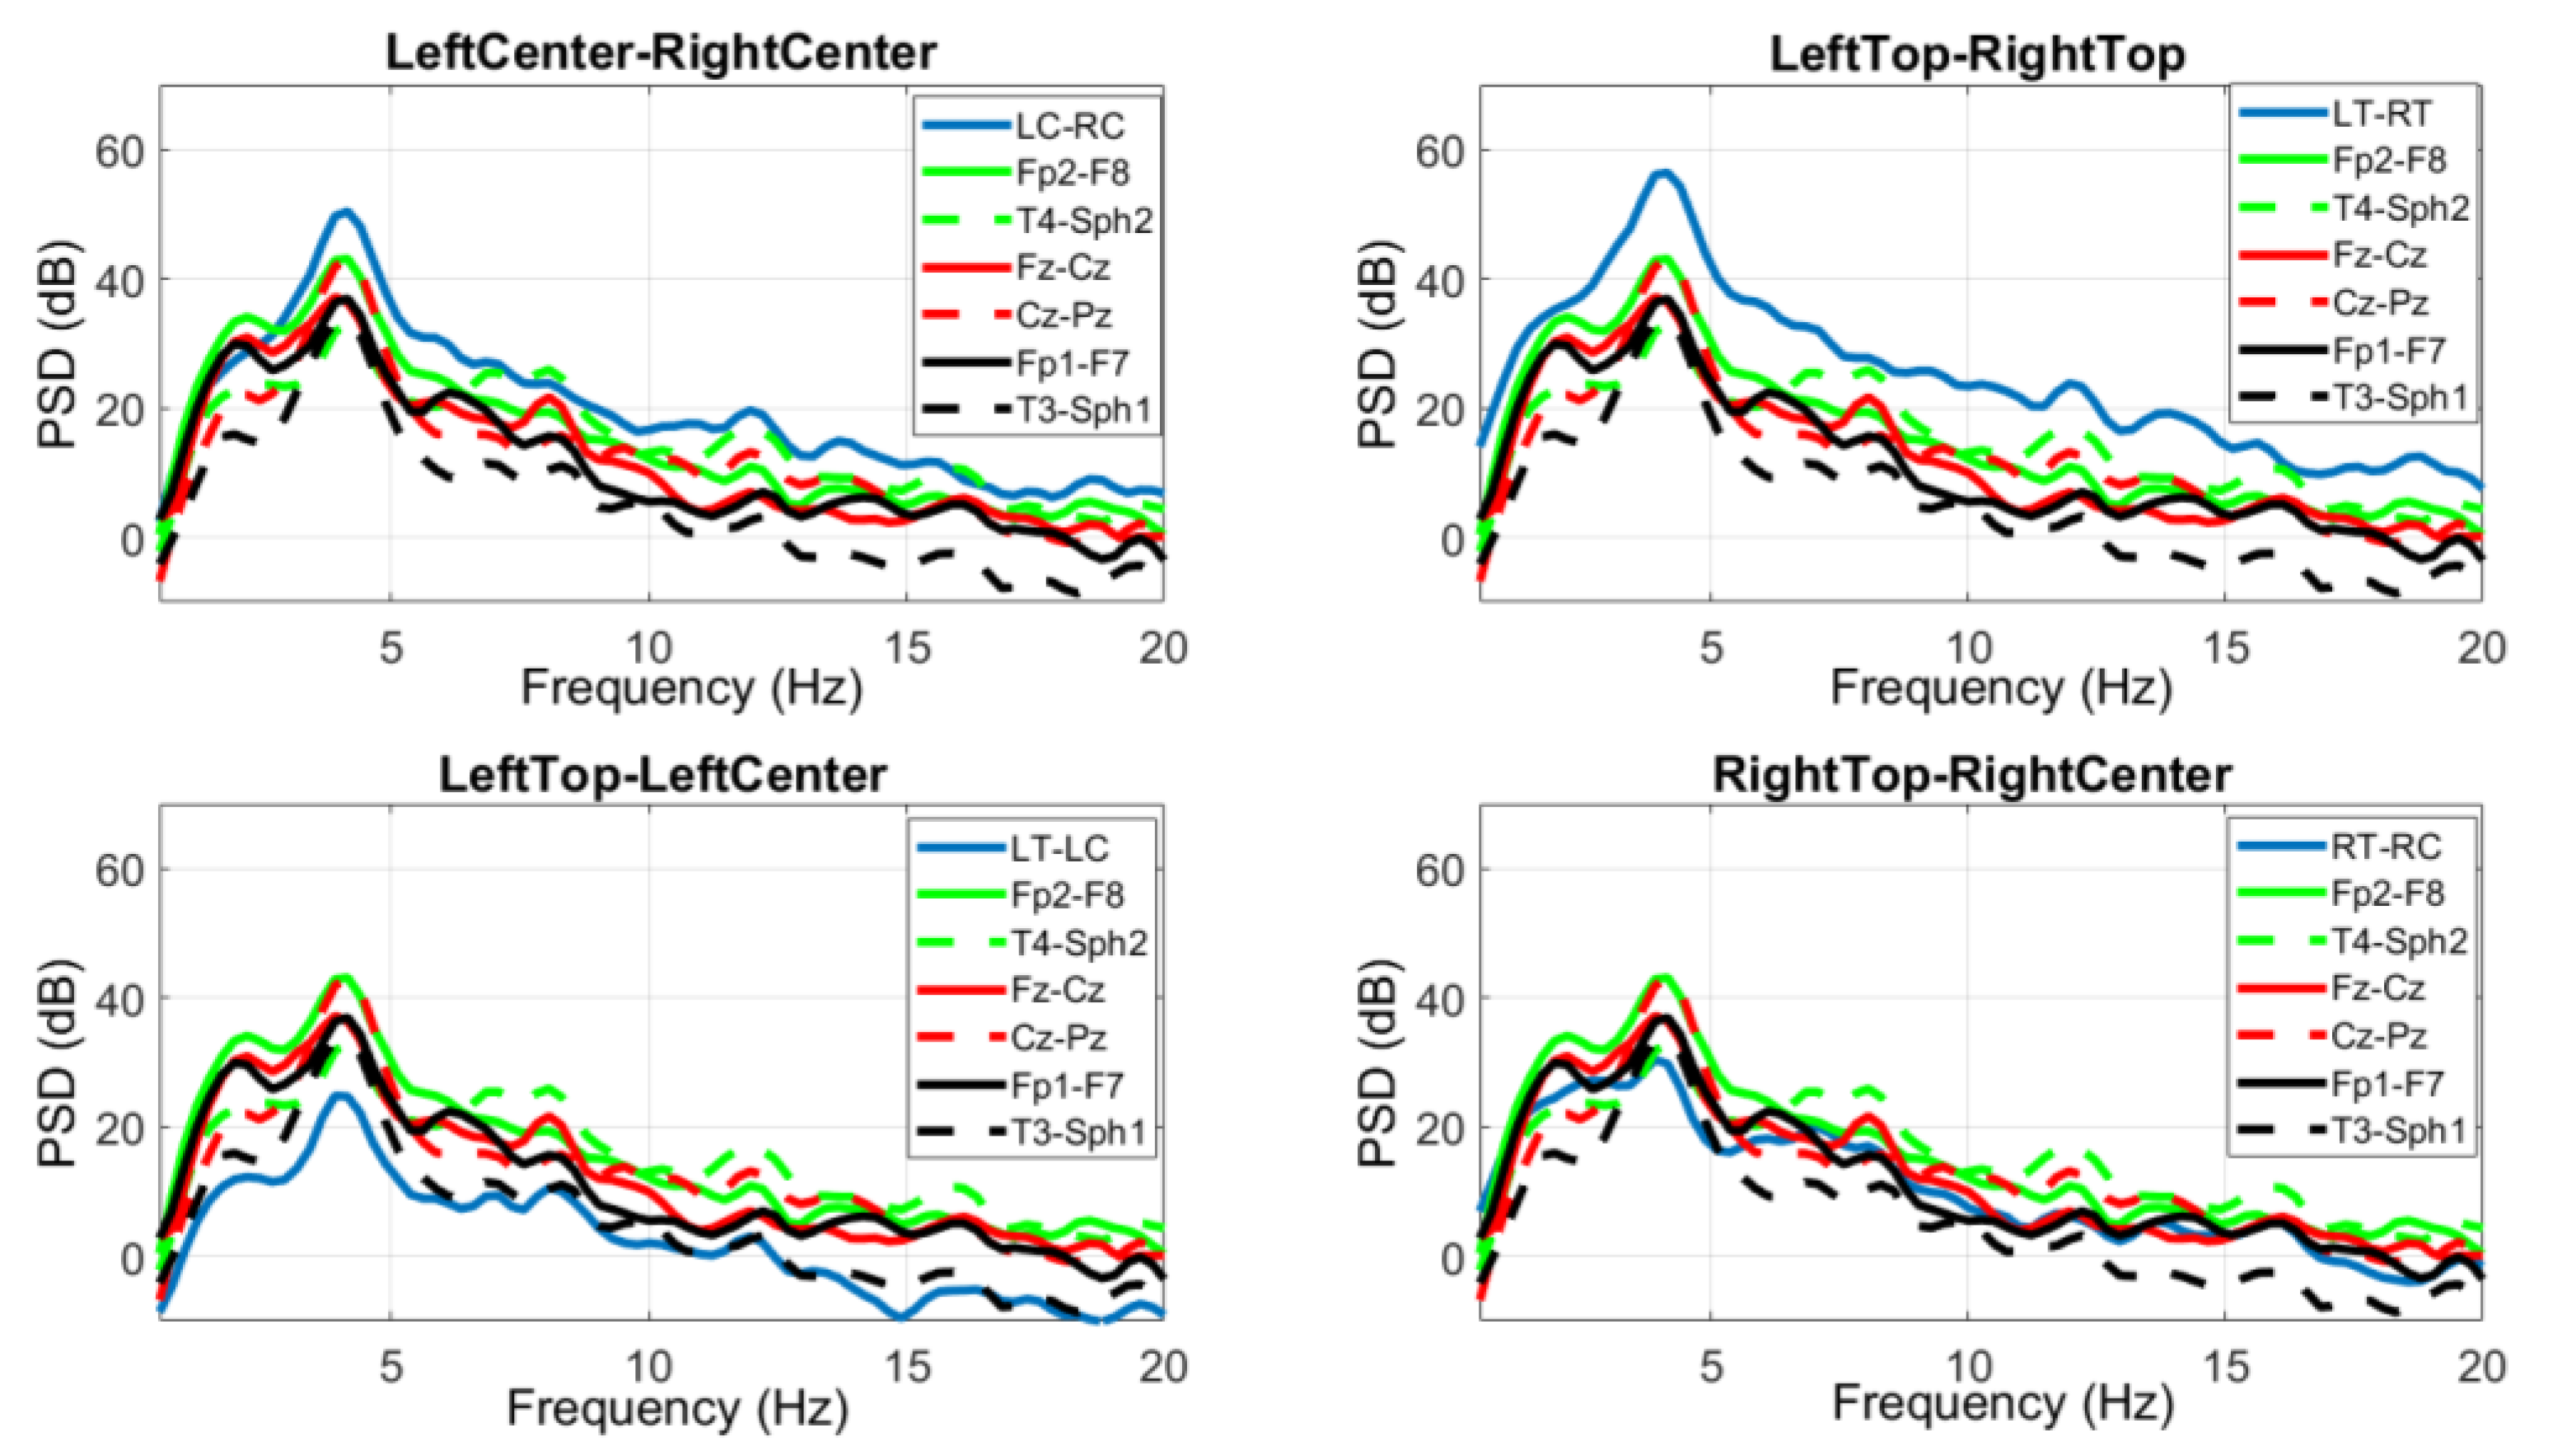
3.2. Comparison of Scalp EEG and Behind-the-Ear EEG during Seizure
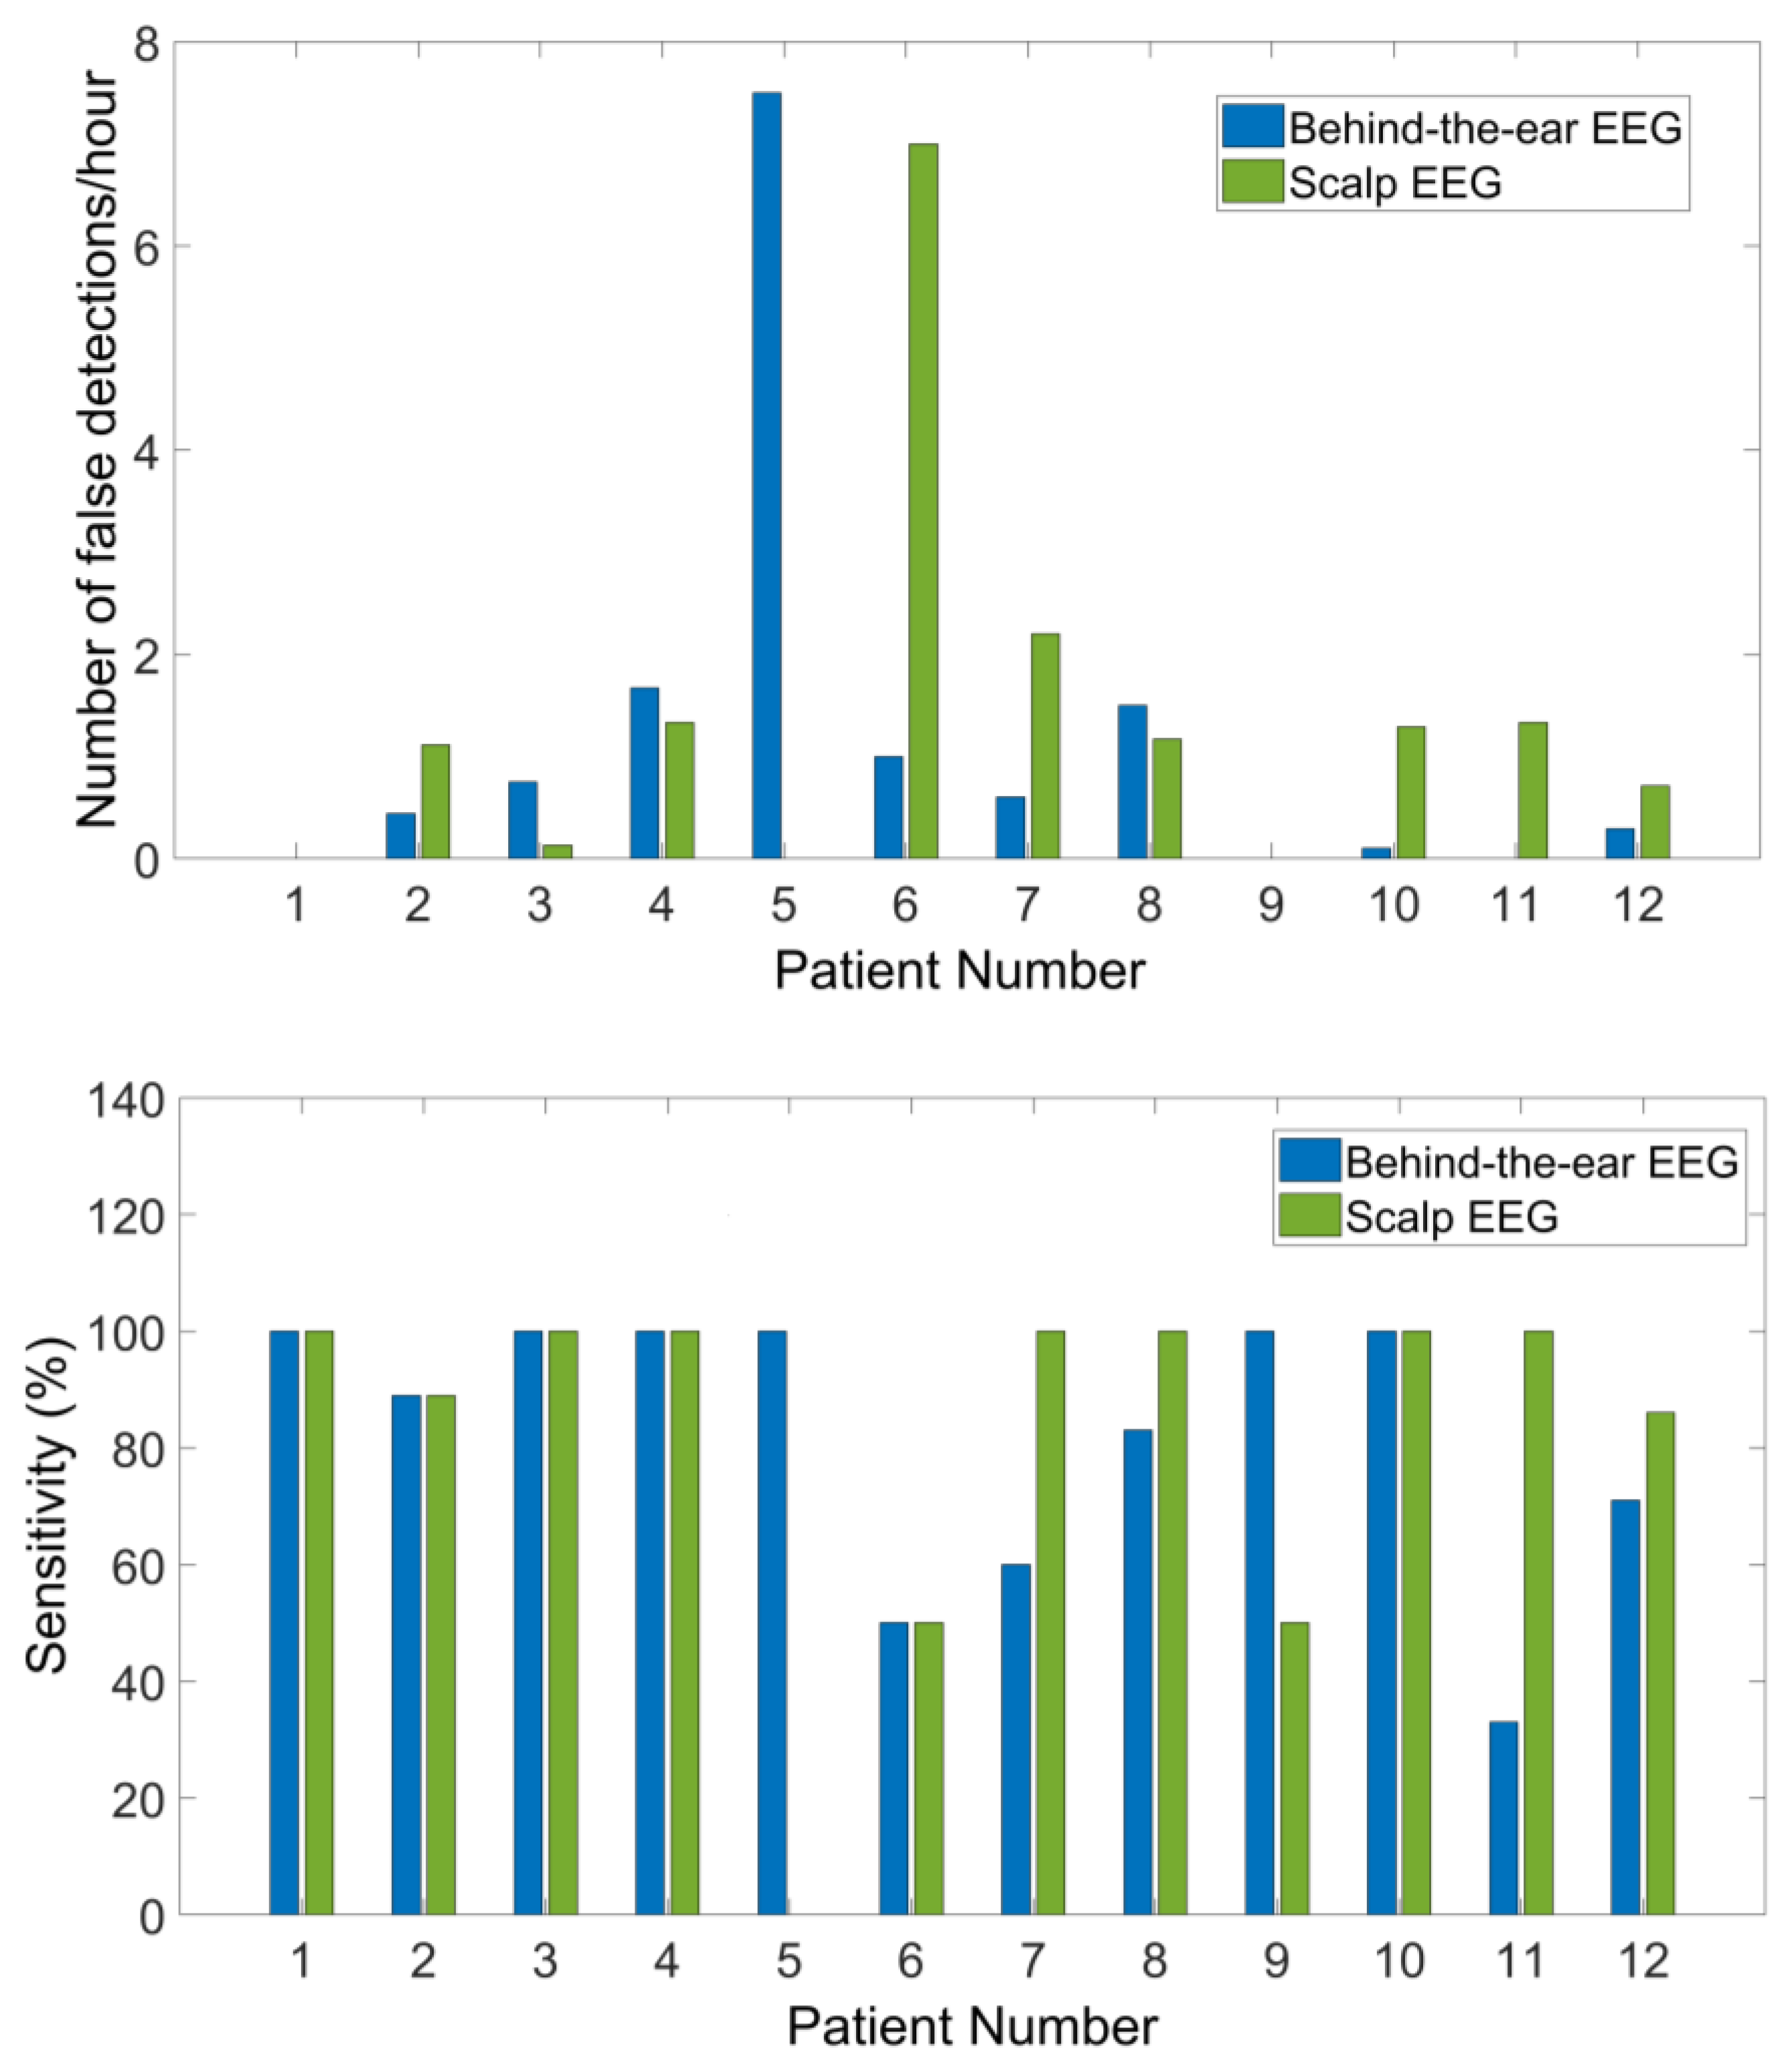
3.3. Seizure Detection
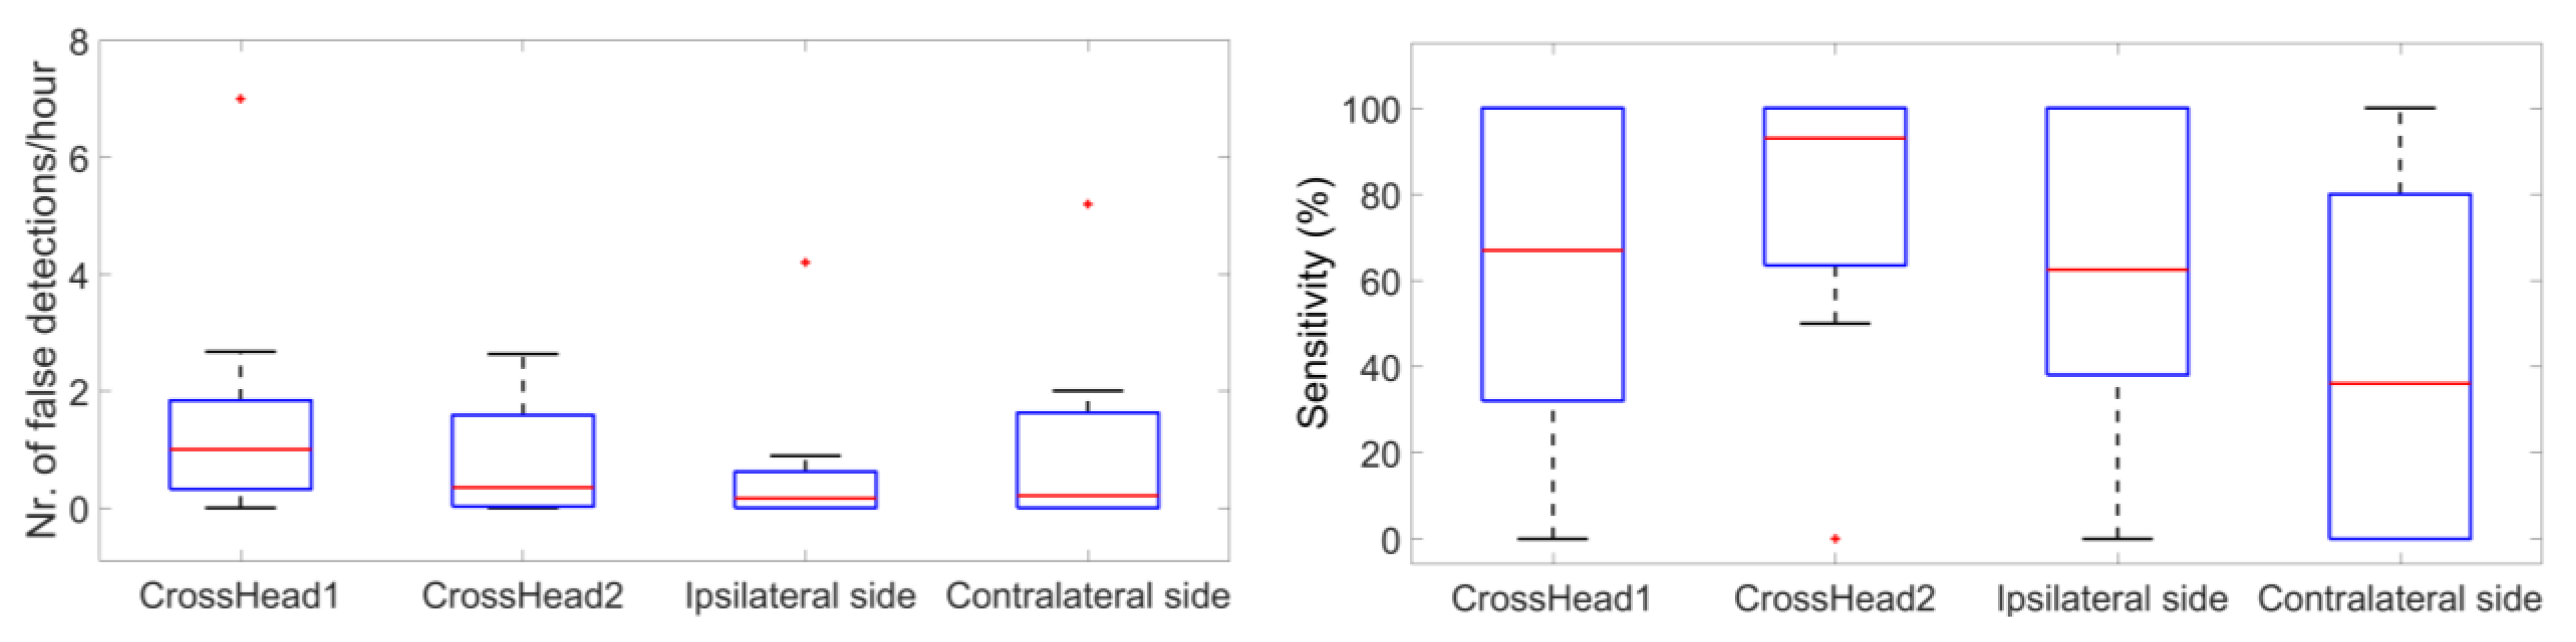
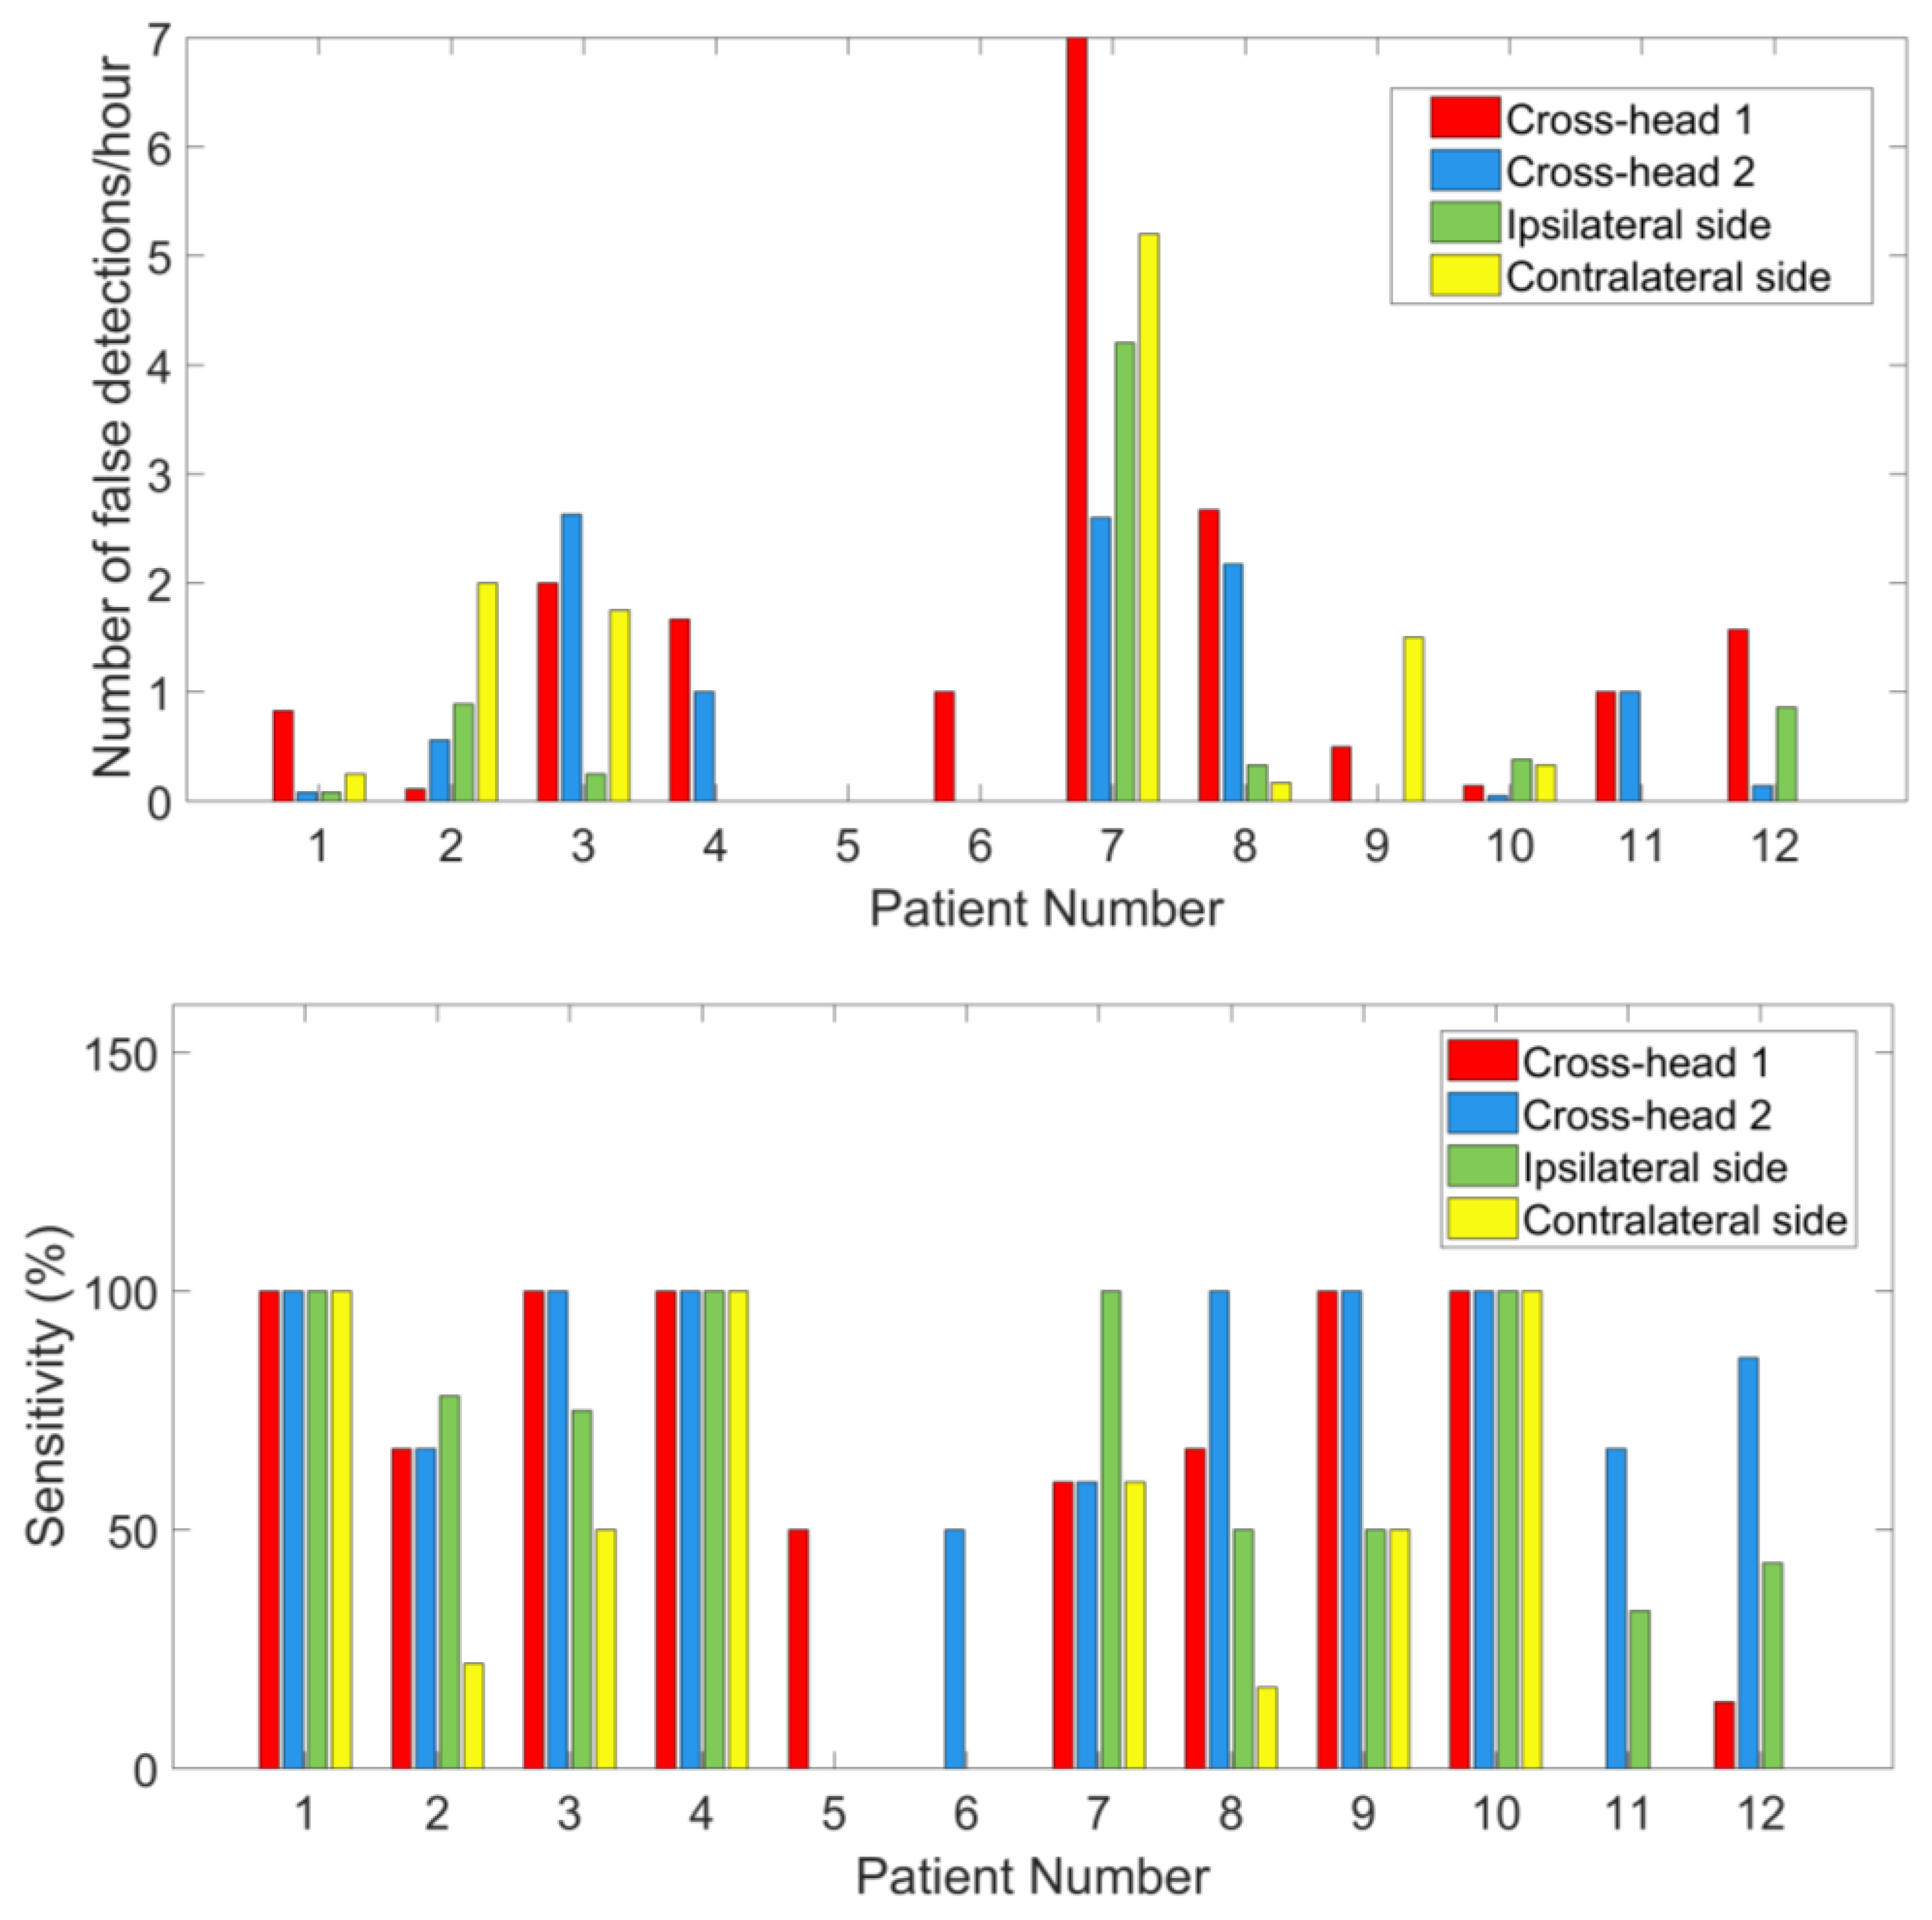
3.4. Comparison of Seizure Detection between Cross-Head Channels and Unilateral Channels
4. Discussion
5. Conclusions
Acknowledgments
Author Contributions
Conflicts of Interest
Ethical Statement
References
- De Boer, H.M.; Mula, M.; Sander, J.W. The global burden and stigma of epilepsy. Epilepsy Behav. 2008, 12, 540–546. [Google Scholar] [CrossRef] [PubMed]
- Forsgren, L.; Beghi, E.; Õun, A.; Sillanpää, M. The epidemiology of epilepsy in Europe—A systematic review. Eur. J. Neurol. 2005, 12, 245–253. [Google Scholar] [CrossRef] [PubMed]
- Fisher, R.S.; Acevedo, C.; Arzimanoglou, A.; Bogacz, A.; Cross, J.H.; Elger, C.E.; Engel, J.; Forsgren, L.; French, J.A.; Glynn, M.; et al. A practical clinical definition of epilepsy. Epilepsia 2014, 55, 475–482. [Google Scholar] [CrossRef] [PubMed]
- Nunez, P.L.; Srinivasan, R. Electroencephalogram. Scholarpedia 2007, 2, 1348. [Google Scholar] [CrossRef]
- Alving, J.; Beniczky, S. Diagnostic usefulness and duration of the inpatient long-term video-EEG monitoring: Findings in patients extensively investigated before the monitoring. Seizure 2009, 18, 470–473. [Google Scholar] [CrossRef] [PubMed]
- Askamp, J.; van Putten, M.J.A.M. Mobile EEG in epilepsy. Int. J. Psychophysiol. 2014, 91, 30–35. [Google Scholar] [CrossRef] [PubMed]
- Casson, A.J.; Yates, D.C.; Smith, S.J.M.; Duncan, J.S.; Rodriguez-Villegas, E. Wearable electroencephalography. IEEE Eng. Med. Biol. Mag. 2010, 29, 44–56. [Google Scholar] [CrossRef] [PubMed]
- Debener, S.; Minow, F.; Emkes, R.; Gandras, K.; de Vos, M. How about taking a low-cost, small, and wireless EEG for a walk? Psychophysiology 2012, 49, 1617–1621. [Google Scholar] [CrossRef] [PubMed]
- Looney, D.; Kidmose, P.; Park, C.; Ungstrup, M.; Rank, M.; Rosenkranz, K.; Mandic, D. The in-the-ear recording concept: User-centered and wearable brain monitoring. IEEE Pulse 2012, 3, 32–42. [Google Scholar] [CrossRef] [PubMed]
- Bleichner, M.G.; Lundbeck, M.; Selisky, M.; Minow, F.; Jager, M.; Emkes, R.; Debener, S.; De Vos, M. Exploring miniaturized EEG electrodes for brain-computer interfaces. An EEG you do not see? Physiol. Rep. 2015, 3, e12362. [Google Scholar] [CrossRef] [PubMed]
- Goverdovsky, V.; Looney, D.; Kidmose, P.; Mandic, D.P. In-Ear EEG From Viscoelastic Generic Earpieces: Robust and Unobtrusive 24/7 Monitoring. IEEE Sens. J. 2016, 16, 271–277. [Google Scholar] [CrossRef]
- Debener, S.; Emkes, R.; De Vos, M.; Bleichner, M. Unobtrusive ambulatory EEG using a smartphone and flexible printed electrodes around the ear. Sci. Rep. 2015, 5, 16743. [Google Scholar] [CrossRef] [PubMed]
- Mirkovic, B.; Bleichner, M.G.; De Vos, M.; Debener, S. Target speaker detection with concealed EEG around the ear. Front. Neurosci. 2016, 10. [Google Scholar] [CrossRef] [PubMed]
- Looney, D.; Park, C.; Kidmose, P.; Rank, M.L.; Ungstrup, M.; Rosenkranz, K.; Mandic, D.P. An in-the-ear platform for recording electroencephalogram. Proc. Annu. Int. Conf. IEEE Eng. Med. Biol. Soc. EMBS 2011, 1, 6882–6885. [Google Scholar]
- Bleichner, M.G.; Debener, S. Concealed, Unobtrusive Ear-Centered EEG Acquisition: CEEGrids for Transparent EEG. Front. Hum. Neurosci. 2017, 11, 1–14. [Google Scholar] [CrossRef] [PubMed]
- Gotman, J. Automatic recognition of epileptic seizures in the EEG. Electroencephalogr. Clin. Neurophysiol. 1982, 54, 530–540. [Google Scholar] [CrossRef]
- Qu, H.; Gotman, J. Improvement in seizure detection performance by automatic adaptation to the EEG of each patient. Electroencephalogr. Clin. Neurophysiol. 1993, 86, 79–87. [Google Scholar] [CrossRef]
- Wilson, S.B.; Scheuer, M.L.; Emerson, R.G.; Gabor, A.J. Seizure detection: Evaluation of the Reveal algorithm. Clin. Neurophysiol. 2004, 115, 2280–2291. [Google Scholar] [CrossRef] [PubMed]
- Shoeb, A.; Guttag, J. Application of Machine Learning To Epileptic Seizure Detection. Proc. Int. Conf. Mach. Learn. 2010, 975–982. [Google Scholar] [CrossRef]
- Hunyadi, B.; Signoretto, M.; Van Paesschen, W.; Suykens, J.A.K.; Van Huffel, S.; De Vos, M. Incorporating structural information from the multichannel EEG improves patient-specific seizure detection. Clin. Neurophysiol. 2012, 123, 2352–2361. [Google Scholar] [CrossRef] [PubMed]
- Shoeb, A.; Edwards, H.; Connolly, J.; Bourgeois, B.; Ted Treves, S.; Guttag, J. Patient-specific seizure onset detection. Epilepsy Behav. 2004, 5, 483–498. [Google Scholar] [CrossRef] [PubMed]
- Greene, B.R.; Marnane, W.P.; Lightbody, G.; Reilly, R.B.; Boylan, G.B. Classifier models and architectures for EEG-based neonatal seizure detection. Physiol. Meas. 2008, 29, 1157–1178. [Google Scholar] [CrossRef] [PubMed]
- Klem, G.; Luders, H.; Jasper, H.; Elger, C. The ten-twenty electrode system of the International Federation. Electroencephalogr. Clin. Neurophysiol. 1958, 10, 371–375. [Google Scholar]
- De Clercq, W.; Vergult, A.; Vanrumste, B.; Van Paesschen, W.; Van Huffel, S. Canonical correlation analysis applied to remove muscle artifacts from the electroencephalogram. IEEE Trans. Biomed. Eng. 2006, 53, 2583–2587. [Google Scholar] [CrossRef] [PubMed]
- Vergult, A.; De Clercq, W.; Palmini, A.; Vanrumste, B.; Dupont, P.; Van Huffel, S.; Van Paesschen, W. Improving the interpretation of ictal scalp EEG: BSS-CCA algorithm for muscle artifact removal. Epilepsia 2007, 48, 950–958. [Google Scholar] [CrossRef] [PubMed]
- Bell, A.J.; Sejnowski, T.J. A Non-linear Information Maximisation Algorithm that Performs Blind Separation. In Advances in Neural Information Processing Systems; The MIT Press: Cambridge MA, USA, 1995; pp. 467–474. [Google Scholar]
- Delorme, A.; Makeig, S. EEGLAB: An open source toolbox for analysis of single-trial EEG dynamics including independent component analysis. J. Neurosci. Methods 2004, 134, 9–21. [Google Scholar] [CrossRef] [PubMed]
- Farina, D.; do Nascimento, O.F.; Lucas, M.F.; Doncarli, C. Optimization of wavelets for classification of movement-related cortical potentials generated by variation of force-related parameters. J. Neurosci. Methods 2007, 162, 357–363. [Google Scholar] [CrossRef] [PubMed]
- Gu, Y.; Do Nascimento, O.F.; Lucas, M.F.; Farina, D. Identification of task parameters from movement-related cortical potentials. Med. Biol. Eng. Comput. 2009, 47, 1257–1264. [Google Scholar] [CrossRef] [PubMed]
- Cortes, C.; Vapnik, V. Support-Vector Networks. Mach. Learn. 1995, 20, 273–297. [Google Scholar] [CrossRef]
- Meier, R.; Dittrich, H.; Schulze-Bonhage, A.; Aertsen, A. Detecting epileptic seizures in long-term human EEG: A new approach to automatic online and real-time detection and classification of polymorphic seizure patterns. J. Clin. Neurophysiol. 2008, 25, 119–131. [Google Scholar] [CrossRef] [PubMed]
- Qu, H.; Gotman, J. A patient-specific algorithm for the detection of seizure onset in long-term EEG monitoring: Possible use as a warning device. IEEE Trans. Biomed. Eng. 1997, 44, 115–122. [Google Scholar] [CrossRef] [PubMed]
- Gabor, A.J. Seizure detection using a self-organizing neural network: Validation and comparison with other detection strategies. Electroencephalogr. Clin. Neurophysiol. 1998, 107, 27–32. [Google Scholar] [CrossRef]
- Peng, H.; Long, F.; Ding, C. Feature selection based on mutual information: Criteria of Max-Dependency, Max-Relevance, and Min-Redundancy. IEEE Trans. Pattern Anal. Mach. Intell. 2005, 27, 1226–1238. [Google Scholar] [CrossRef] [PubMed]
- Van Putten, M.J.A.M. Nearest neighbor phase synchronization as a measure to detect seizure activity from scalp EEG recordings. J. Clin. Neurophysiol. 2003, 20, 320–325. [Google Scholar] [CrossRef] [PubMed]
- De Cheveigné, A. Sparse time artifact removal. J. Neurosci. Methods 2016, 262, 14–20. [Google Scholar] [CrossRef] [PubMed]
- Holsheimer, J.; Feenstra, B.W.A. Volume conduction and EEG measurements within the brain: A quantitative approach to the influence of electrical spread on the linear relationship of activity measured at different locations. Electroencephalogr. Clin. Neurophysiol. 1977, 43, 52–58. [Google Scholar] [CrossRef]


| PID | Nr. of Seizures | Sex | Age | Seizure Onset Zone and AED Dosage on the Inspection Day | Recording Time (h) |
|---|---|---|---|---|---|
| 1 | 1 | F | 19 | Right occipital lobe Topiramate (100 mg) | 12 |
| 2 | 9 | F | 24 | Left temporal lobe Levetiracetam (2000 mg) Clobazam (10 mg) | 91 |
| 3 | 8 | M | 32 | Right temporal lobe Carbamazepine (500 mg) | 52 |
| 4 | 1 | M | 64 | Left temporal lobe Lamotrigine (200 mg) Carbamazepine(200 mg) Lacosamide (200 mg) | 3 |
| 5 | 2 | M | 61 | Right temporal lobe Lamotrigine (200 mg) Levetiracetam (2000 mg) | 27 |
| 6 | 2 | F | 33 | Right parietal lobe No AED | 23 |
| 7 | 5 | M | 45 | Left temporal lobe Lamotrigine (200 mg) Perampanel (2 mg) | 34 |
| 8 | 6 | F | 32 | Left temporal lobe Lamotrigine (200 mg) Levetiracetam (2000 mg) | 72 |
| 9 | 2 | F | 49 | Left temporal lobe Lacosamide (100 mg) | 43 |
| 10 | 1 | M | 28 | Right temporal lobe Topiramate (100 mg) Lamotrigine (200 mg) | 21 |
| 11 | 3 | F | 25 | Right temporal lobe Lamotrigine (225 mg) Levetiracetam (1250 mg) | 10 |
| 12 | 7 | M | 20 | Left temporal lobe Lacosamide (350 mg) Perampanel (4 mg) Lamotrigine (400 mg) Oxcarbazepine (300 mg) | 43 |
| PID | LC-RC | LT-RT | LT-LC | RT-RC | ||||
|---|---|---|---|---|---|---|---|---|
| 1 | Fz-Cz | 0.96 | F4-C4 | 0.99 | F7-T3 | 0.99 | T4-Sph2 | 0.89 |
| 2 | T5-O1 | 0.91 | T5-O1 | 0.92 | T5-O1 | 0.93 | T3-T5 | 0.79 |
| 3 | Fp2-F8 | 0.81 | Fp2-F8 | 0.82 | T3-Sph1 | 0.75 | C4-P4 | 0.81 |
| 4 | F7-T3 | 0.95 | F4-C4 | 0.96 | F3-C3 | 0.93 | F3-C3 | 0.74 |
| 5 | T4-Sph2 | 0.88 | T4-T6 | 0.85 | Cz-Pz | 0.74 | T4-T6 | 0.81 |
| 6 | Cz-Pz | 0.81 | T3-Sph1 | 0.73 | C3-P3 | 0.79 | Fp2-F8 | 0.78 |
| 7 | T5-O1 | 0.71 | T4-Sph2 | 0.68 | C3-P3 | 0.73 | P4-O2 | 0.87 |
| 8 | T3-T5 | 0.70 | T3-T5 | 0.73 | F3-C3 | 0.76 | T6-O2 | 0.79 |
| 9 | P3-O1 | 0.91 | F7-T3 | 0.95 | T3-Sph1 | 0.95 | T4-Sph2 | 0.92 |
| 10 | Fp2-F4 | 0.94 | Fp2-F4 | 0.87 | Fp1-F3 | 0.85 | P4-O2 | 0.81 |
| 11 | Fp1-F7 | 0.77 | T5-O1 | 0.77 | P4-O2 | 0.71 | Pz-O1 | 0.70 |
| 12 | T5-O1 | 0.65 | T6-O2 | 0.68 | F3-C3 | 0.65 | T4-Sph2 | 0.66 |
| Mean ± SD | 0.83 ± 0.11 | 0.83 ± 0.11 | 0.82 ± 0.11 | 0.80 ± 0.07 | ||||
| False Detections/h | Sensitivity (%) | |||
|---|---|---|---|---|
| Scalp EEG | Ear EEG | Scalp EEG | Ear EEG | |
| Median (min max) | 1.14 (0 7) | 0.52 (0 7.50) | 100 (0 100) | 94.50 (33 100) |
| Mean ± SD | 1.36 ± 1.91 | 1.15 ± 2.08 | 81.25 ± 31.76 | 82.17 ± 23.40 |
© 2017 by the authors. Licensee MDPI, Basel, Switzerland. This article is an open access article distributed under the terms and conditions of the Creative Commons Attribution (CC BY) license (http://creativecommons.org/licenses/by/4.0/).
Share and Cite
Gu, Y.; Cleeren, E.; Dan, J.; Claes, K.; Van Paesschen, W.; Van Huffel, S.; Hunyadi, B. Comparison between Scalp EEG and Behind-the-Ear EEG for Development of a Wearable Seizure Detection System for Patients with Focal Epilepsy. Sensors 2018, 18, 29. https://doi.org/10.3390/s18010029
Gu Y, Cleeren E, Dan J, Claes K, Van Paesschen W, Van Huffel S, Hunyadi B. Comparison between Scalp EEG and Behind-the-Ear EEG for Development of a Wearable Seizure Detection System for Patients with Focal Epilepsy. Sensors. 2018; 18(1):29. https://doi.org/10.3390/s18010029
Chicago/Turabian StyleGu, Ying, Evy Cleeren, Jonathan Dan, Kasper Claes, Wim Van Paesschen, Sabine Van Huffel, and Borbála Hunyadi. 2018. "Comparison between Scalp EEG and Behind-the-Ear EEG for Development of a Wearable Seizure Detection System for Patients with Focal Epilepsy" Sensors 18, no. 1: 29. https://doi.org/10.3390/s18010029
APA StyleGu, Y., Cleeren, E., Dan, J., Claes, K., Van Paesschen, W., Van Huffel, S., & Hunyadi, B. (2018). Comparison between Scalp EEG and Behind-the-Ear EEG for Development of a Wearable Seizure Detection System for Patients with Focal Epilepsy. Sensors, 18(1), 29. https://doi.org/10.3390/s18010029