Abstract
This paper deals with the thermal transmittance measurement focused on buildings and specifically in building energy retrofitting. Today, if many thermal transmittance measurements in a short time are needed, the current devices, based on the measurement of the heat flow through the wall, cannot carry out them, except if a great amount of devices are used at once along with intensive and tedious post-processing and analysis work. In this paper, from well-known physical laws, authors develop a methodology based on three temperatures measurements, which is implemented by a novel thermal transmittance metre. The paper shows its development step by step. As a result the developed device is modular, scalable, and fully wireless; it is capable of taking as many measurements at once as user needs. The developed system is compared working together on a same test to the currently used one based on heat flow. The results show that the developed metre allows carrying out thermal transmittance measurements in buildings in a cheap, quick, reliable and simple way.
1. Introduction
The reduction of energy demand is the easiest way to limit the production of greenhouse gases. It can be made possible through behavioural changes or higher energy efficiency. The energy demand of buildings (houses, public and private offices, shops and other buildings) represents a very important part of the European Union’s (EU) final energy consumption [1,2,3], nearly 40%; and it is expected to continue to grow in the coming years. By 2030 the EU will depend on 90% of oil imports and 80% on natural gas to cover its energy needs. Improving the energy efficiency of buildings, responsible for one-third of greenhouse gas emissions, would not only save costs but also partially offset the impact of climate change [4]. The EU’s Horizon 2020 programme emphasises the need to reduce the difference between calculated and actual performance of buildings by increasing their energy efficiency [5]. Usually, the energy consumption in buildings is conditioned by the use and maintenance of their facilities as well as their constructive characteristics (mainly insulation).
Human thermal comfort depends on many factors including personal (physiological, sociocultural, etc.) and environmental. To achieve a certain level of thermal comfort two sets of actions can be carried out: passively (building envelope) and actively (heating and cooling systems).
While it is true that in the developed countries new buildings are subject to strict constructive norms to achieve high energy efficiency; it is also true that, in these countries and in general, there is a huge building park that was built with less demanding criteria (and depending on the lifetime, perhaps with none). This huge body of existing buildings needs to be energy retrofitted to achieve levels of efficiency that align with current requirements.
It is estimated that if a good building energy retrofitting is carried out up to 27% of energy saving can be achieved [3]. Based on our own experience the result can be even better depending of course on the initial state of the building and the extent and quality of retrofitting achieved.
In the context of building energy retrofitting, the measurement, processing and interpretation of the variables of interest play an important role. Usually this is done with specific data acquisition systems (DAQ). They provide the retrofitting measures for the variables of interest both before (to assess the retrofitting to be carried out) and after (to evaluate the retrofitting results and obtain the reliability of improvement). In general, measurements of temperature [6,7,8,9] and relative moisture [10,11] both indoor and outdoor, solar radiation [12,13], envelope thermal transmittance (U-Value) [14,15], power consumption by electrical circuits [16], etc., are required.
This work is devoted to the measurement of one of the above-cited variables, perhaps the most complex to measure, the U-Value. For this, a novel wireless measurement system has been developed, which provides simple, quick and cheap measurement of U-Values in buildings.
The better-insulated a structure is, the lower the U-Value will be. The U-Value (reciprocal of thermal resistance, Rt value) is the rate of transfer of heat through a structure, which can be a single material or a composite, divided by the difference in temperature across that structure. The units of measurement are W/(m2 K). Currently, the three most common methods for measuring the U-Value in buildings, although there are others [17,18], are:
- (a)
- Theoretical calculation using the ISO 6946: 2007 standard [19,20,21]. The procedure may be invasive (making coves in the building envelope) or not, and it is necessary to take into account the thickness of each of the layers that compose the building envelope as well as its thermal conductivity, which is calculated according to ISO 10456: 2007 standard [22]. This method is of approximation, and the obtained U-Value is often far from the actual [23,24,25]. This is mainly due to the fact that in existing buildings, theoretical evaluation of U-Value can be difficult because the materials used in the envelopes are not usually homogeneous and their values are unknown, and also because the necessary application of destructive methods is not always feasible.
- (b)
- Based on the direct measurement of the heat flow through the building envelope according to ISO 9869: 2014 standard [26]. For this, a flow heat metre and a pair of temperature sensors [27] are used. The U-Value measurement must be done once the steady-state has been reached, i.e., the average heat flow on both envelope sides must be equal during a long-enough period of measurement. However, from a physical-mathematical standpoint, steady-state conditions are never achieved; therefore, in practice, we can assume that average values of heat flow rate over a reasonably long period of time (minimum 72 h) give an estimate of the steady-state conditions.
- (c)
- Measured through the infrared thermovision technique, which consists of calculating the U-Value through thermographic camera measurements and the subsequent analysis of the images obtained [28,29,30]. Although (a) it is also a very imprecise method, it is a very interesting approach for taking a first look.
The most widely accepted of the above three methods for its accuracy is (b). However, measuring the U-Value becomes very tedious, time consuming and expensive for the following reasons:
- The duration of the test must exceed 3 days taking up to 7 to 14 days or even more than a month for heavy structures; or over a year in the case of a ground floor slab, due to heat storage in the ground.
- If we try to apply this method in building energy retrofitting and, as usual, the number of measures to be carried out is high, its application is not feasible. We would need months or years to carry out the measurements, or a large number of equipment measuring at the same time, which would be impractical for its price and processing costs.
- The accuracy of measurements depends on a number of factors:
- ○
- Magnitude of temperature difference (larger = more accurate).
- ○
- Weather conditions (cloudy is better than sunny).
- ○
- Good adhesion of the head flow sensor to test area.
- ○
- Duration of monitoring (longer duration enables a more accurate average).
- ○
- More test points enable greater accuracy to mitigate anomalies.
- The heat flow metre is a relatively expensive and unstable device, as well as needs a specific instrumentation channel. The total cost of sensor + instrumentation + processing + data display may be several thousand of € for each measurement point.
The system that has been developed in this work aims at overcoming all the above-cited limitations by providing an easy, quick and cheap U-Value measurement. The measurement methodology used is derived from (b); it consists of the U-Value direct measurement without using a flow heat metre. Specifically, the measurement of three temperatures is only required: Environment on each face of the structure and surface on one of them. The temperature sensors used have been patented by the authors of this paper [31,32], although others may be used.
Regarding the duration of the test, according to method (b), all the mentioned time periods (3 days taking up to 7 to 14 days or even more than a month for heavy structures; or over a year in the case of a ground floor slab) are estimated from a conservative point of view: in the sense that experience advises these time periods to ensure the reliability of the measure in any case. However, based on our own experience, the most important factor for a good measure of the U-Value is not so much the time during which it is being measured, but the time it takes the measurement to stabilize (to reach its steady-state value). Actually the casuistry in the measure is very variable depending mainly on the thermal gradient interior/exterior and the nature of the structure. Therefore it would be very relevant to have a system that is able at all times, based on the above, to decide when a measure is correct (it has reached its steady-state) and when not. This would allow fitting the measurement time in each case, opening the possibility of taking more measures in less time and therefore generating a significant saving. This is precisely another of the most important features of our developed system: if during a user-adjustable time the measurement remains in its steady-state value within a threshold also user-adjustable, the system can automatically take the measurement (if it is programmed for that) and ends the test automatically as well. This is possible because the developed system works online and processes data in real time; the known commercial systems work offline as data loggers.
The developed U-Value metre allows for taking multiple measures at the same time, which also allows for considerably cutting the time needed to have a suitable set of measures in a retrofitting of an existing building. In fact, it is fully modular and configurable by the user according to his/her needs.
The developed U-Value metre incorporates a user interface (implemented by a virtual instrument, VI) for its remote handling. It receives real time measurements, processes and stores them. The VI allows detecting communication/sensor errors and failures, and warns of anomalies. Finally, the user can create graphs and reports by using the VI. Once the temperature sensors are placed, no process of obtaining the measurements requires human intervention.
Finally, in order to have experimentation results, the developed system is used to measure the U-Value in a dwelling that has undergone energy retrofitting. Moreover, taking advantage of the mounted experimentation, the developed system is compared, working together on a same test, to the one currently used based on heat flow measurement. The results show that the developed metre allows carrying out thermal transmittance measures in buildings in a cheap, quick, simple and reliable way.
The rest of the paper is organized as follows: in Section 2 that follows the measurement methodology is presented, this is the mathematical foundation of the developed system. Section 3 is devoted to analyze the developed U-Value metre, both the hardware and software. In Section 4 the way to carry out measurements and the results thereof is shown; it also includes a comparison with the currently used technology. In discussion, Section 5 the main features and strengths of the developed U-Value metre with respect to the current technology are highlighted. Finally, Section 6 outlines the main conclusions of the paper.
2. Measurement Methodology
U-Value measures show how effective a material is as an insulator. Assuming a mono-dimensional heat flow and steady-state conditions (see Figure 1), the U-Value of a system is defined as the heat flow rate per unit area, q, divided by the temperature difference between the surroundings on each side of the system. This is:
where, if as usual, the system is a wall with an indoor side and an outdoor one. Ti and Te are, respectively, the indoor and outdoor surrounding temperatures. As q is always flowing from the hottest temperature to the coldest, the practical application of Equation (1) requires to take into account if or not, since this sets the direction of q (leaving the wall or entering it, respectively). In order to avoid negative U-Values, it is enough to consider the absolute value or simply change the order of the temperatures in the parentheses; in this way you can perform bidirectional heat flow measurements (both in winter and summer) from the indoor of the wall.
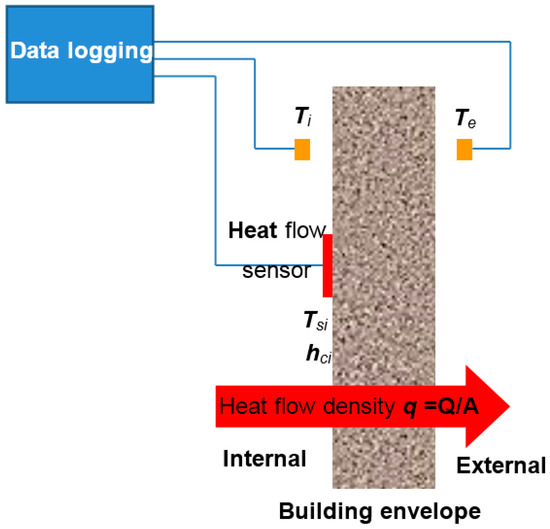
Figure 1.
In situ U-Value measurement according to ISO 9869: 2014 standard (average method); it is assumed that
From the point of view of building construction, the U-Value, assuming steady-state conditions, is the amount of heat flowing per unit of surface through a specific building envelope when there is a temperature gradient between its indoor and outdoor surrounding.
Remark.
Steady-state condition does not mean that the U-Value reaches a constant final value, which is impossible according to (1) due to the continuous temperature changes. The meaning is that the average U-value remains substantially constant over time.
Following Equation (1), the ISO 9869: 2014 [26] standard for measuring the U-Value (see Figure 1) requires two temperatures sensors and one heat flow metre on the side with the most stable temperature, usually indoor. The heat flow sensor (thermopile) should be in direct thermal contact with the surface of the envelope (usually a wall) over the whole area of the sensor. Regarding the temperature sensors, they must measure the surrounding air temperature (not the envelope surface temperature).
The steady-state assumption implies that only one heat flow metre is enough, since the average heat flow on both sides are equal in a long-enough period of measurement. However, how long does a long-enough period of measurement last? It depends on the type of test carried out. A conservative way is to wait long enough (given by our experience and set in hours or days in the standards) and apply it, as caution, to all tests of the same type. Another more interesting way from the research point of view is to be able to detect when the steady-state is reached to end automatically the test. This is one of the key issues of this paper.
Instant measurements (q, Ti and Te) are processed by using the progressive average procedure. It is based on the idea that the average of instantaneous ratios between heat flow and temperature differences on a progressively increasing time scale smoothes out oscillations leading to the steady-state value of the thermal transmittance. The equation that describes the procedure is:
where n is the number of measures made during the test.
Equation (2) delivers a U-Value close to the real if the following conditions are met [26]:
- The steady-state is achieved.
- The heat-flow sensor is not exposed to direct solar radiation; it is better to always measure from the inside.
- The temperature difference between indoor and outdoor must be greater than 10 °C.
- The wind speed must be less than 3 m/s.
- The thermal conductivity of the all involved elements is constant during the test.
In order to find a more practical way of measuring the U-Value, we can use a methodology based on the Newton’s law of cooling. The law states that when the temperature difference between a body and its surrounding is not too great, the rate of heat transferred (to or from the body) by conduction, convection and radiation is practically proportional to the temperature difference between the body and the surrounding. This is:
where:
- Q is the thermal energy in joules.
- is the heat transfer coefficient (W/(m2 K)).
- S is the heat transfer surface area of the body (m2).
- T is the body temperature.
- Ts is the surrounding body temperature.
Applying Equation (3) to Figure 1 with the condition that the heat transfer surface area of the body is the wall, we can write that
where hci is the indoor surface convective heat transfer coefficient (W/(m2 K) of the wall, Tsi its indoor surface temperature, Ti its indoor surrounding temperature, and considering that the building is losing heat through its envelope. This is, the fluid (air surrounding the inner wall) extracts heat from the environment and changes its density causing it to move to the cooler side (outer wall) where it delivers its heat. If the q flow is opposite to that of Figure 1 (typical situation in summer, over all in subtropical countries), the inner wall delivers heat to its surrounding air, thus the parenthesis in Equation (4) must be rewritten as
According to Figure 1 and taking into account Equations (1) and (4) in steady-state, we can write for a building envelope that
From this equation the U-value can be obtained on the basis of only three temperature measures, i.e.,
Finally, by following the progressive average procedure to lead to the steady-state value of the thermal transmittance,
Equation (7) allows obtaining the U-Value of a building envelope by measuring three temperatures (see Figure 1), namely: Ti, Te and Tsi. The hci values can be obtained from the standard [19] (page 13), i.e., hci = 5.0 (W/m2 K) for heat flow upwards; hci = 2.5 (W/m2 K) for heat flow horizontal and hci = 0.7 (W/m2 K) for heat flow downwards. Regarding these hci values there is some dispersion depending on the used bibliography, for that, it is best to use the standard. In any case and regarding our methodology this is not a problem because we make differential measurements, i.e., we measure before and after the building energy retrofitting, and then we subtract the measurements in order to get the obtained improvement.
In practice, in order to minimize errors in the envelope surface temperature measurement, it is advisable to carry out several measuring at the same time around the measurement zone. Specifically and based on our own experience, it is a good practice to take three measurements in points spaced about 10–15 cm from each other. In this way, the chosen Tsi to introduce every j in (7) will be the average of these three measurements. Of course, if there is a lot deviation of one of the measurements, it must be discarded, as it is probably due to malfunctioning of its respective sensor.
3. Developed U-Value Metre
The U-Value metre design is fully modular and also its use. It is made up of different modules that the user can configure according to his/her need (Figure 2). The indoor and outdoor modules are physically separated but connected via wireless. All modules function as Xbee devices using Zigbee protocol [33,34].
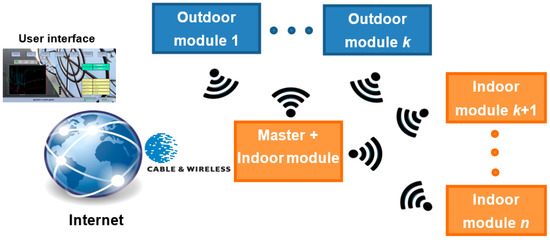
Figure 2.
Developed U-Value metre.
Xbee is a small (about 2 cm2), low-power (tens of mW) digital radio. Since its initial introduction (2005), a number of new XBee radios have been developed and an ecosystem of wireless modules, gateways, adapters and software has evolved. Today, through an Xbee device, any small single-board computer can be integrated in any specific purposeful wireless network.
Regarding ZigBee, it is an IEEE 802.15.4-based specification [35,36] used to create personal area networks. The technology defined by the ZigBee specification is intended to be simpler and less expensive than other wireless personal area networks such as bluetooth or wi-fi.
Depending on the XBee device used, the combination XBee + ZigBee allows a communication range of more than 100 m in closed spaces and 1 km in open spaces. In any case, ZigBee devices can transmit data over long distances by passing data through a mesh network of intermediate devices to reach more distant ones. This feature is implemented in our developed U-Value metre.
Taking into account that a ZigBee network can consist of a maximum of 65,535 nodes distributed in subnets of 255 nodes, the ability of the developed U-Value metre, according to the configuration of Figure 2, is practically unlimited, and certainly higher than any practical requirements infield.
If on a building only one U-Value measurement is needed to be taken, the configuration of the developed U-Value metre is the simplest: the master + indoor module and one outdoor module. Following Figure 1, the master + indoor module takes the temperatures Ti and Tsi (three measurement points) and the outdoor module takes the temperature Te. The master + indoor module collects all the measures, processes them following Equation (7) (it can also make partial U-Value calculations by Equation (7) if so programmed from the user interface) and saves (in an internal memory) the calculated U-Value. At the same time the metre can transmit all measures in real time internet connection (even using mobile phone network or a modem radio) via cable, Wi-Fi or wireless. In our case, we can receive in our laboratory all the real time measures from any building in any part of the world. For that we have developed a user interface (by a virtual instrument, VI) as part of the developed U-Value metre. Of course, data can be also stored in situ, and with a USB memory device in the master + indoor module. From this initial and simple configuration, the user can scale the developed U-Value metre according to his/her needs, i.e., adding as many indoor and outdoor modules as needed. Taking into account the distance range and capabilities of incorporating modules, entire blocks of buildings with the same U-Value metre can be monitored simultaneously. In addition, what is more important still, all measures can be done at once and their values shown in real time.
3.1. Master + Indoor Module
The block diagram of the Master + indoor module is shown in Figure 3. It is based on a small single-board computer Raspberry Pi 3 [13,37]. In addition to the Raspberry Pi 3, the master + indoor module has a built-in Dongle Xbee + XBee device (Xbee S1 Pro, [38]), an AC/DC power supply, and a board were the temperature sensors are connected. It allows connecting the 1-wire bus used with the temperature sensors (for measuring Ti, and 3 Tsi) to the Raspberry. Finally, although the measures can be transmitted in real time to any point with Internet connection, these are also stored in an external USB memory device (32 GB in this prototype), which allows for measure recovery if any communication failure occurs. This USB memory device can be removed by the user.
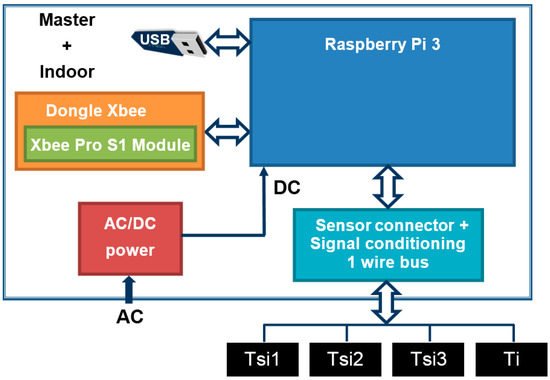
Figure 3.
Master + indoor module block diagram.
As for functioning, the master + indoor module sends a synchronizing signal with information of the measure time interval to all the modules involved at the beginning of the test; from here each module can operate independently. This avoids losing measures in case of wireless communication link failures. If a module cannot be synchronized, the user receives a beep signal, and warning is displayed on the user interface.
Regarding Equation (7), the master + indoor module takes four temperature measurements (Ti and 3 Tsi) for an adjustable time interval by the user, or automatically until the U-Value reaches the steady-state. This can be done from the user interface. For calculating the average value of the 3 Tsi, the master + indoor module checks first the deviation among the three measures; if any of them exceeds a fixed threshold (set by the user) this measure is discard and the user receives a beep that is also displayed on the user interface. The probable cause is that a temperature sensor is malfunctioning or perhaps badly fixed to the wall.
As an example of U-value test, if its duration is 3 days and the measures are taken each half hour, n in Equation (7) is 72/0.5 = 144, so 144 measures of Ti and Tsi (average) are taken. The 144 measures are recorded in 2 columns (Ti and Tsi). There is another that contains a reference of the time t when measures were taken. In addition, this module also receives from the outdoor module the 144 Te measurements, taken at the same time that Ti and Tsi. At the end of the test, the data storage comprises a matrix of 4 columns (t, Ti, Tsi and Te) and 144 rows. With these data and applying Equation (7), the U-Value is calculated and shown on the user interface. Of course, if the module has been programmed in this way, at any time of the test or even continuously, partial U-Value calculations can be carried out.
Figure 4 illustrates the actual built module. The master + indoor module is housed in a plastic box which can be plugged directly into a 230 V AC electrical wall outlet and operates in plug and play mode. The cost of this prototype, temperature sensors including, is around 150 €. This price only takes into account the cost of materials; in terms of labor has been carried out by hand. Of course, for industrial production the costs would be greatly reduced.
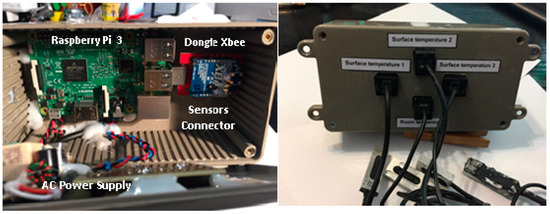
Figure 4.
Master + indoor module prototype: Internal (left) and external (right) views, with its four temperature sensors.
3.2. Indoor Module
The block diagram of this module is shown in Figure 5. It is based on a microcontroller board Arduino Uno [39,40,41]. Because this module needs less computing requirements than the master + indoor module (since it will always act as its slave), we have decided to use an Arduino Uno instead of a Raspberry Pi 3. The fundamental difference between both is that Raspberry Pi is a fully functional computer, whereas Arduino is essentially a microcontroller.
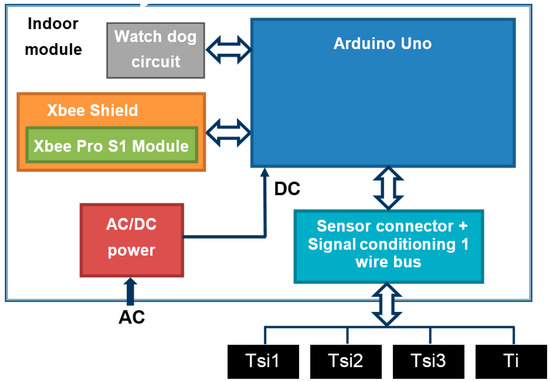
Figure 5.
Indoor module block diagram.
In addition to the Arduino Uno, the indoor module has built-in a Shield Xbee + XBee device (Xbee S1 Pro), a watch-dog circuit (automatically resets the module in the event of communication blocks, which occurs with certain frequency in these devices), an AC/DC power supply, and a board where the temperature sensors are connected. It allows connecting the 1-wire bus used with the temperature sensors (for measuring Ti, and 3 Tsi) to the Arduino Uno.
Following the same U-value test example in Section 3.1, this module sends each temperature measurement (Ti and Tsi average) referenced in time to the master + indoor module, but stores them as well. This allows you to recover the measurements if the wireless communications link fails.
Figure 6 shows the actual built module. The indoor module is also housed in a plastic box which can be plugged directly into a 230 V AC electrical wall outlet and operates in plug and play mode. The cost of this prototype, sensors included, is around 90 €. As in the previous module, this price only takes into account the cost of materials.
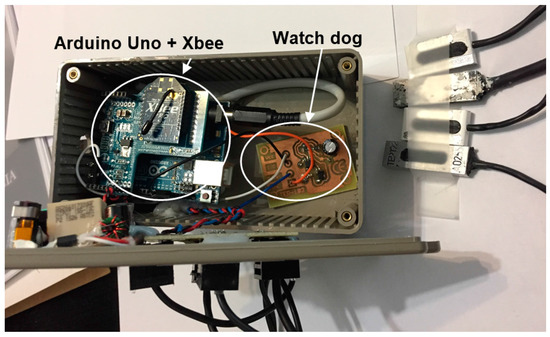
Figure 6.
Indoor module prototype with its four temperature sensors (top right).
3.3. Outdoor Module
The outdoor module is essentially analogous to indoor module (Figure 5) with the exception that it has a single temperature sensor (Te) integrated in the box itself, which is weather protected; and it uses its own battery power source (Figure 7).
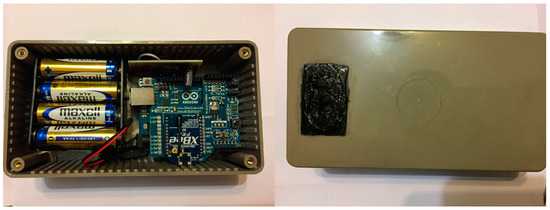
Figure 7.
Outdoor module prototype (left) and its weather protected temperature sensor (right).
Following the same U-value test example in Section 3.1, this module sends each measure (Te) referenced in time to the master + indoor module, but it stores them as well. This allows for recovering the measurements if the wireless communication links fail.
The cost of this prototype, sensors and batteries included, is around 85 €. Again, this price only takes into account the cost of materials.
3.4. User Interface
The user interface was developed through a virtual instrument (VI) created in LabVIEWTM. This VI receives the real time measurements, processes and stores them. The developed VI allows detecting communication/sensor errors and failures, and warns of anomalies. By way of the VI the user can produce graphs and reports.
The VI is usually hosted in a PC; in our experimentation case (please see Section 4) we used a laptop. With the VI, the user can set all the features of the developed U-Value metre. Among them, the ability to perform a test in programmed time or by means of the continuous U-Value calculation until reaching the steady-state value.
Figure 8 shows the front panel of the developed VI taking measures. It is user-friendly, very intuitive and simple, and it notifies the user when the U-Value is available or not. Measurements are carried out automatically and without user intervention.
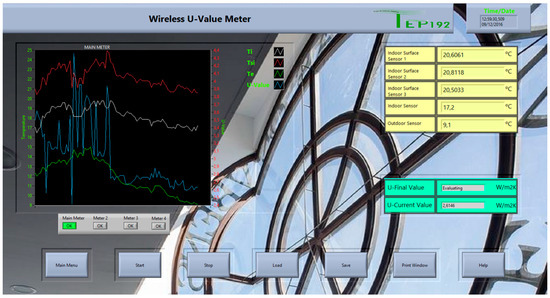
Figure 8.
User interface front panel.
4. Experimentation and Results
Initially and as specified in standard [26], a preliminary inspection of the wall to be measured with the thermographic camera must be carried out. The reason for this is to avoid points where there could be thermal anomalies such as a thermal bridge.
In order to compare both U-Value measurement methods, by direct heat flow measurement (2) and by three temperatures measurement (7), we have configured the experimentation scenario shown in Figure 9. The heat flow sensor (HFS) is the HuksefluxTM mod. HFP01-05. This sensor can carry out bidirectional heat flow measurements with a sensitivity of V/(W m2). The heat flow metre has been configured by the National Instrument TM DAQ mod. NI USB 6281. The DAQ is connected to a laptop (which hosts the VI) using a USB port. This allows synchronizing both experiments and processing their data.
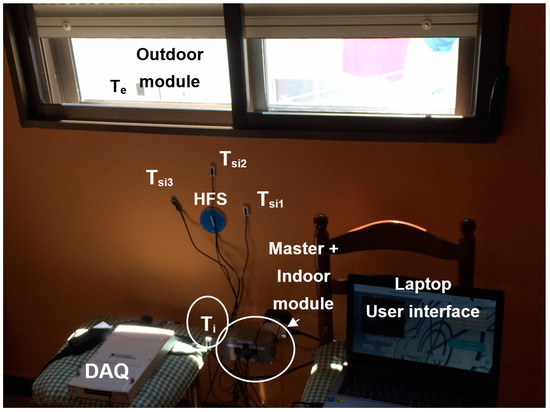
Figure 9.
U-Value measurement experimentation assembly.
As shown in Figure 9, the three surface temperature sensors (the separation between them is about 10–15 cm) are adhered by heat-conductive adhesive to the wall to be measured. This allows for taking an average measure that is closer to the actual wall. Tsi is automatically calculated by the master + indoor module. Regarding the indoor temperature sensor (Ti), which is also used for the heat flow metre, it is placed 30 or 40 cm from the wall at the height of the others (in closed and inhabited rooms, there is usually a thermal gradient between the floor and the ceiling, whereby the ambient temperature is not the same at different heights).
The outdoor module is placed on the other side of the wall; in this case out of the dwelling. As we have already explained, its function is to take the external environment temperature Te, which is also used for the heat flow metre. It can be placed in the most comfortable place taking into account that the measured temperature will be the same at different heights (of course within small distances and avoiding sun and shadow changes). All temperature sensors used have digital output in 1-Wire format [42].
Once all temperature sensors are placed, the user just needs to plug the master + indoor module into the electric current and measurements automatically start (in our specific experimentation we also needed to synchronise both experiments, which was carried out through the laptop). The developed U-Value metre transmits the data, and at the same time processes and save them into its USB memory device.
In both experiments, in order for the U-Value to be valid, it must be measured according to standard ISO 9869-1:2014 [26]: the temperature difference between indoor and outdoor must be greater than 10 °C, the wind speed less than 3 m/s and the solar radiation received must not be direct.
In the developed U-value metre case, the described assembly must be repeated for each measurement point, but only using the indoor and outdoor modules; the user just programmes all the functions in the VI. In contrast, with the heat flow metre, the user needs as many full instrumentation channels as measurement points.
Results
The experimentation was carried out in a dwelling, which underwent an energy retrofitting action. Before retrofitting, U-Value measures were taken using only the developed system. Certainly we would have wanted to carry out the complete assembly of the experiment (both methods as in Figure 9), but the immediate beginning of the action prevented it. In any case we were going to have time to compare both methods afterwards, upon energy retrofitting conclusion. Actually that is what we did.
Figure 10 shows the measures in the dwelling before its energy retrofitting. At a first glance, the test was carried out in winter, this is,
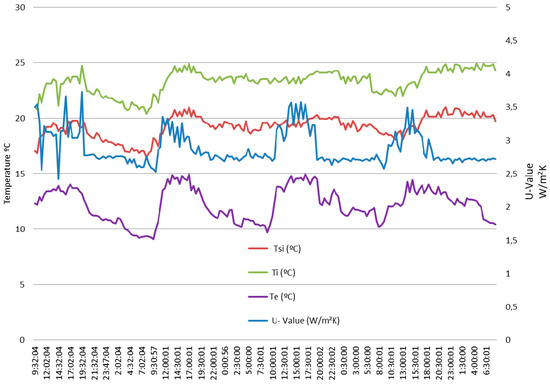
Figure 10.
Measures taken with the developed U-Value metre before the energy retrofitting.
The duration of the test was practically 4 days with measurements taken every half hour. A total of 188 measures were taken, whereby n in Equation (7) is 188. At the end of the test, the calculated U-Value by Equation (7) was 2.50 W/(m2 K).
The left axis of Figure 10 is scaled in Celsius degrees, and the right in W/(m2 K), while the horizontal axis is scaled in time. The VI sets automatically the scale and points for better representation; therefore, in general, the timescale will not match with the measurement time. If the user needs individual sampling measurement values, the VI data matrix (188 rows and 4 columns, 752 points in this case) can be conveyed in spreadsheet format.
At this point, it is interesting to point out a very important feature of the developed system. As already established in Section 2, steady-state condition (necessary for measures to be valid) means that the average U-Value remains substantially constant over time. For this reason and as a precaution, the standard establishes a measurement time of at least 3 days, however in some cases this time may be insufficient. Where is the key then? Precisely in knowing whether the steady-state has been reached or not. If it has been reached the test can stop, if not the test must continue until it is reached. This way of facing the problem is novel and from our point of view very interesting, since it supposes the duration of test that in general will be different for each case; what is the duration then? It is strictly the necessary.
As the developed system performs in real time, during the test it is possible to apply Equation (7) as many times as it is programmed by the user. In this way, the obtained U-Value at any time of the test can be compared with the one obtained in the previous 12 or 24 h (or another period of time also programmable). If the deviation is less than a percentage (also programmable), it can be considered that the steady-state has been reached and therefore the test can stop. As an example, by taking the values of the first 24 h of the data shown in Figure 10, the obtained U-Value is 2.61 W/(m2 K). If a window of +/−5% is set, U-Values among 2.48 and 2.74 would be valid. This means that the test would not have needed four days, since the value calculated at the end has been 2.50 W/(m2 K). Of course this was just an example and the result will surely be different in another test, but the important thing is to have the ability to adjust dynamically and automatically test duration to the conditions in each case.
Once the retrofitting process has completed, we configured the experimentation scenario shown in Figure 9. This involved two tasks: (a) measuring U-Value improvement, and (b) comparing both U-Value measure methods, i.e., through the direct heat flow measurement (2) and through the three temperatures measurement with the developed metre Equation (7). For carrying out this experiment it was necessary to synchronise both metres, which was carried out in the laptop; in this way all temperatures were the same for both metres.
The energy retrofitting process consisted of an external insulation and finish system (EIFS). After it, the obtained U-Values by means of the assembly of Figure 9 are shown in Figure 11 and Figure 12. The first shows the heat flow metre measured U-Value and the obtained average U-Value is 0.43 W/(m2 K). The second shows the developed metre measured U-Value and the obtained average U-Value is 0.42 W/(m2 K). As can be verified, there is no practical difference between both metres (difference less than 2%). However, the very beneficial result of the energy retrofitting can be clearly observed. In fact, the U-Value has dropped more than 2 W/(m2 K).
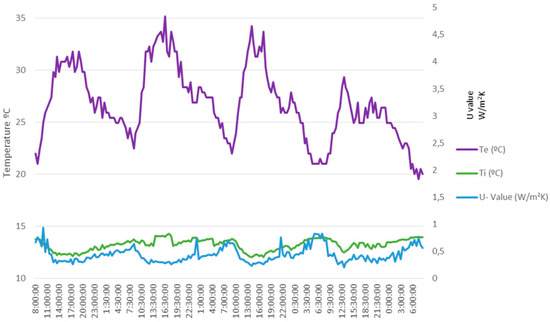
Figure 11.
Measures taken with the heat flow metre after the energy retrofitting.
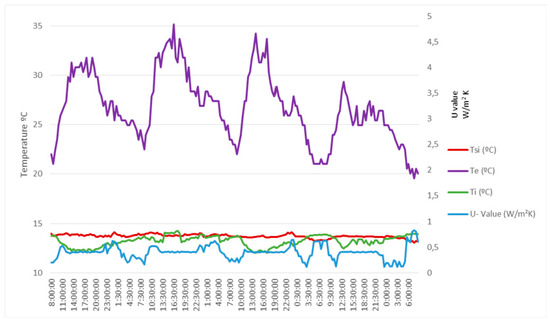
Figure 12.
Measures taken with the developed U-Value metre after the energy retrofitting.
Finally, it is important to point out that the data in Figure 10 was obtained in winter , while those in Figure 11 and Figure 12 were obtained in summer Of course, while the test meets the standard ISO 9869-1:2014 [26], the time of year in which it is carried out should not influence, therefore the obtained result should be substantially the same.
5. Discussion
In new or under construction buildings with the knowledge that we have today of the construction materials as well as with the increasingly demanding regulations in the countries, the need to measure U-Value in the envelope of a building is generally one-off. However, all countries have huge building parks that were built with less demanding regulations (depending on their lifetime, perhaps with none). This huge body of existing buildings needs to be energy retrofitted to achieve levels of efficiency aligned with current requirements. It is precisely in this field, the one of energy retrofitting, where the U-Value knowledge is most needed and its measure must be carried out generally at particular dwellings level and even with several measures in each one.
When many measures of U-Value in buildings are needed in a short time, the methodology based on the direct measurement of the heat flow through the building envelope is impractical. Using this methodology, the only probable way to take many measures in few days is to work with as many devices at once as measures needed. This is unfeasible as well as very expensive.
The proposed methodology in this paper and the developed U-Value metre, which allows it to be carried out, resolves the problem. As we have shown in this paper and regarding the existing devices, our developed U-Value metre improves the current technology in the following aspects:
- -
- It has a modular structure.
- -
- It is made up of different modules configurable to customer needs.
- -
- The module connection is extremely easy; no cable is needed; every connection is made wireless and in plug and play mode.
- -
- It is capable of taking more than one measurement at a time; it is practically unlimited in this aspect. A master + indoor module can be managing tens or hundreds of indoor and outdoor modules.
- -
- The developed U-Value metre and thanks to the XBee + ZigBee communication features allows for a communication range of more than 100 m in closed spaces and 1 km in open spaces. This provides the user to carry out measurements on all dwellings in one building or in several buildings simultaneously.
- -
- The metre can decide automatically when a U-Value measurement is correct (the steady-state has been reached); thus the time spend is strictly the necessary, which allows shortening measurement times.
- -
- Moreover, the user, based on our experience, can set the correct measurement time and the U-values gap in it.
- -
- The developed U-Value metre can also work as usual, i.e., programmed for closed duration tests.
- -
- The developed U-Value metre is provided with a friendly and ergonomic user interface.
- -
- Independently of the installed modules, the developed U-Value metre acts as a single instrument; therefore it is able to manage all the measures at once and processed them as the user needs.
- -
- The user interface and thanks to its VI can present the information in different ways as a data sheet or graphically.
- -
- The devices present in the market process the data off-line, which further slows down the U-Value measure; the developed U-Value metre processes data in real time and provides the U-Value immediately.
- -
- Measured data are saved in situ an also they can be sent to any part of the world via internet. In fact the user can govern the developed U-Value metre remotely.
- -
- The internet connection of the developed U-Value metre can be made by way of cable, wi-fi, mobile phone network or even by modem radio.
- -
- The mentioned features allow taking the necessary U-Value measurements in a large number of dwellings at once and in a short period of time. Today with the current devices available in the market the feature it is impossible.
- -
- The developed U-Value metre is quite accurate. In fact, when it was compared with the current metre based on heat flow, the deviation has bwaseen always less than 2%. Not even this small deviation is a problem, since we make differential measures, i.e., we measure before and after the building energy retrofitting, and then we subtract the measures in order to get the obtained improvement.
- -
- Regarding costs, the comparison between the developed U-Value metre and the current one based on heat flow is very favourable to the former. In fact, for one measurement point, the cost of the master + indoor module plus the outdoor one, including sensors in both, is around 240 €. Conversely, only the heat flow sensor costs more than 500 €. A commercial full instrumentation channel for one measurement point costs several thousand euros. If the user wants to carry out more than one measurement at a time, the cost increases a lot and the difference between one system and another can be several orders of magnitude.
- -
- Despite the developed U-Value metre cost is cheaper than current existing devices it may be even smaller as it is only necessary to acquire the modules needed.
6. Conclusions
The thermal transmittance measurement (U-Value) is mandatory in building energy retrofitting, since by means of before and after measurements, the specialist can check the quality of the building energy retrofitting carried out.
Today, the market offers U-value meters based on the heat flow measurement through the wall whose application to building energy retrofitting can be expensive and probably impractical; especially if many measurements are needed in a short time or even worse if many measurements must be made at once.
This paper shows that from well-known physical laws, it is possible to deal the thermal transmittance measurement from different physical variables other than heat flow through the building envelope. Specifically a methodology based on the measurement of three temperatures has been described: wall outdoor surrounding, wall indoor surrounding and wall indoor surface. The measurement of these three temperatures can be made in a cheap and easy way; thus the practical application of this methodology can give rise to a new generation of U-Value metres.
Indeed, based on our methodology, this paper presents the development of a new U-Value metre. This was compared to the one currently used based on heat flow working together on a same test. The results show that the developed U-Value metre meets a series of features that make it ideal to be applied in building energy retrofitting.
In summary, the developed U-Value metre offers a cheap, quick, reliable and simple way to measure U-Values. It is especially indicated when the amount of measures to be carried out is great and even more if these must be made at once.
Author Contributions
The work presented here was developed in collaboration among all authors. All authors have contributed to, seen and approved the manuscript.
Conflicts of Interest
The authors declare no conflict of interest.
References
- European Union. Energy in Figures. Statistical Pocketbook 2016. Available online: https://ec.europa.eu/energy/sites/ener/files/documents/pocketbook_energy-2016_web-final_final.pdf (accessed on 15 March 2017).
- Directive, E. 91/ec of the European parliament and of the council of 16 December 2002 on the energy performance of buildings. Off. J. Eur. Communities 2002, 4, L1. [Google Scholar]
- European Commission. Action Plan for Energy Efficiency: Realising the Potential; Commission Staff Working Document (2006), 545 Final. 2006. Available online: http://ec.europa.eu/smart-regulation/impact/ia_carried_out/docs/ia_2006/sec_2006_1174_en.pdf (accessed on 15 March 2017).
- Evangelisti, L.; Battista, G.; Guattari, C.; Basilicata, C.; de Lieto Vollaro, R. Influence of the thermal inertia in the European simplified procedures for the assessment of buildings’ energy performance. Sustainability 2014, 6, 4514–4524. [Google Scholar] [CrossRef]
- European Commission. Horizon 2020 Work Programme 2014–2015. Secure, Clean and Efficient Energy (European Commission Decision). Available online: http://ec.europa.eu/research/participants/data/ref/h2020/wp/2014_2015/main/h2020-wp1415-energy_en.pdf (accessed on 15 March 2017).
- Pan, Z.; Zhang, Y.; Cheng, Z.; Tong, J.; Chen, Q.; Zhang, J.; Zhang, J.; Li, X.; Li, Y. Sensing properties of a novel temperature sensor based on field assisted thermal emission. Sensors 2017, 17, 473. [Google Scholar] [CrossRef] [PubMed]
- Liu, Y.; Zhang, J. Model study of the influence of ambient temperature and installation types on surface temperature measurement by using a fiber bragg grating sensor. Sensors 2016, 16, 975. [Google Scholar] [CrossRef] [PubMed]
- Chen, C.-C.; Chen, C.-L.; Lin, Y. All-digital time-domain CMOS smart temperature sensor with on-chip linearity enhancement. Sensors 2016, 16, 176. [Google Scholar] [CrossRef] [PubMed]
- Akella Kamakshi, D.; Shrivastava, A.; Calhoun, B.H. A 0.2 V, 23 nW CMOS temperature sensor for ultra-low-power IoT applications. J. Low Power Electr. Appl. 2016, 6, 10. [Google Scholar] [CrossRef]
- Ascorbe, J.; Corres, J.M.; Arregui, F.J.; Matias, I.R. Humidity sensor based on bragg gratings developed on the end facet of an optical fiber by sputtering of one single material. Sensors 2017, 17, 991. [Google Scholar] [CrossRef] [PubMed]
- Zhang, Y.; Hou, Y.; Liu, W.; Zhang, H.; Zhang, Y.; Zhang, Z.; Guo, J.; Liu, J.; Zhang, L.; Tan, Q.-L. A cost-effective relative humidity sensor based on side coupling induction technology. Sensors 2017, 17, 944. [Google Scholar] [CrossRef] [PubMed]
- Martínez, M.A.; Andújar, J.M.; Enrique, J.M. A new and inexpensive pyranometer for the visible spectral range. Sensors 2009, 9, 4615–4634. [Google Scholar] [CrossRef] [PubMed]
- Mestre, G.; Ruano, A.; Duarte, H.; Silva, S.; Khosravani, H.; Pesteh, S.; Ferreira, P.M.; Horta, R. An intelligent weather station. Sensors 2015, 15, 31005–31022. [Google Scholar] [CrossRef] [PubMed]
- Shin, M.-S.; Rhee, K.-N.; Yu, J.-Y.; Jung, G.-J. Determination of equivalent thermal conductivity of window spacers in consideration of condensation prevention and energy saving performance. Energies 2017, 10, 717. [Google Scholar] [CrossRef]
- Oh, J.H.; Yoo, H.J.; Kim, S.S. Evaluation of strategies to improve the thermal performance of steel frames in curtain wall systems. Energies 2016, 9, 1055. [Google Scholar] [CrossRef]
- Niaz, M.T.; Imdad, F.; Kim, H.S. Power consumption efficiency evaluation of multi-user full-duplex visible light communication systems for smart home technologies. Energies 2017, 10, 254. [Google Scholar] [CrossRef]
- Sorensen, L.S. Energy renovation of buildings utilizing the U-value meter, a new heat loss measuring device. Sustainability 2010, 2, 461–474. [Google Scholar] [CrossRef]
- Rasooli, A.; Itard, L.; Ferreira, C.I. A response factor-based method for the rapid in-situ determination of wall’s thermal resistance in existing buildings. Energy Build. 2016, 119, 51–61. [Google Scholar] [CrossRef]
- International Organization for Standardization. Building Components and Building Elements. Thermal Resistance and Thermal Transmittance. Calculation Method; ISO Standard 6946; International Organization for Standardization: Geneva, Switzerland, 2007; Available online: https://www.iso.org/obp/ui/#iso:std:iso:6946:ed-2:v1:en (accessed on 15 March 2017).
- Ficco, G.; Iannetta, F.; Ianniello, E.; Alfano, F.R.d.A.; Dell’Isola, M. U-value in situ measurement for energy diagnosis of existing buildings. Energy Build. 2015, 104, 108–121. [Google Scholar] [CrossRef]
- Ballarini, I.; Corgnati, S.P.; Corrado, V. Use of reference buildings to assess the energy saving potentials of the residential building stock: The experience of tabula project. Energy Policy 2014, 68, 273–284. [Google Scholar] [CrossRef]
- British Standards Institution. Building Materials and Products—Hygrothermal Properties—Tabulated Design Values and Procedures for Determining Declared and Design Thermal Values (ISO 10456:2007); British Standards Institution: Lodon, UK, 2007. [Google Scholar]
- Gaspar, K.; Casals, M.; Gangolells, M. A comparison of standardized calculation methods for in situ measurements of façades U-value. Energy Build. 2016, 130, 592–599. [Google Scholar] [CrossRef]
- Deconinck, A.-H.; Roels, S. Comparison of characterisation methods determining the thermal resistance of building components from onsite measurements. Energy Build. 2016, 130, 309–320. [Google Scholar] [CrossRef]
- Lucchi, E. Thermal transmittance of historical brick masonries: A comparison among standard data, analytical calculation procedures, and in situ heat flow meter measurements. Energy Build. 2017, 134, 171–184. [Google Scholar] [CrossRef]
- International Organization for Standardization. Thermal Insulation. Building Elements. In Situ Measurement of Thermal Resistance and Thermal Transmittance. Part 1: Heat Flow Metre Method; ISO Standard 9869-1; International Organization for Standardization: Geneva, Switzerland, 2014; Available online: http://www.iso.org/iso/catalogue_detail.htm?csnumber=59697 (accessed on 15 March 2017).
- Evangelisti, L.; Guattari, C.; Gori, P.; Vollaro, R.D.L. In situ thermal transmittance measurements for investigating differences between wall models and actual building performance. Sustainability 2015, 7, 10388–10398. [Google Scholar] [CrossRef]
- Albatici, R.; Passerini, F.; Tonelli, A.M.; Gialanella, S. Assessment of the thermal emissivity value of building materials using an infrared thermovision technique emissometer. Energy Build. 2013, 66, 33–40. [Google Scholar] [CrossRef]
- Ohlsson, K.; Olofsson, T. Quantitative infrared thermography imaging of the density of heat flow rate through a building element surface. Appl. Energy 2014, 134, 499–505. [Google Scholar] [CrossRef]
- Albatici, R.; Tonelli, A.M.; Chiogna, M. A comprehensive experimental approach for the validation of quantitative infrared thermography in the evaluation of building thermal transmittance. Appl. Energy 2015, 141, 218–228. [Google Scholar] [CrossRef]
- Bohórquez, M.A.M.; Gómez, J.M.E.; Márquez, J.M.A. A new and inexpensive temperature-measuring system: Application to photovoltaic solar facilities. Sol. Energy 2009, 83, 883–890. [Google Scholar] [CrossRef]
- Martínez, M.A.; Andújar, J.M.; Enrique, J.M. Temperature measurement in PV facilities on a per-panel scale. Sensors 2014, 14, 13308–13323. [Google Scholar] [CrossRef] [PubMed]
- Salamone, F.; Belussi, L.; Danza, L.; Ghellere, M.; Meroni, I. An open source low-cost wireless control system for a forced circulation solar plant. Sensors 2015, 15, 27990–28004. [Google Scholar] [CrossRef] [PubMed]
- Marques, G.; Pitarma, R. An indoor monitoring system for ambient assisted living based on Internet of Things architecture. Int. J. Environ. Res. Public Health 2016, 13, 1152. [Google Scholar] [CrossRef] [PubMed]
- IEEE 802.15 WPANTM Task Group 4 (TG4). Available online: http://www.ieee802.org/15/pub/TG4.html (accessed on 15 March 2017).
- Zigbee Alliance. Available online: http://www.zigbee.org/ (accessed on 15 March 2017).
- Raspberry Pi Org. Available online: https://www.raspberrypi.org/ (accessed on 15 March 2017).
- Sparkfun. Xbee Pro Series. Available online: https://www.sparkfun.com/datasheets/Wireless/Zigbee/XBee-Datasheet.pdf (accessed on 15 March 2017).
- Salamone, F.; Belussi, L.; Danza, L.; Galanos, T.; Ghellere, M.; Meroni, I. Design and development of a nearable wireless system to control indoor air quality and indoor lighting quality. Sensors 2017, 17, 1021. [Google Scholar] [CrossRef] [PubMed]
- Lockridge, G.; Dzwonkowski, B.; Nelson, R.; Powers, S. Development of a low-cost arduino-based sonde for coastal applications. Sensors 2016, 16, 528. [Google Scholar] [CrossRef] [PubMed]
- Arduino Uno. Available online: https://www.arduino.cc/en/main/arduinoBoardUno (accessed on 15 March 2017).
- DS 2438, Maxim Smart Battery Monitor. Available online: https://www.maximintegrated.com/en/products/power/battery-management/DS2438.html (accessed on 15 March 2017).
© 2017 by the authors. Licensee MDPI, Basel, Switzerland. This article is an open access article distributed under the terms and conditions of the Creative Commons Attribution (CC BY) license (http://creativecommons.org/licenses/by/4.0/).