Validation of a High Sampling Rate Inertial Measurement Unit for Acceleration During Running


Abstract
1. Introduction
2. Methods
2.1. Subject
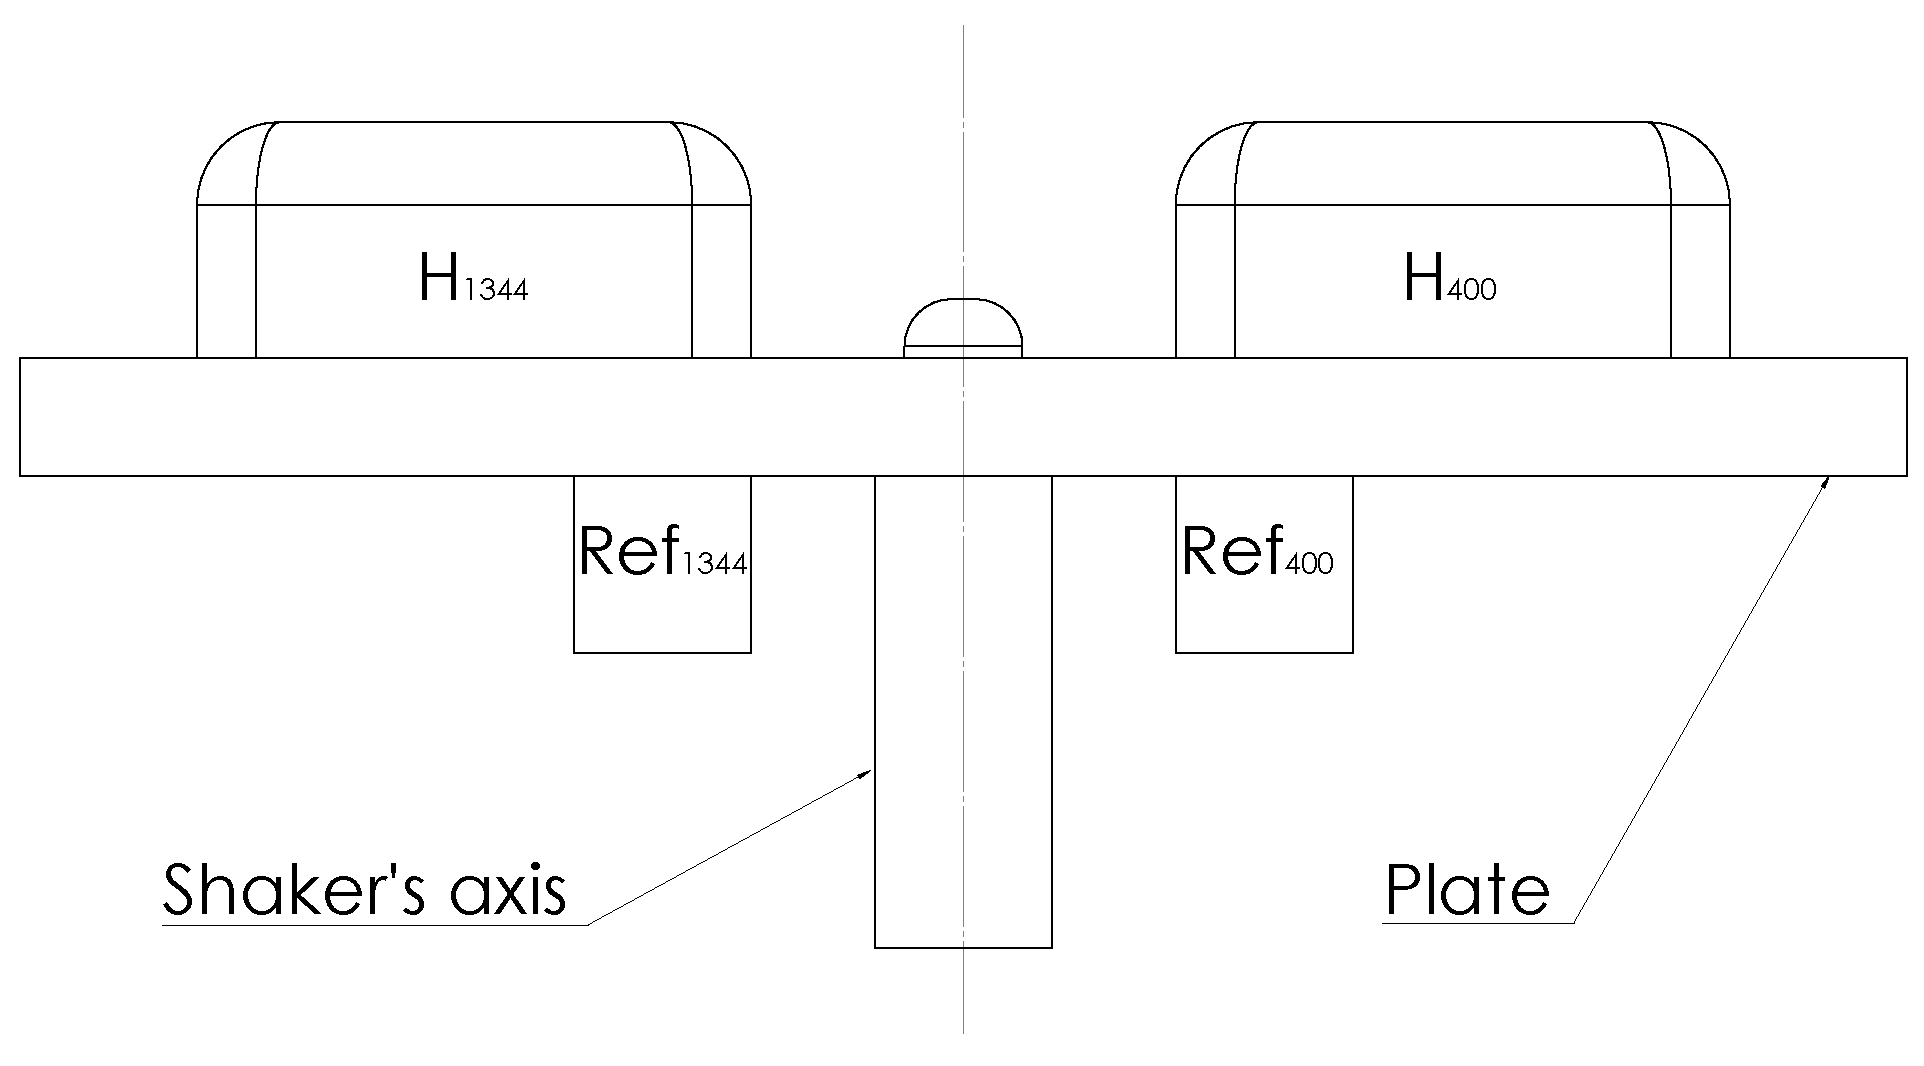
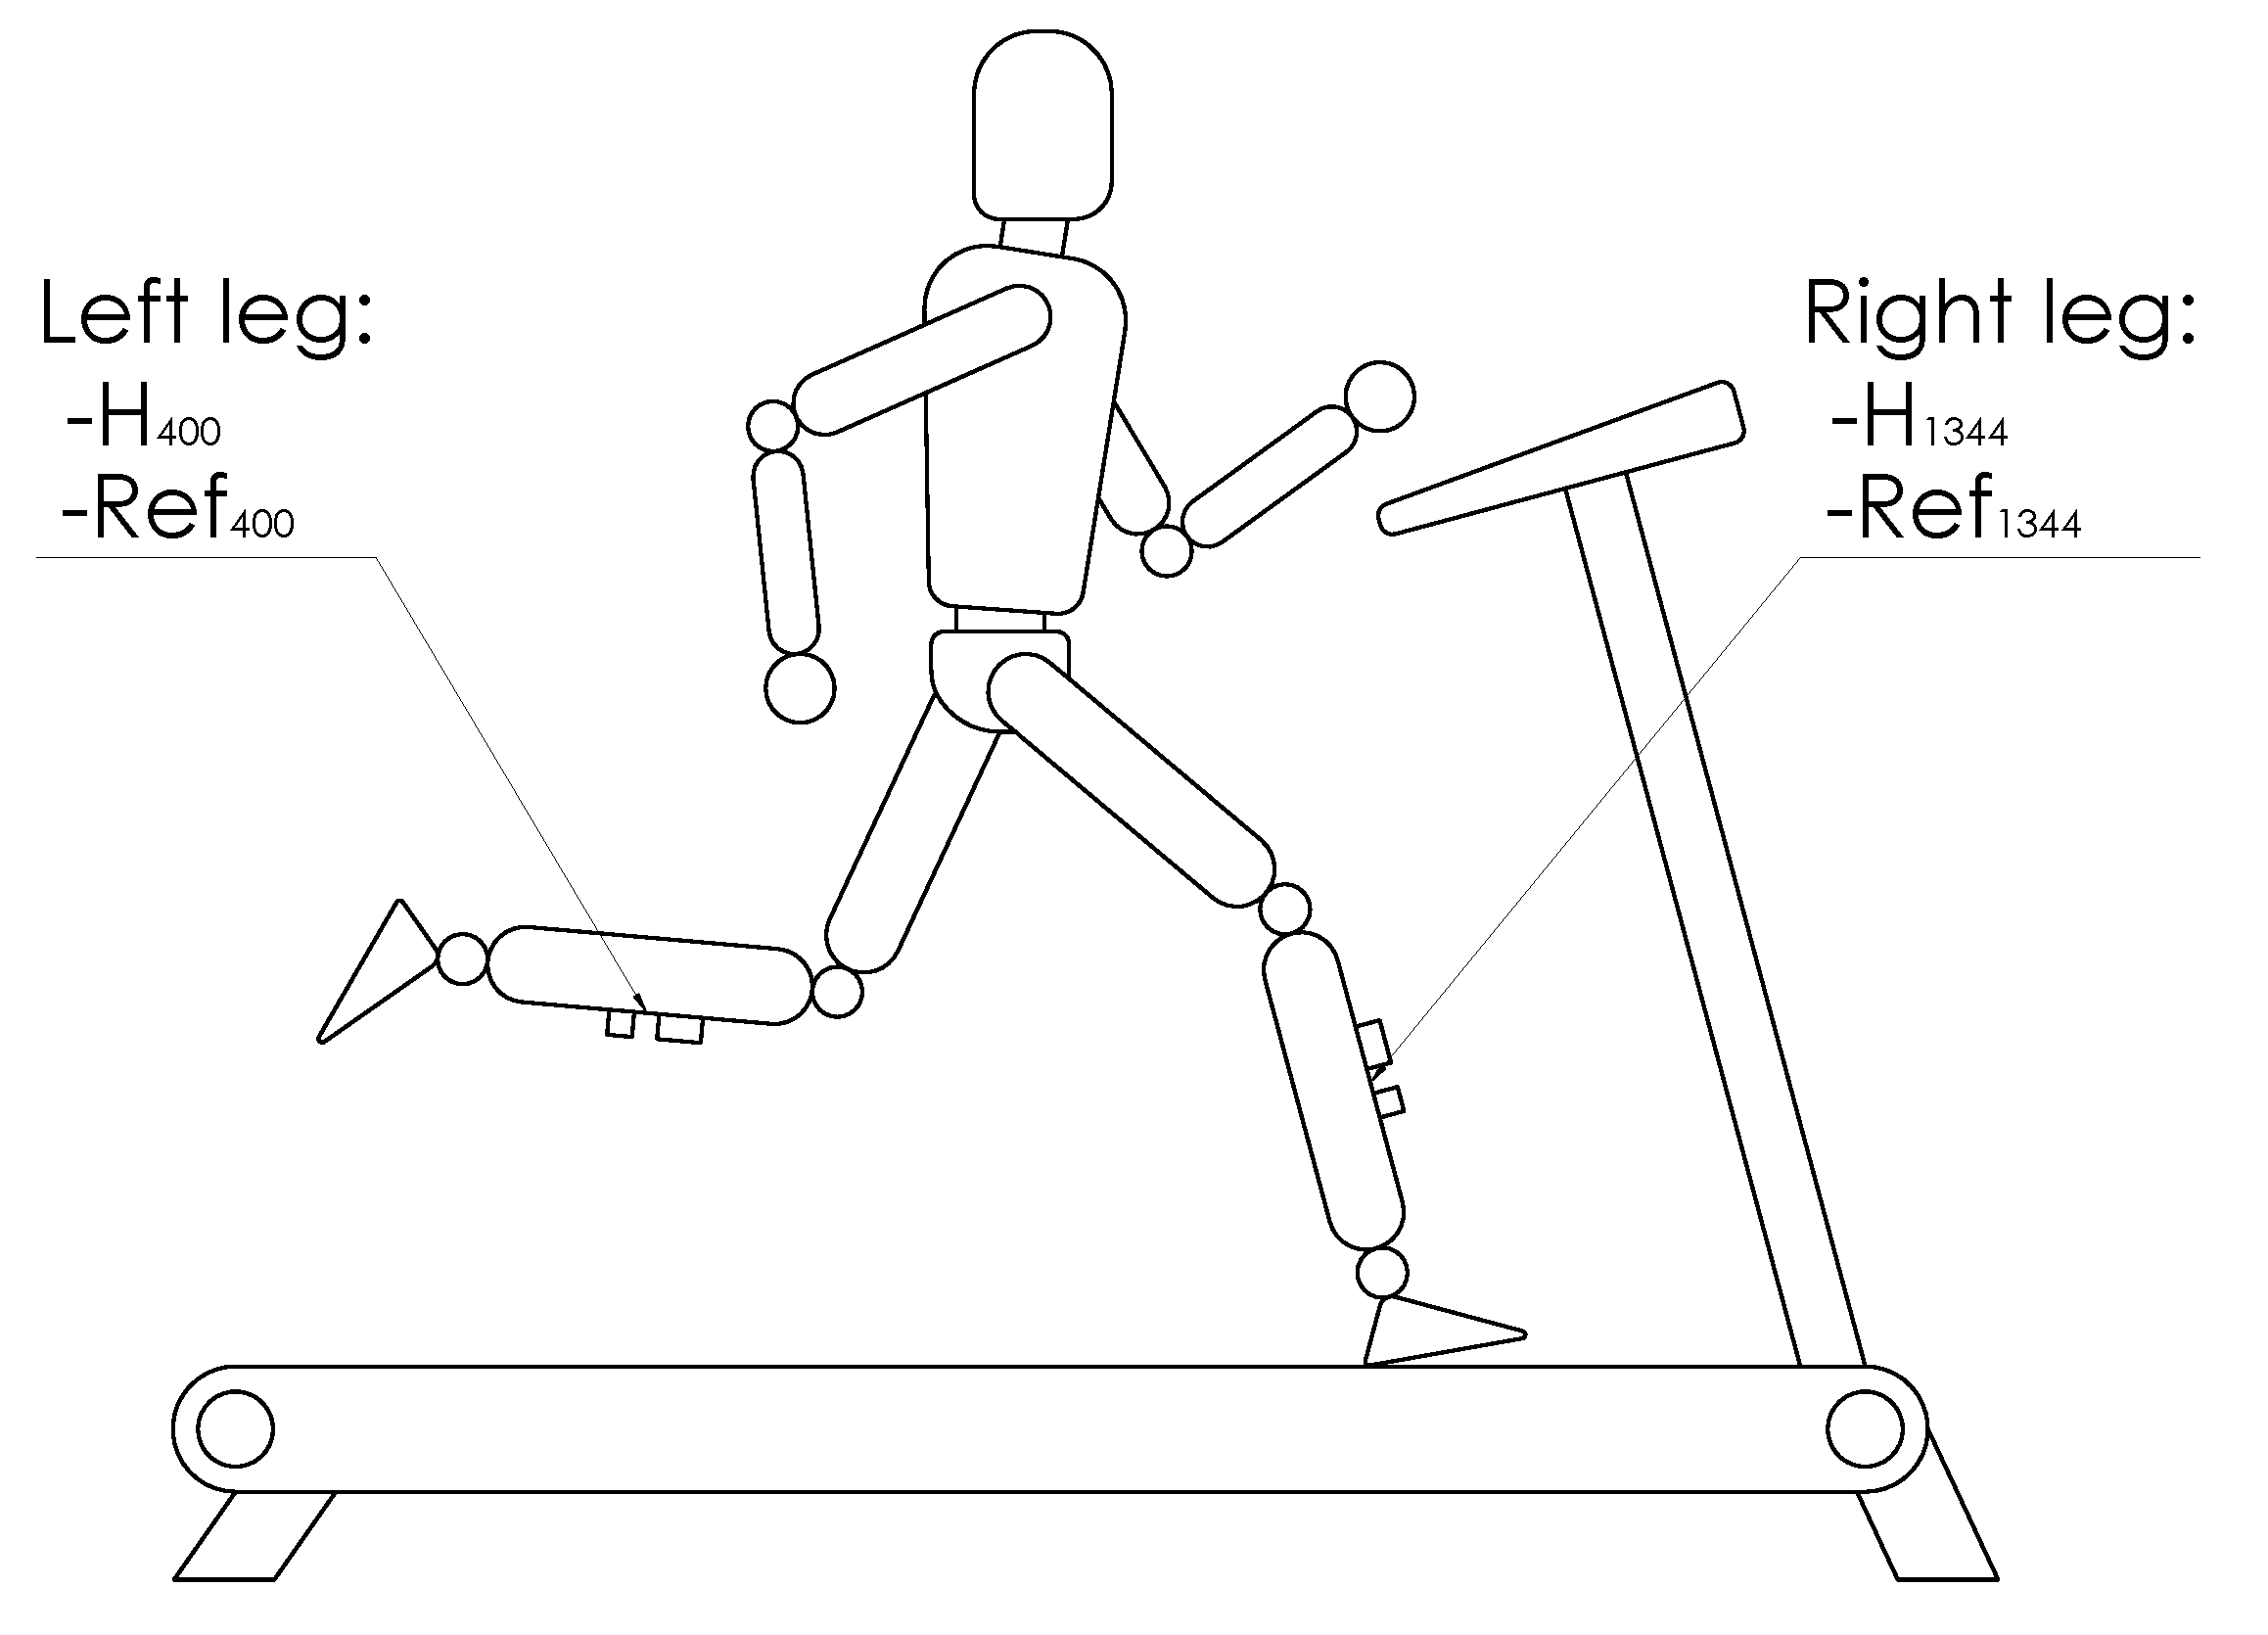
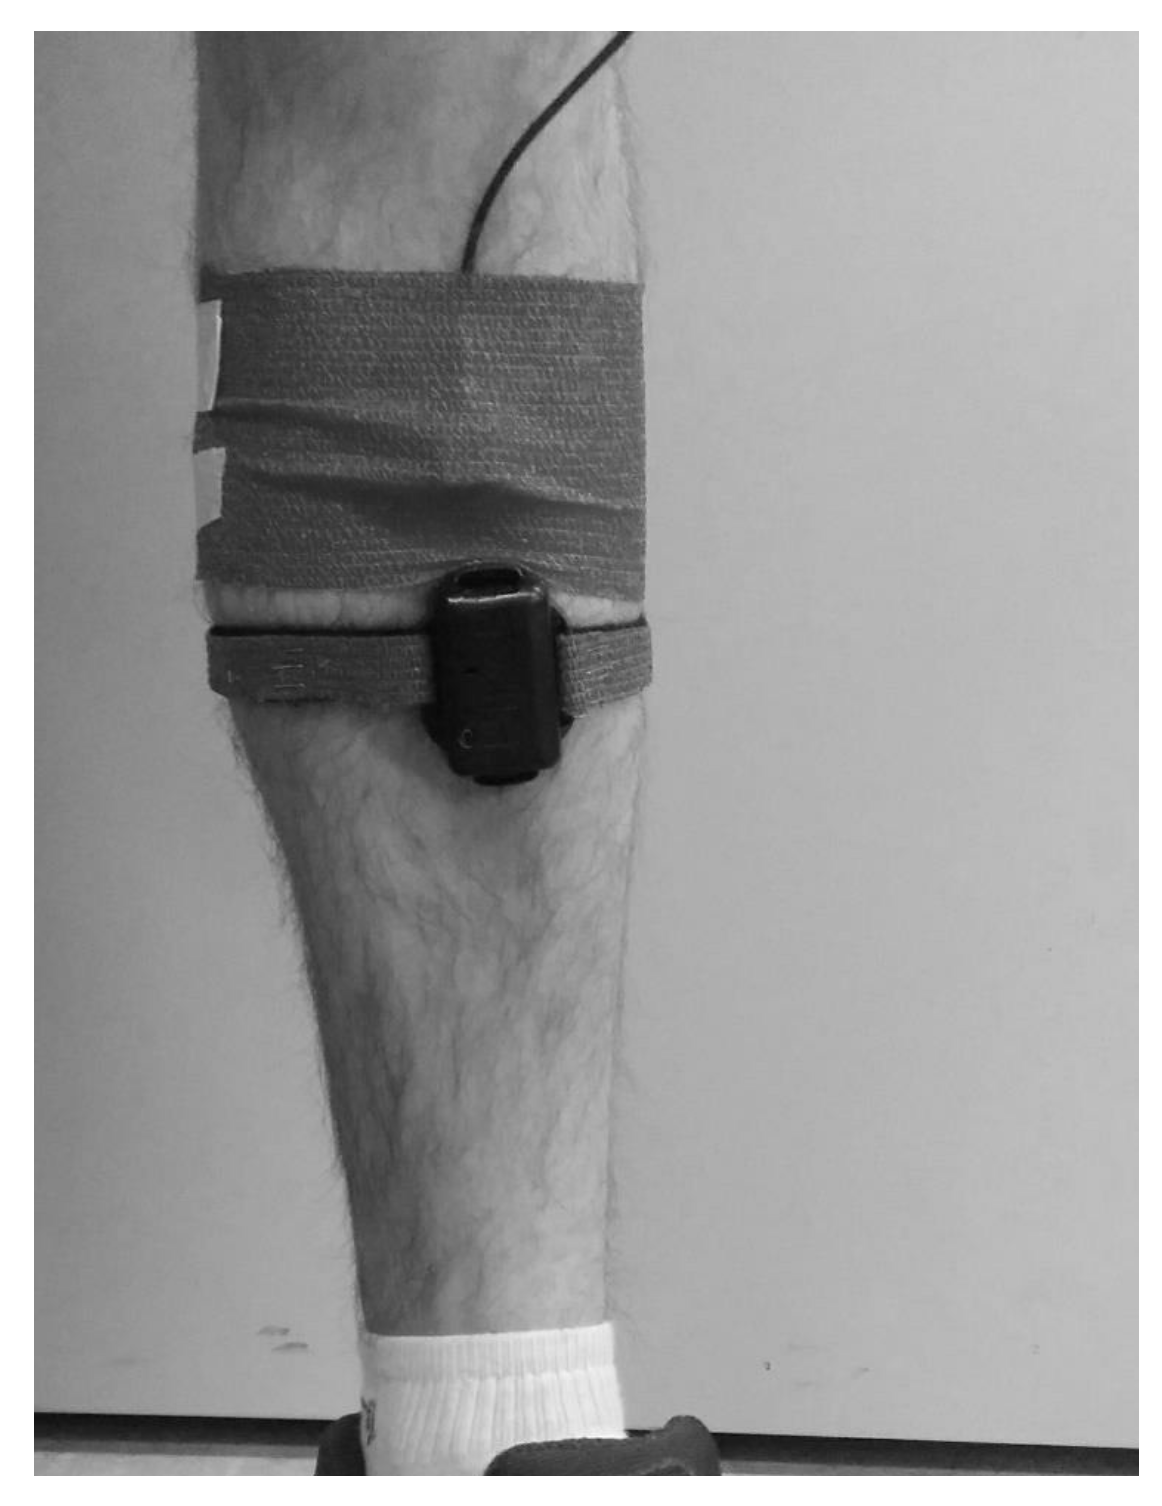
2.2. Protocols
2.3. Data Analysis
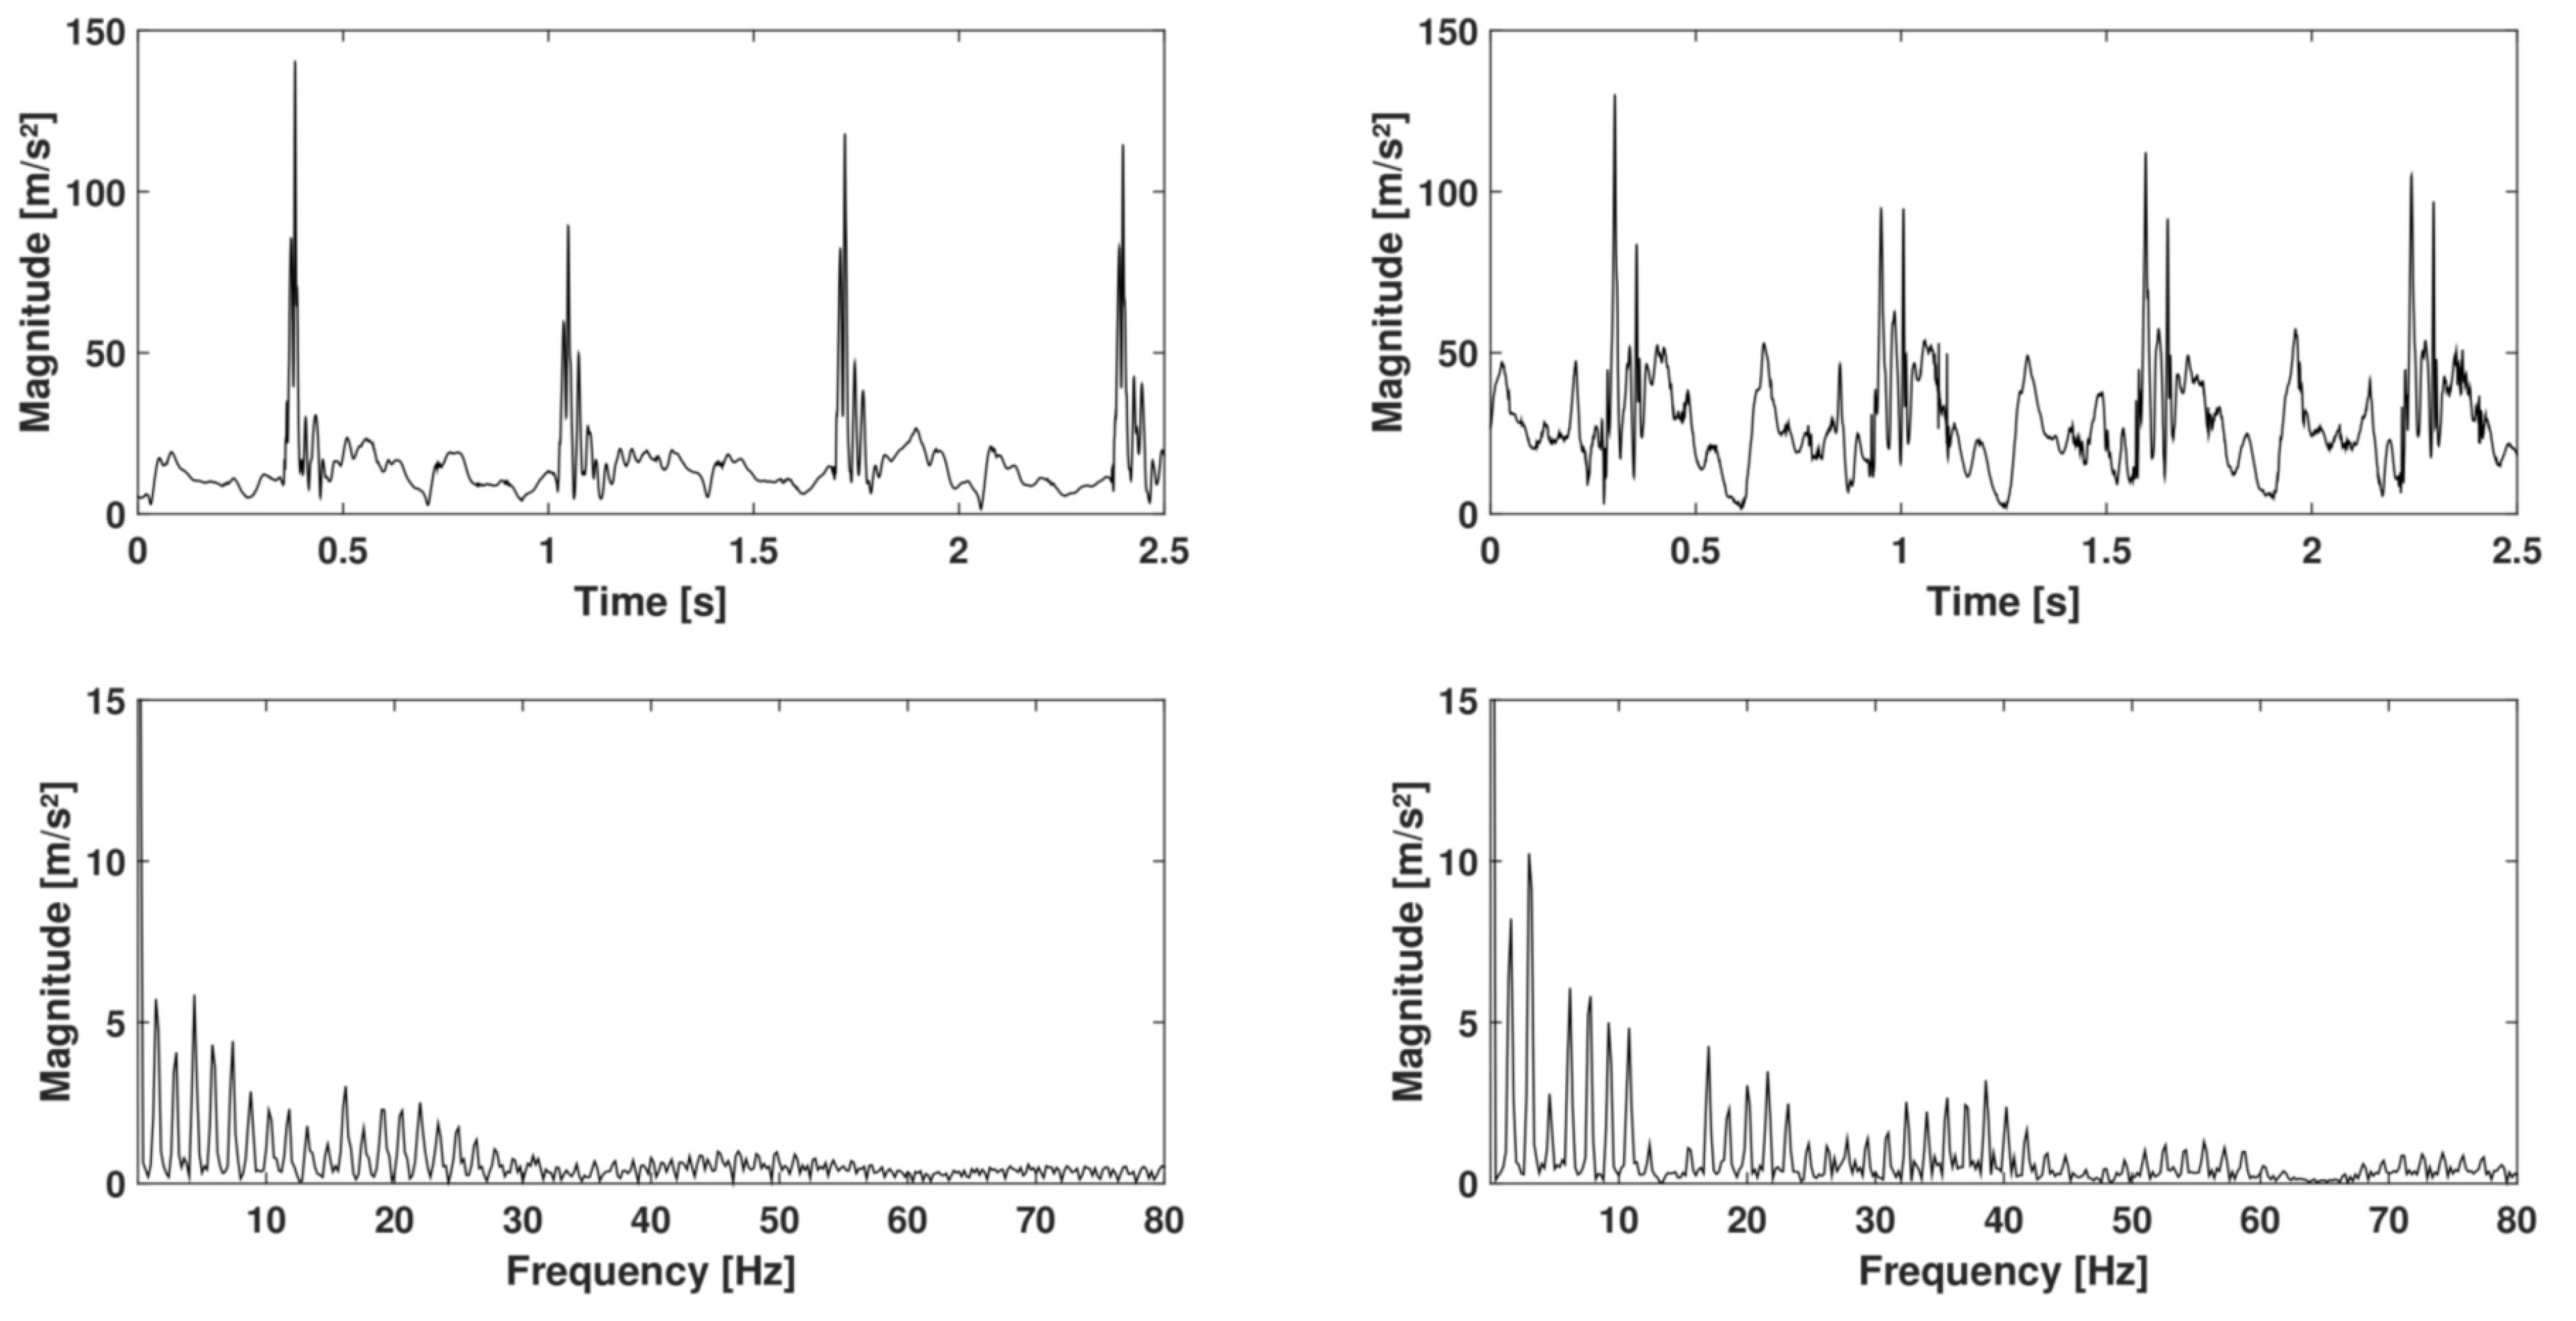
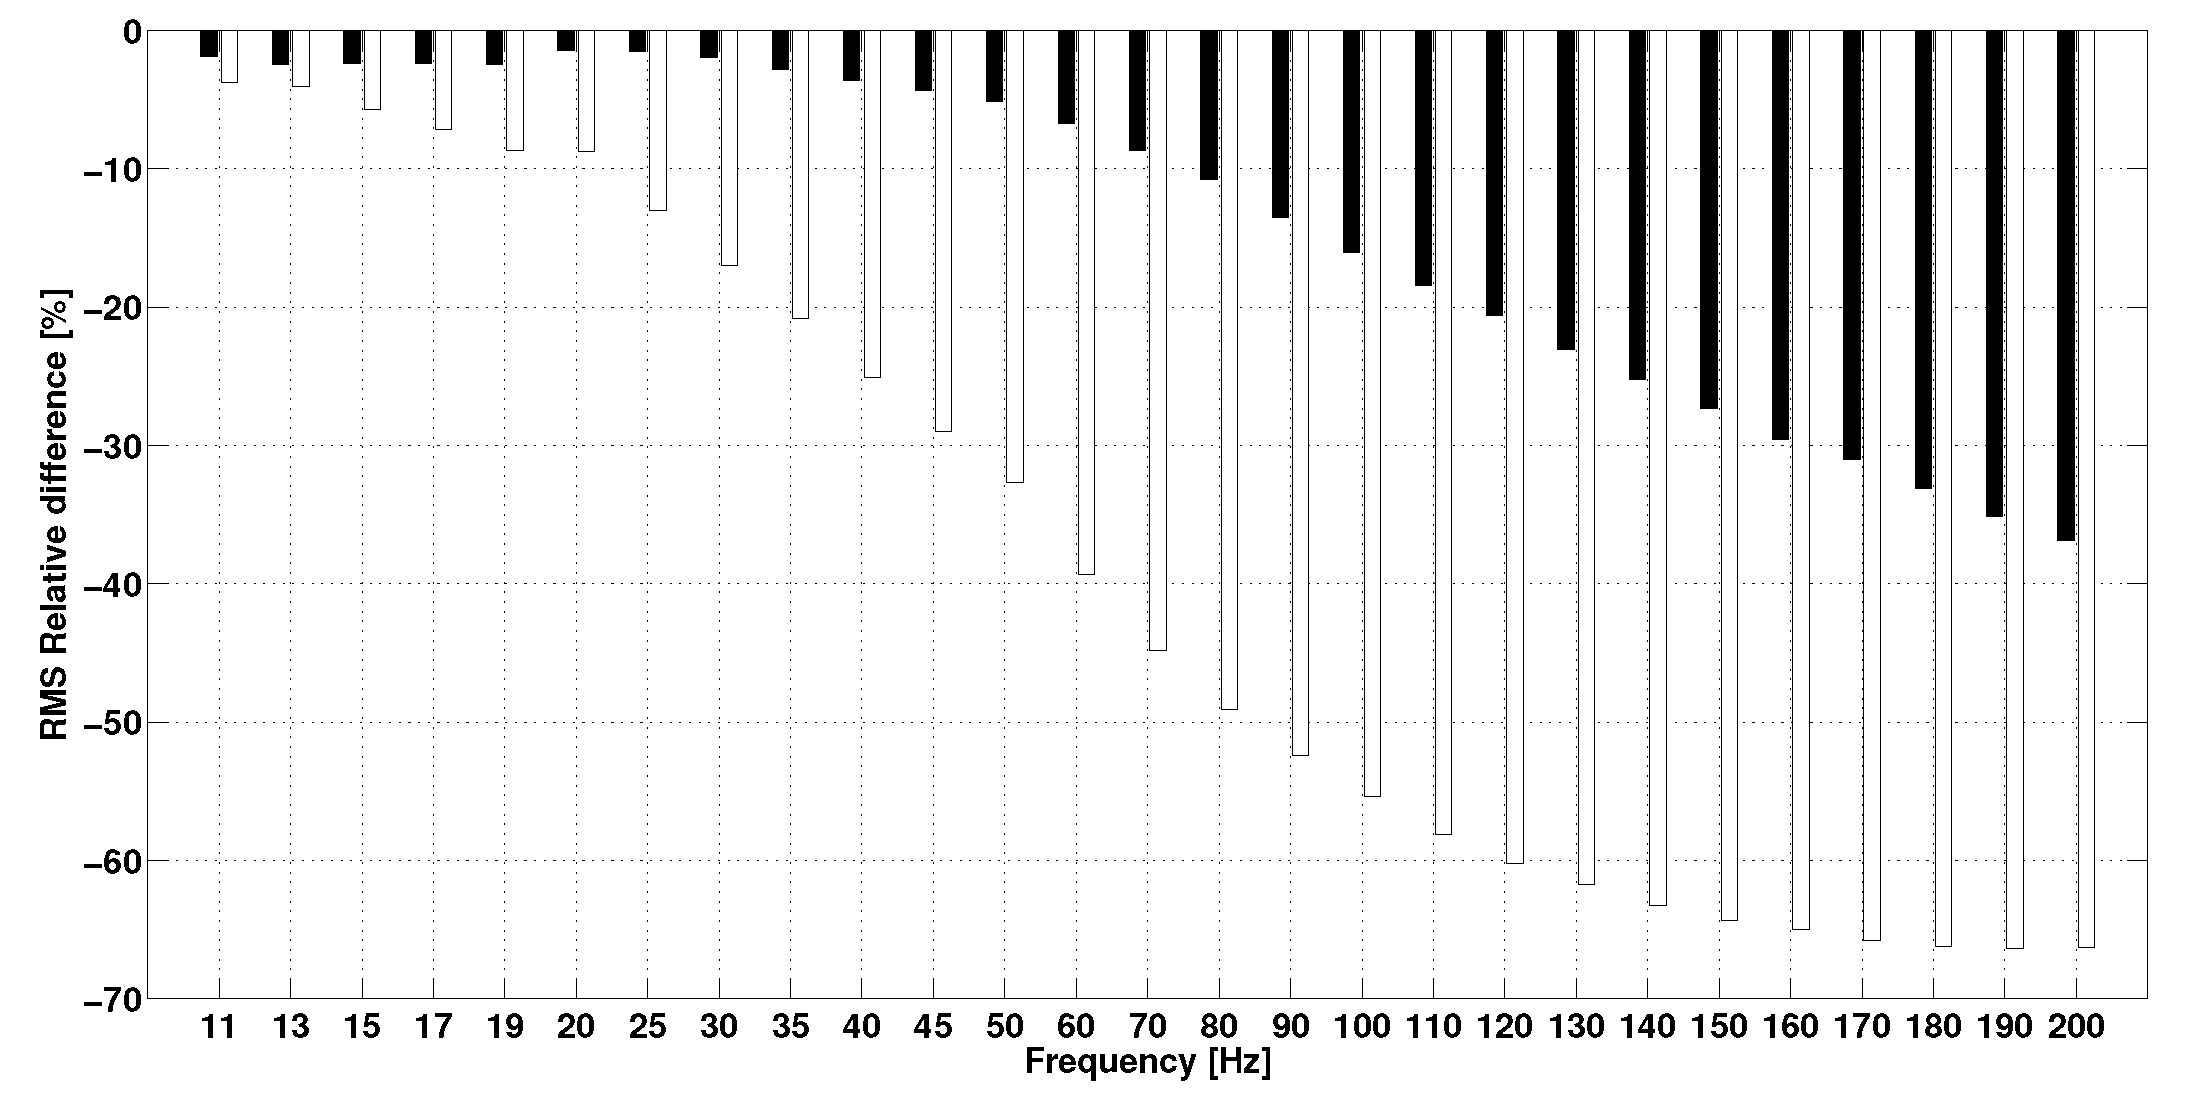
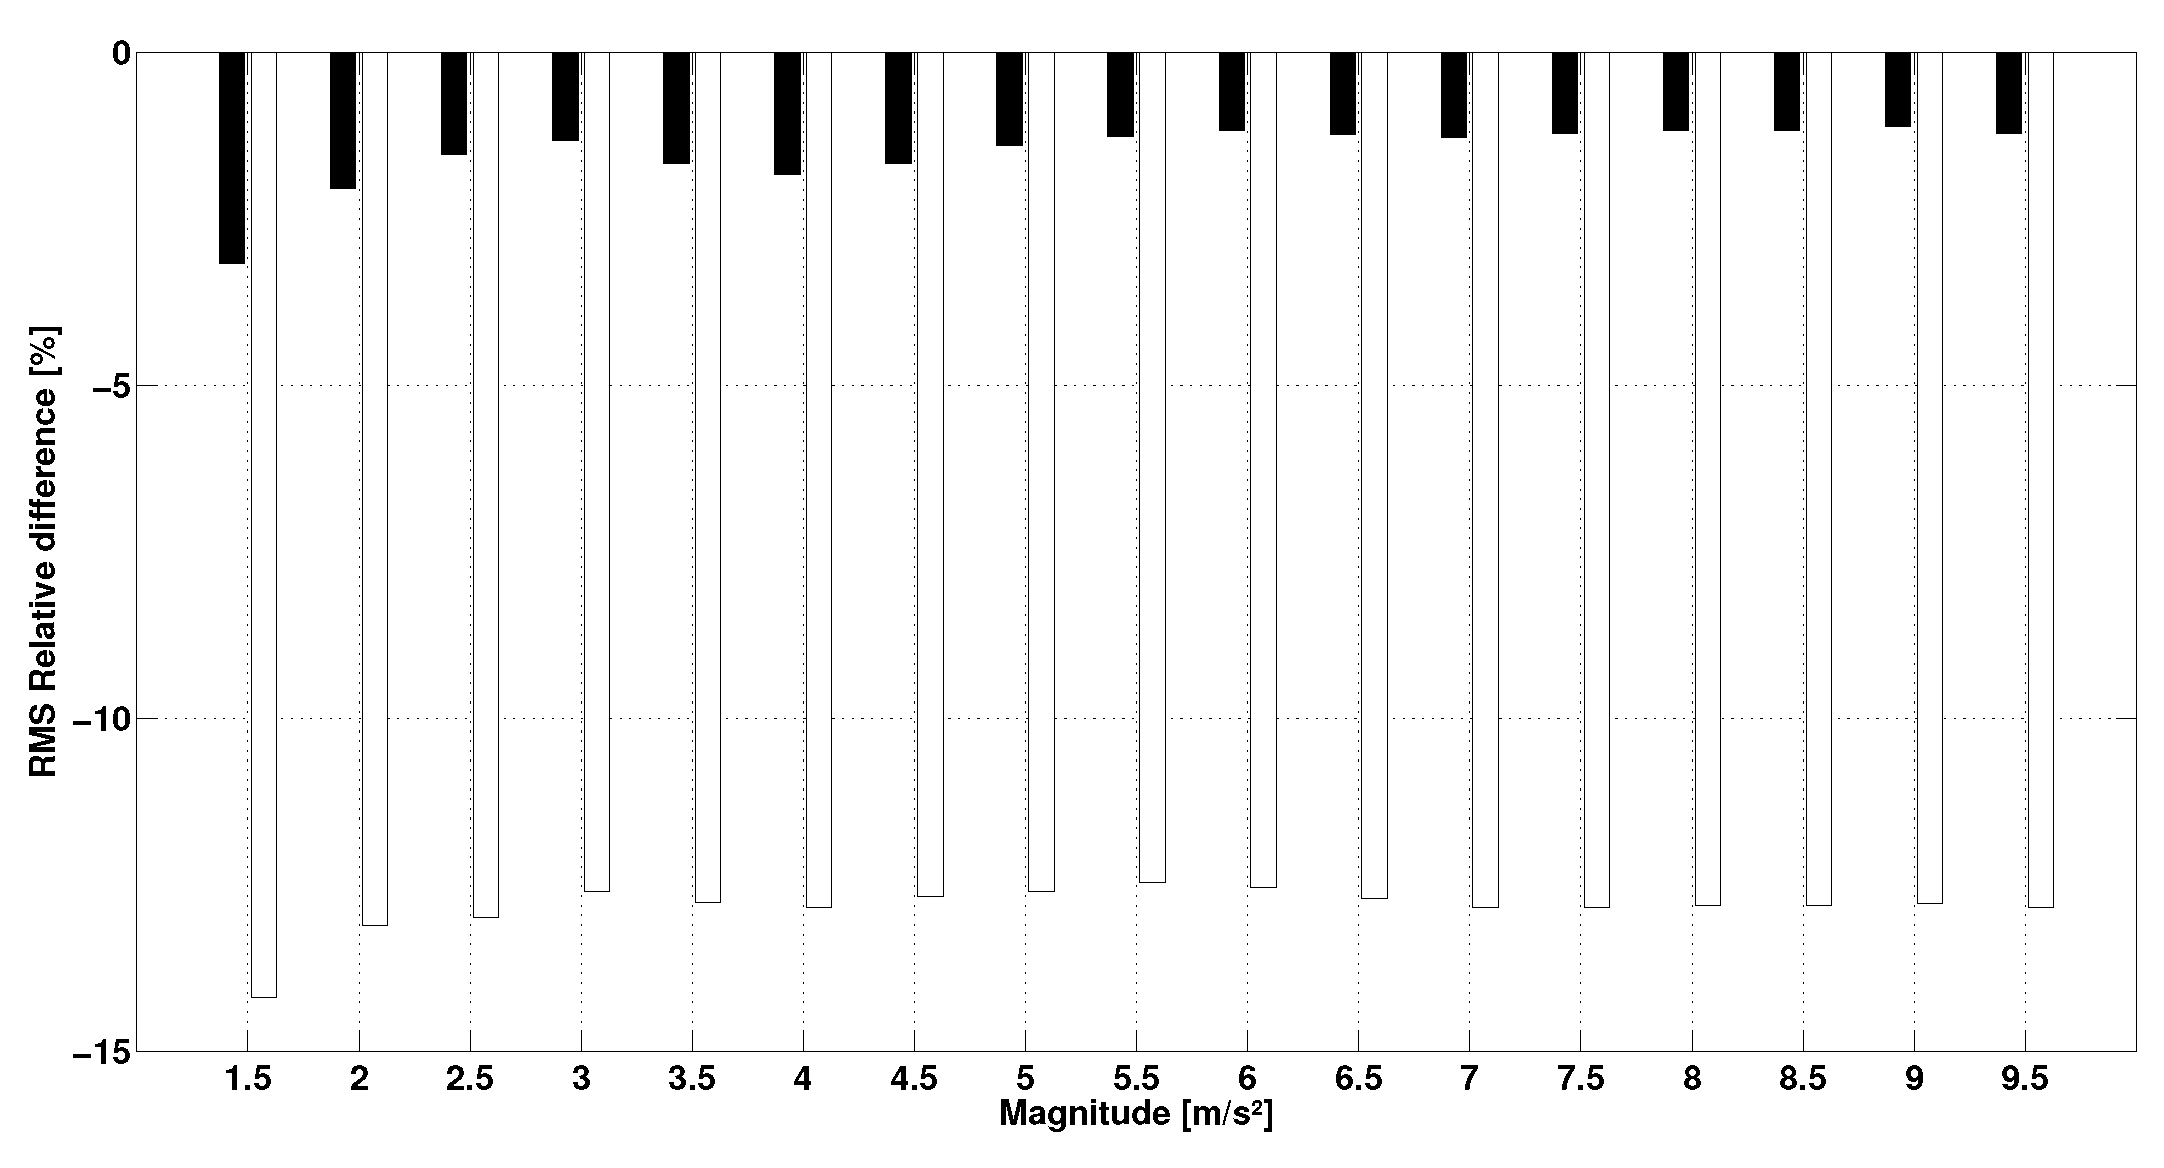
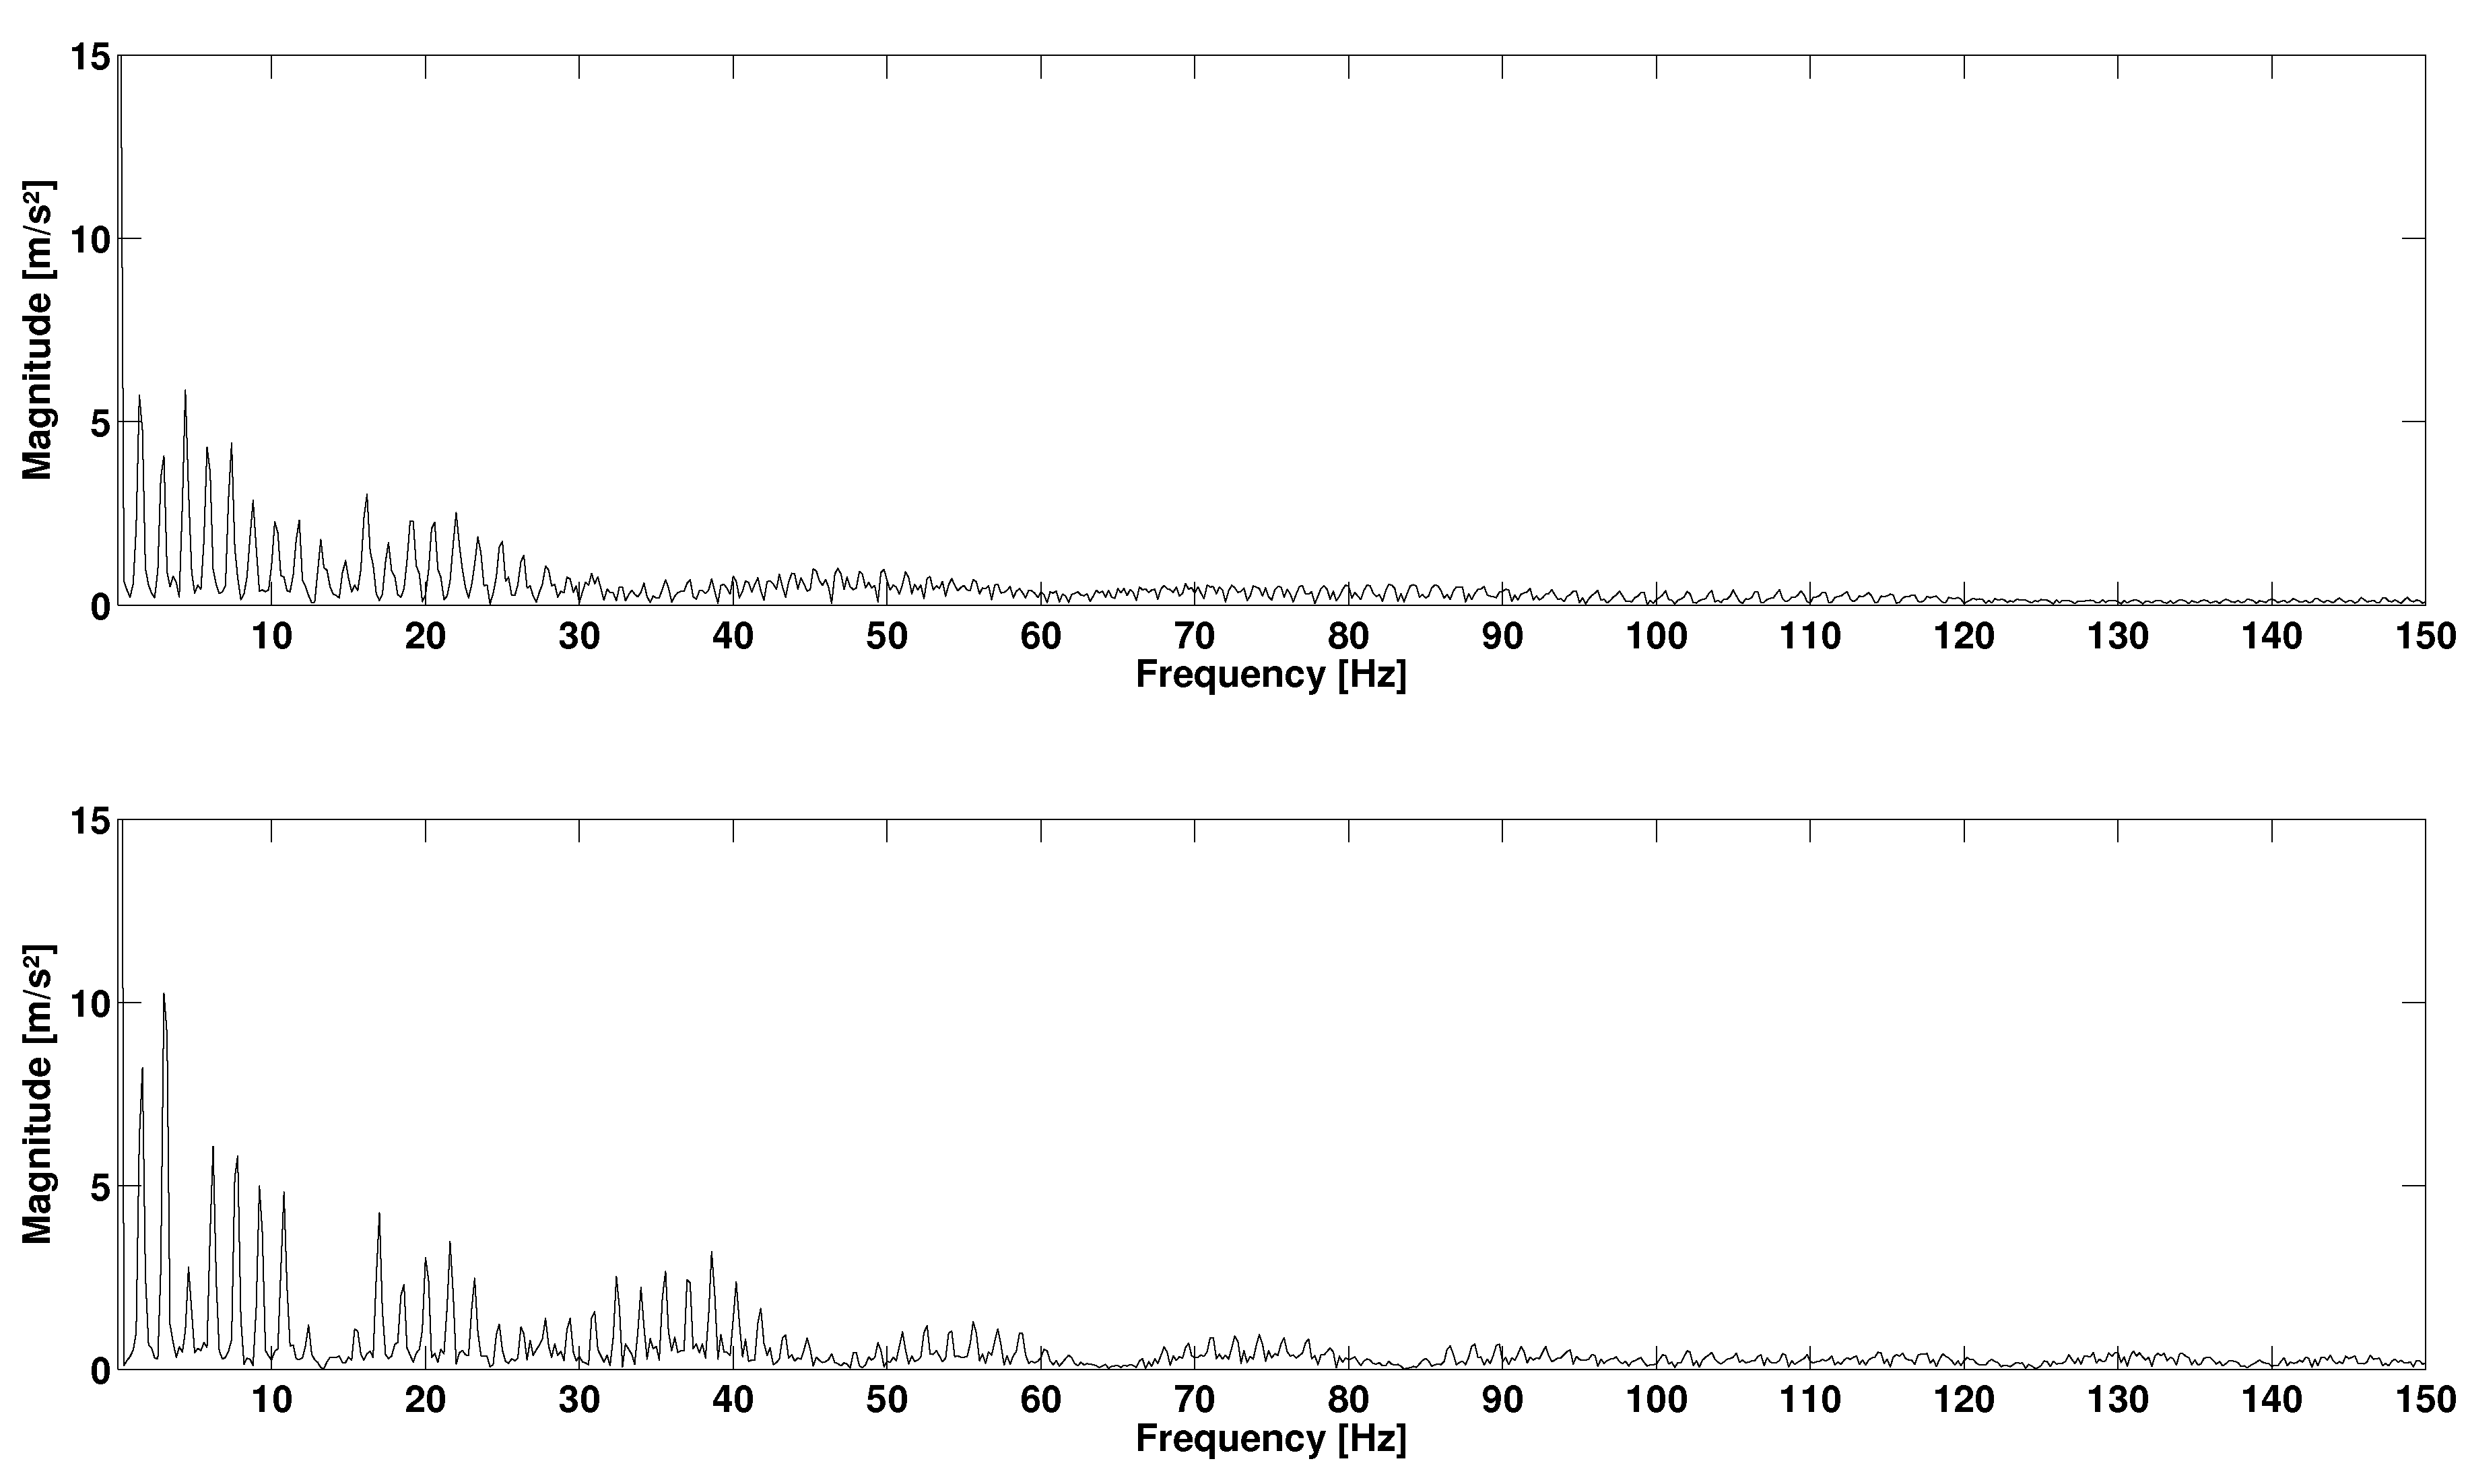
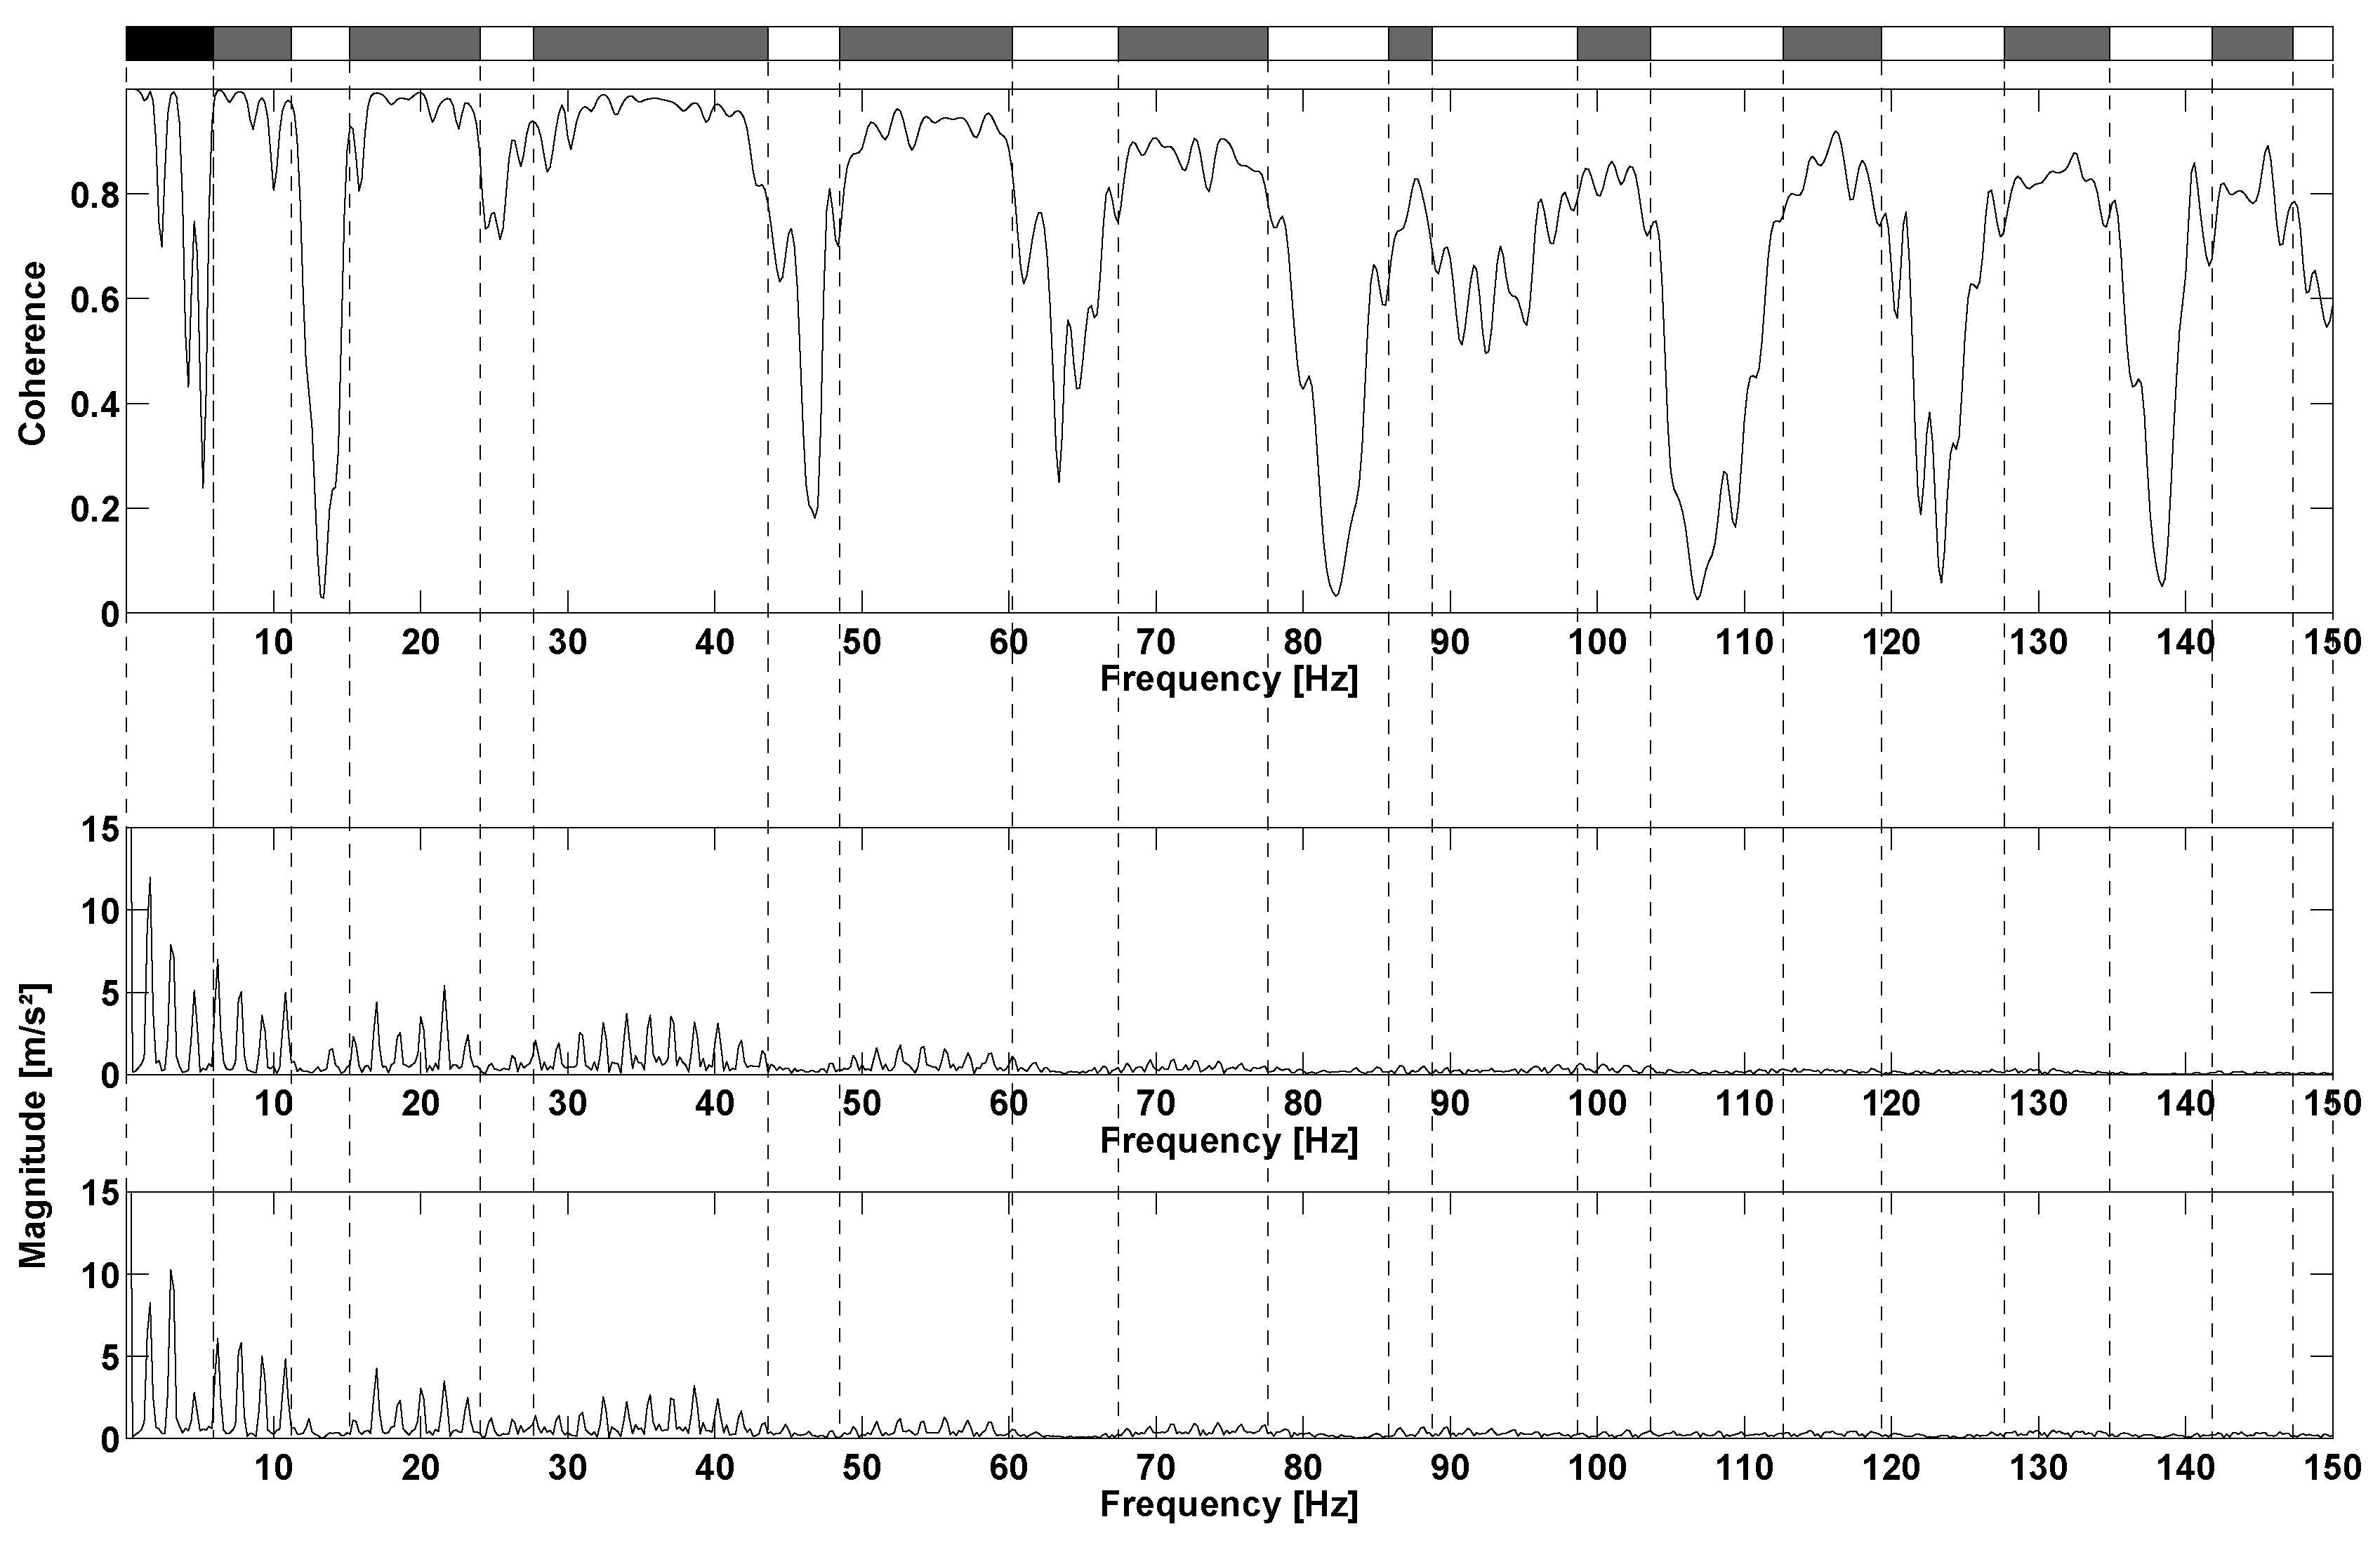
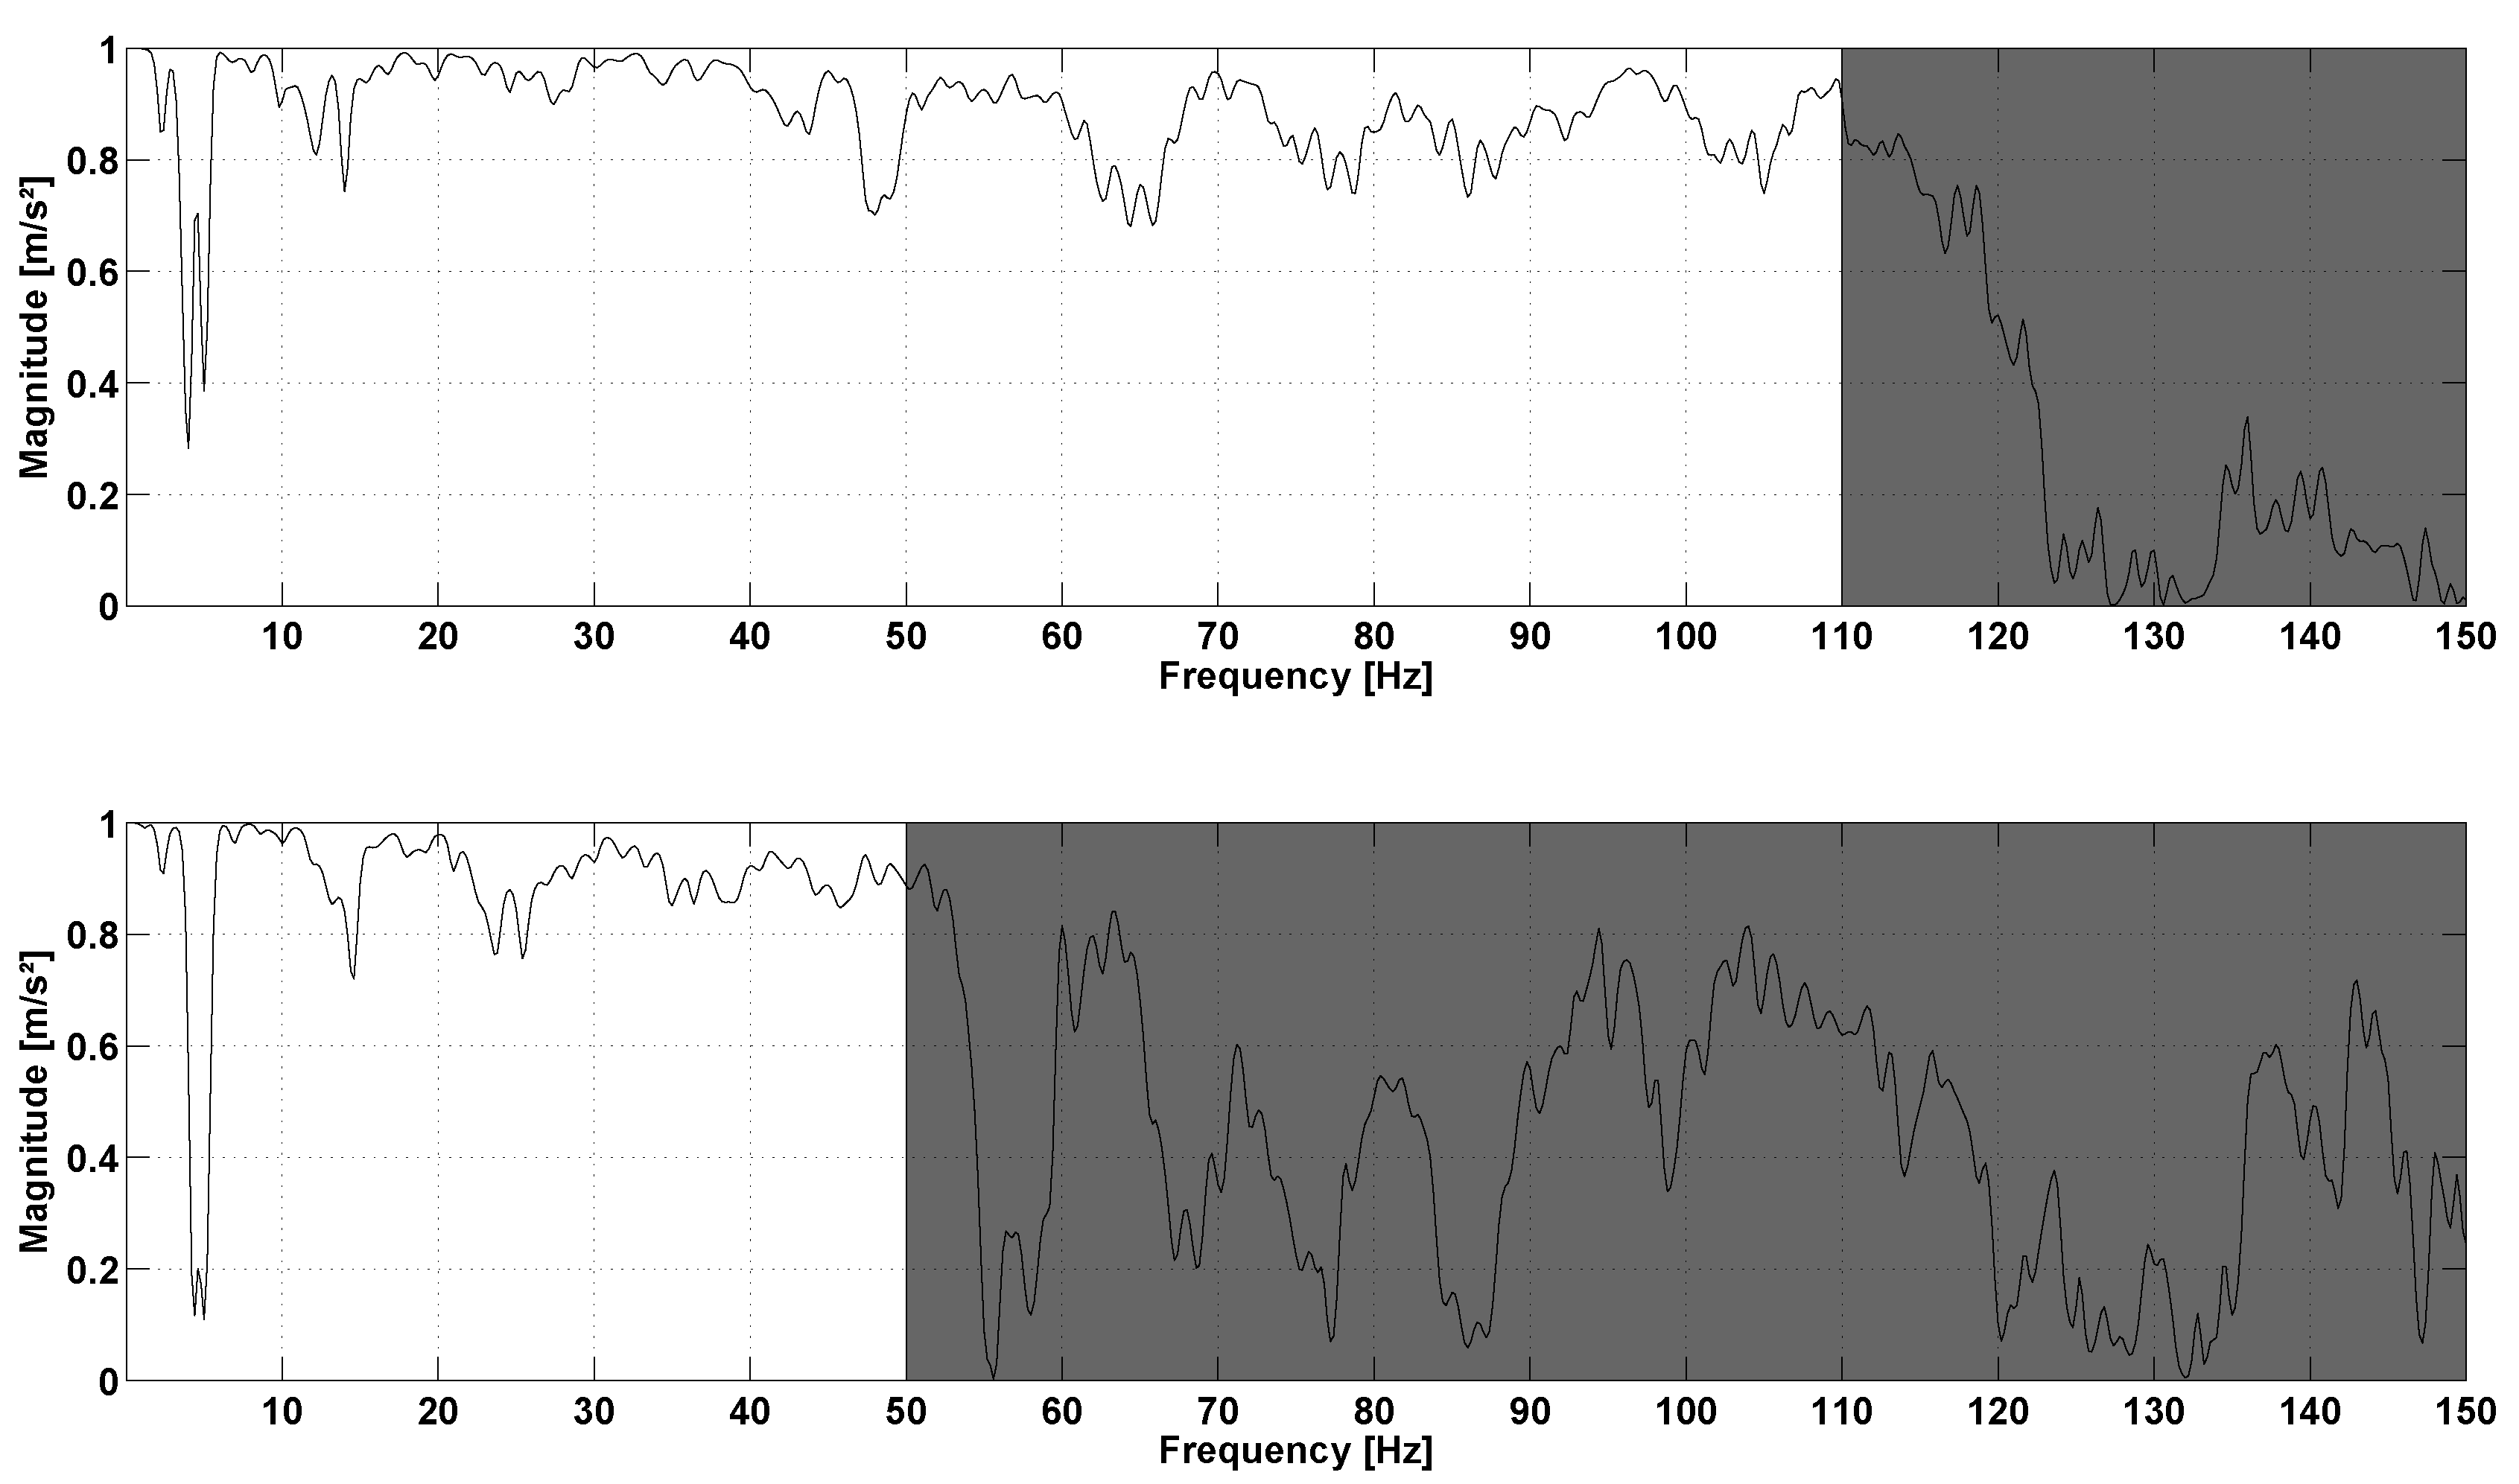
3. Results
4. Discussions
5. Conclusions
Acknowledgments
Author Contributions
Conflicts of Interest
Ethical Statements
References
- Ainsworth, B.E.; Macera, C.A. Physical Activity and Public Health Practice; CRC Press: Boca Raton, FL, USA; p. 343.
- Baarveld, F.; Visser, C.A.N.; Kollen, B.J.; Backx, F.J.G. Sports-related injuries in primary health care. Fam. Pract. 2011, 28, 29–33. [Google Scholar] [CrossRef] [PubMed]
- Hespanhol Junior, L.C.; Barboza, S.D.; van Mechelen, W.; Verhagen, E. Measuring sports injuries on the pitch: A guide to use in practice. Braz. J. Phys. Ther. 2015, 19, 369–380. [Google Scholar] [CrossRef] [PubMed]
- Fredericson, M.; Misra, A.K. Epidemiology and aetiology of marathon running injuries. Sports Med. 2007, 37, 437–439. [Google Scholar] [CrossRef] [PubMed]
- Van Mechelen, W. Running injuries. A review of the epidemiological literature. Sports Med. 1992, 14, 320–335. [Google Scholar] [CrossRef] [PubMed]
- Taunton, J.E. A retrospective case-control analysis of 2002 running injuries. Br. J. Sports Med. 2002, 36, 95–101. [Google Scholar] [CrossRef] [PubMed]
- Bahr, R. Understanding injury mechanisms: A key component of preventing injuries in sport. Br. J. Sports Med. 2005, 39, 324–329. [Google Scholar] [CrossRef] [PubMed]
- Hreljac, A. Impact and overuse injuries in runners. Med. Sci. Sports Exerc. 2004, 36, 845–849. [Google Scholar] [CrossRef] [PubMed]
- Voloshin, A.; Wosk, J. An in vivo study of low back pain and shock absorption in the human locomotor system. J. Biomech. 1982, 15, 21–27. [Google Scholar] [CrossRef]
- Pohl, M.B.; Mullineaux, D.R.; Milner, C.E.; Hamill, J.; Davis, I.S. Biomechanical predictors of retrospective tibial stress fractures in runners. J. Biomech. 2008, 41, 1160–1165. [Google Scholar] [CrossRef] [PubMed]
- Milner, C.E.; Ferber, R.; Pollard, C.D.; Hamill, J.; Davis, I.S. Biomechanical Factors Associated with Tibial Stress Fracture in Female Runners. Med. Sci. Sports Exerc. 2006, 38, 323–328. [Google Scholar] [CrossRef] [PubMed]
- Mizrahi, J.; Verbitsky, O.; Isakov, E.; Daily, D. Effect of fatigue on leg kinematics and impact acceleration in long distance running. Hum. Mov. Sci. 2000, 19, 139–151. [Google Scholar] [CrossRef]
- Friesenbichler, B.; Stirling, L.M.; Federolf, P.; Nigg, B.M. Tissue vibration in prolonged running. J. Biomech. 2011, 44, 116–120. [Google Scholar] [CrossRef] [PubMed]
- Lee, J.B.; Sutter, K.J.; Askew, C.D.; Burkett, B.J. Identifying symmetry in running gait using a single inertial sensor. J. Sci. Med. Sport 2010, 13, 559–563. [Google Scholar] [CrossRef] [PubMed]
- Fu, W.; Fang, Y.; Liu, D.M.S.; Wang, L.; Ren, S.; Liu, Y. Surface effects on in-shoe plantar pressure and tibial impact during running. J. Sport Health Sci. 2015, 4, 384–390. [Google Scholar] [CrossRef]
- Hamill, J.; Derrick, T.; Holt, K. Shock attenuation and stride frequency during running. Hum. Mov. Sci. 1995, 14, 45–60. [Google Scholar] [CrossRef]
- Gruber, A.H.; Boyer, K.A.; Derrick, T.R.; Hamill, J. Impact shock frequency components and attenuation in rearfoot and forefoot running. J. Sport Health Sci. 2014, 3, 113–121. [Google Scholar] [CrossRef]
- Bobbert, M.F.; Schamhardt, H.C.; Nigg, B.M. Calculation of vertical ground reaction force estimates during running from positional data. J. Biomech. 1991, 24, 1095–1105. [Google Scholar] [CrossRef]
- Boyd, L.J.; Ball, K.; Aughey, R.J. The reliability of MinimaxX accelerometers for measuring physical activity in Australian football. Int. J. Sports Physiol. Perform. 2011, 6, 311–321. [Google Scholar] [CrossRef] [PubMed]
- Patterson, M.; McGrath, D.; Caulfield, B. Using a tri-axial accelerometer to detect technique breakdown due to fatigue in distance runners: A preliminary perspective. In Proceedings of the 2011 Annual International Conference of the IEEE Engineering in Medicine and Biology Society, Boston, MA, USA, 30 August–3 September 2011; pp. 6511–6514. [Google Scholar]
- Elvin, N.G.; Elvin, A.A.; Arnoczky, S.P. Correlation between ground reaction force and tibial acceleration in vertical jumping. J. Appl. Biomech. 2007, 23, 180–189. [Google Scholar] [CrossRef] [PubMed]
- Busa, M.A.; Lim, J.; van Emmerik, R.E.A.; Hamill, J. Head and Tibial Acceleration as a Function of Stride Frequency and Visual Feedback during Running. PLoS ONE 2016, 11, e0157297. [Google Scholar] [CrossRef] [PubMed]
- Chelius, G.; Braillon, C.; Pasquier, M.; Horvais, N.; Gibollet, R.P.; Espiau, B.; Azevedo Coste, C. A Wearable Sensor Network for Gait Analysis: A Six-Day Experiment of Running Through the Desert. IEEE/ASME Trans. Mechatron. 2011, 16, 878–883. [Google Scholar] [CrossRef]
- Barrett, R.; Channells, J.; James, D.; Purcell, B. Use of accelerometers for detecting foot-ground contact time during running. In Proceedings of the SPIE Symposium on Microelectronics, MEMS, and Nanotechnology, Brisbane, Australia, 11–14 December 2005. [Google Scholar]
- Neville, J.; Wixted, A.; Rowlands, D.; James, D. Accelerometers: An underutilized resource in sports monitoring. In Proceeding of the 2010 Sixth International Conference on Intelligent Sensors, Sensor Networks and Information Processing, Brisbane, Australia, 7–10 December 2010; pp. 287–290. [Google Scholar]
- Horvais, N.; Giandolini, M. Foot strike pattern during downhill trail running. Footwear Sci. 2013, 5, S26–S27. [Google Scholar] [CrossRef]
- Giandolini, M.; Pavailler, S.; Samozino, P.; Morin, J.B.; Horvais, N. Foot strike pattern and impact continuous measurements during a trail running race: proof of concept in a world-class athlete. Footwear Sci. 2015, 7, 127–137. [Google Scholar] [CrossRef]
- Liu, W. Structural Dynamic Analysis and Testing of Couple Structures. Ph.D. Thesis, University of London, London, UK, 2000. [Google Scholar]
- Ewins, D.J. Modal Testing: Theory and Practice; John Wiley & Sons Inc.: Hoboken, NJ, USA, 1984. [Google Scholar]
- Griffin, M.J. Handbook of Human Vibration; Academic Press: Waltham, MA, USA, 1990. [Google Scholar]
- Winter, D.A. Biomechanics and Motor Control of Human Movement; John Wiley & Sons: New York, NY, USA, 1990. [Google Scholar]
- Decker, C.; Prasad, N.; Kawchuk, G.N. The reproducibility of signals from skin-mounted accelerometers following removal and replacement. Gait Posture 2011, 34, 432–434. [Google Scholar] [CrossRef] [PubMed]
- Lafortune, M.A. Three-dimensional acceleration of the tibia during walking and running. J. Biomech. 1991, 24, 877–886. [Google Scholar] [CrossRef]
- Crowell, H.P.; Milner, C.E.; Hamill, J.; Davis, I.S. Reducing Impact Loading During Running With the Use of Real-Time Visual Feedback. J. Orthop. Sports Phys. Ther. 2010, 40, 206–213. [Google Scholar] [CrossRef] [PubMed]
- Davis, I.; Milner, C.E.; Hamill, J. Does Increased Loading During Running Lead to Tibial Stress Fractures? A Prospective Study. Med. Sci. Sports Exerc. 2004, 36, S58. [Google Scholar]
- Hennig, E.M.; Lafortune, M.A. Relationships between Ground Reaction Force and Tibial Bone Acceleration Parameters. Int. J. Sport Biomech. 1991, 7, 303–309. [Google Scholar] [CrossRef]
- Gross, T.S.; Nelson, R.C. The shock attenuation role of the ankle during landing from a vertical jump. Med. Sci. Sports Exerc. 1988, 20, 506–514. [Google Scholar] [CrossRef] [PubMed]
- Ziegert, J.C.; Lewis, J.L. The Effect of Soft Tissue on Measurements of Vibrational Bone Motion by Skin-Mounted Accelerometers. J. Biomech. Eng. 1979, 101, 218. [Google Scholar] [CrossRef]
- Roberts, J.R.; Jones, R.; Mansfield, N.J.; Rothberg, S.J. Evaluation of vibrotactile sensations in the ‘feel’ of a golf shot. J. Sound Vib. 2005, 285, 303–319. [Google Scholar] [CrossRef]
- Kuchařová, M.; Ďoubal, S.; Klemera, P.; Rejchrt, P.; Navrátil, M. Viscoelasticity of biological materials — Measurement and practical impact on biomedicine. Physiol. Res. 2007, 56, 33–37. [Google Scholar]
- Lucas-Cuevas, A.G.; Encarnación-Martínez, A.; Camacho-García, A.; Llana-Belloch, S.; Pérez-Soriano, P. The location of the tibial accelerometer does influence impact acceleration parameters during running. J. Sports Sci. 2016, 1–5. [Google Scholar] [CrossRef] [PubMed]
- Reenalda, J.; Maartens, E.; Homan, L.; Buurke, J. Continuous three dimensional analysis of running mechanics during a marathon by means of inertial magnetic measurement units to objectify changes in running mechanics. J. Biomech. 2016, 49, 3362–3367. [Google Scholar] [CrossRef] [PubMed]


© 2017 by the authors. Licensee MDPI, Basel, Switzerland. This article is an open access article distributed under the terms and conditions of the Creative Commons Attribution (CC BY) license (http://creativecommons.org/licenses/by/4.0/).
Share and Cite
Provot, T.; Chiementin, X.; Oudin, E.; Bolaers, F.; Murer, S. Validation of a High Sampling Rate Inertial Measurement Unit for Acceleration During Running. Sensors 2017, 17, 1958. https://doi.org/10.3390/s17091958
Provot T, Chiementin X, Oudin E, Bolaers F, Murer S. Validation of a High Sampling Rate Inertial Measurement Unit for Acceleration During Running. Sensors. 2017; 17(9):1958. https://doi.org/10.3390/s17091958
Chicago/Turabian StyleProvot, Thomas, Xavier Chiementin, Emeric Oudin, Fabrice Bolaers, and Sébastien Murer. 2017. "Validation of a High Sampling Rate Inertial Measurement Unit for Acceleration During Running" Sensors 17, no. 9: 1958. https://doi.org/10.3390/s17091958
APA StyleProvot, T., Chiementin, X., Oudin, E., Bolaers, F., & Murer, S. (2017). Validation of a High Sampling Rate Inertial Measurement Unit for Acceleration During Running. Sensors, 17(9), 1958. https://doi.org/10.3390/s17091958