Investigation into the Effect of Acoustic Radiation Force and Acoustic Streaming on Particle Patterning in Acoustic Standing Wave Fields

 , and
, and 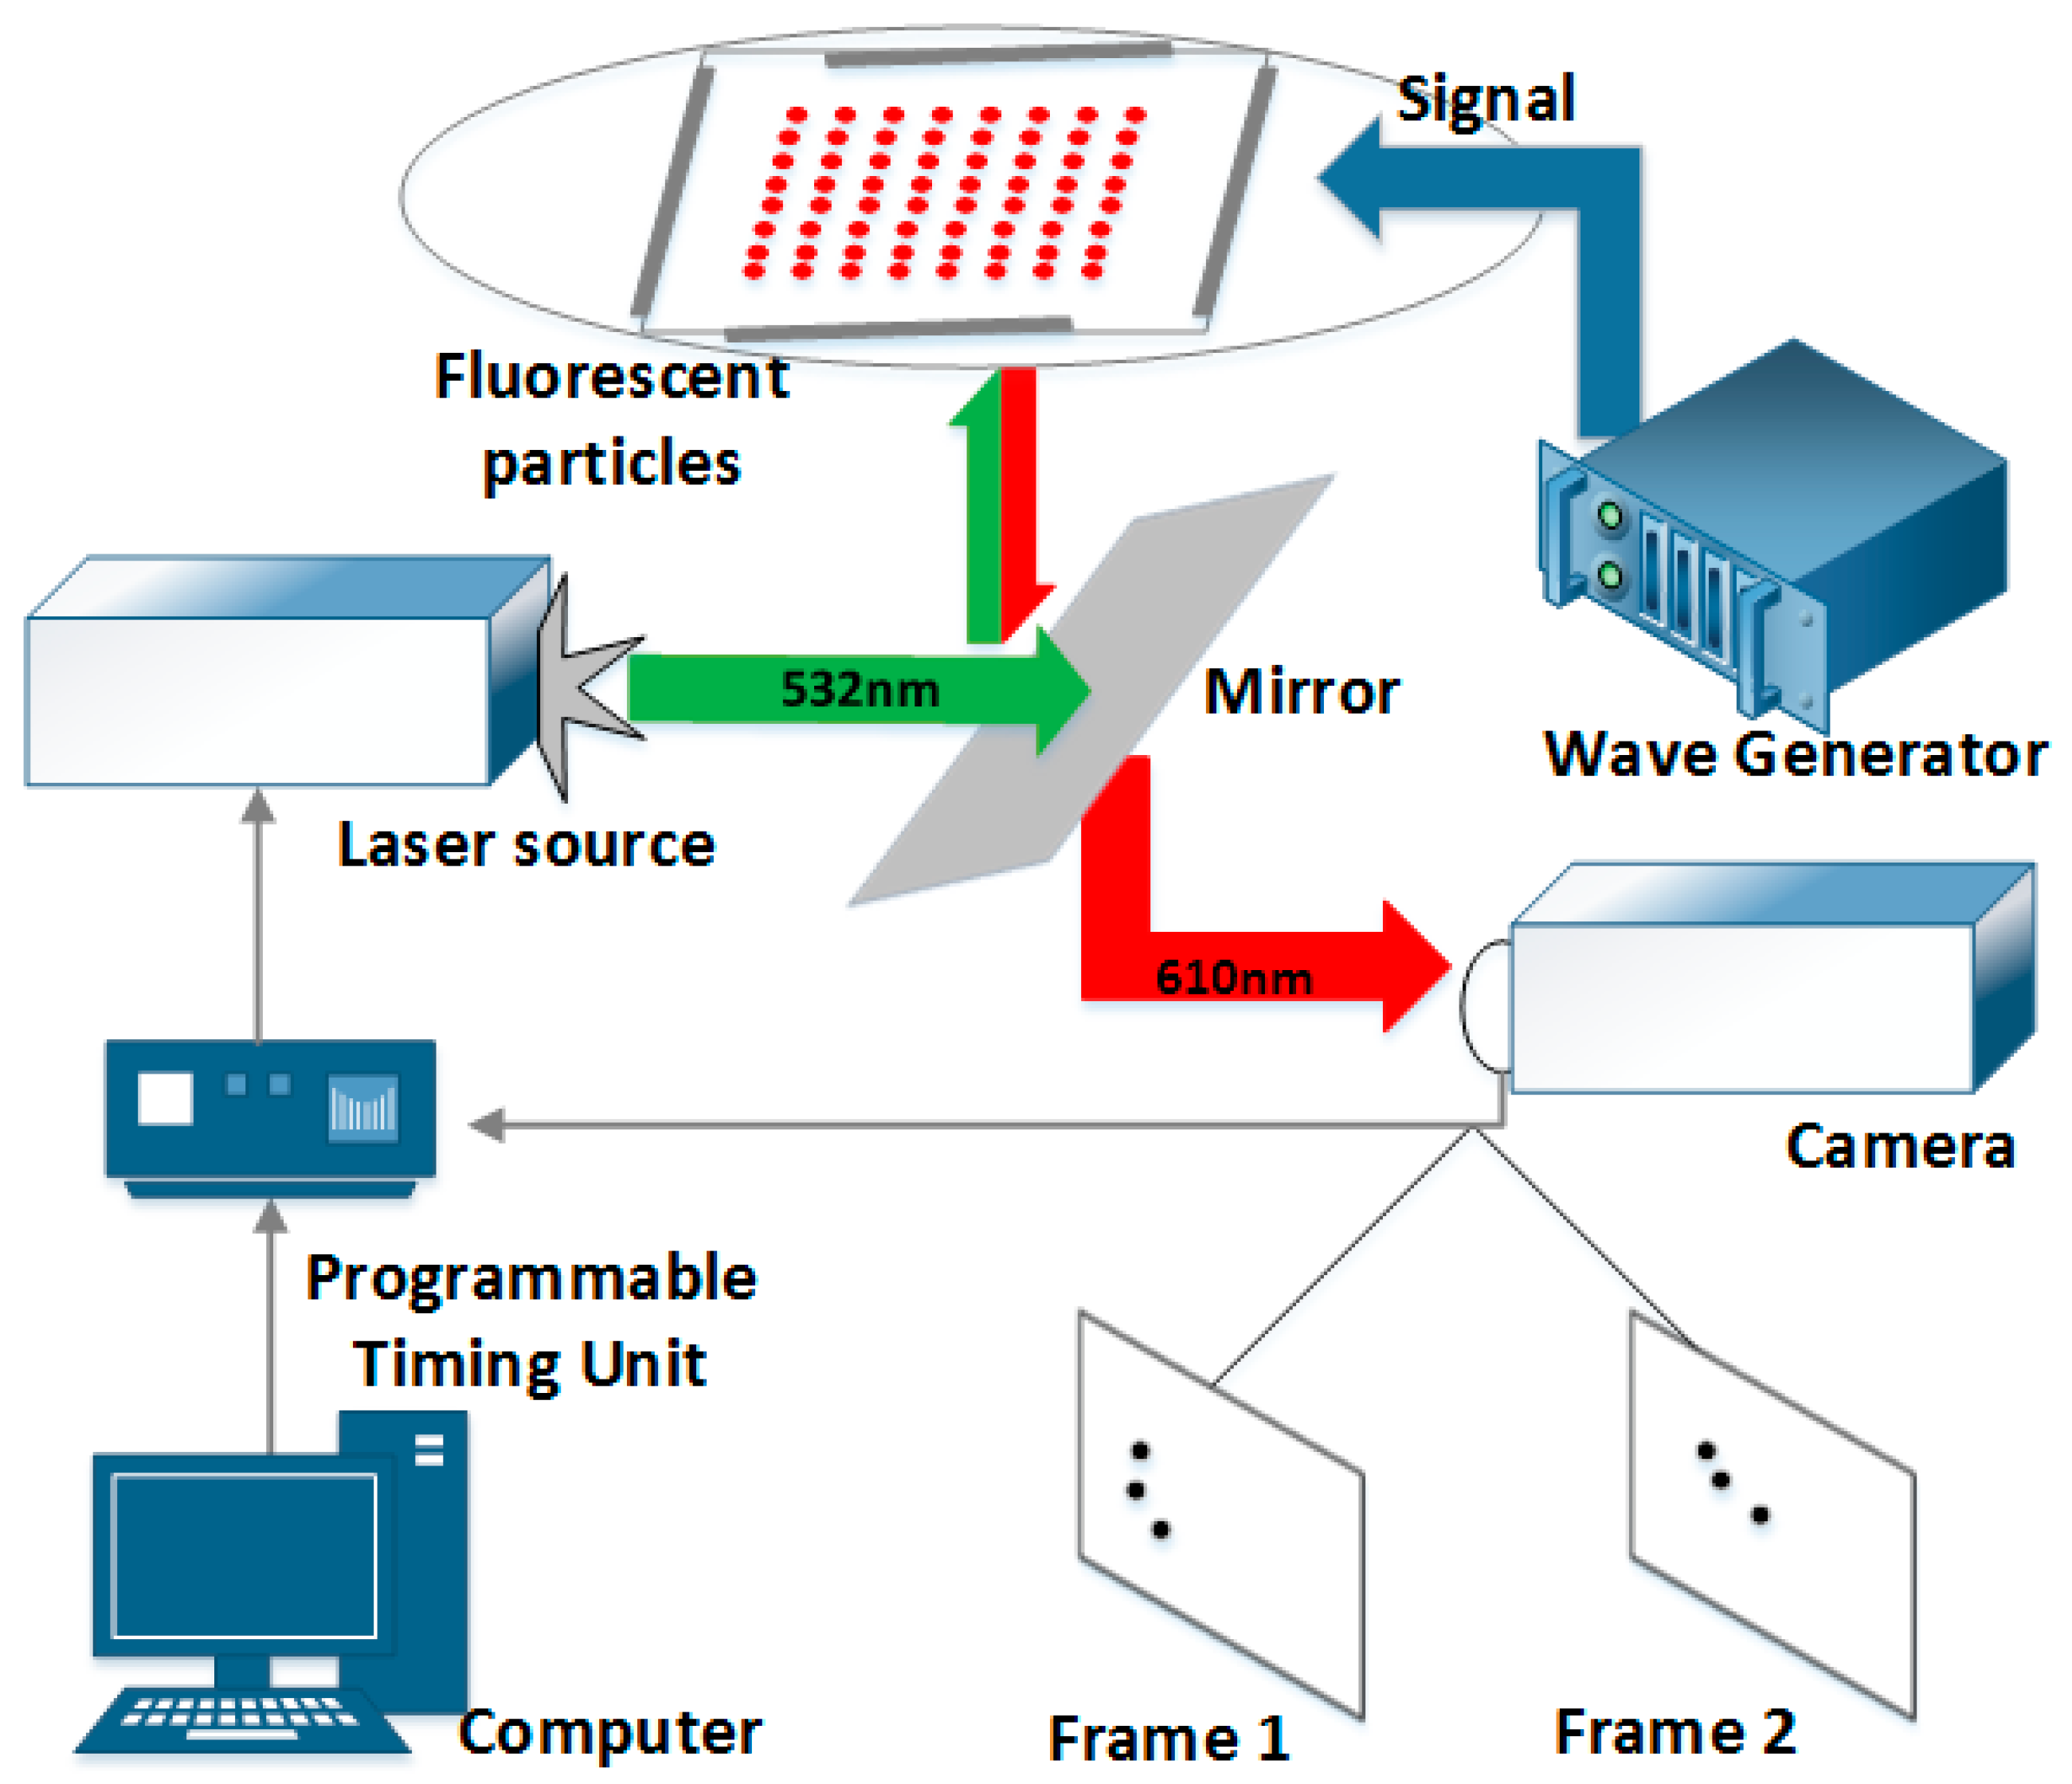
Abstract
1. Introduction
2. Theory
3. Experimental Setup
4. Simulation and Experimental Data Analysis
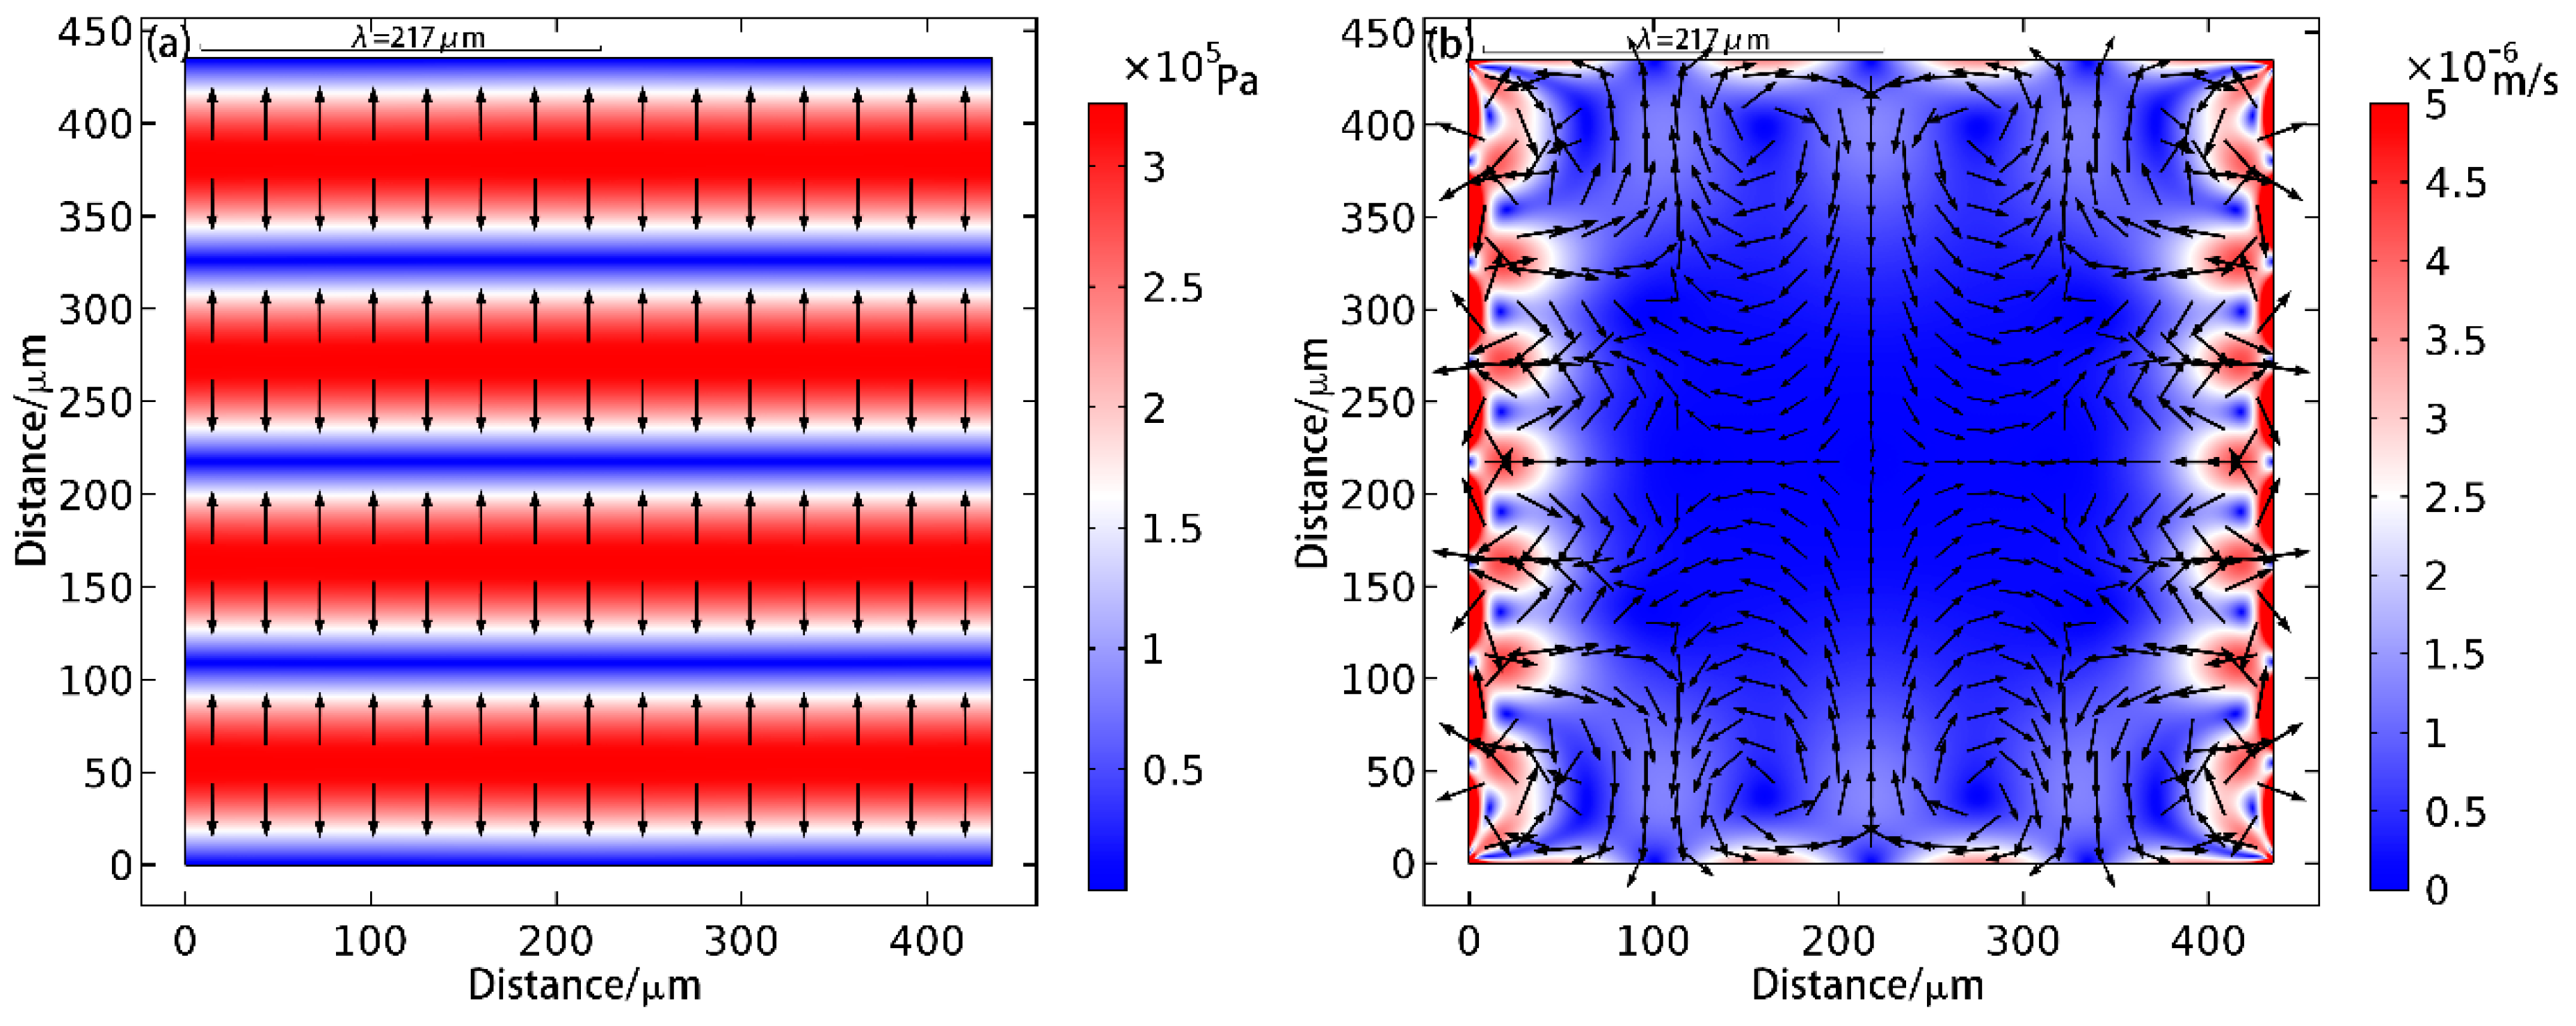
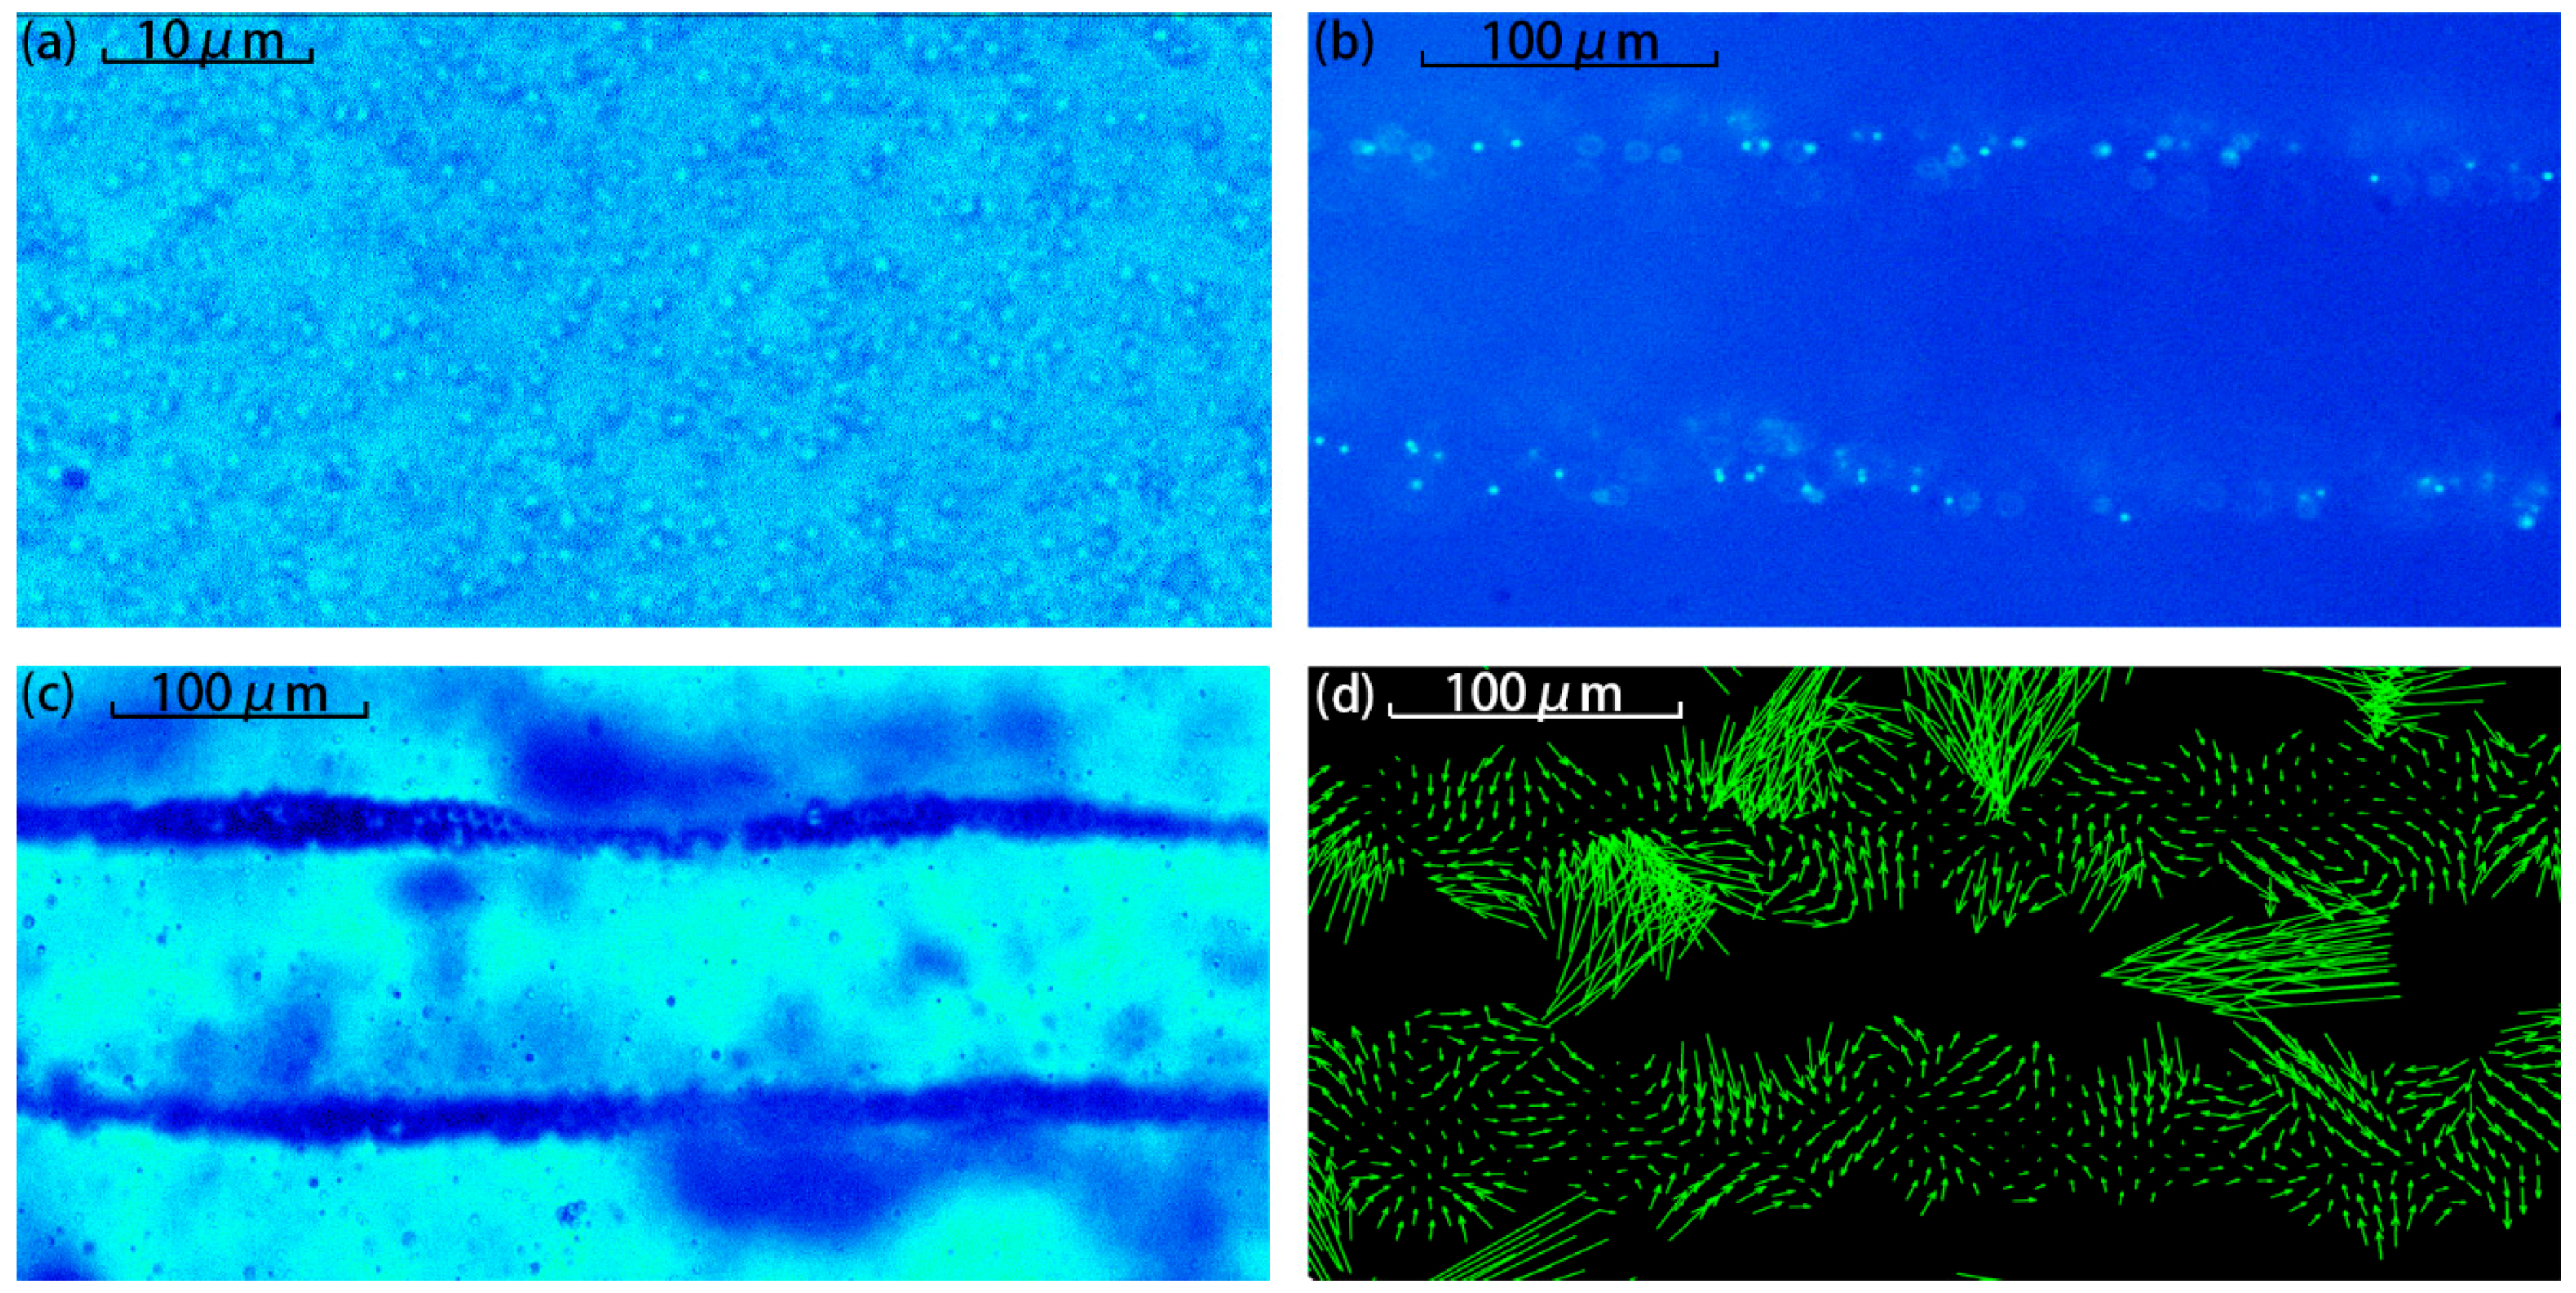
4.1. One-Dimensional Patterning
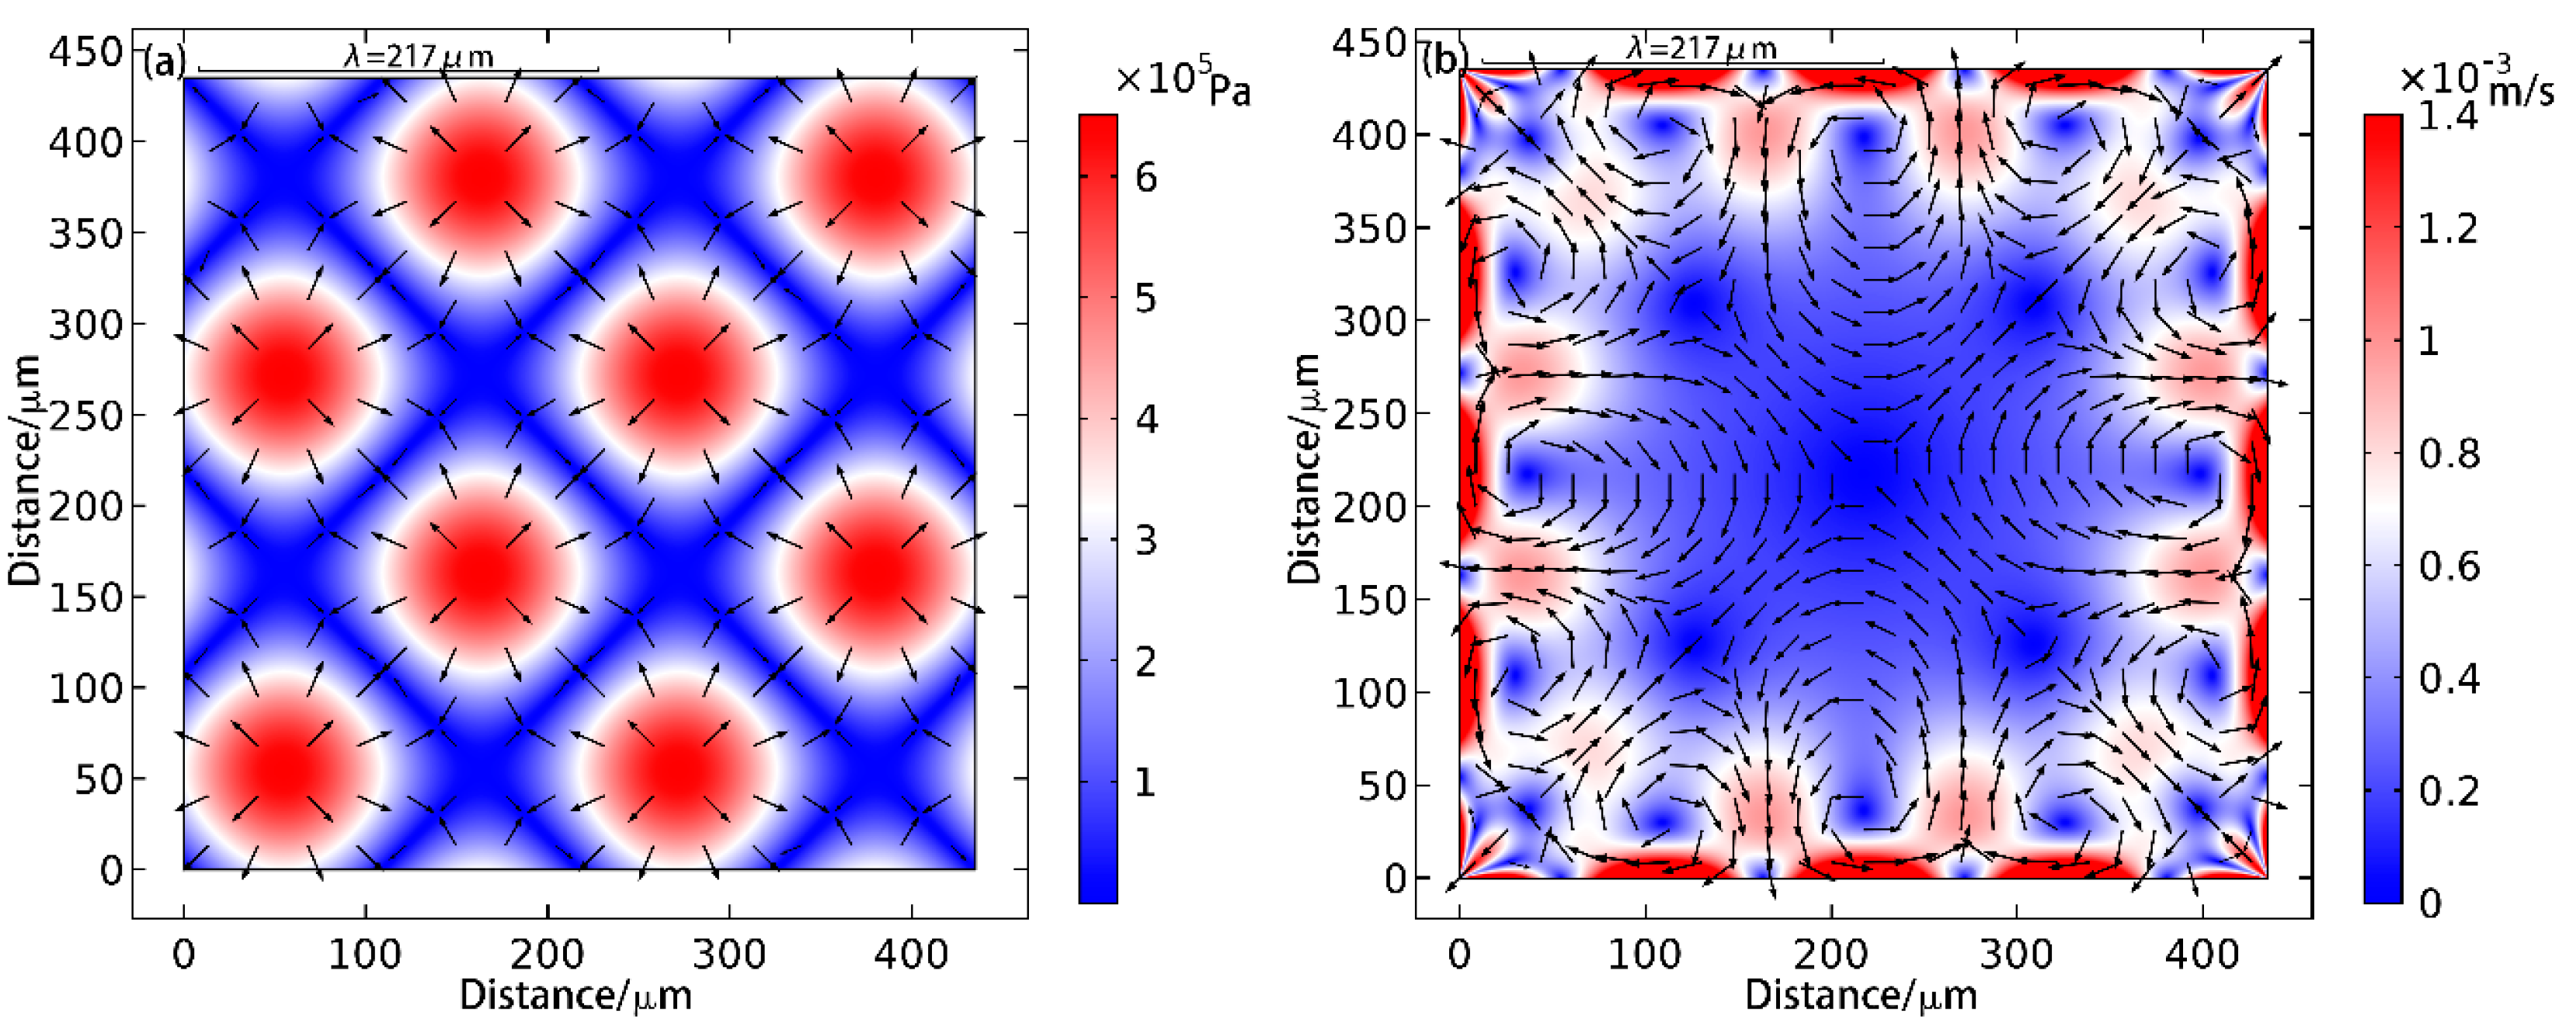
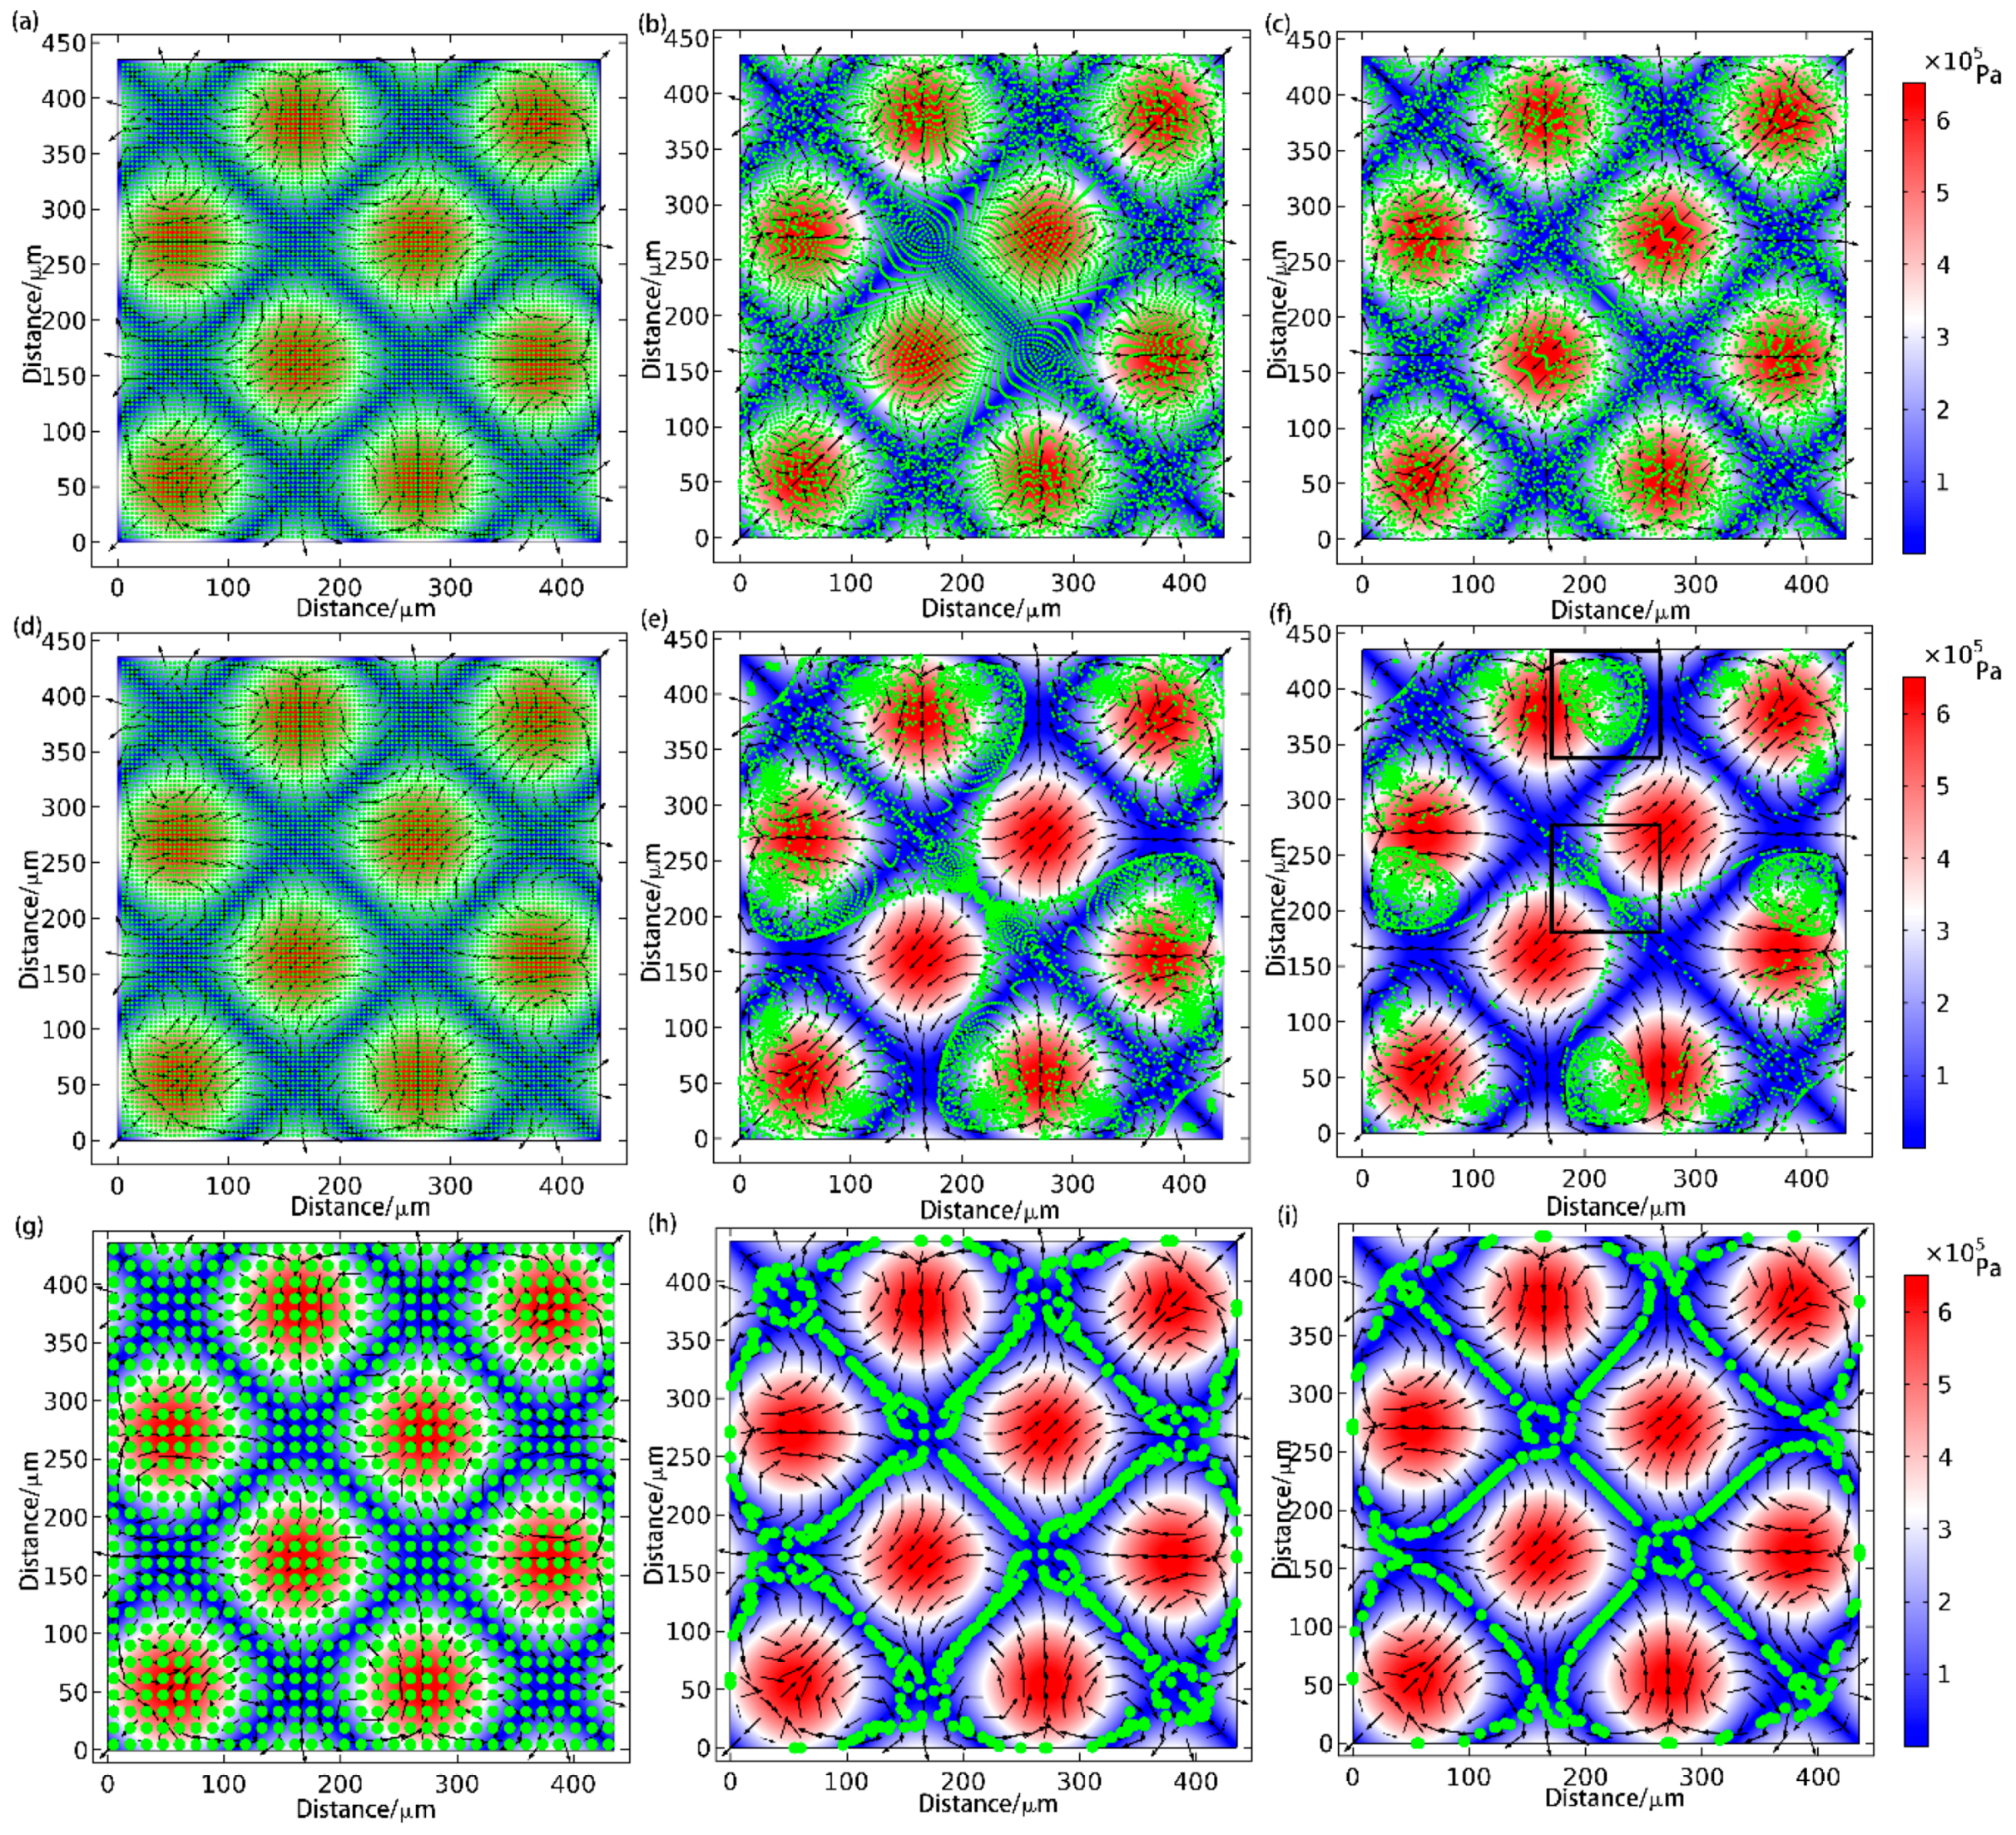
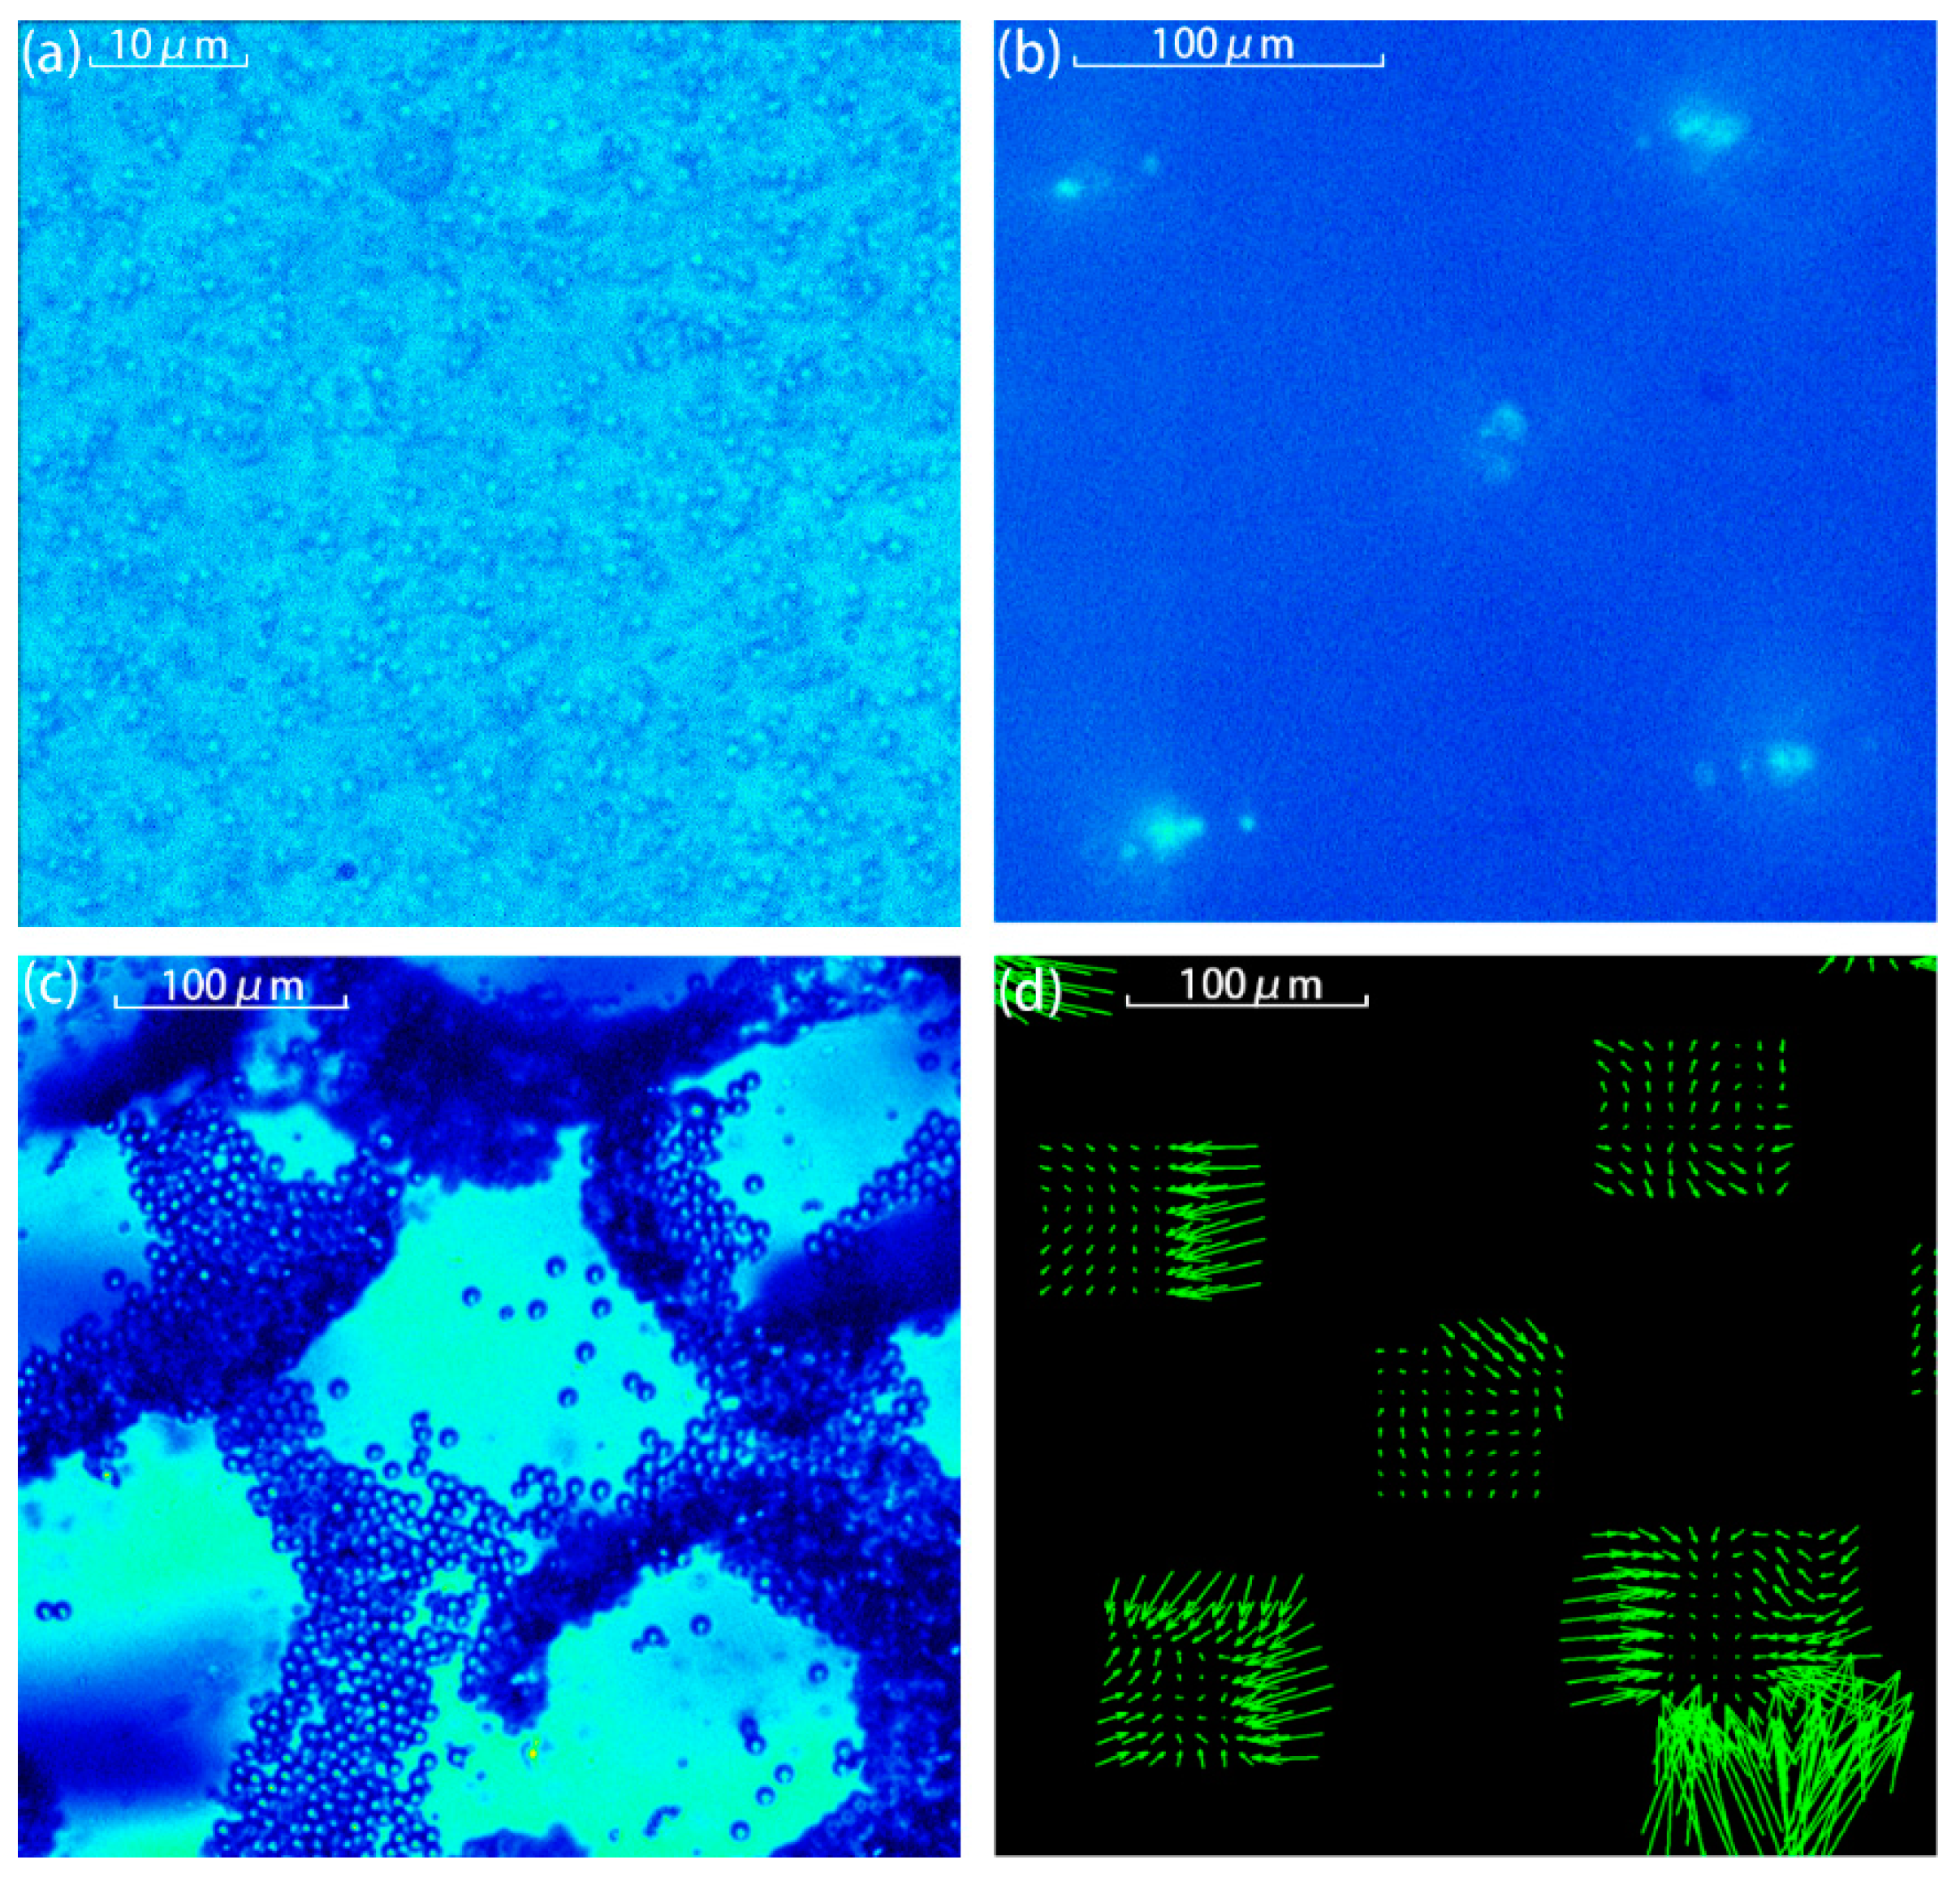
4.2. Two-Dimensional Patterning
5. Conclusions
Acknowledgments
Author Contributions
Conflicts of Interest
References
- Drinkwater, B.W. Dynamic-field devices for the ultrasonic manipulation of microparticles. Lab Chip 2016, 16, 2360–2375. [Google Scholar] [CrossRef] [PubMed]
- Bruus, H.; Dual, J.; Hawkes, J.; Hill, M.; Laurell, T.; Nilsson, J.; Radel, S.; Sadhal, S.; Wiklund, M. Forthcoming lab on a chip tutorial series on acoustofluidics: Acoustofluidics-exploiting ultrasonic standing wave forces and acoustic streaming in microfluidic systems for cell and particle manipulation. Lab Chip 2011, 11, 3579–3580. [Google Scholar] [CrossRef] [PubMed]
- Mark, D.; Haeberle, S.; Roth, G.; von Stetten, F.; Zengerle, R. Microfluidic lab-on-a-chip platforms: Requirements, characteristics and applications. Chem. Soc. Rev. 2010, 39, 1153–1182. [Google Scholar] [CrossRef] [PubMed]
- Haake, A.; Neild, A.; Radziwill, G.; Dual, J. Positioning, displacement, and localization of cells using ultrasonic forces. Biotechnol. Bioeng. 2005, 92, 8–14. [Google Scholar] [CrossRef] [PubMed]
- Hill, M.; Wood, R.J. Modelling in the design of a flow-through ultrasonic separator. Ultrasonics 2000, 38, 662–665. [Google Scholar] [CrossRef]
- Collins, D.J.; Morahan, B.; Garcia-Bustos, J.; Doerig, C.; Plebanski, M.; Neild, A. Two-dimensional single-cell patterning with one cell per well driven by surface acoustic waves. Nat. Commun. 2015, 6, 8686. [Google Scholar] [CrossRef] [PubMed]
- Jin, H.; Zhou, J.; He, X.; Wang, W.; Guo, H.; Dong, S.; Wang, D.; Xu, Y.; Geng, J.; Luo, J.; et al. Flexible surface acoustic wave resonators built on disposable plastic film for electronics and lab-on-a-chip applications. Sci. Rep. 2013, 3, 2140. [Google Scholar] [CrossRef] [PubMed]
- Grinenko, A.; Ong, C.K.; Courtney, C.R.P.; Wilcox, P.D.; Drinkwater, B.W. Efficient counter-propagating wave acoustic micro-particle manipulation. Appl. Phys. Lett. 2012, 101, 233501. [Google Scholar] [CrossRef]
- Courtney, C.R.P.; Ong, C.K.; Drinkwater, B.W.; Bernassau, A.L.; Wilcox, P.D.; Cumming, D.R.S. Manipulation of particles in two dimensions using phase controllable ultrasonic standing waves. Proc. R. Soc. A Math. Phys. Eng. Sci. 2011. [Google Scholar] [CrossRef]
- Bernassau, A.L.; Courtney, C.R.P.; Beeley, J.; Drinkwater, B.W.; Cumming, D.R.S. Interactive manipulation of microparticles in an octagonal sonotweezer. Appl. Phys. Lett. 2013, 102, 164101. [Google Scholar] [CrossRef]
- Zhang, J.; Meng, L.; Cai, F.; Zheng, H.; Courtney, C.R.P. Multi-scale patterning of microparticles using a combination of surface acoustic waves and ultrasonic bulk waves. Appl. Phys. Lett. 2014, 104, 224103. [Google Scholar] [CrossRef]
- Gorkov, L. Forces acting on a small particle in an acoustic field within an ideal fluid. Dokl. Akad. Nauk SSSR 1961, 140, 88. [Google Scholar]
- Neild, A.; Oberti, S.; Dual, J. Design, modeling and characterization of microfluidic devices for ultrasonic manipulation. Sens. Actuators B Chem. 2007, 121, 452–461. [Google Scholar] [CrossRef]
- Wiklund, M.; Green, R.; Ohlin, M. Acoustofluidics 14: Applications of acoustic streaming in microfluidic devices. Lab Chip 2012, 12, 2438–2451. [Google Scholar] [CrossRef] [PubMed]
- Lei, J.; Glynne-Jones, P.; Hill, M. Acoustic streaming in the transducer plane in ultrasonic particle manipulation devices. Lab Chip 2013, 13, 2133–2143. [Google Scholar] [CrossRef] [PubMed]
- Lei, J.; Hill, M.; Glynne-Jones, P. Numerical simulation of 3d boundary-driven acoustic streaming in microfluidic devices. Lab Chip 2014, 14, 532–541. [Google Scholar] [CrossRef] [PubMed]
- Ahmed, D.; Ozcelik, A.; Bojanala, N.; Nama, N.; Upadhyay, A.; Chen, Y.; Hanna-Rose, W.; Huang, T.J. Rotational manipulation of single cells and organisms using acoustic waves. Nat. Commun. 2016, 7, 11085. [Google Scholar] [CrossRef] [PubMed]
- Shi, J.; Huang, H.; Stratton, Z.; Huang, Y.; Huang, T.J. Continuous particle separation in a microfluidic channel via standing surface acoustic waves (SSAW). Lab Chip 2009, 9, 3354–3359. [Google Scholar] [CrossRef] [PubMed]
- Collins, D.J.; Ma, Z.; Ai, Y. Highly localized acoustic streaming and size-selective submicrometer particle concentration using high frequency microscale focused acoustic fields. Anal. Chem. 2016, 88, 5513–5522. [Google Scholar] [CrossRef] [PubMed]
- Muller, P.B.; Barnkob, R.; Jensen, M.J.H.; Bruus, H. A numerical study of microparticle acoustophoresis driven by acoustic radiation forces and streaming-induced drag forces. Lab Chip 2012, 12, 4617–4627. [Google Scholar] [CrossRef] [PubMed]
- Bruus, H. Acoustofluidics 10: Scaling laws in acoustophoresis. Lab Chip 2012, 12, 1578–1586. [Google Scholar] [CrossRef] [PubMed]
- Friend, J.; Yeo, L.Y. Microscale acoustofluidics: Microfluidics driven via acoustics and ultrasonics. Rev. Mod. Phys. 2011, 83, 647–704. [Google Scholar] [CrossRef]
- Duwairi, H.; Abdullah, M. Thermal and flow analysis of a magneto-hydrodynamic micropump. Microsyst. Technol. 2007, 13, 33–39. [Google Scholar] [CrossRef]
- Gedge, M.; Hill, M. Theory of surface acoustic wave devices for particle manipulation. Microscale Acoustofluidics; Royal Society of Chemistry: London, UK, 2014; Chapter 14. [Google Scholar]
- Gedge, M.; Hill, M. Acoustofluidics 17: Theory and applications of surface acoustic wave devices for particle manipulation. Lab Chip 2012, 12, 2998–3007. [Google Scholar] [CrossRef] [PubMed]
- Barnkob, R.; Augustsson, P.; Laurell, T.; Bruus, H. Measuring the local pressure amplitude in microchannel acoustophoresis. Lab Chip 2010, 10, 563–570. [Google Scholar] [CrossRef] [PubMed]
- Green, R.; Ohlin, M.; Wiklund, M. Applications of acoustic streaming. Microscale Acoustofluidics; Royal Society of Chemistry: London, UK, 2014; Chapter 13. [Google Scholar]
- Hagsater, S.M.; Jensen, T.G.; Bruus, H.; Kutter, J.P. Acoustic resonances in microfluidic chips: Full-image micro-piv experiments and numerical simulations. Lab Chip 2007, 7, 1336–1344. [Google Scholar] [CrossRef] [PubMed]
- Bruus, H. Acoustofluidics 1: Governing equations in microfluidics. Lab Chip 2011, 11, 3742–3751. [Google Scholar] [CrossRef] [PubMed]
- Yosioka, K.; Kawasima, Y. Acoustic radiation pressure on a compressible sphere. Acta Acust. United Acust. 1955, 5, 167–173. [Google Scholar]
- Settnes, M.; Bruus, H. Forces acting on a small particle in an acoustical field in a viscous fluid. Phys. Rev. E 2012, 85, 016327. [Google Scholar] [CrossRef] [PubMed]
- Franke, T.; Frommelt, T.; Schmid, L.; Braunmüller, S.; Huang, T.J.; Wixforth, A. Surface acoustic wave based microfluidics and droplet Applications. Microscale Acoustofluidics; Royal Society of Chemistry: London, UK, 2014; Chapter 16. [Google Scholar]
- Hartono, D.; Liu, Y.; Tan, P.L.; Then, X.Y.; Yung, L.Y.; Lim, K.M. On-chip measurements of cell compressibility via acoustic radiation. Lab Chip 2011, 11, 4072–4080. [Google Scholar] [CrossRef] [PubMed]
- Dual, J.; Moller, D. Acoustofluidics 4: Piezoelectricity and application in the excitation of acoustic fields for ultrasonic particle manipulation. Lab Chip 2012, 12, 506–514. [Google Scholar] [CrossRef] [PubMed]
- Adrian, R.J. Particle-imaging techniques for experimental fluid mechanics. Annu. Rev. Fluid Mech. 1991, 23, 261–304. [Google Scholar] [CrossRef]
- Raffel, M.; Willert, C.E.; Wereley, S.T.; Kompenhans, J. Physical and technical background. Part. Image Velocim. 2007, 15–77. [Google Scholar]
- Nyborg, W.L. Acoustic streaming due to attenuated plane waves. J. Acoust. Soc. Am. 1953, 25, 68–75. [Google Scholar] [CrossRef]
- Lee, C.P.; Wang, T.G. Near-boundary streaming around a small sphere due to two orthogonal standing waves. J. Acoust. Soc. Am. 1989, 85, 1081–1088. [Google Scholar] [CrossRef]
- Muller, P.B.; Rossi, M.; Marin, A.G.; Barnkob, R.; Augustsson, P.; Laurell, T.; Kahler, C.J.; Bruus, H. Ultrasound-induced acoustophoretic motion of microparticles in three dimensions. Phy. Rev. E 2013, 88, 023006. [Google Scholar] [CrossRef] [PubMed]
- Dentry, M.B.; Yeo, L.Y.; Friend, J.R. Frequency effects on the scale and behavior of acoustic streaming. Phys. Rev. E 2014, 89, 013203. [Google Scholar] [CrossRef] [PubMed]


© 2017 by the authors. Licensee MDPI, Basel, Switzerland. This article is an open access article distributed under the terms and conditions of the Creative Commons Attribution (CC BY) license (http://creativecommons.org/licenses/by/4.0/).
Share and Cite
Liu, S.; Yang, Y.; Ni, Z.; Guo, X.; Luo, L.; Tu, J.; Zhang, D.; Zhang, A.J. Investigation into the Effect of Acoustic Radiation Force and Acoustic Streaming on Particle Patterning in Acoustic Standing Wave Fields. Sensors 2017, 17, 1664. https://doi.org/10.3390/s17071664
Liu S, Yang Y, Ni Z, Guo X, Luo L, Tu J, Zhang D, Zhang AJ. Investigation into the Effect of Acoustic Radiation Force and Acoustic Streaming on Particle Patterning in Acoustic Standing Wave Fields. Sensors. 2017; 17(7):1664. https://doi.org/10.3390/s17071664
Chicago/Turabian StyleLiu, Shilei, Yanye Yang, Zhengyang Ni, Xiasheng Guo, Linjiao Luo, Juan Tu, Dong Zhang, and And Jie Zhang. 2017. "Investigation into the Effect of Acoustic Radiation Force and Acoustic Streaming on Particle Patterning in Acoustic Standing Wave Fields" Sensors 17, no. 7: 1664. https://doi.org/10.3390/s17071664
APA StyleLiu, S., Yang, Y., Ni, Z., Guo, X., Luo, L., Tu, J., Zhang, D., & Zhang, A. J. (2017). Investigation into the Effect of Acoustic Radiation Force and Acoustic Streaming on Particle Patterning in Acoustic Standing Wave Fields. Sensors, 17(7), 1664. https://doi.org/10.3390/s17071664