
Non-Invasive Fetal Monitoring: A Maternal Surface ECG Electrode Placement-Based Novel Approach for Optimization of Adaptive Filter Control Parameters Using the LMS and RLS Algorithms

 ,
,  ,
,  , and
, and
Abstract
:1. Introduction
2. State of the Art
3. Mathematical Description of LSM and RLS Algorithms
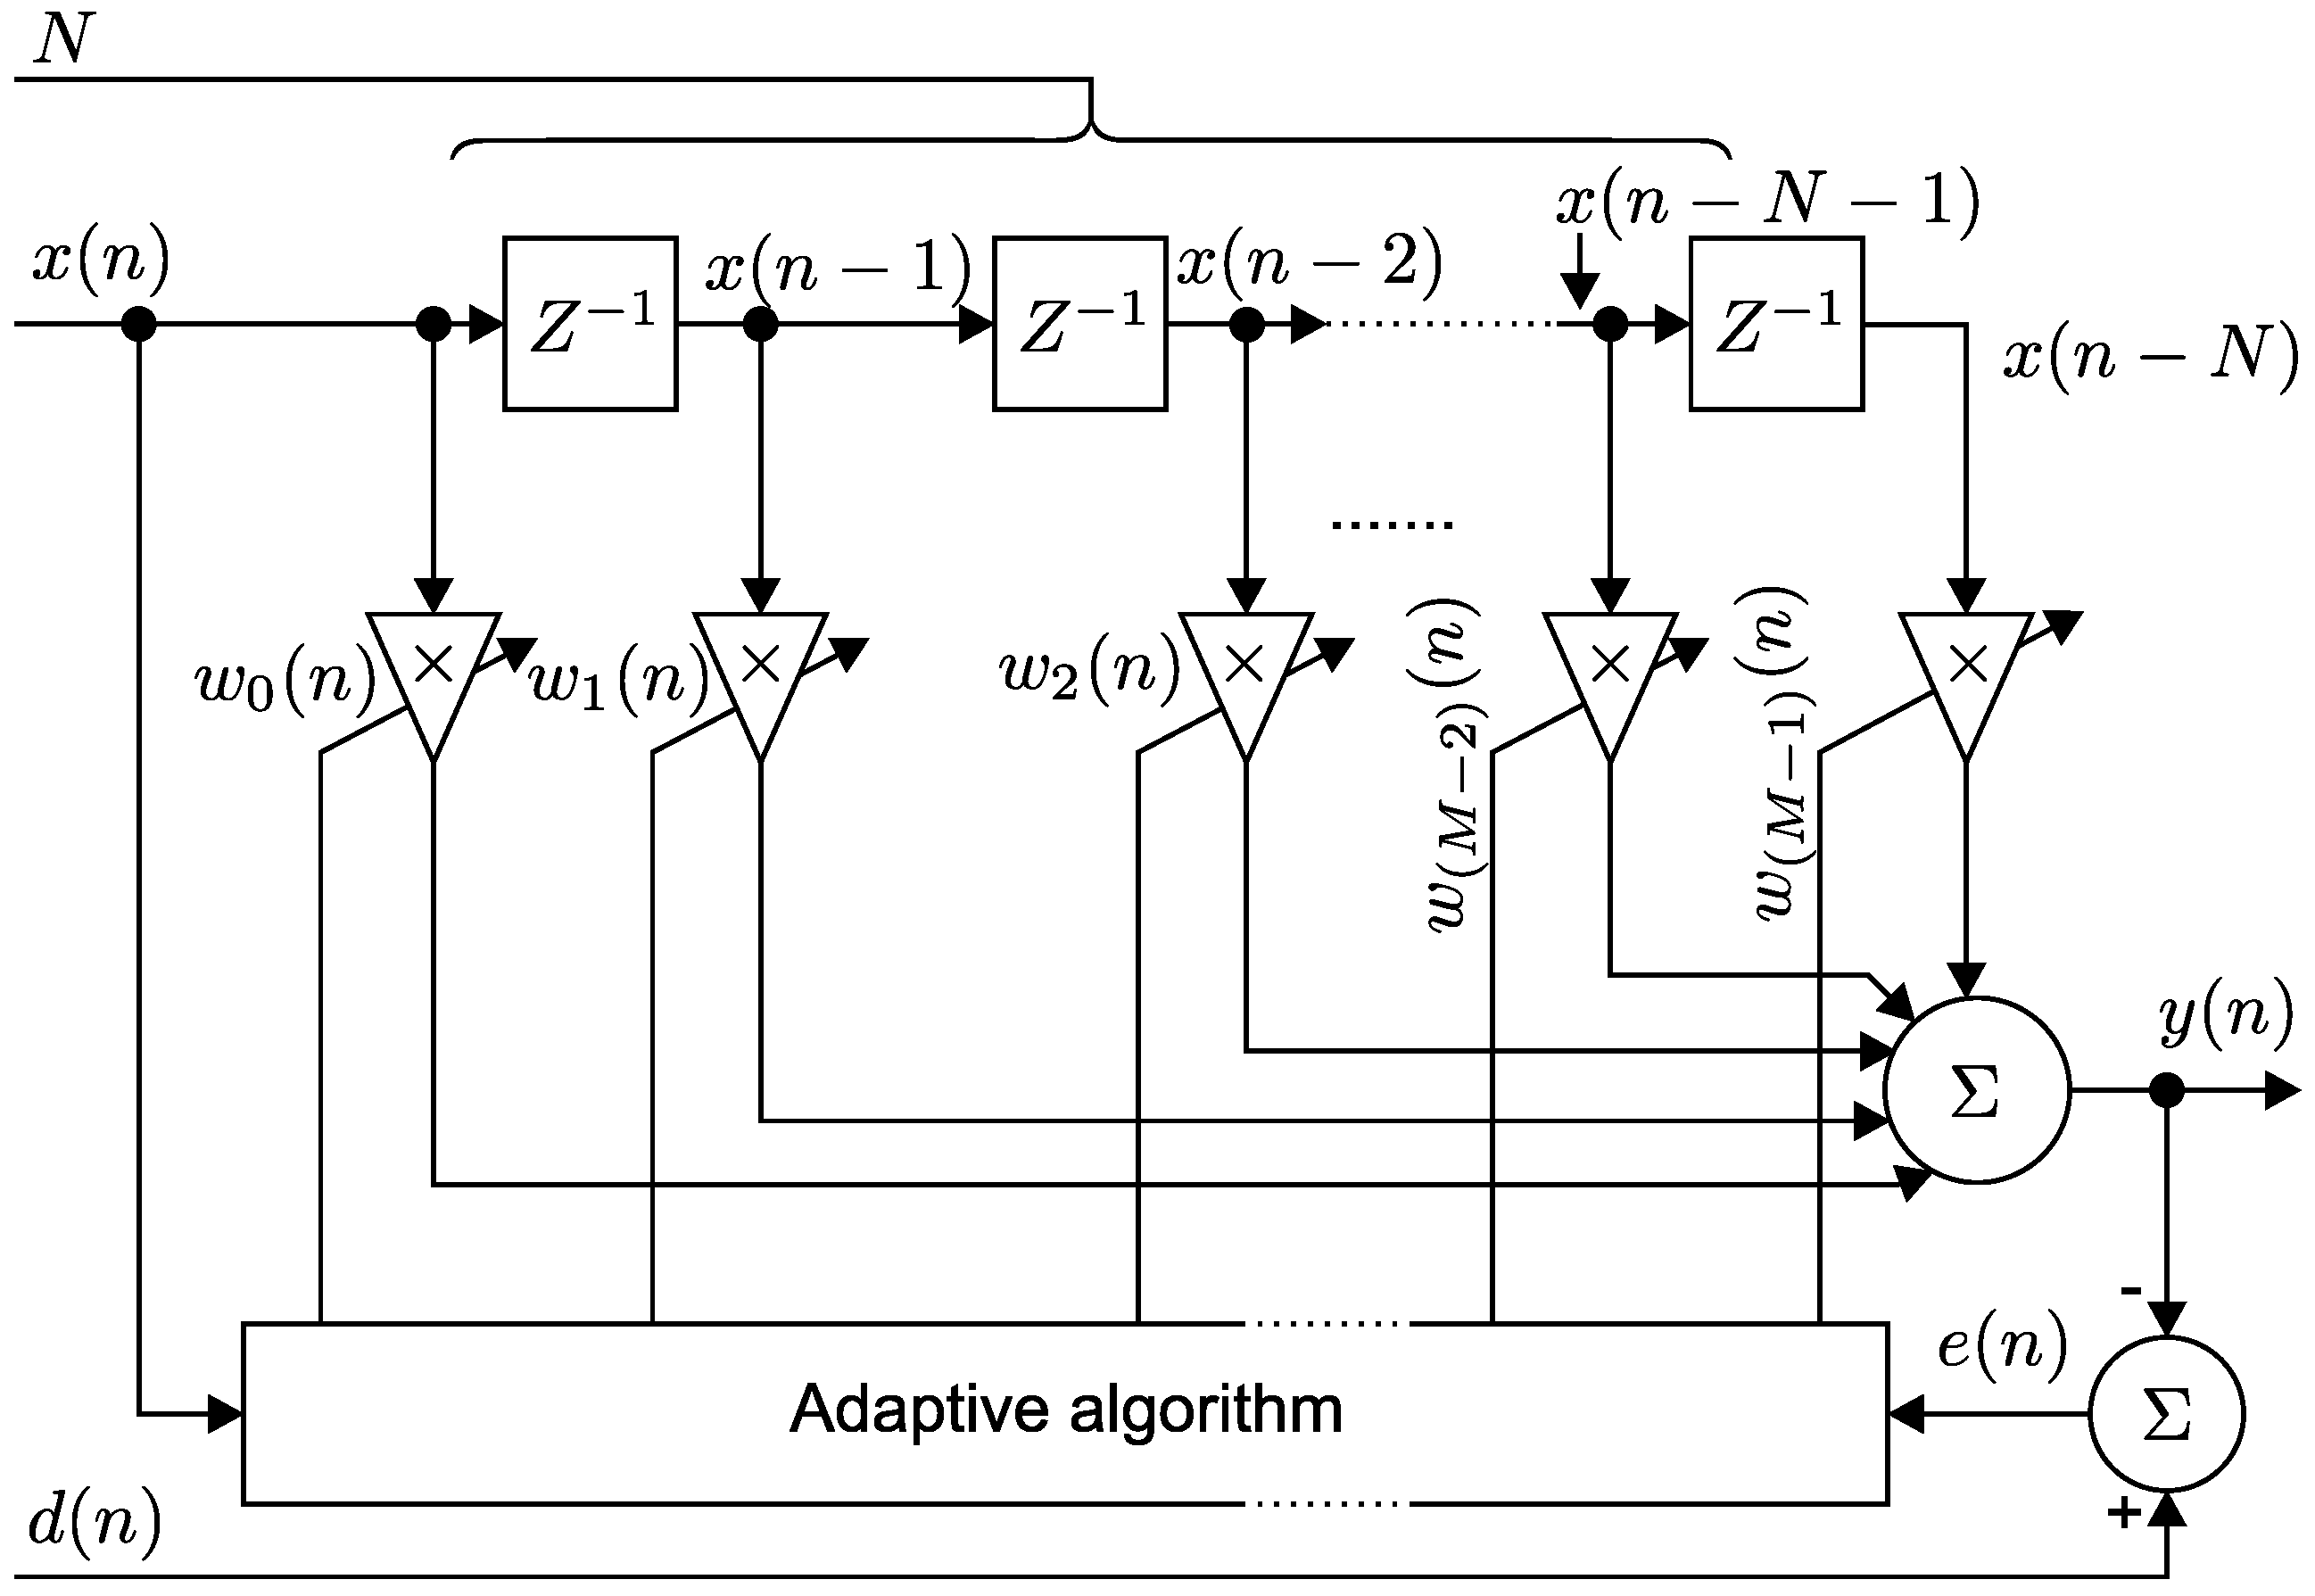
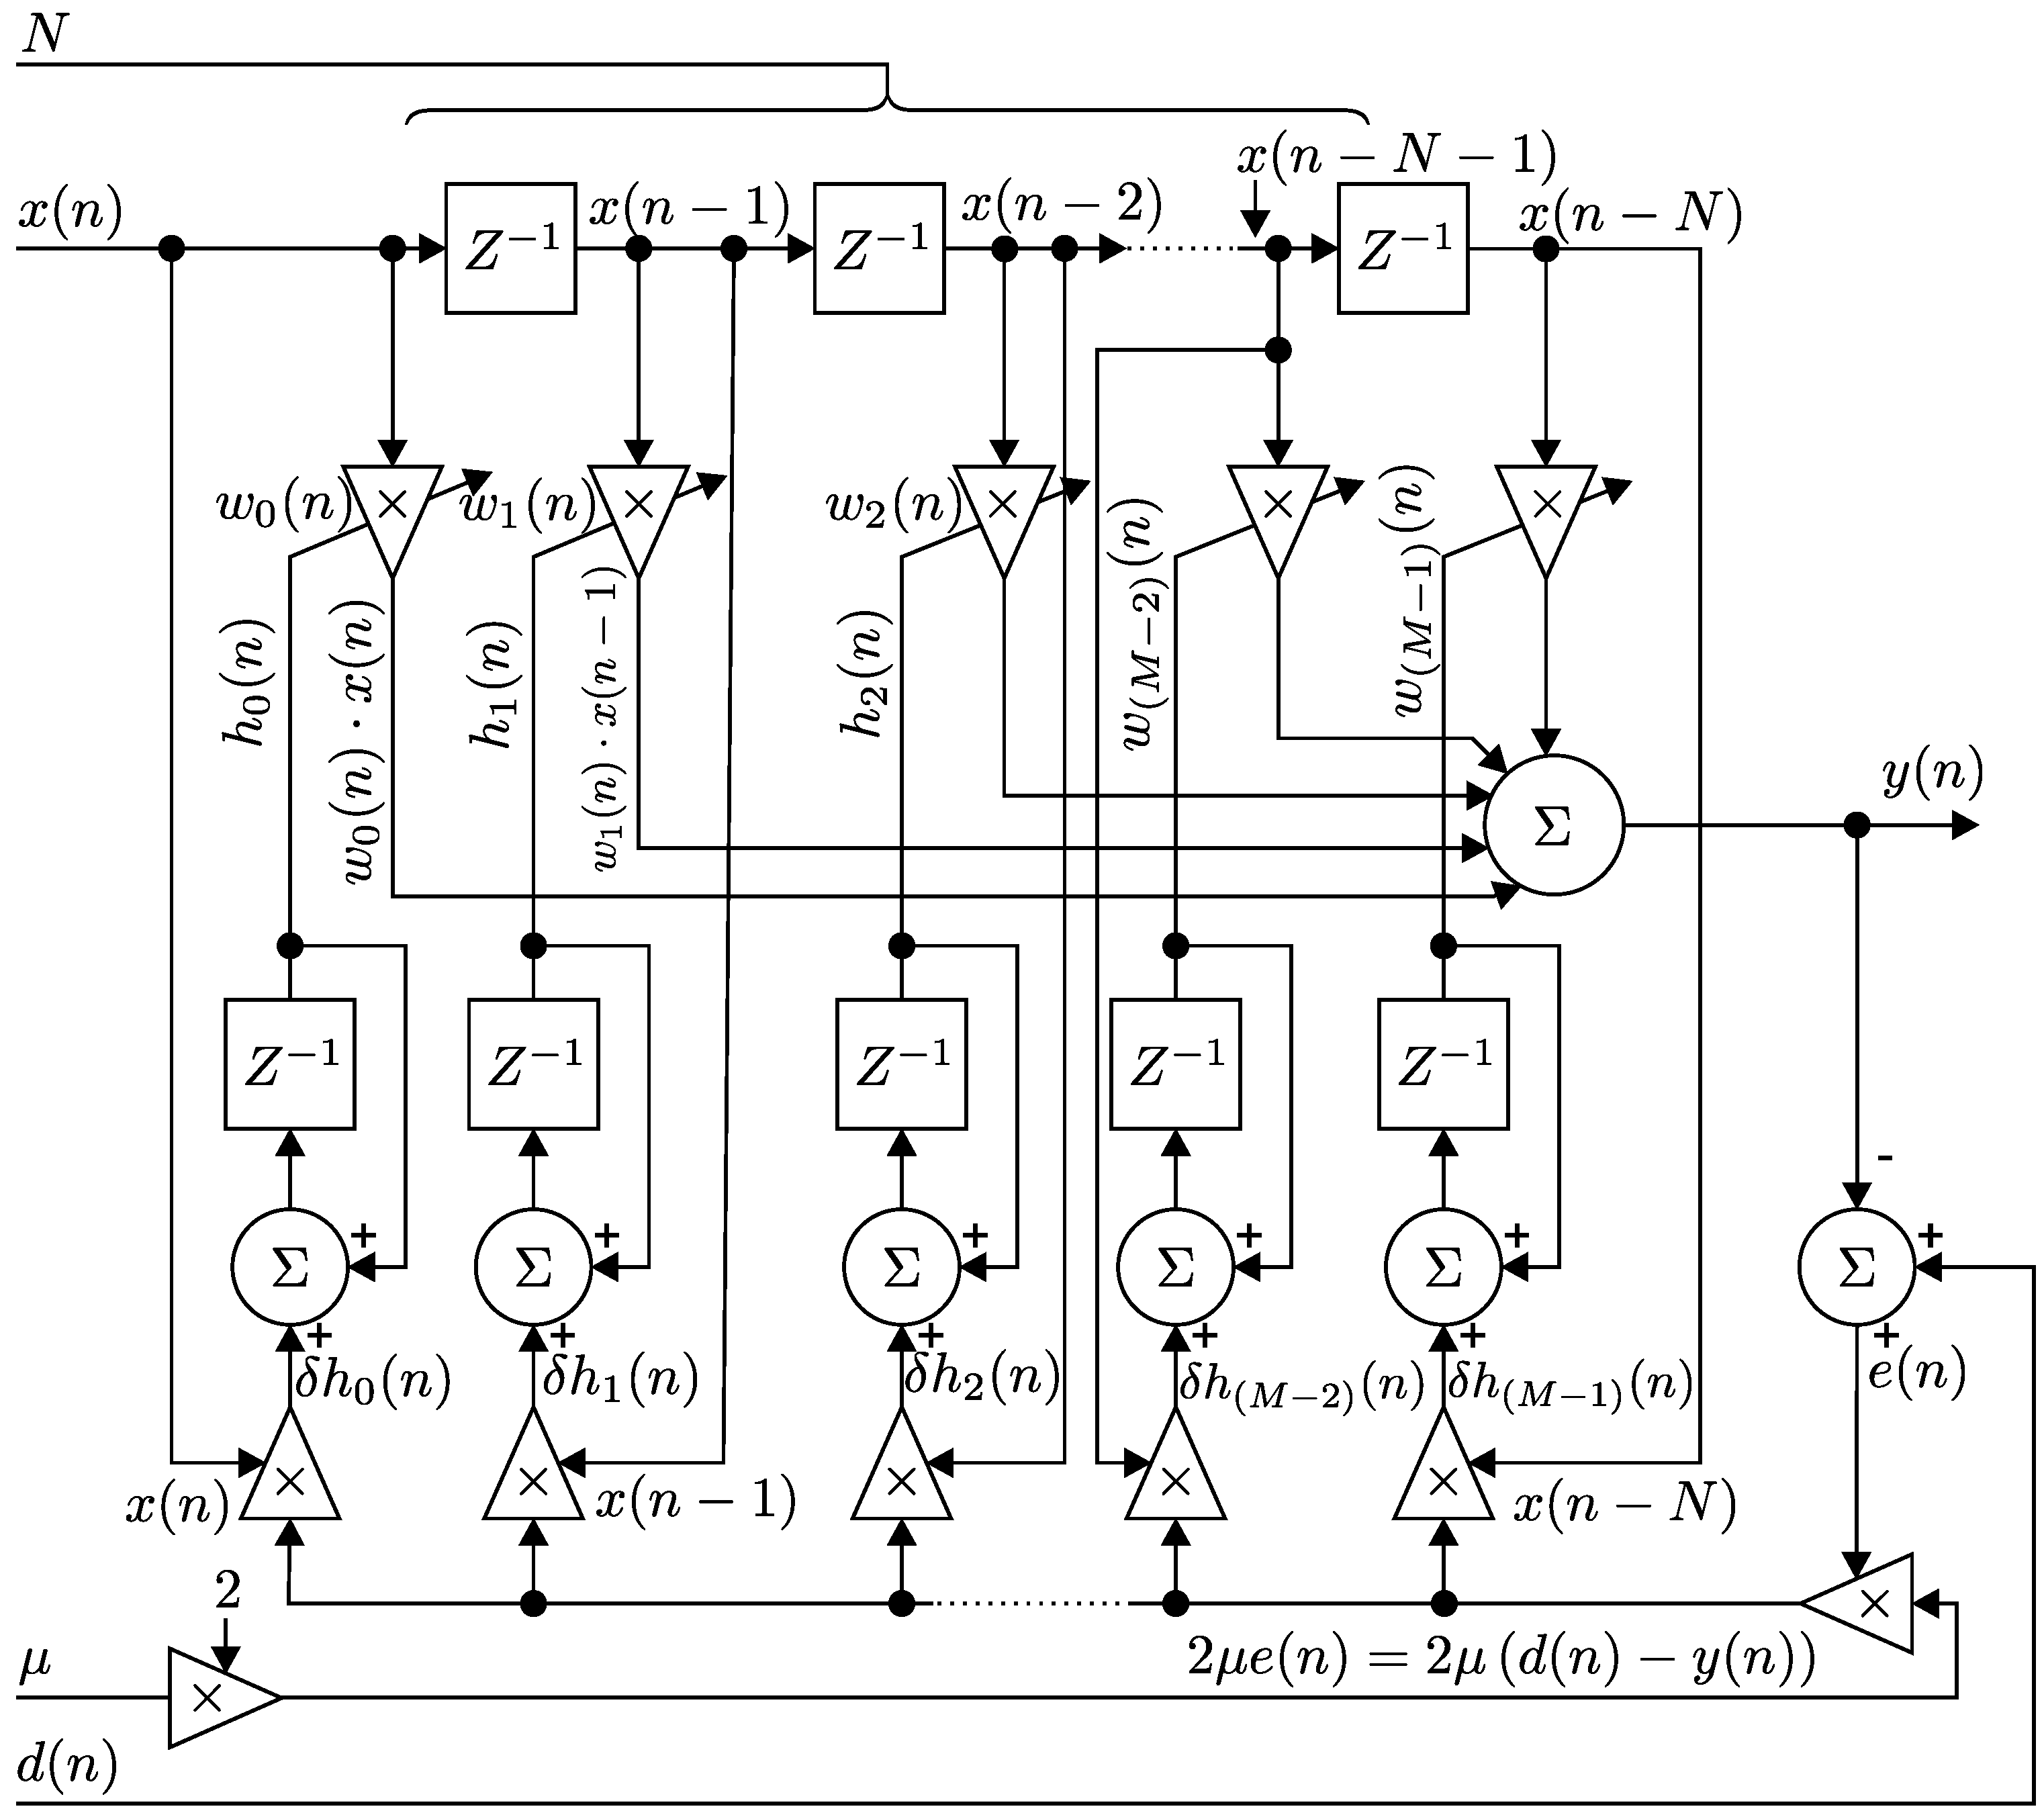
3.1. Implementation of the LMS Algorithm
- If the selected value is too small, the time required to find the optimal solution is too long.
- If the selected value is too large, the adaptive filter is unstable, and it will cause the deviation of the output.
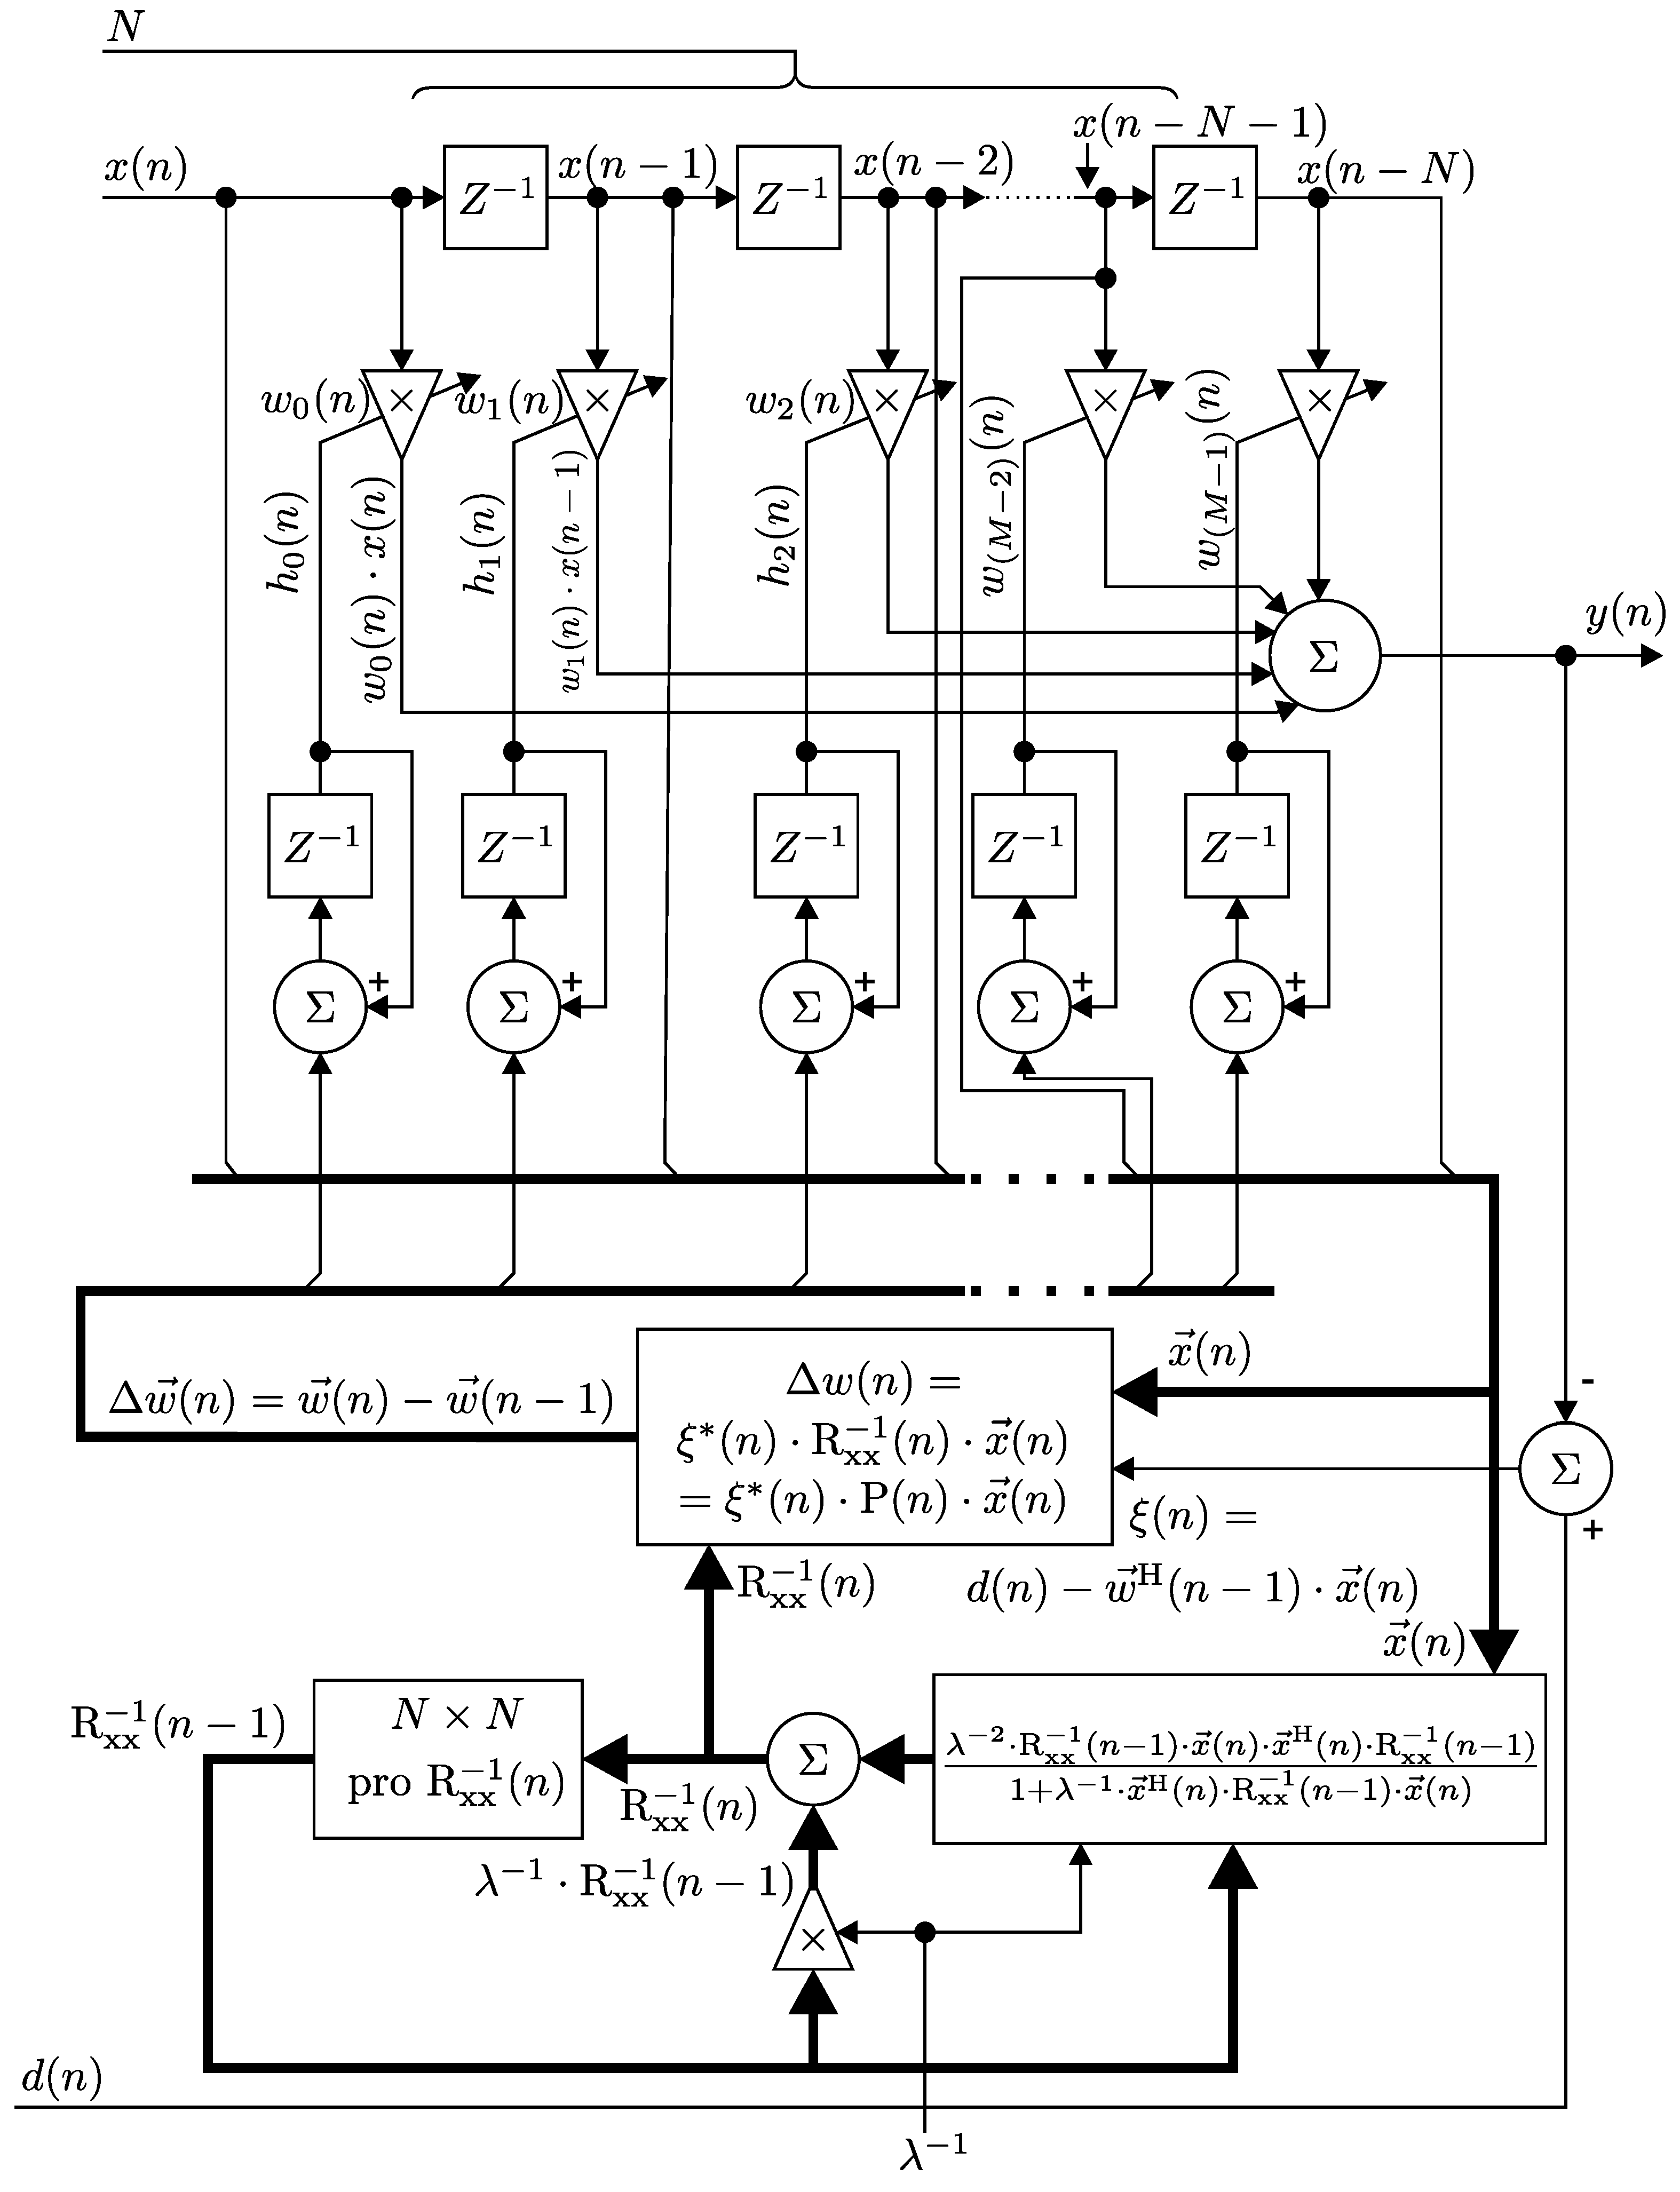
3.2. Implementation of the RLS Algorithm
3.3. Comparison between the LMS and RLS Algorithms
4. Methodology
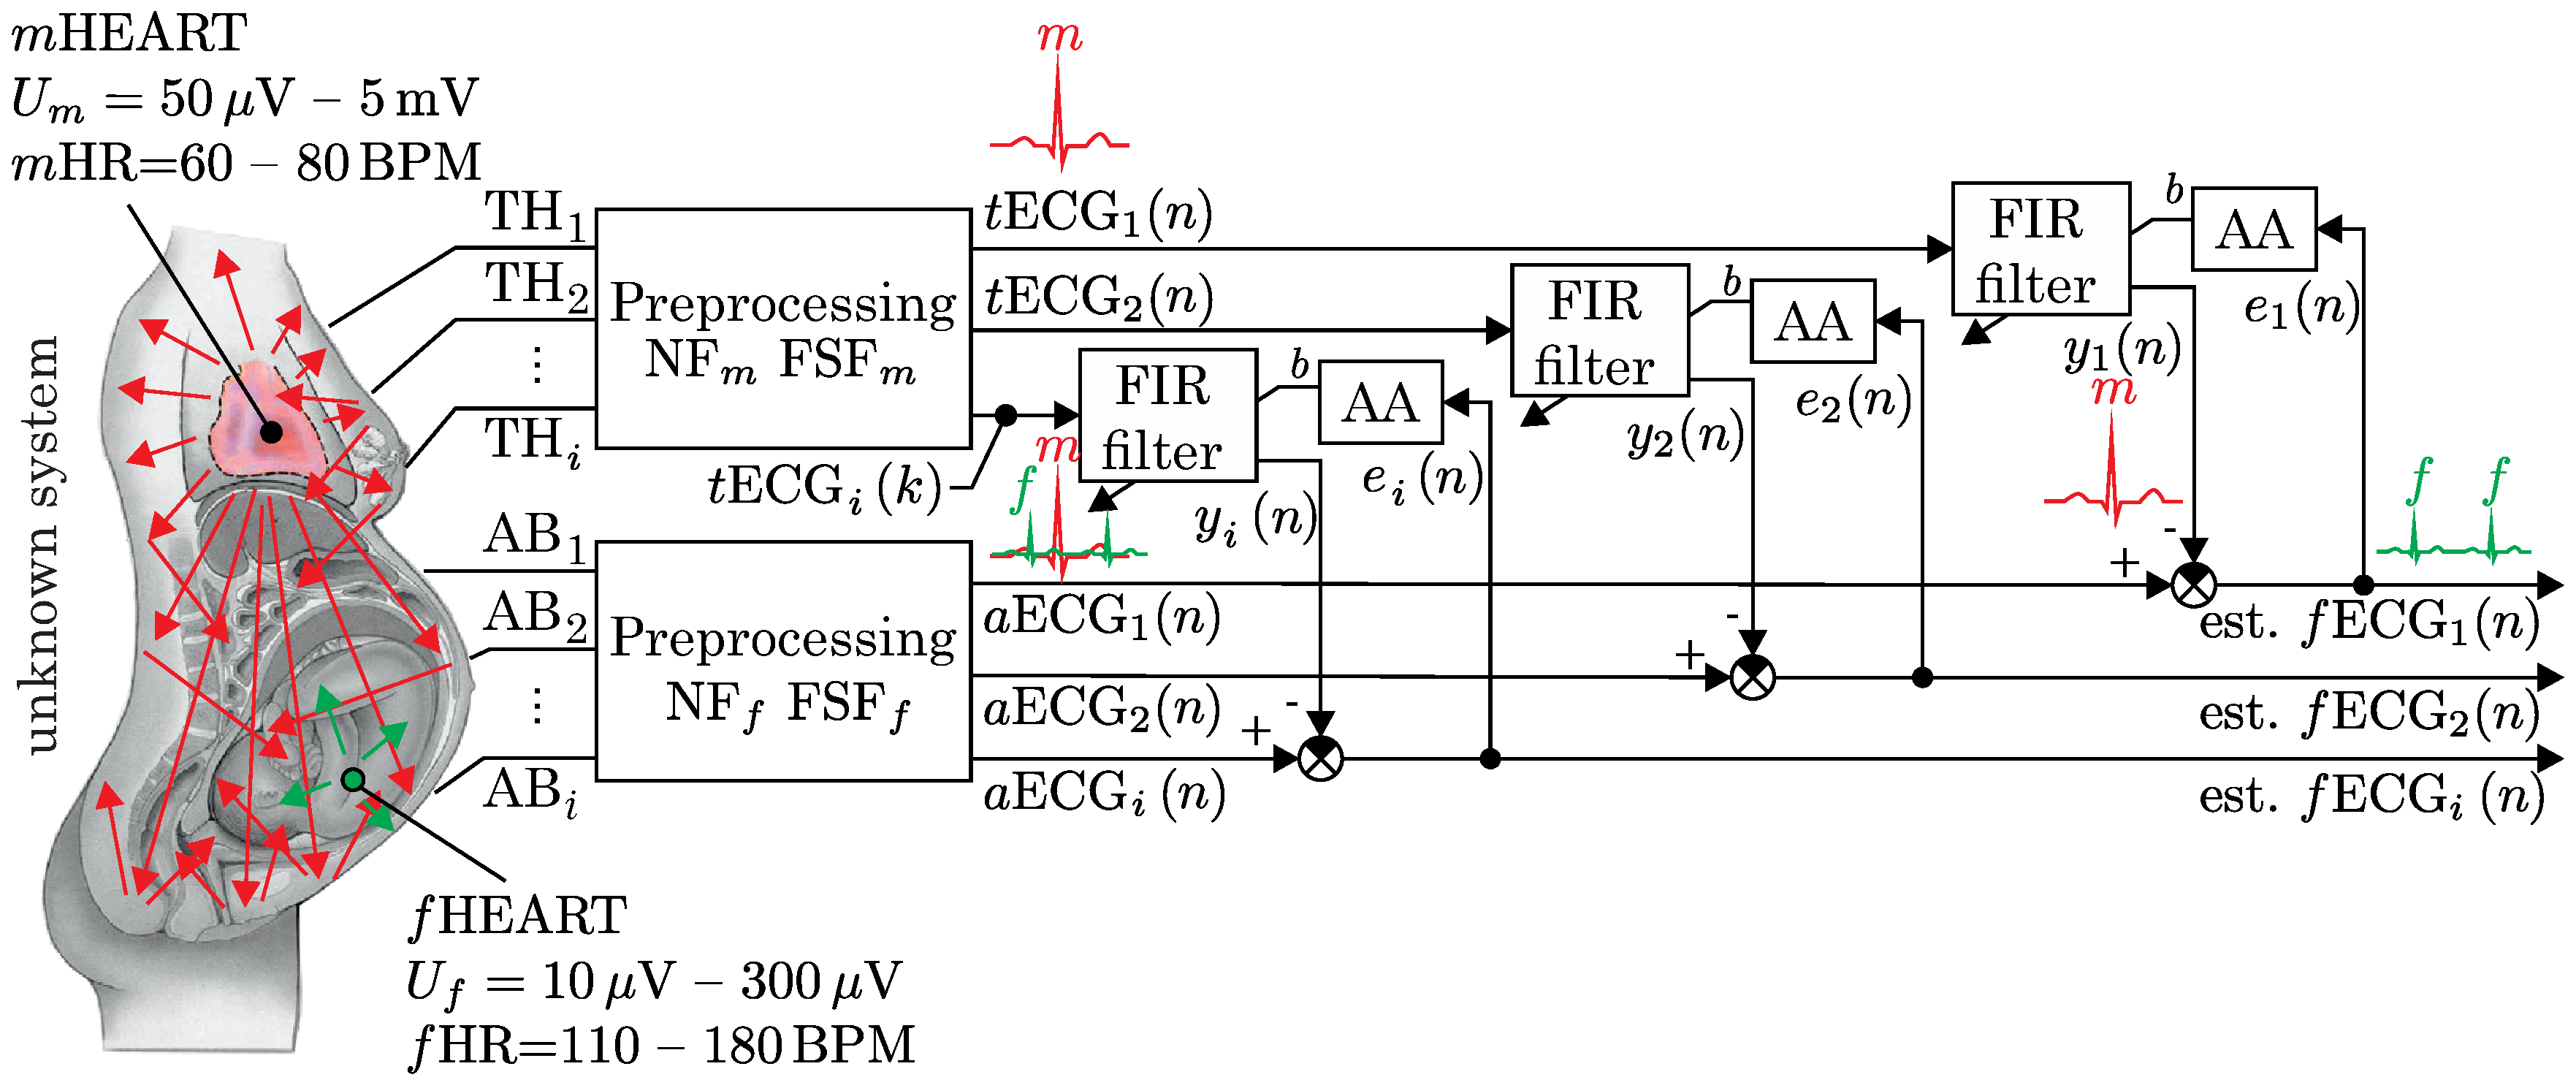
4.1. A Multichannel Adaptive System
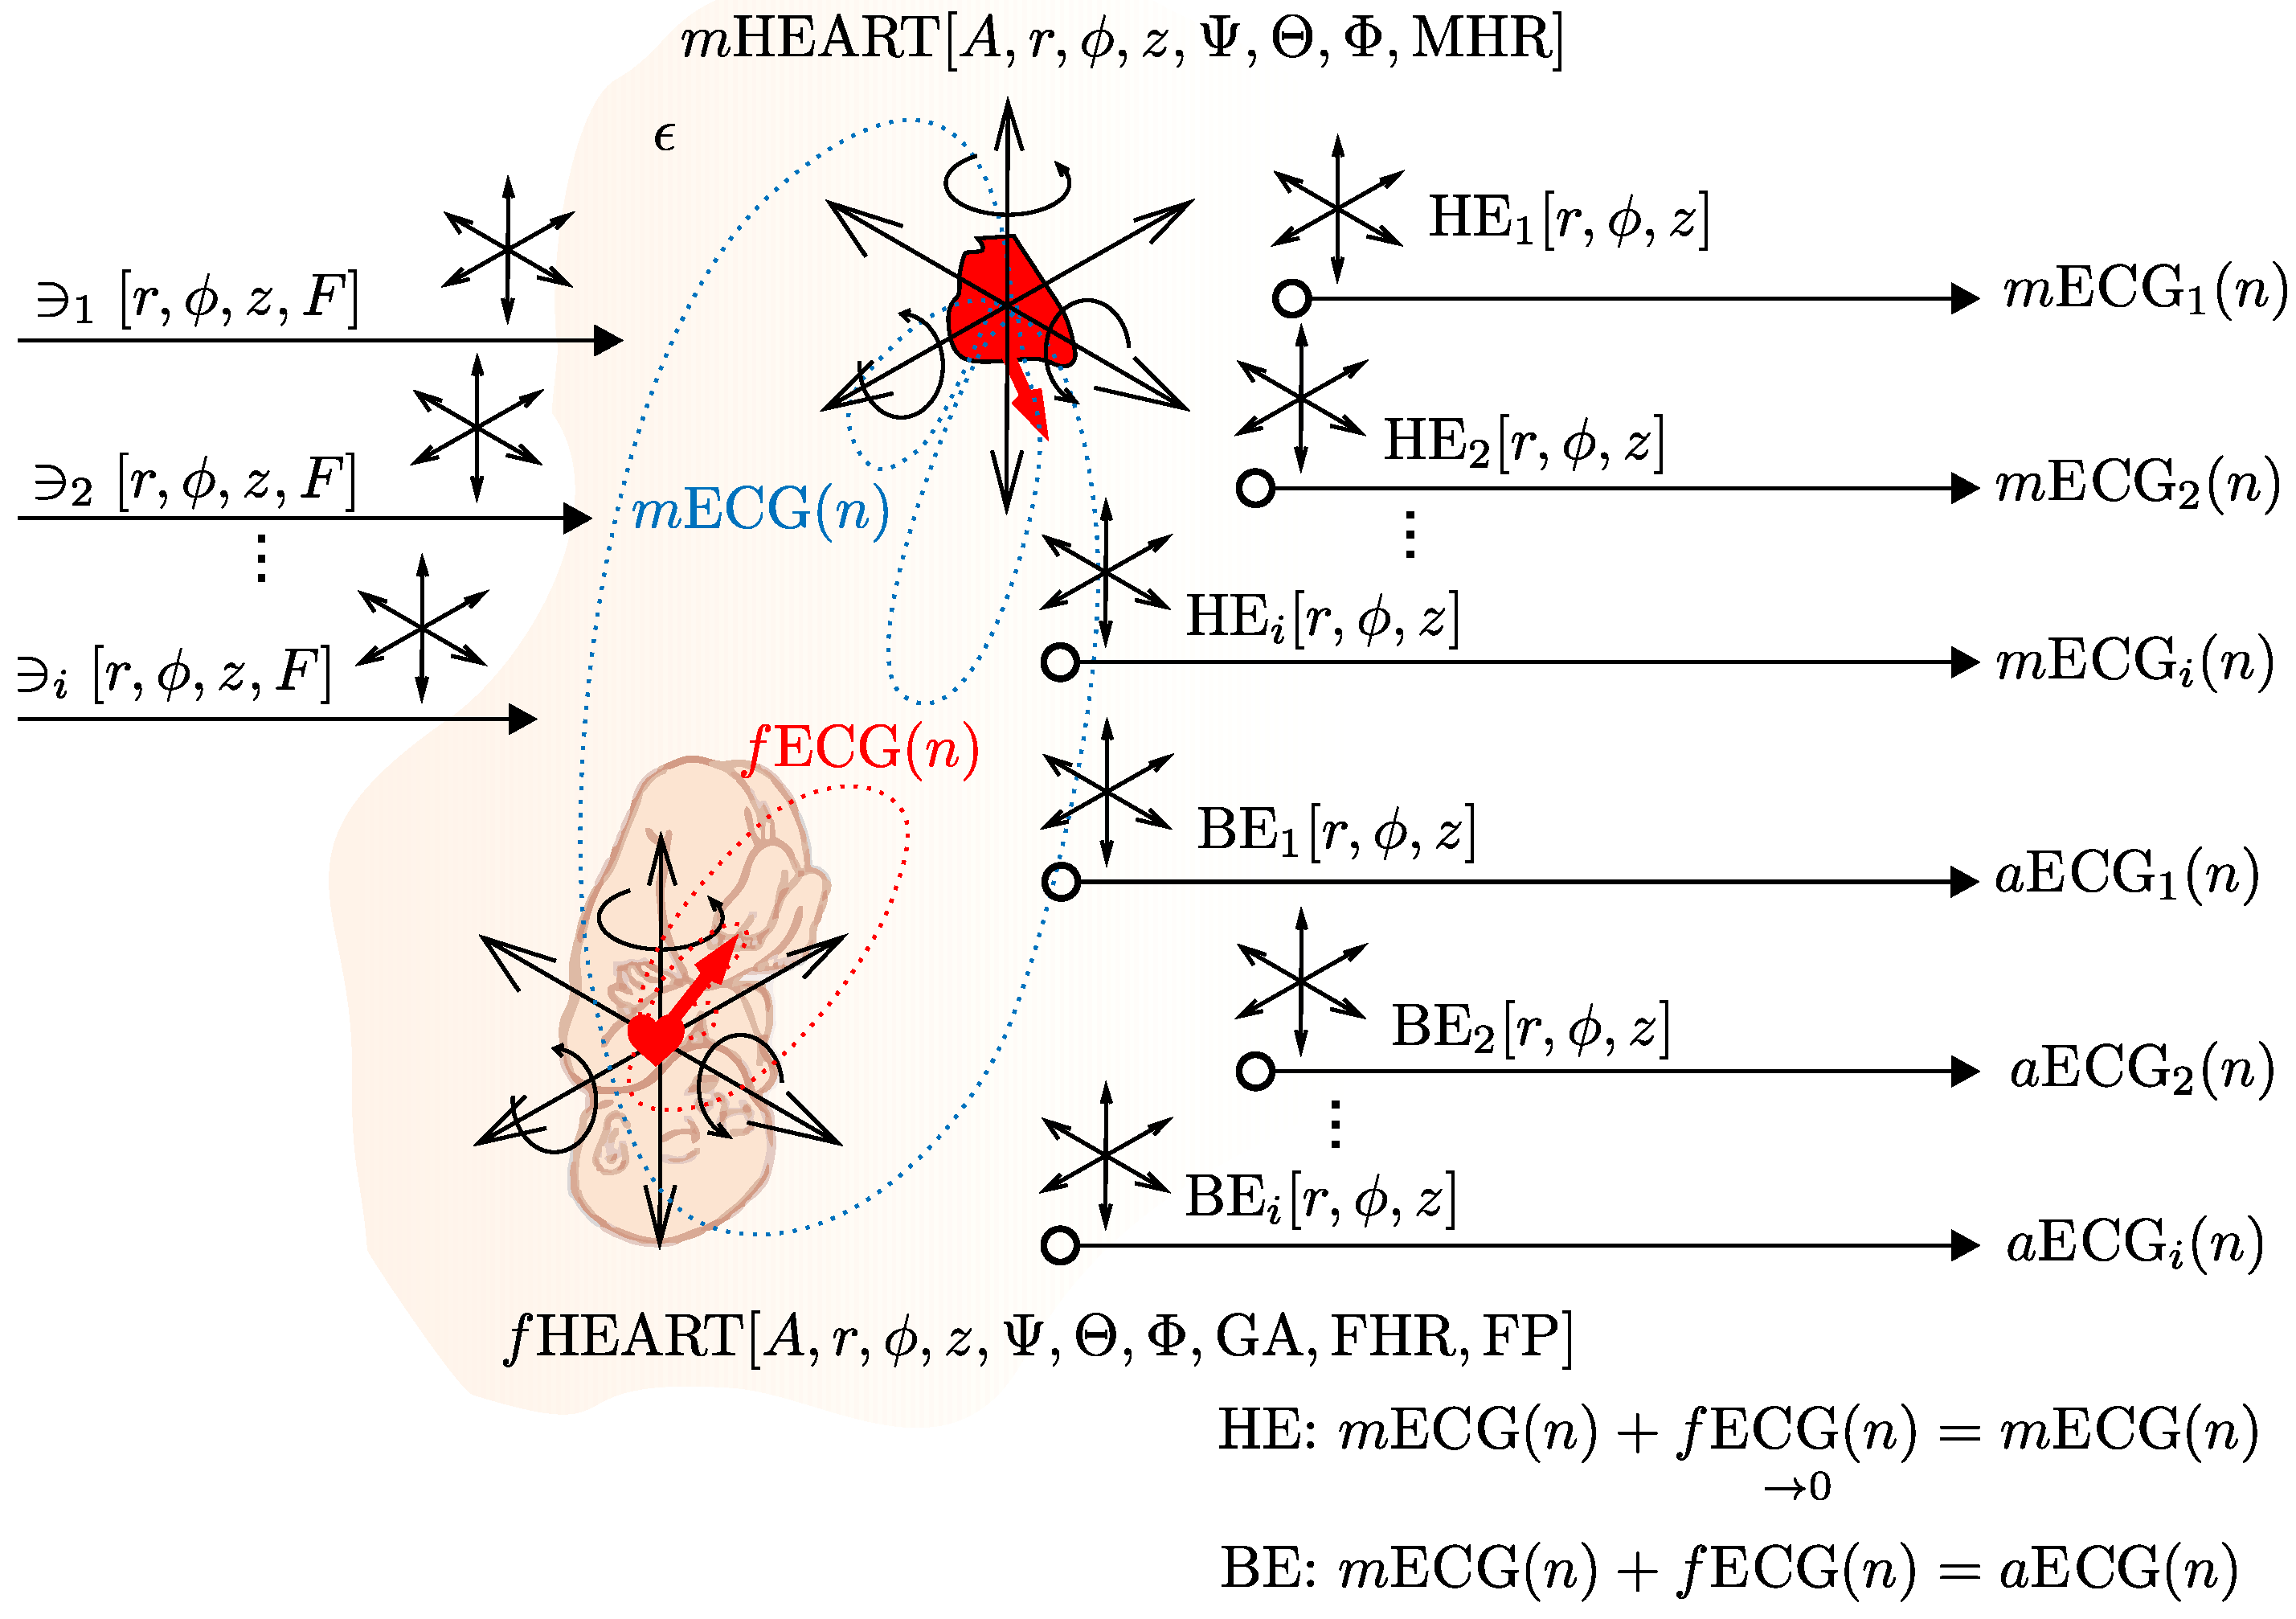
4.2. The Abdominal Maternal-Fetal Electrocardiogram Signal Generator
4.2.1. The Specifications of Our ECG Signal Generator
- Sampling frequency in (Hz),
- Maternal heart rate, (bpm), fetal heart rate , 30 (bpm),
- Gestational age of the fetus in , 20 (weeks); GA reflects the amplitude and duration of the elements, as well as the manual change of the amplitude (generated by and ). The generator allows for the manual change of the length of the signal elements. For more detail, please refer to [55],
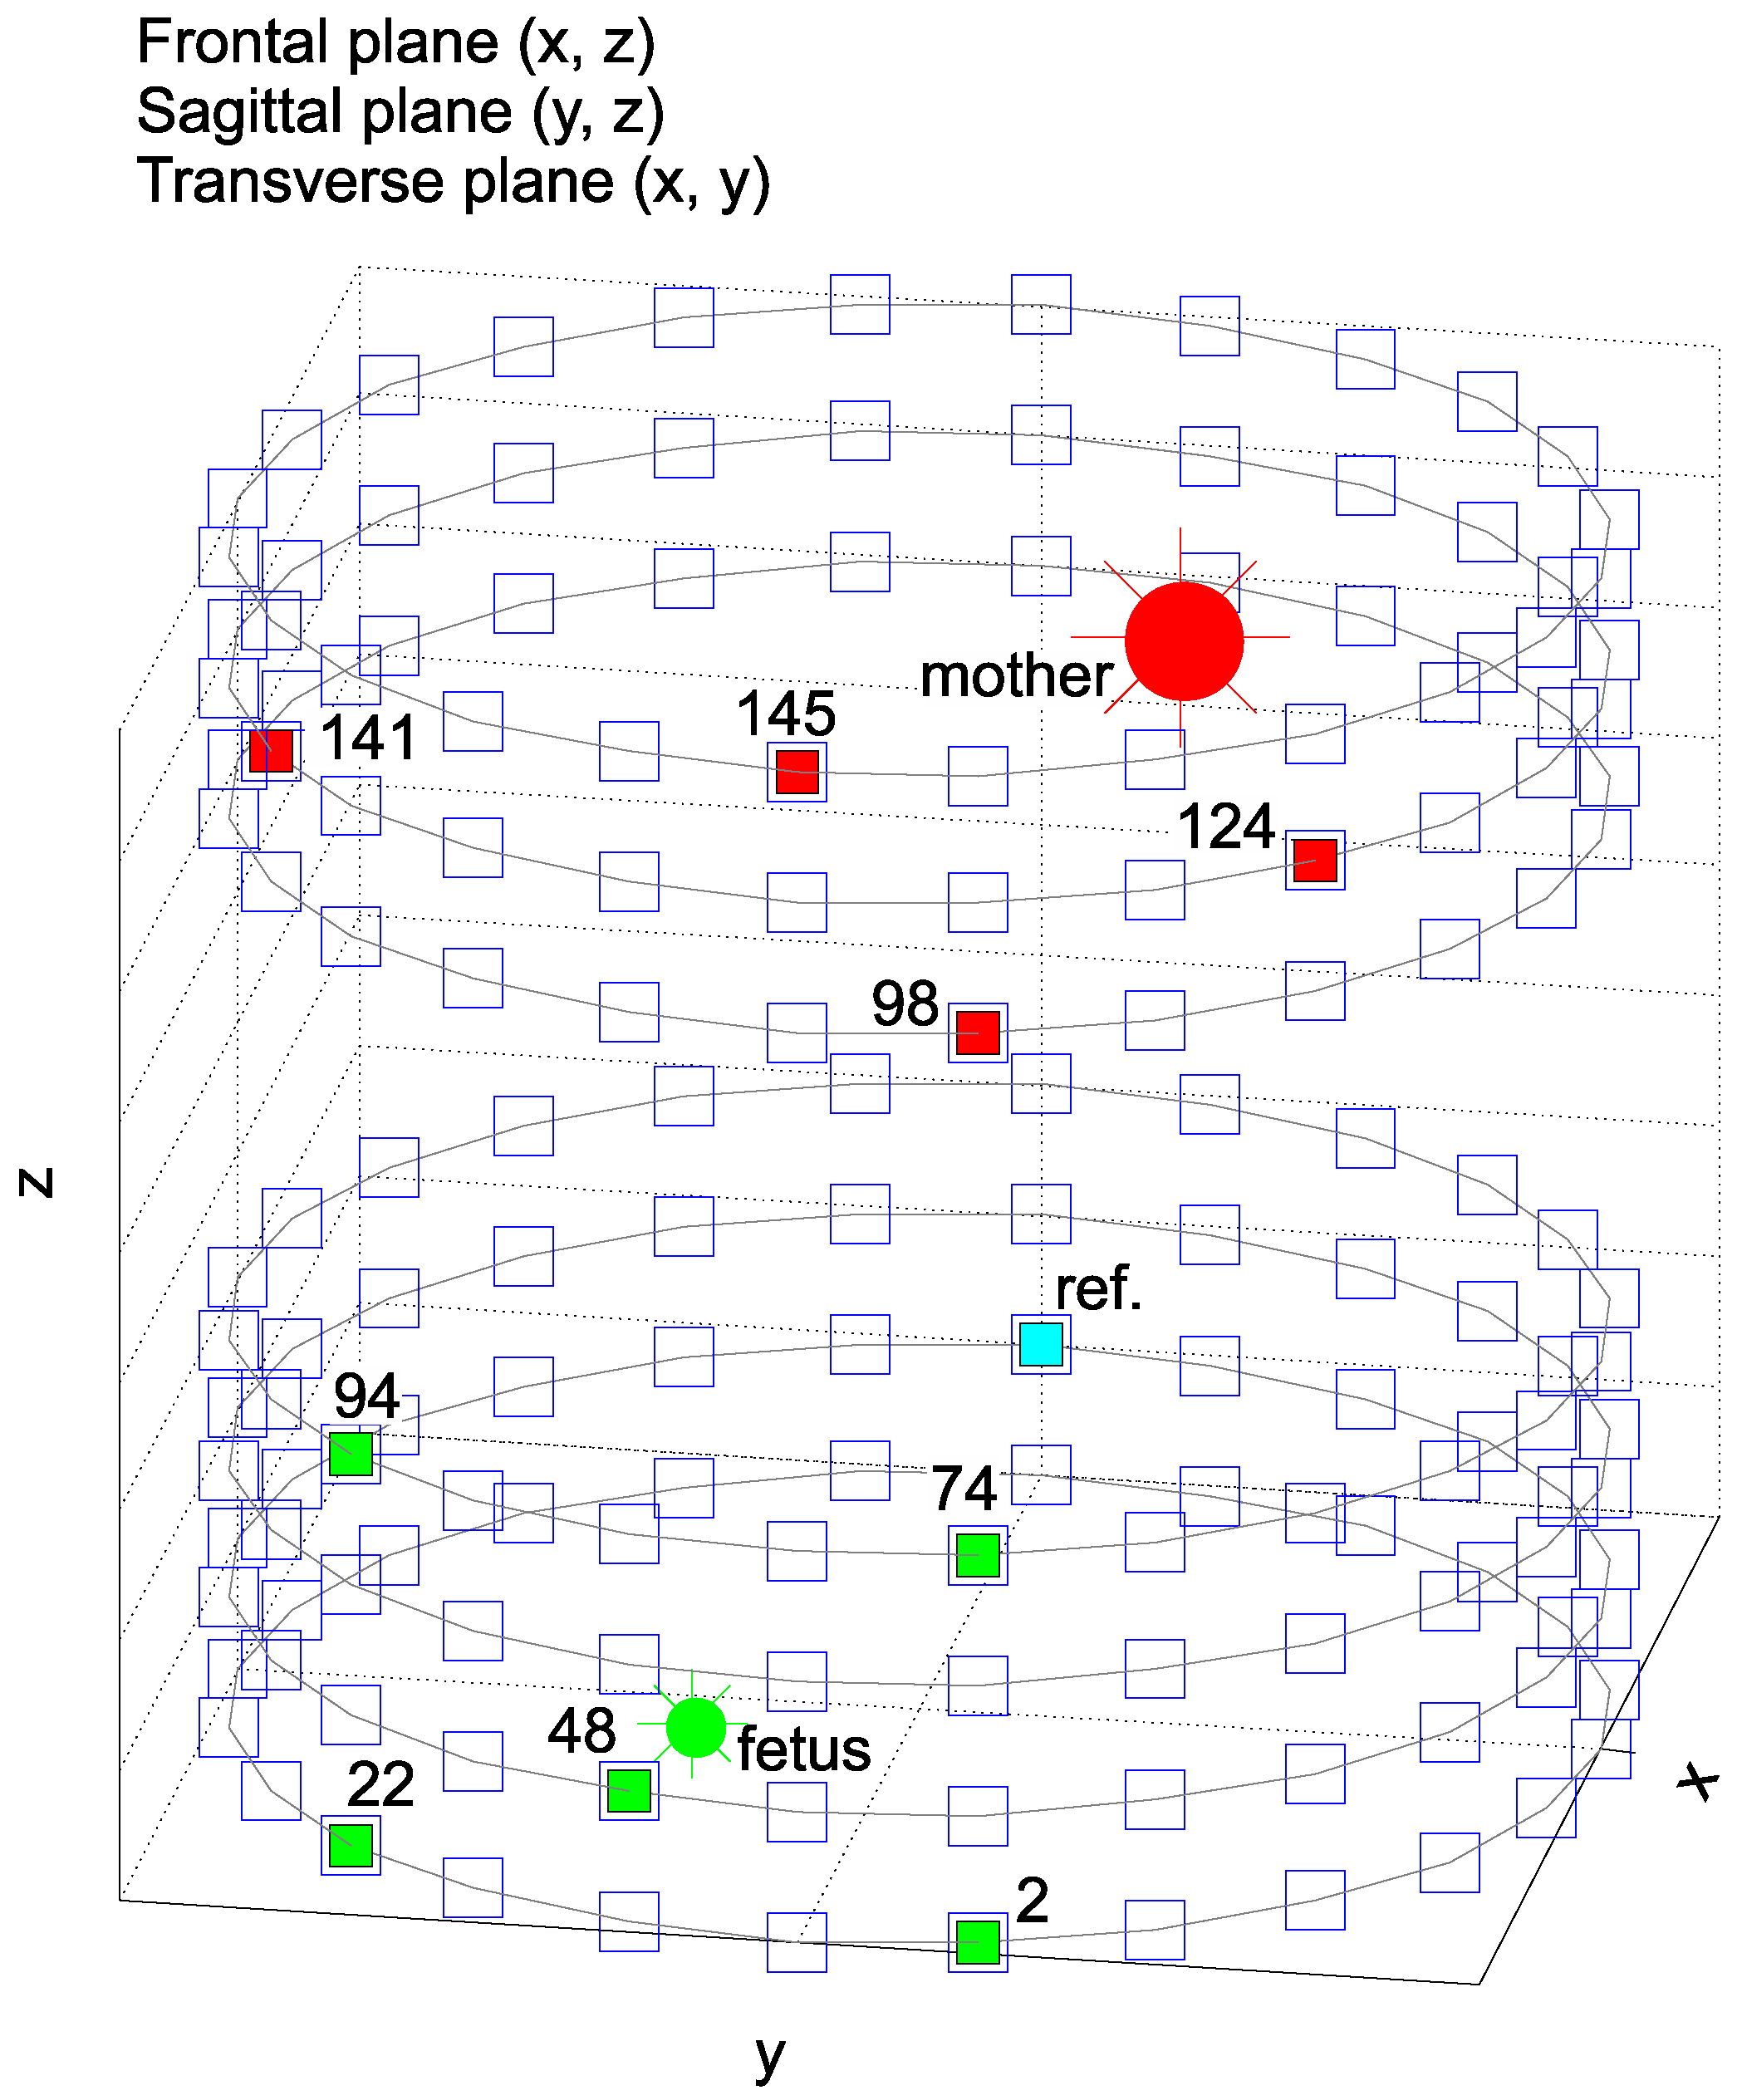
- Heart’s positions including rotations along all axes: the position of the maternal heart (M = mother) in polar coordinates and rotation of the maternal heart, i.e., rotation of vectorcardiogram (VCG) , the position of the fetal heart (F = fetus) in polar coordinates and rotation of the fetal heart ,
- Any number of chest electrodes () and abdominal electrodes ().
- Position of the chest electrodes (TH) and abdominal electrodes (AB) in polar coordinates, i.e., , for the experiments and , for the experiments ,
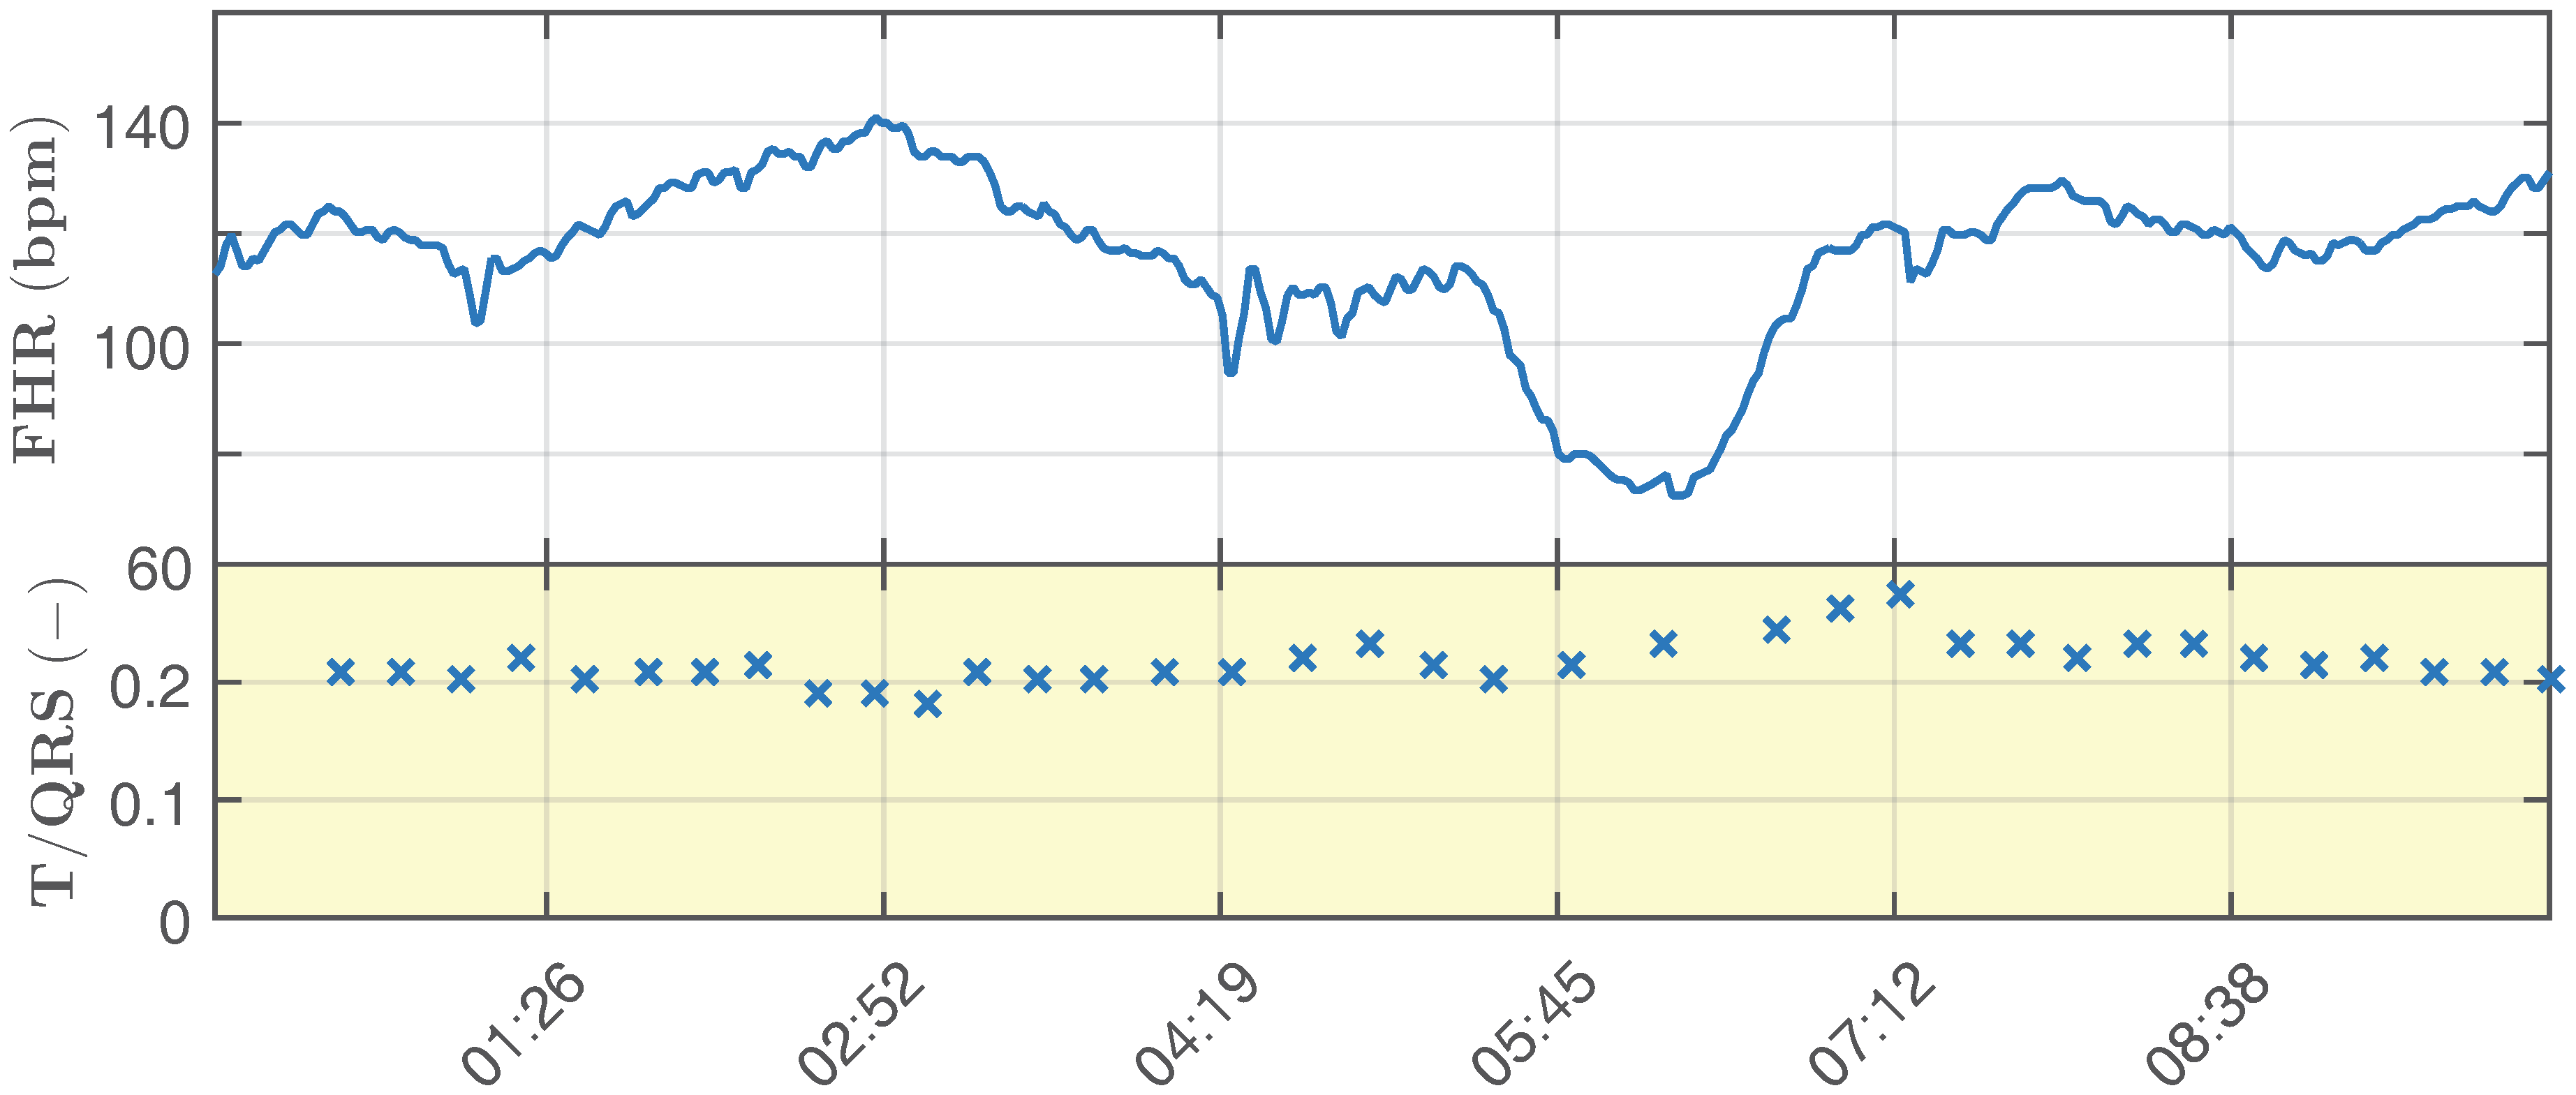
- Modeling hypoxic conditions based on changes in T/QRS (i.e., hypoxemia, hypoxia and asphyxia) and in accordance with clinical guidelines for CTGand STANanalysis. The generator allows manual modeling of the hypoxic conditions; see [56],
- Modeling different types of noise and interferences (such as powerline interference, electromyographic (EMG) interference, baseline wandering, movement artifacts, and others), as well as amplitude, frequency and the position of the source of the interference in polar coordinates
4.3. Data Selection Criteria
4.4. Description of ECG Signals Used in Our Experiments
- Ideal = reference signal for the adaptive system, i.e., TH98, TH124, TH141 and TH145 with a variable maternal heart rate () in the range of 65–85 bpm. This parameter takes into account the duration of segments on .
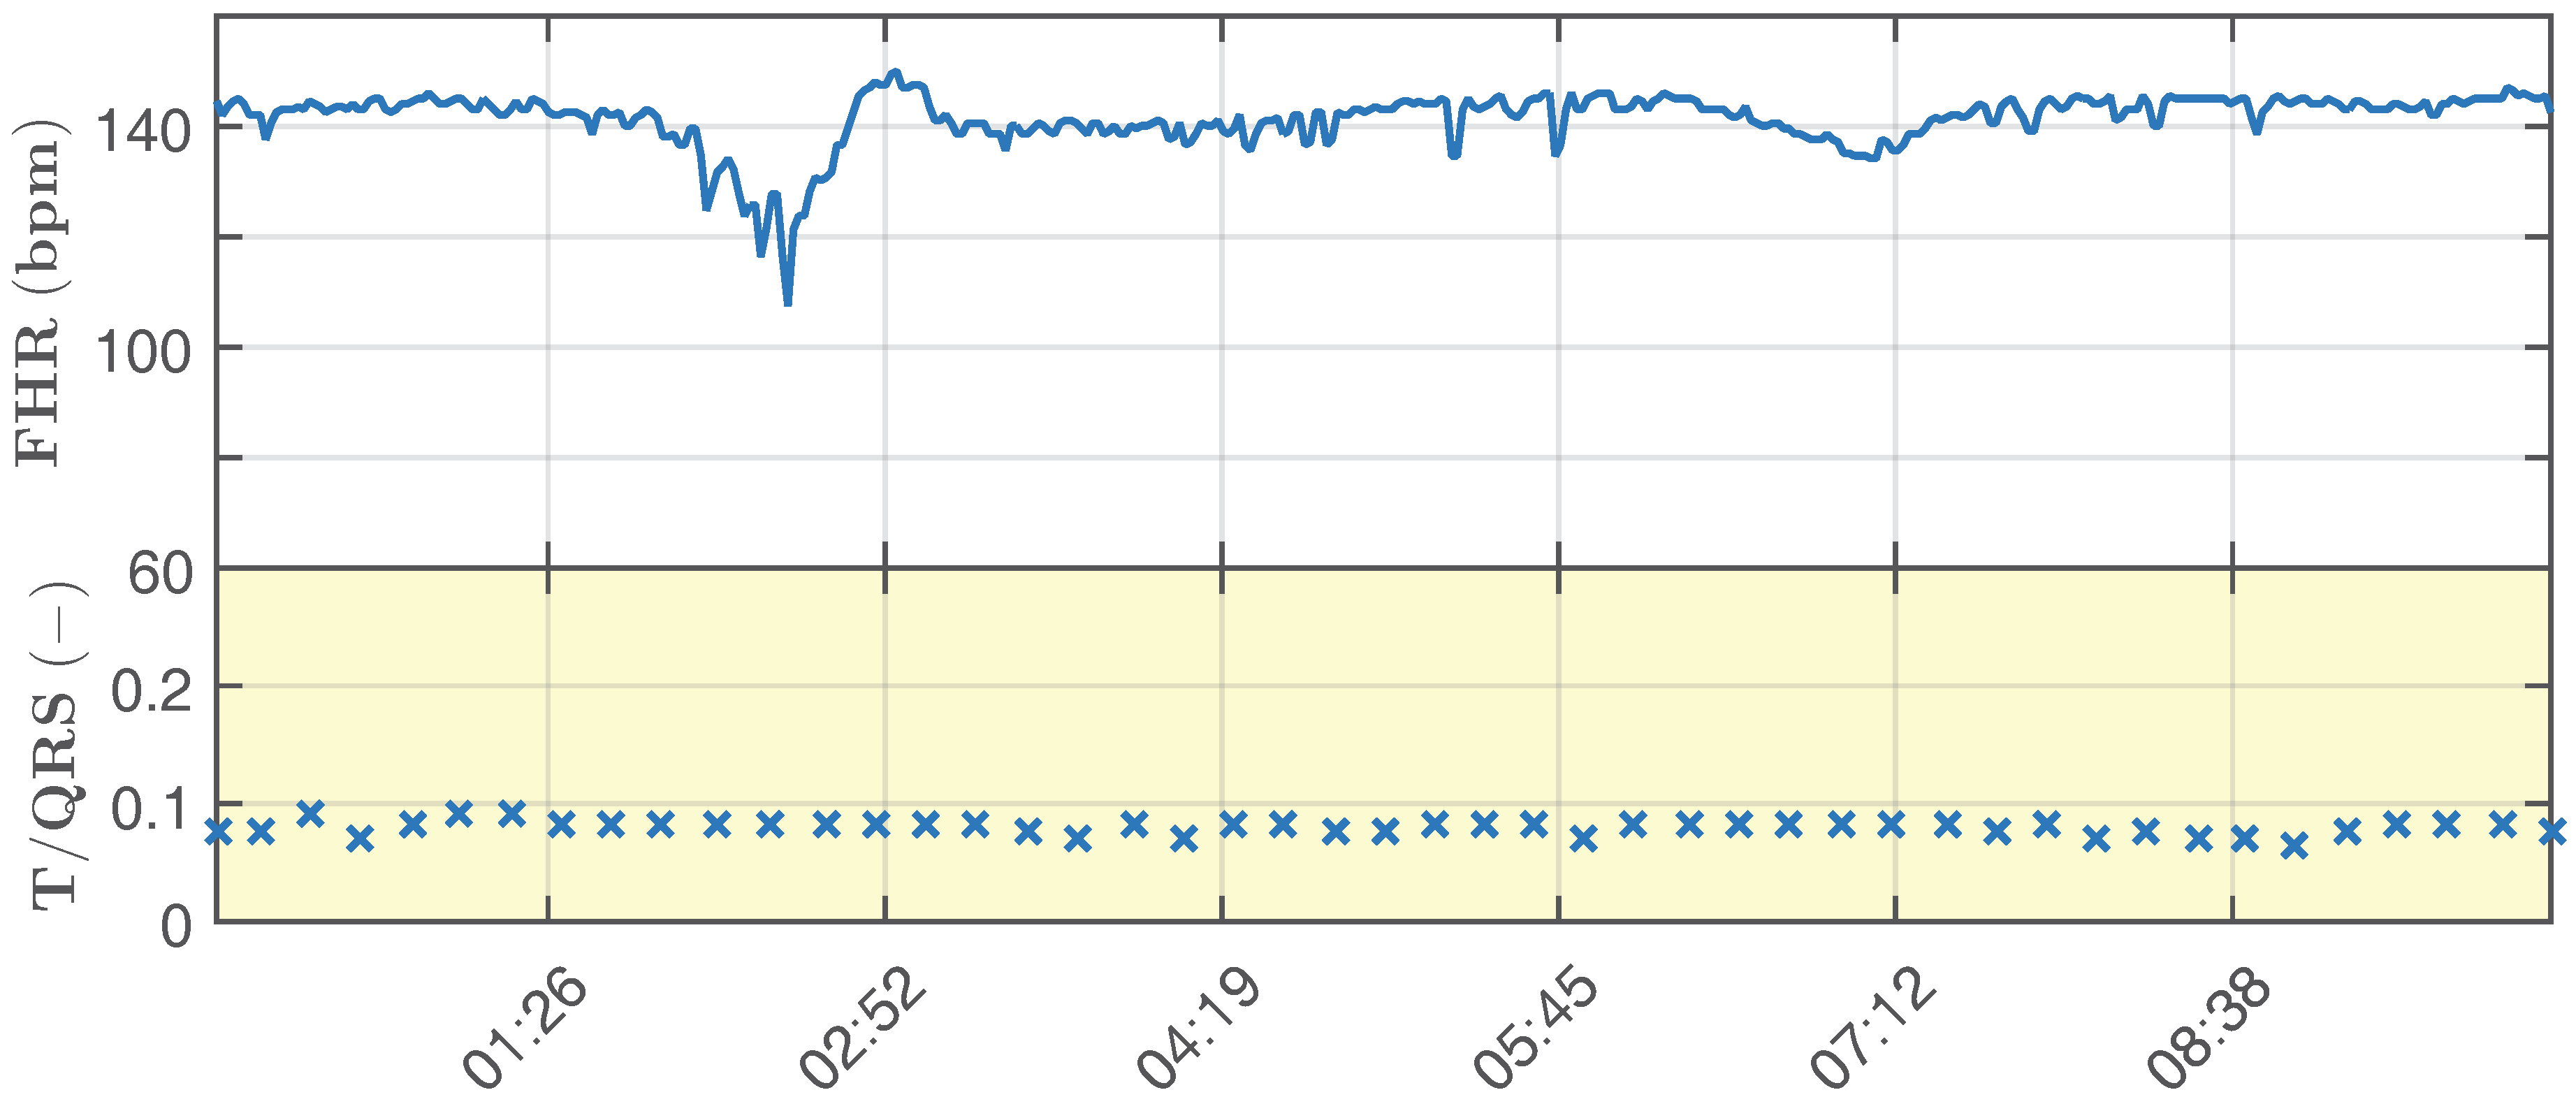
- Ideal physiological signals: primary input to the adaptive system (abdominal electrodes AE2, AE22, AE48, AE74, AE94) with a variable fetal heart rate in the range of 110–150 bpm and T/QRS in the range of 0.05–0.1 (Figure 8).
- Ideal pathological signal, which simulates fetal hypoxia (it is unstable and shows significant changes in the determined fHR and T/QRS).
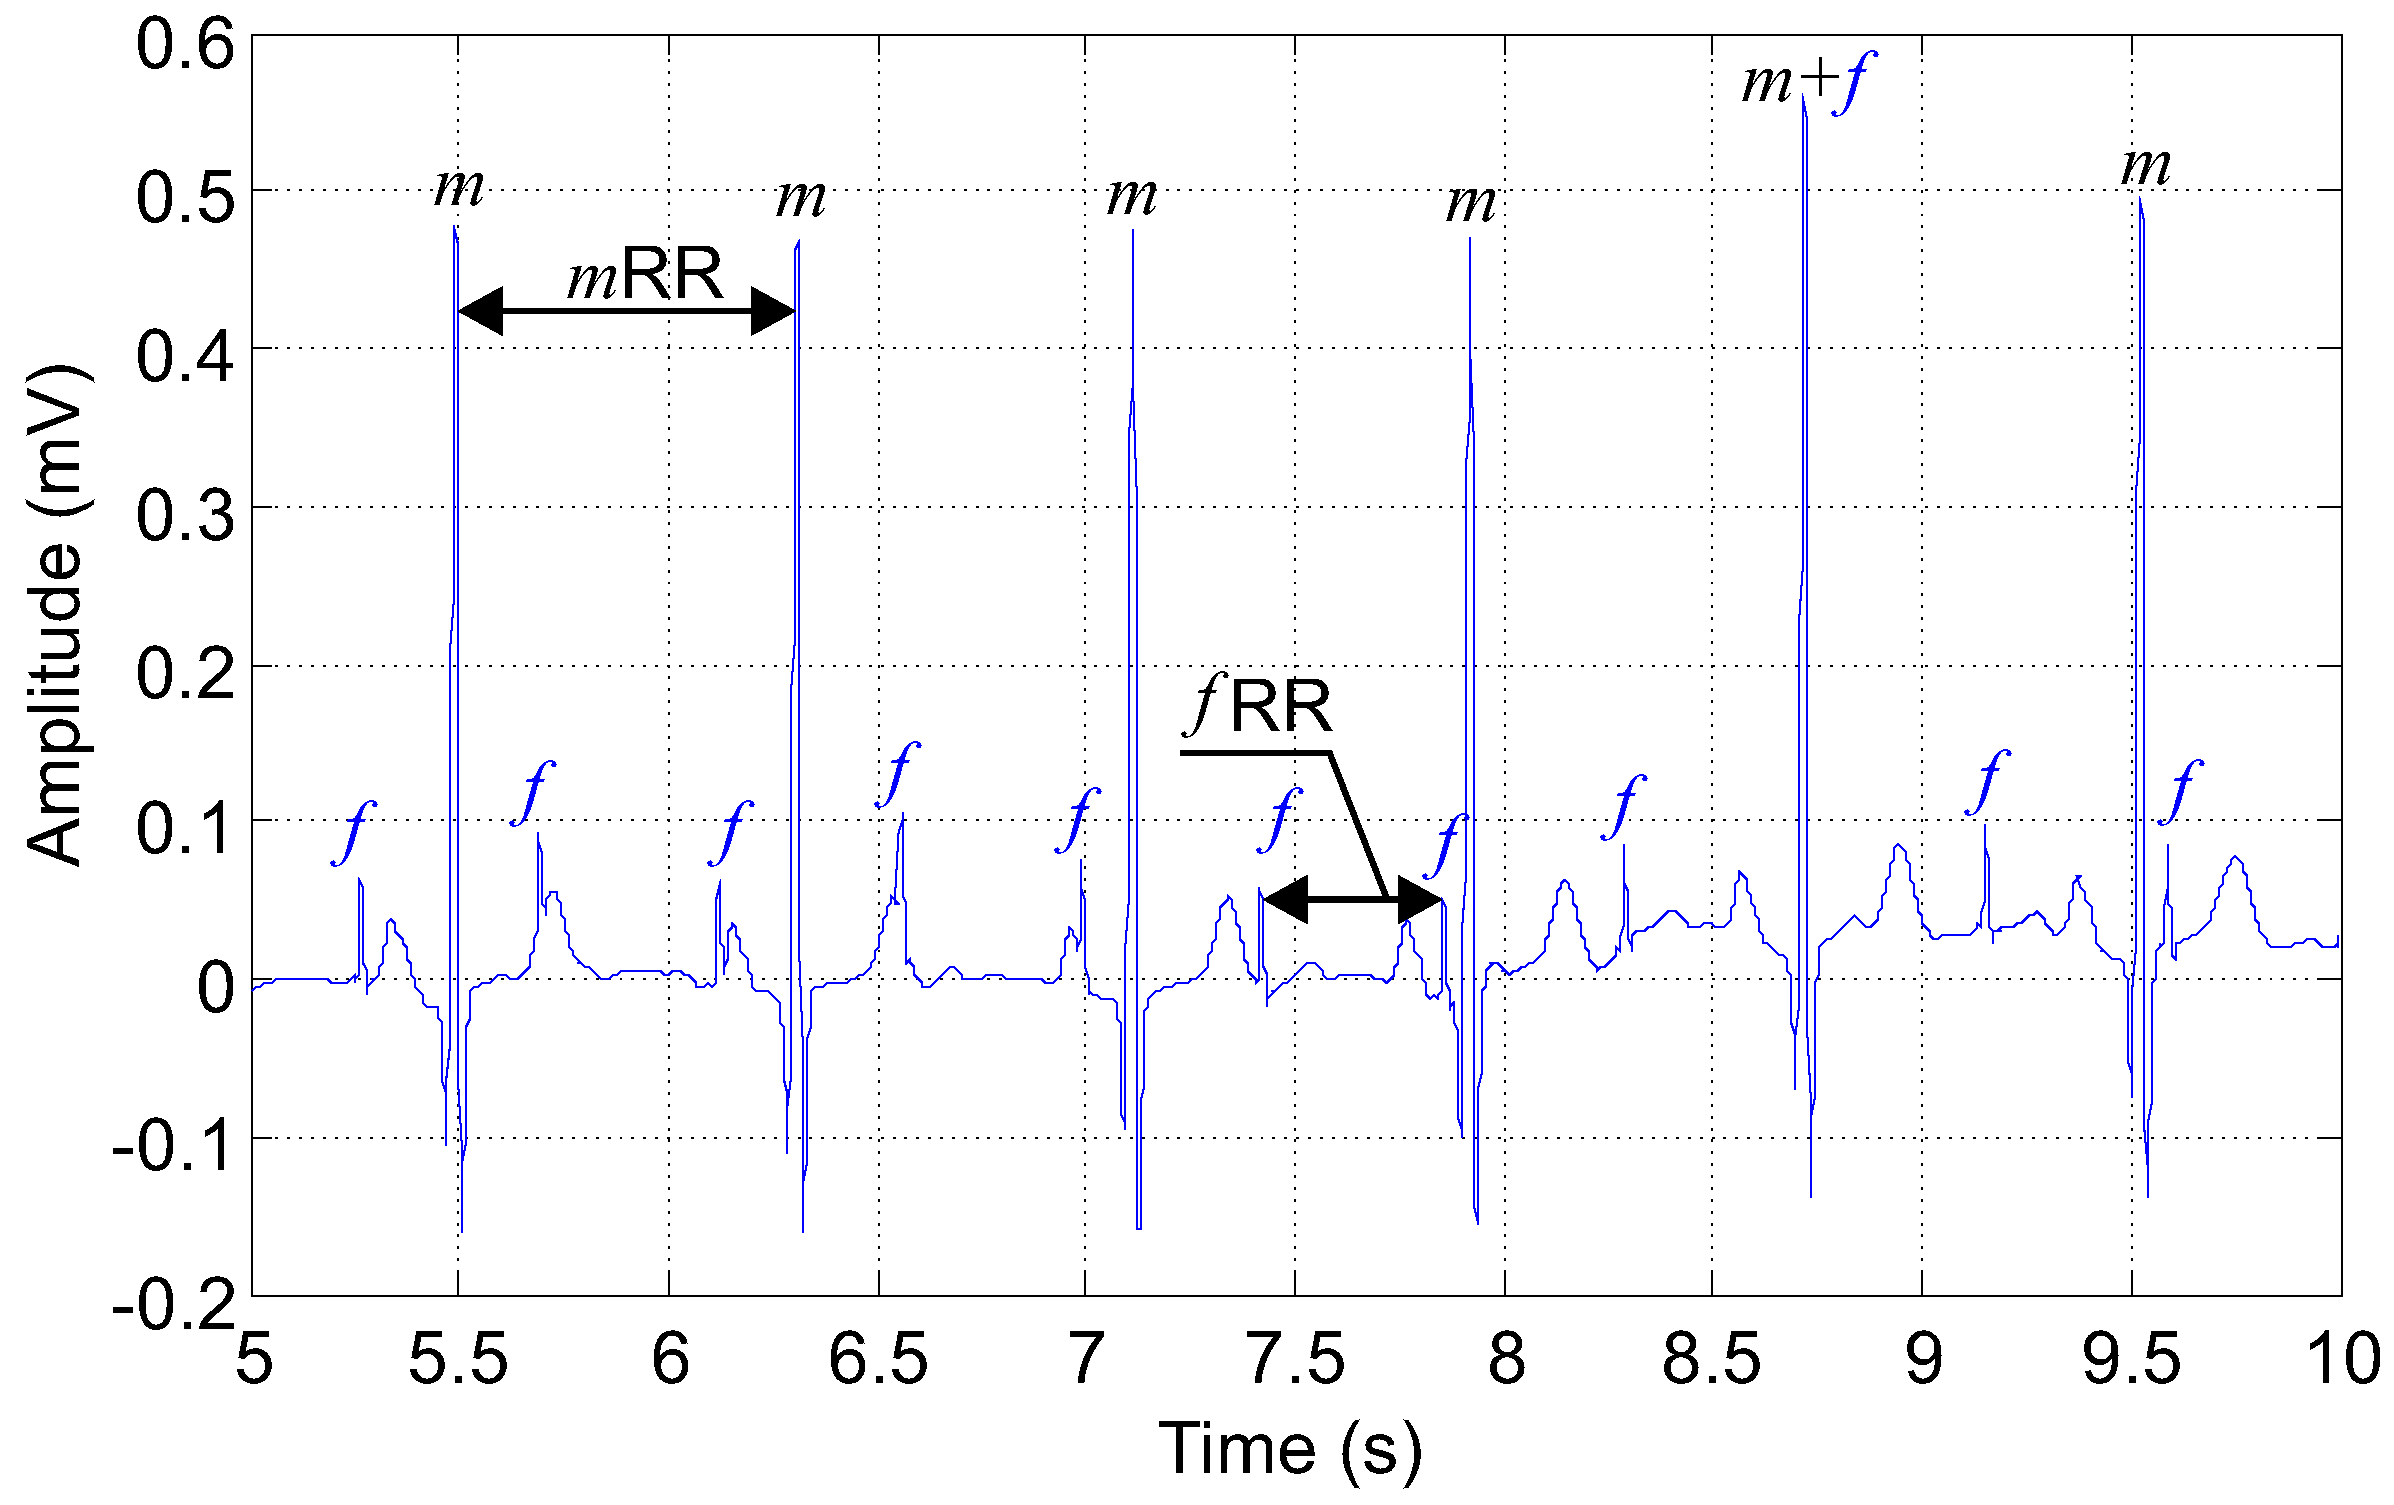
- Length = 20 min, sampling frequency = 1 kHz, quantization step size = 0.1 mV. Please note that for clarity of the display, the recordings in the figures are 5 s long (Figure 7).
- Gestational age of the fetus = 40 weeks (this parameter affects the duration of individual signal elements),
- Input Signal-to-Noise Ratio (SNR) for individual lead combinations,
- For our experiments, we used the head-down position known as the vertex presentation, which is the most probable (96.8%) and the appropriate presentation for birth. The presentation of the fetus is an important parameter since it influences the fetal cardiac signals recorded from the maternal body surface over different leads [27].
4.5. Evaluation of Signal Filtering Quality
4.5.1. Signal-to-Noise Ratio
4.5.2. Sensitivity
4.5.3. Positive Predictive Value
5. Results
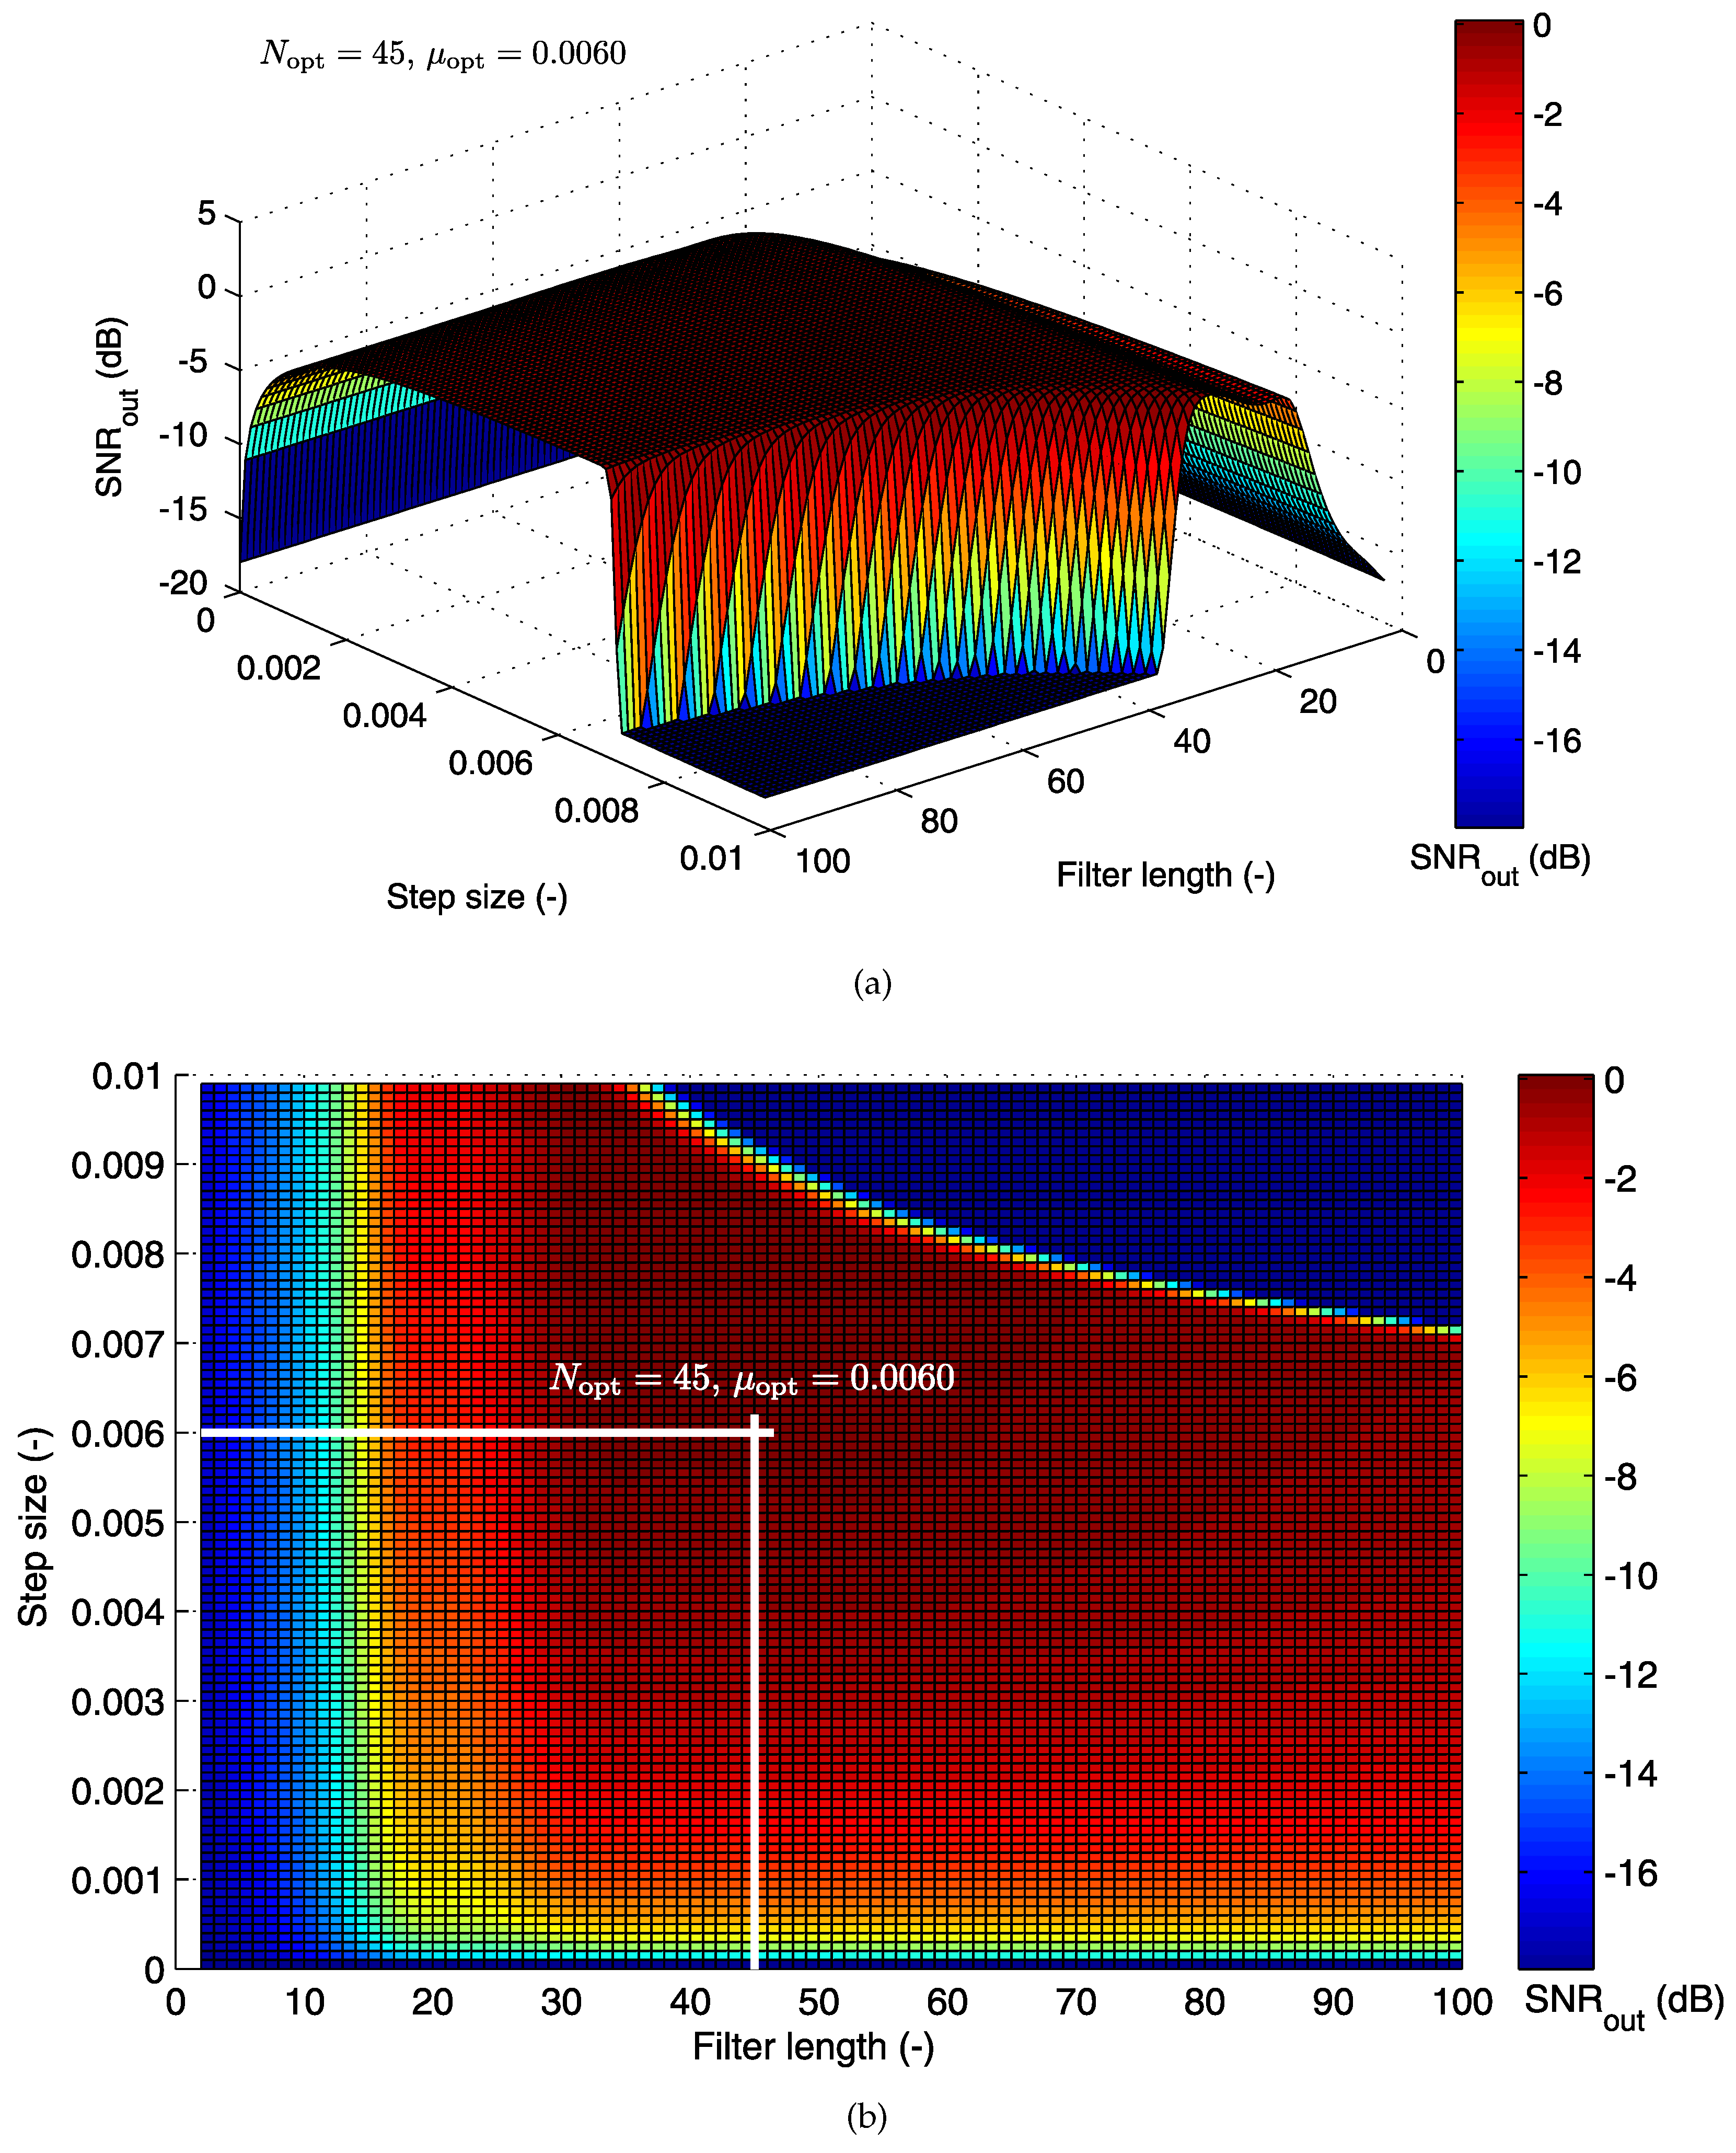
5.1. Optimization Graphs
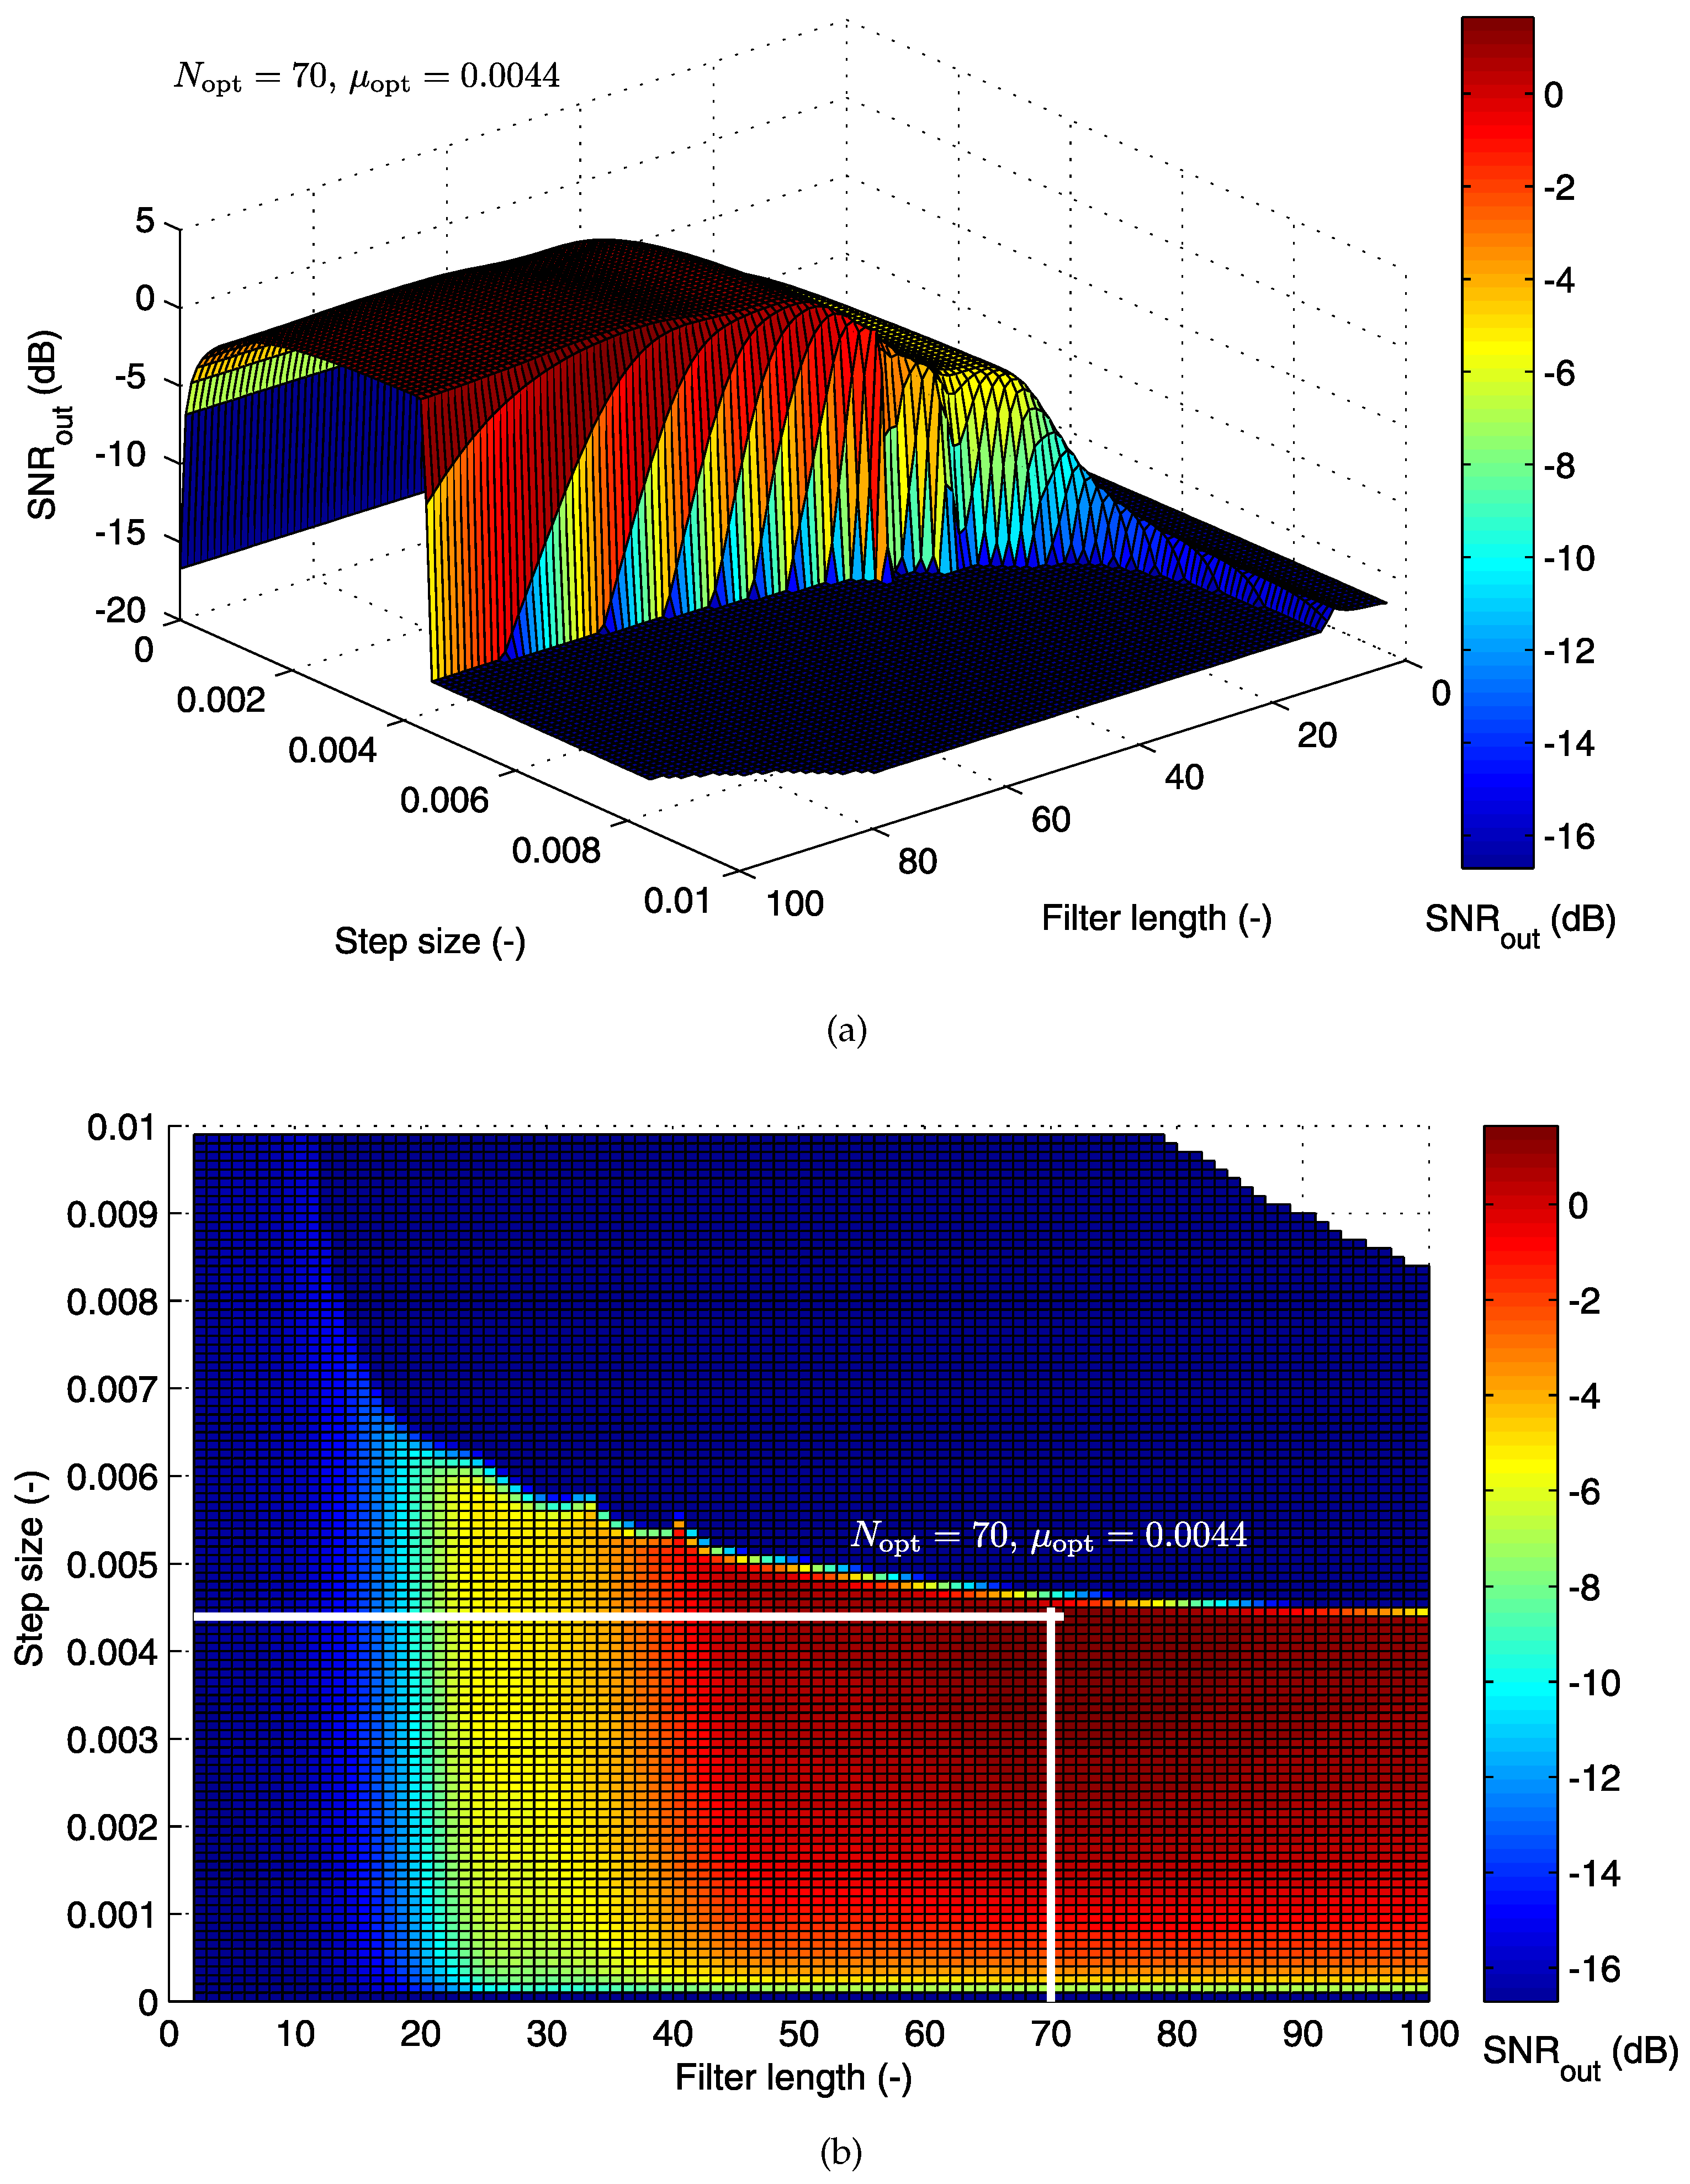
5.1.1. Cost Function for the LMS Algorithm
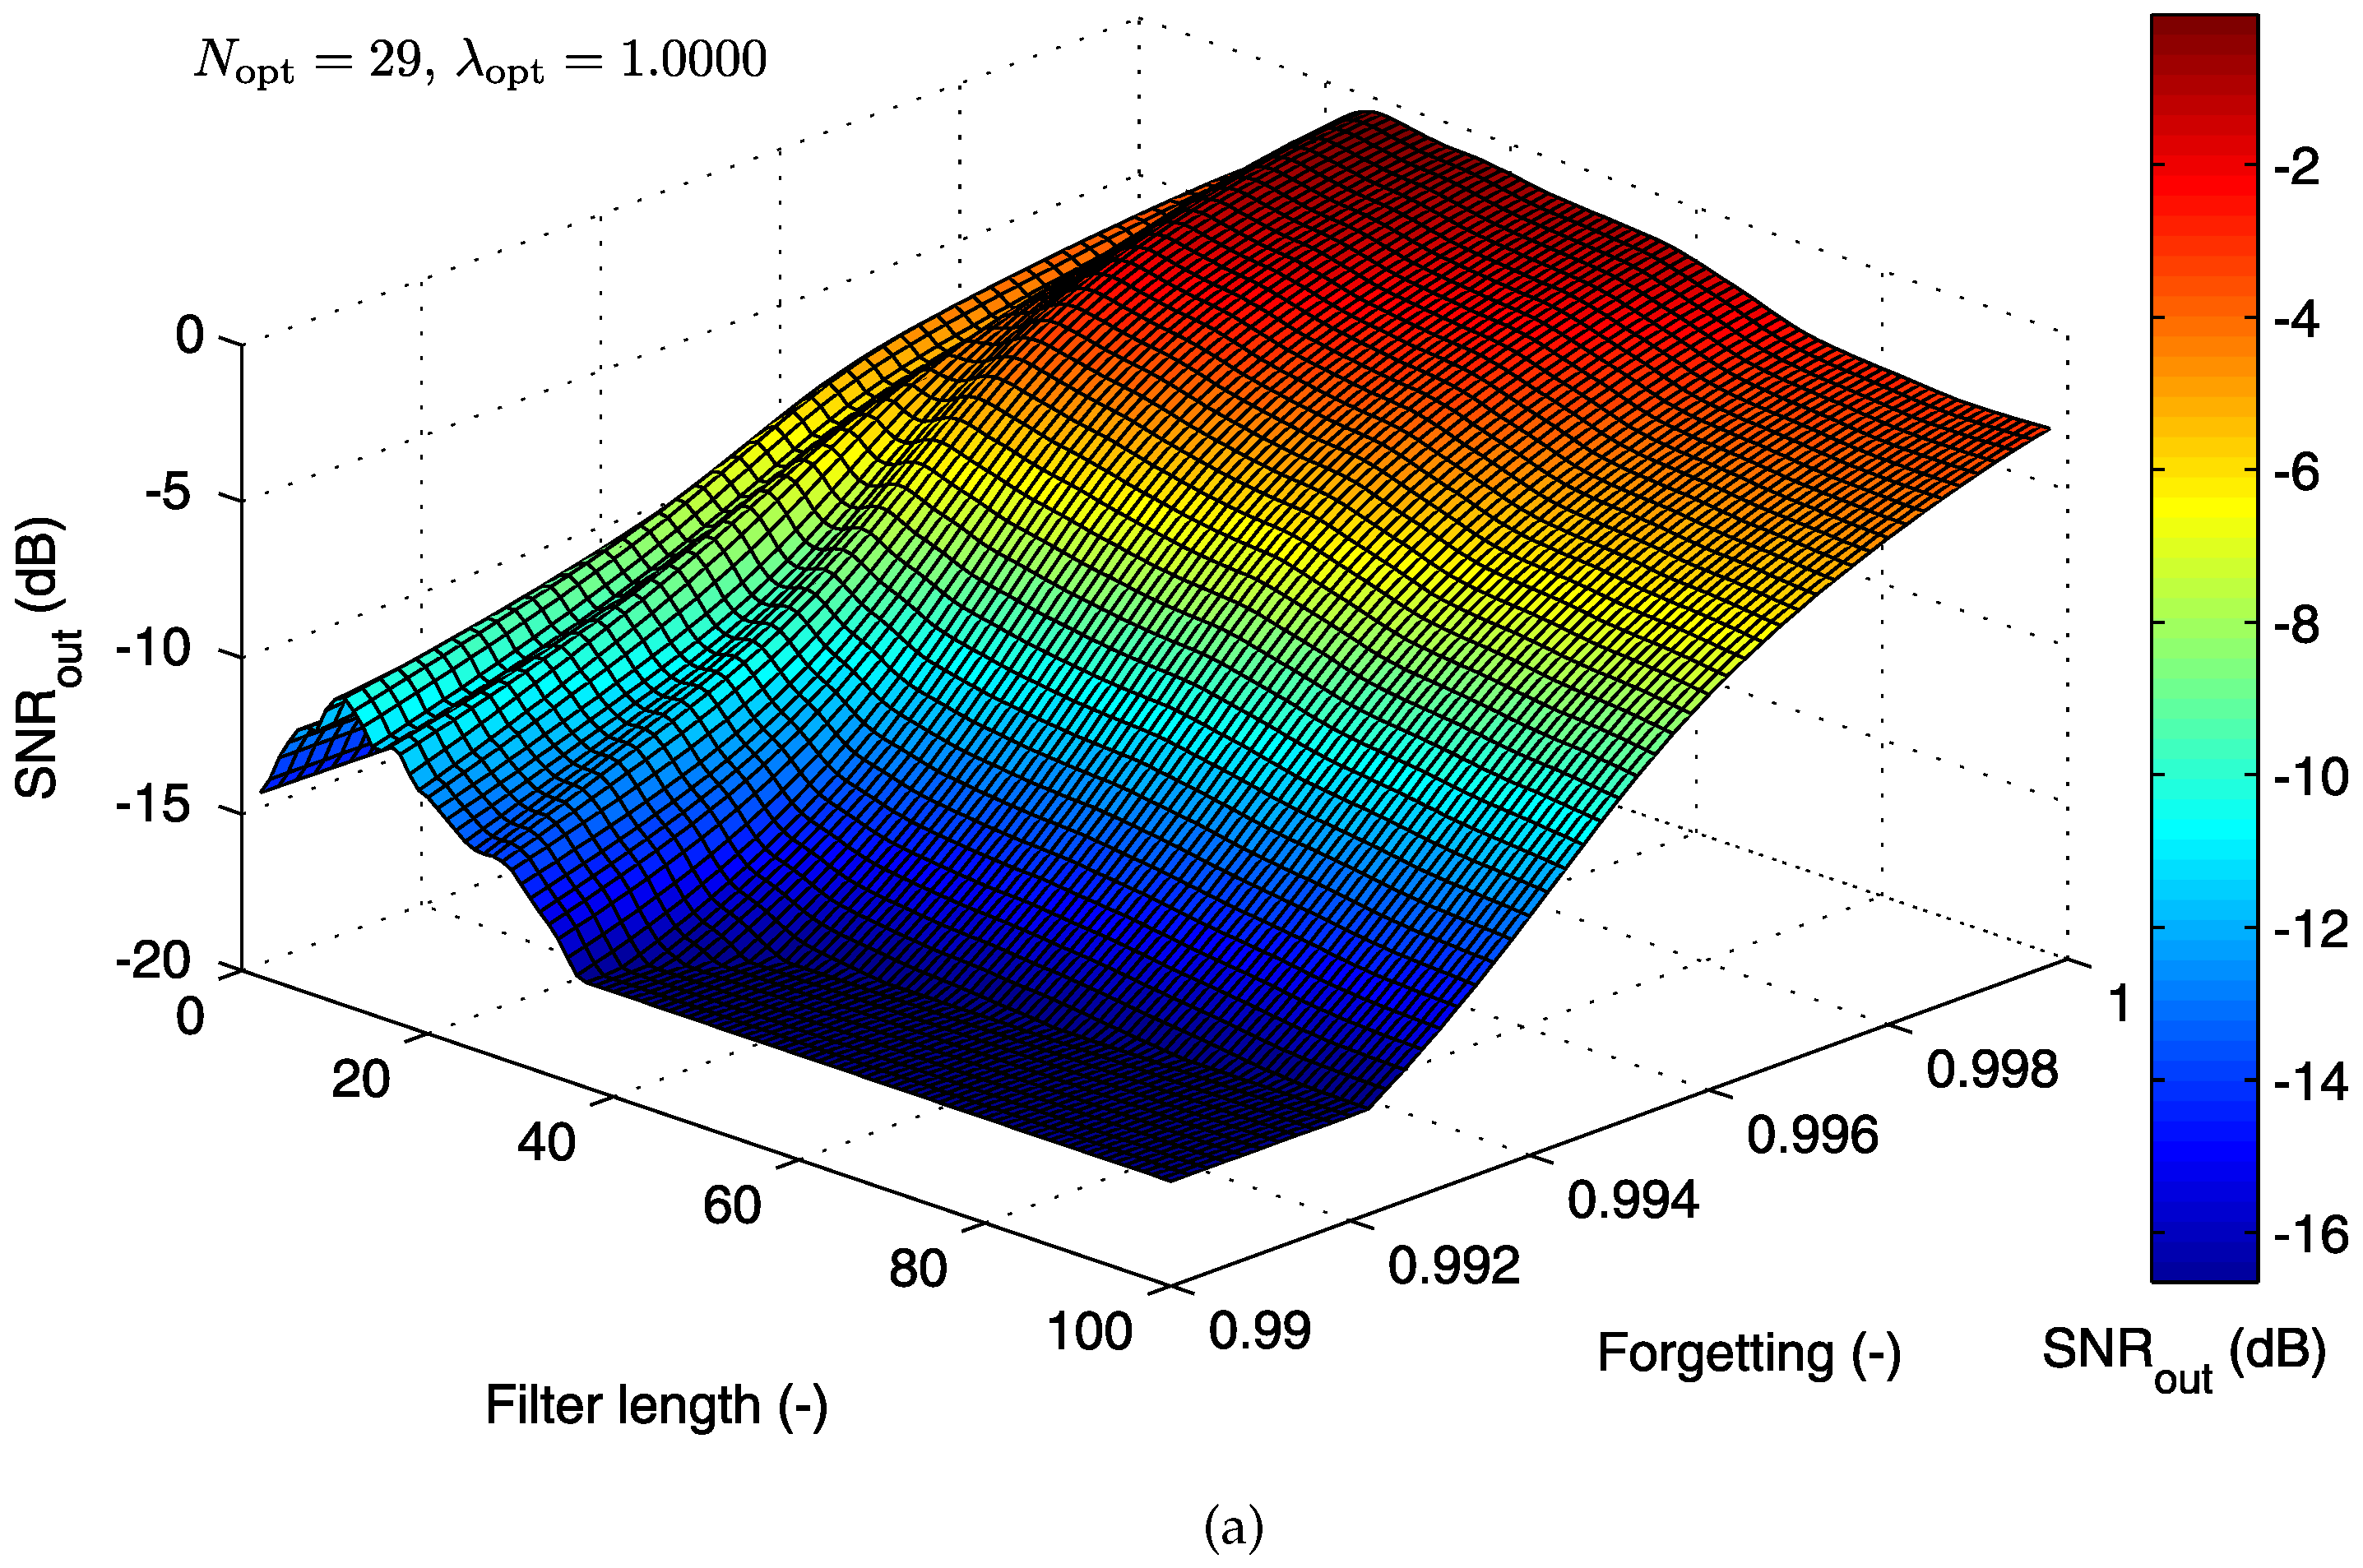
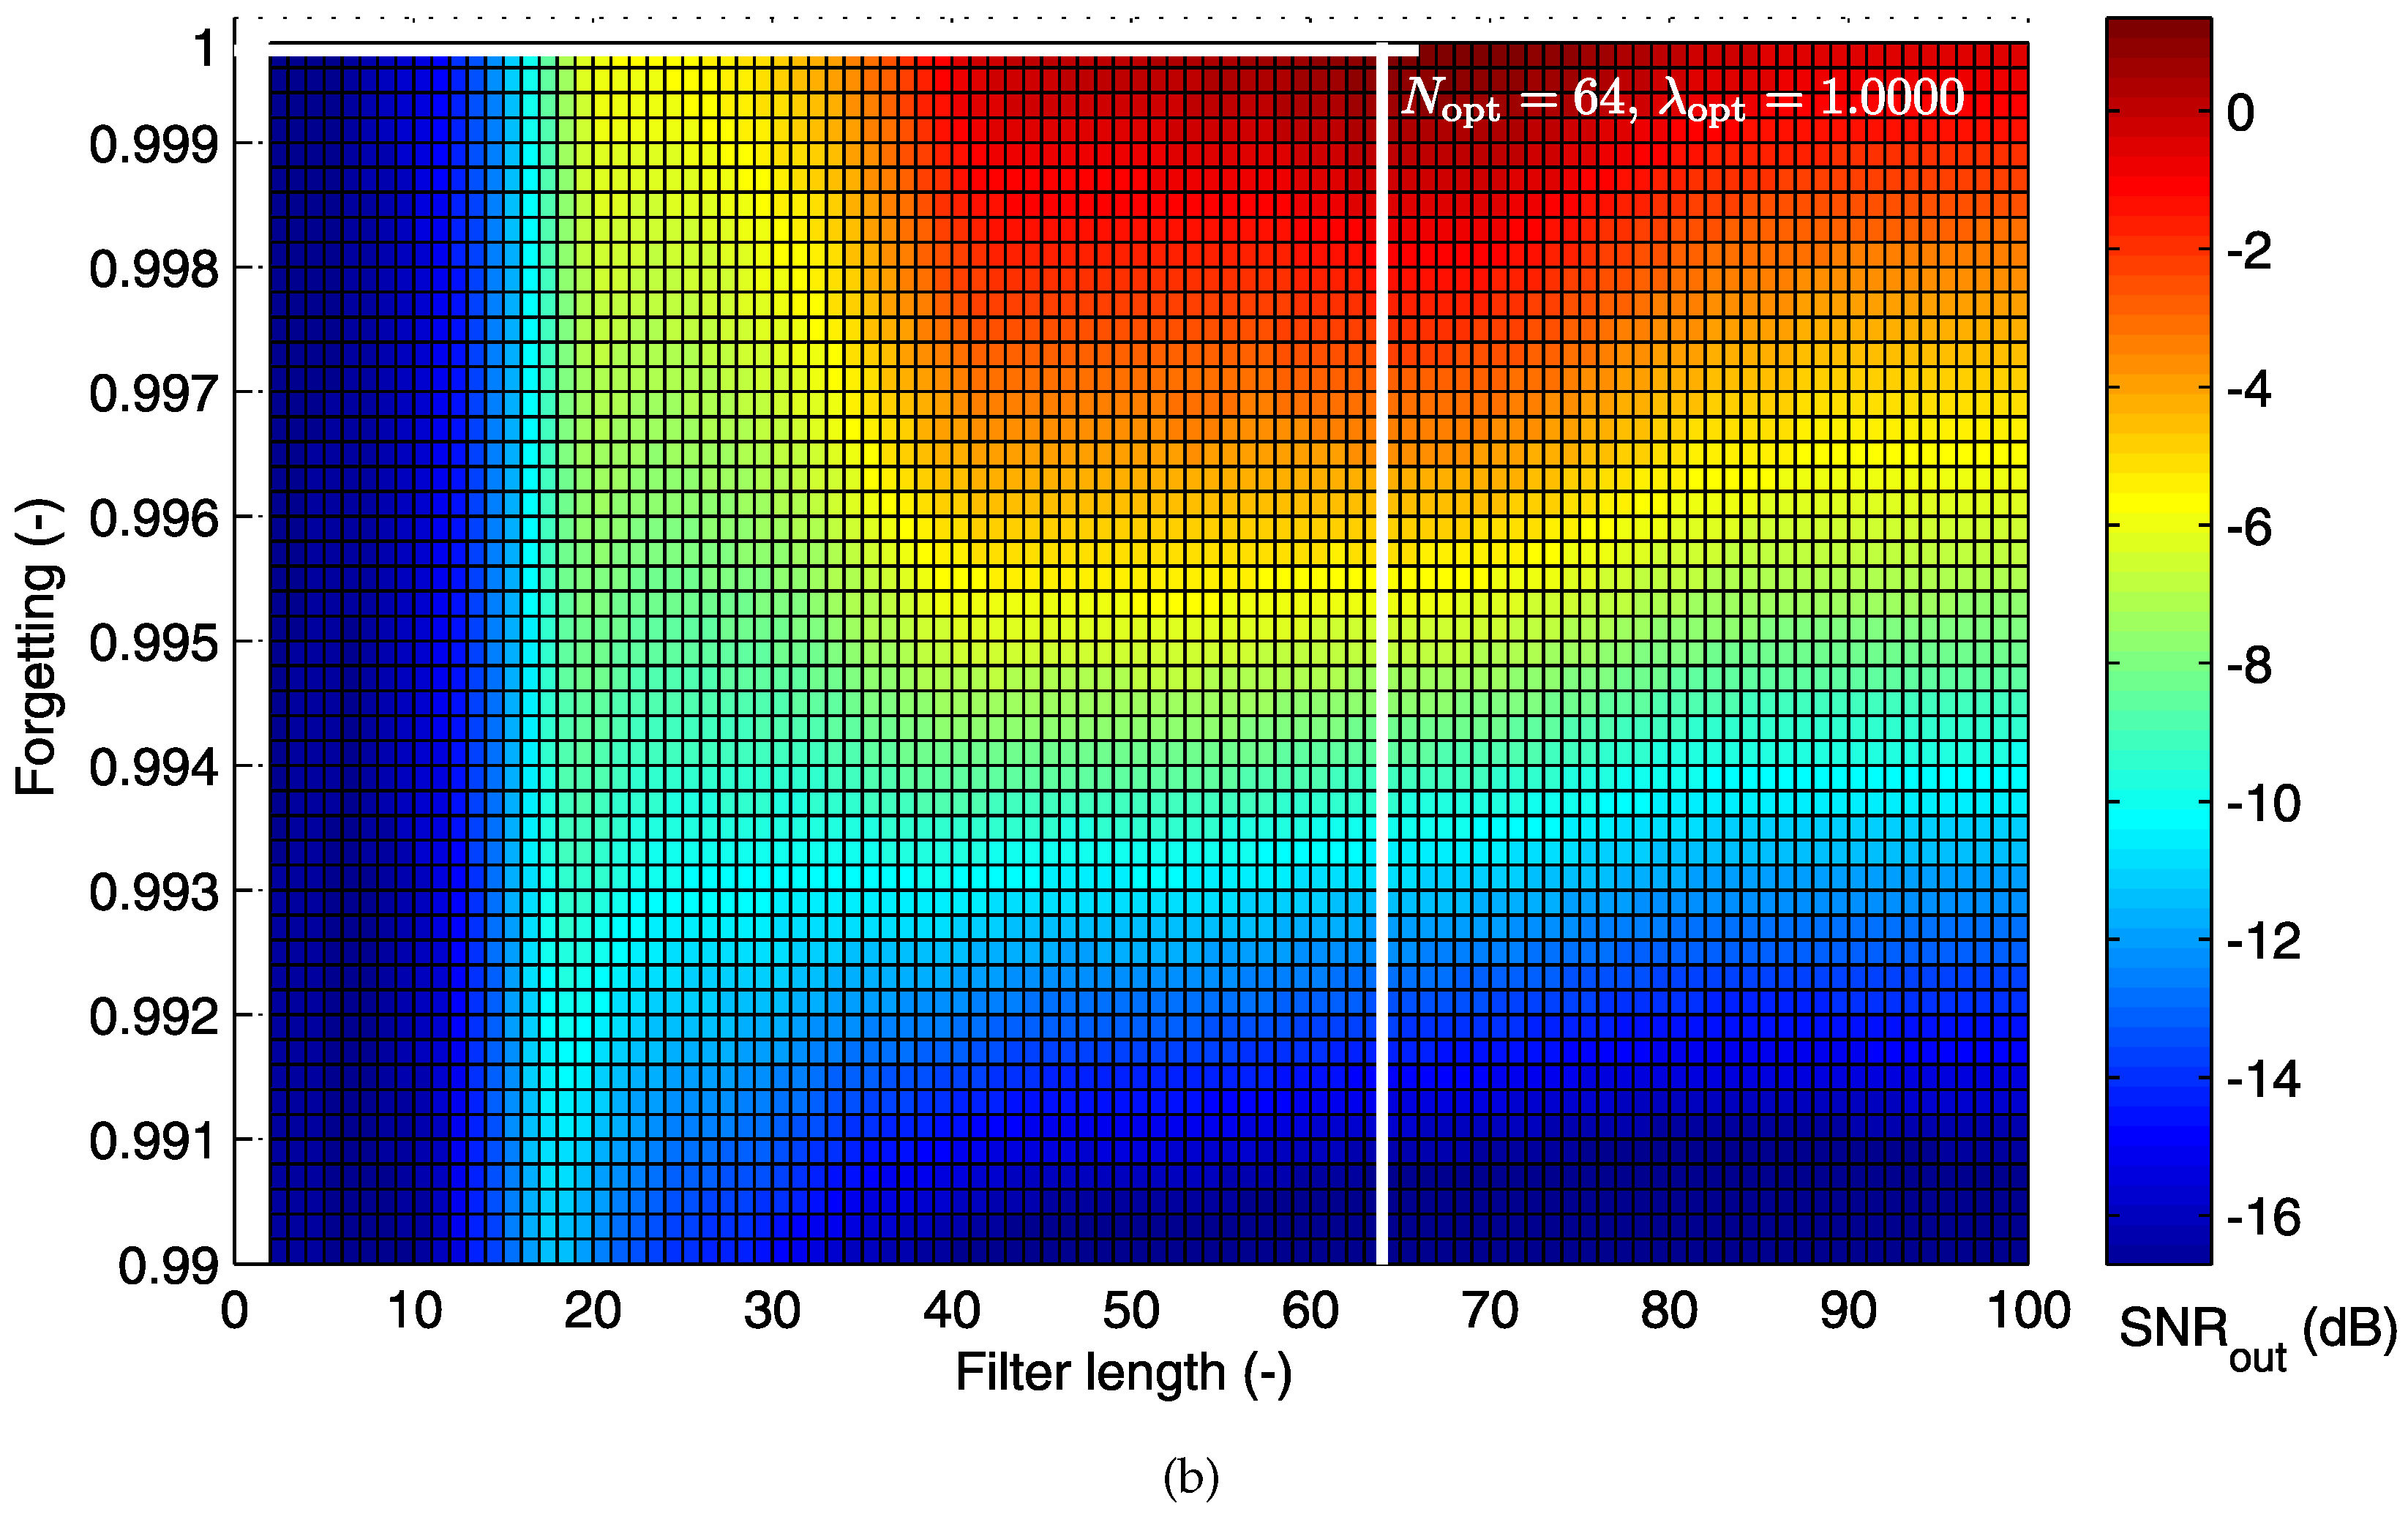
5.1.2. Cost Function for the RLS Algorithm
5.2. Electrode Placement-Based Optimization
5.3. Examples of Filtered Signals
5.3.1. The LMS-Based Adaptive System (Filter)
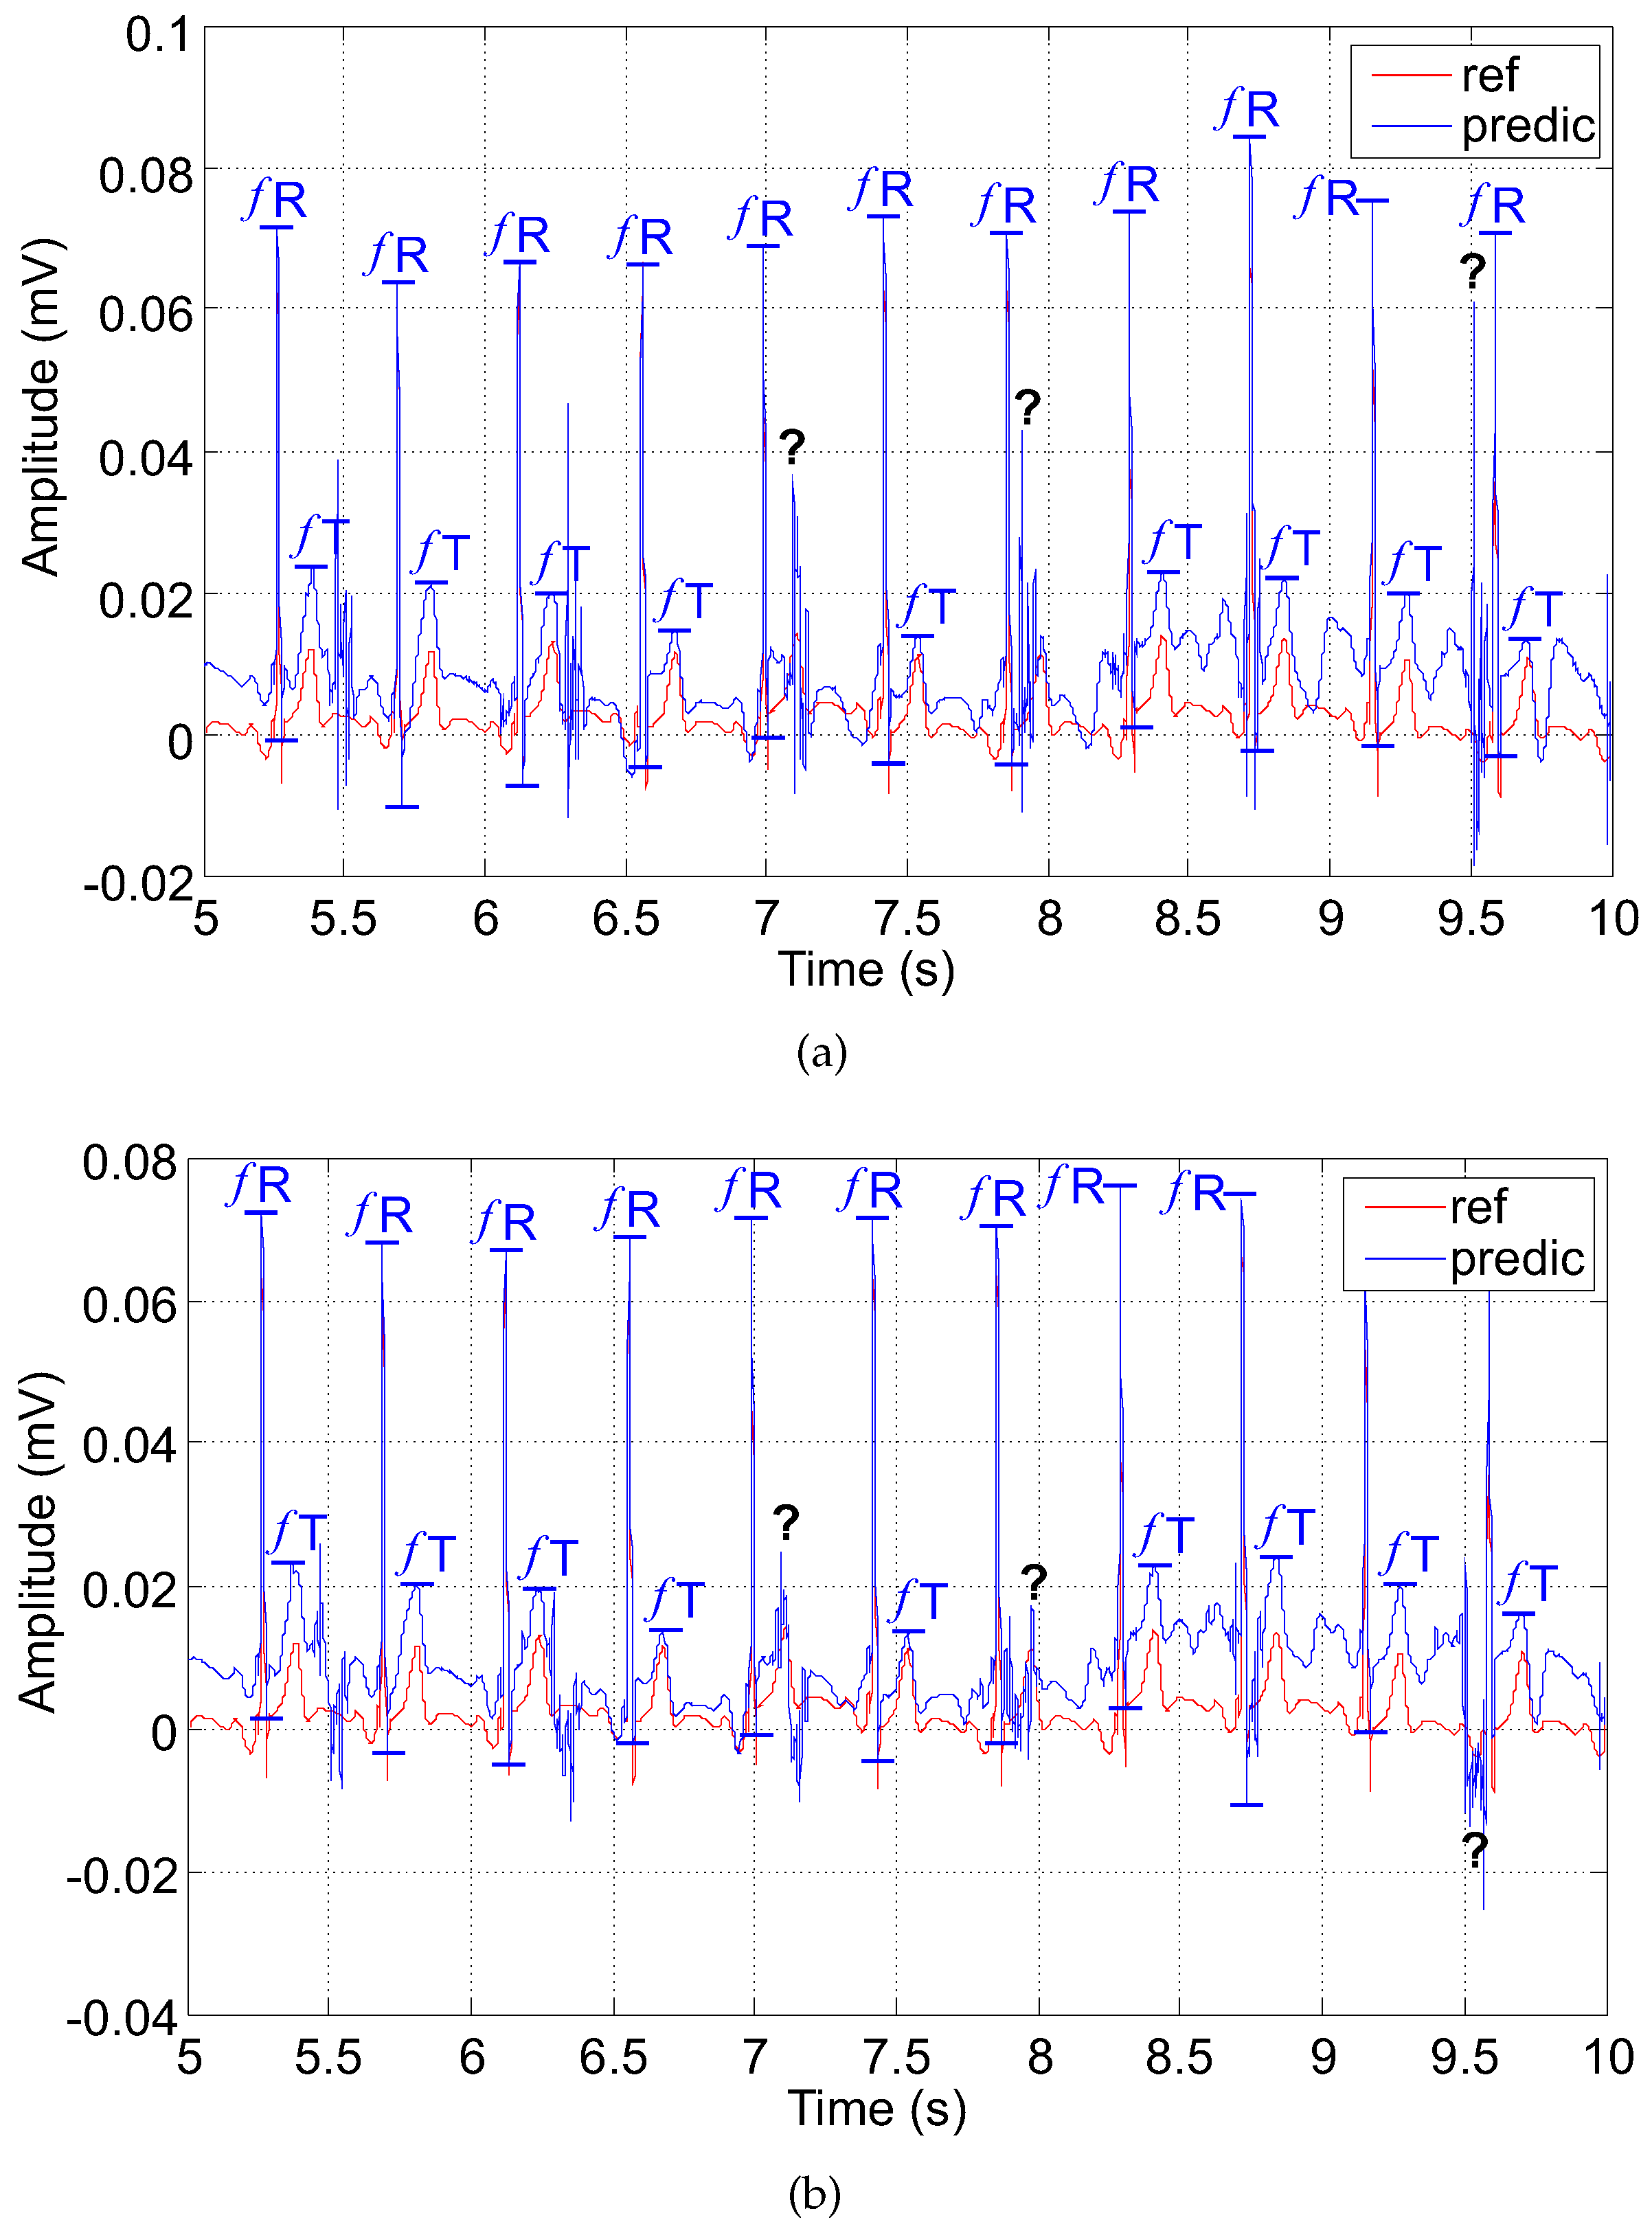
- A is the maternal residue; it can be reversed with the fetal T wave due to its higher amplitude;
- B is the suppressed fetal R wave (); it may lead to false determination of ;
- C is the fetal T wave () superimposed by the maternal residue; could not be detected.
5.3.2. The RLS-Based Adaptive System (Filter)
6. Discussion
7. Conclusions
Acknowledgments
Author Contributions
Conflicts of Interest
References
- Belfort, M.; Saade, G.; Thom, E.; Blackwell, S.; Reddy, U.; Thorp, J.; Tita, A.; Miller, R.; Peaceman, A.; McKenna, D.; et al. A Randomized Trial of Intrapartum Fetal ECG ST-Segment Analysis. Obstet. Gynecol. Surv. 2015, 70, 735–737. [Google Scholar] [CrossRef]
- Sholapurkar, S. The unresolved role of cardiotocography (CTG), fetal ECG (STAN) and intrapartum fetal pulse oximetry (IFPO) as diagnostic methods for fetal hypoxia. J. Obstet. Gynaecol. 2014, 34, 757. [Google Scholar] [CrossRef] [PubMed]
- Clifford, G.; Silva, I.; Behar, J.; Moody, G. Non-invasive fetal ECG analysis. Physiol. Meas. 2014, 35, 1521–1536. [Google Scholar] [CrossRef] [PubMed]
- Roche, J.; Hon, E. The Fetal Electrocardiogram. v. Comparison of Lead Systems. Am. J. Obstet. Gynecol. 1965, 92, 1149–1159. [Google Scholar] [CrossRef]
- Solum, T. A comparison of the Three Methods for External Fetal Cardiography. Acta Obstet. Gynecol. Scand. 1980, 59, 123–126. [Google Scholar] [CrossRef] [PubMed]
- Cohen, W.; Ommani, S.; Hassan, S.; Mirza, F.; Solomon, M.; Brown, R.; Schifrin, B.; Himsworth, J.; Hayes-Gill, B. Accuracy and reliability of fetal heart rate monitoring using maternal abdominal surface electrodes. Acta Obstet. Gynecol. Scand. 2012, 91, 1306–1313. [Google Scholar] [CrossRef] [PubMed]
- Moghavvemi, M.; Tan, B.; Tan, S. A non-invasive PC-based measurement of fetal phonocardiography. Sens. Actuators A Phys. 2003, 107, 96–103. [Google Scholar] [CrossRef]
- Kovacs, F.; Horvath, C.; Balogh, A.; Hosszu, G. Fetal phonocardiography-Past and future possibilities. Comput. Methods Progr. Biomed. 2011, 104, 19–25. [Google Scholar] [CrossRef] [PubMed]
- Adithya, P.C.; Sankar, R.; Moreno, W.; Hart, S. Trends in fetal monitoring through phonocardiography: Challenges and future directions. Biomed. Signal Proces. Control 2017, 33, 289–305. [Google Scholar] [CrossRef]
- Alem, O.; Sander, T.; Mhaskar, R.; Leblanc, J.; Eswaran, H.; Steinhoff, U.; Okada, Y.; Kitching, J.; Trahms, L.; Knappe, S. Fetal magnetocardiography measurements with an array of microfabricated optically pumped magnetometers. Phys. Med. Biol. 2015, 60, 4797–4811. [Google Scholar] [CrossRef] [PubMed]
- Fehlert, E.; Willmann, K.; Fritsche, L.; Linder, K.; Mat-Husin, H.; Schleger, F.; Weiss, M.; Kiefer-Schmidt, I.; Brucker, S.; Haring, H.U.; et al. Gestational diabetes alters the fetal heart rate variability during an oral glucose tolerance test: A fetal magnetocardiography study. Int. J. Obstet. Gynaecol. 2016. [Google Scholar] [CrossRef] [PubMed]
- Bolin, E.; Siegel, E.; Eswaran, H.; Lowery, C.; Zakaria, D.; Best, T. Cardiac time intervals derived by magnetocardiography in fetuses exposed to pregnancy hypertension syndromes. J. Perinatol. 2016, 36, 643–648. [Google Scholar] [CrossRef] [PubMed]
- Vaisman, S.; Salem, S.Y.; Holcberg, G.; Geva, A. Passive fetal monitoring by adaptive wavelet denoising method. Comput. Biol. Med. 2012, 42, 171–179. [Google Scholar] [CrossRef] [PubMed]
- Cesarelli, M.; Ruffo, M.; Romano, M.; Bifulco, P. Simulation of foetal phonocardiographic recordings for testing of FHR extraction algorithms. Comput. Methods Progr. Biomed. 2012, 107, 513–523. [Google Scholar] [CrossRef] [PubMed]
- Di Maria, C.; Liu, C.; Zheng, D.; Murray, A.; Langley, P. Extracting fetal heart beats from maternal abdominal recordings: Selection of the optimal principal components. Physiol. Meas. 2014, 35, 1649–1664. [Google Scholar] [CrossRef] [PubMed]
- Belfort, M.; Saade, G.; Thom, E.; Blackwell, S.; Reddy, U.; Thorp, J.M., Jr.; Tita, A.; Miller, R.; Peaceman, A.; McKenna, D.; et al. A randomized trial of intrapartum fetal ECG ST-segment analysis. N. Engl. J. Med. 2015, 373, 632–641. [Google Scholar] [CrossRef] [PubMed]
- Clifford, G.; Liu, C.; Moody, B.; Springer, D.; Silva, I.; Li, Q.; Mark, R. Classification of normal/abnormal heart sound recordings: The PhysioNet/Computing in Cardiology Challenge 2016. In Proceedings of the Computing in Cardiology Conference (CinC), Vancouver, BC, Canada, 11–14 September 2016. [Google Scholar]
- Leaning, J. Electronic fetal monitoring. BMJ 2001, 322, 1436–1437. [Google Scholar]
- Marzbamad, F.; Kimura, Y.; Endo, M.; Palaniswami, M.; Khandoker, A.H. Automated Measurement of Fetal Isovolumic Contraction Time from Doppler Ultrasound Signals without Using Fetal Electrocardiography; IEEE: Cambridge, MA, USA, 2014. [Google Scholar]
- Magenes, G.; Signorinix, M.G.; Arduini, D. Classification of Cardiotocographic Records by Neural Networks; IEEE: Piscataway, NJ, USA, 2000. [Google Scholar]
- Reinhard, J.; Hayes-Gill, B.R.; Yi, Q.; Hatzmann, H.; Schiermeier, S. Comparison of non-invasive fetal electrocardiogram to Doppler cardiotocogram during the 1st stage of labor. J. Perinat. Med. 2010, 38, 179–185. [Google Scholar] [CrossRef] [PubMed]
- Cohen, W.; Hayes-Gill, B. Influence of maternal body mass index on accuracy and reliability of external fetal monitoring techniques. Acta Obstet. Gynecol. Scand. 2014, 93, 590–595. [Google Scholar] [CrossRef] [PubMed]
- Racz, S.; Hantosi, E.; Marton, S.; Toth, K.; Ruzsa, D.; Halvax, L.; Bodis, J.; Farkas, B. Impact of maternal obesity on the fetal electrocardiogram during labor. J. Matern. Fetal Neonat. Med. 2016, 29, 3712–3716. [Google Scholar] [CrossRef] [PubMed]
- Jezewski, J.; Wrobel, J.; Horoba, K. Comparison of Doppler ultrasound and direct electrocardiography acquisition techniques for quantification of fetal heart rate variability. IEEE Trans. Biomed. Eng. 2006, 53, 855–864. [Google Scholar] [CrossRef] [PubMed]
- Matonia, A.; Jezewski, J.; Horoba, K.; Gacek, A.; Labaj, P. The Maternal ECG Suppression Algorithm for Efficient Extraction of the Fetal ECG From Abdominal Signal. In Proceedings of the 28th Annual International Conference of the IEEE Engineering in Medicine and Biology Society, New York, NY, USA, 31 August–3 September 2006; pp. 3106–3109. [Google Scholar]
- Peters, M.; Crowe, J.; Pieri, J.F.; Quartero, H.; Hayes-Gill, B.; James, D.; Stinstra, J.; Shakespeare, S. Monitoring the fetal heart non-invasively: A review of methods. J. Perinat. Med. 2001, 29, 408–416. [Google Scholar] [CrossRef] [PubMed]
- Sameni, R.; Clifford, G.D. A Review of Fetal ECG Signal Processing Issues and Promising Directions. Open Pacing Electrophysiol. Ther. J. 2010, 3, 4–20. [Google Scholar] [CrossRef] [PubMed]
- Vullings, R.; Peters, C.; Hermans, M.; Wijn, P.; Oei, S.; Bergmans, J. A robust physiology-based source separation method for QRS detection in low amplitude fetal ECG recordings. Physiol. Meas. 2010, 31, 935–951. [Google Scholar] [CrossRef] [PubMed]
- Marzbanrad, F.; Kimura, Y.; Funamoto, K.; Sugibayashi, R.; Endo, M.; Ito, T.; Palaniswami, M.; Khandoker, A. Automated estimation of fetal cardiac timing events from doppler ultrasound signal using hybrid models. IEEE J. Biomed. Health Inform. 2014, 18, 1169–1177. [Google Scholar] [CrossRef] [PubMed]
- Andreotti, F.; Grasser, F.; Malberg, H.; Zaunseder, S. Non-Invasive Fetal ECG Signal Quality Assessment for Multichannel Heart Rate Estimation. IEEE Trans. Biomed. Eng. 2017. [Google Scholar] [CrossRef] [PubMed]
- Marzbanrad, F.; Khandoker, A.; Kimura, Y.; Palaniswami, M.; Clifford, G. Estimating fetal gestational age using cardiac valve intervals. In Proceedings of the Computing in Cardiology, Vancouver, BC, Canada, 11–14 September 2016. [Google Scholar]
- Datian, Y.; Xuemei, O. Application of Wavelet Analysis in Detection of Fetal ECG; IEEE: Piscataway, NJ, USA, 1996; pp. 1043–1044. [Google Scholar]
- Khamene, A.; Negahdaripoure, S. A new method for the extraction of fetal ECG from the composite abdominal signal. IEEE Trans. Biomed. Eng. 2000, 47, 507–516. [Google Scholar] [CrossRef] [PubMed]
- Karvounis, E.; Papaloukas, C.; Fotiadis, D.; Michails, L. Fetal Heart Rate Extraction from Composite Maternal ECG Using Complex Continuous Wavelet Transform. In Proceedings of the Computers in Cardiology, Chicago, IL, USA, 19–22 September 2004; pp. 737–740. [Google Scholar]
- Shi, Z.; Zhang, C. Semi-blind source extraction for fetal electrocardiogram extraction by combining non-Gaussianity and time-correlation. Neurocomputing 2007, 70, 1574–1581. [Google Scholar] [CrossRef]
- Bergveld, P.; Meijer, W. A New Technique for the Suppression of the MECG. IEEE Trans. Biomed. Eng. 1981, BME-28, 348–354. [Google Scholar] [CrossRef] [PubMed]
- Al-Zaben, A.; Al-Smadi, A. Extraction of foetal ECG by combination of singular value decomposition and neuro-fuzzy inference system. Phys. Med. Biol. 2006, 51, 137–143. [Google Scholar] [CrossRef] [PubMed]
- Sameni, R.; Jutten, C.; Shamsollahi, M. What ICA Provides for ECG Processing: Application to Noninvasive Fetal ECG Extraction. In Proceedings of the International Symposium on Signal Processing and Information Technology, Vancouver, BC, Canada, 27–30 August 2006; pp. 656–661. [Google Scholar]
- De Lathauwer, L.; De Moor, B.; Vandewalle, J. Fetal electrocardiogram extraction by blind source subspace separation. IEEE Trans. Biomed. Eng. 2000, 47, 567–572. [Google Scholar] [CrossRef] [PubMed]
- Hon, E.; Lee, S. Averaging techniques in fetal electrocardiography. Med. Electron. Biol. Eng. 1964, 2, 71–76. [Google Scholar] [CrossRef] [PubMed]
- Swarnalatha, R.; Prasad, D. A novel technique for extraction of FECG using multi stage adaptive filtering. J. Appl. Sci. 2010, 10, 319–324. [Google Scholar] [CrossRef]
- Poularikas, A.D.; Ramadan, Z.M. Adaptive Filtering Primer with MATLAB; CRC/Taylor & Francis: Boca Raton, FL, USA, 2006. [Google Scholar]
- Wei, Z.; Xueyun, W.; Jian, J.Z.; Hongxing, L. Noninvasive fetal ECG estimation using adaptive comb filter. Comput. Methods Progr. Biomed. 2013, 112, 125–134. [Google Scholar] [CrossRef] [PubMed]
- Shadaydeh, M.; Xiao, Y.; Ward, R. Extraction of Fetal ECG Using Adaptive Volterra Filters. In Proceedings of the 16th European Signal Processing Conference, Lausanne, Switzerland, 25–29 August 2008. [Google Scholar]
- Sameni, R.; Shamsollahi, M.; Jutten, C.; Babaie-Zadeh, M. Filtering Noisy ECG Signals Using the Extended Kalman Filter Based on a Modified Dynamic ECG Model. In Proceedings of the Computers in Cardiology, Lyon, France, 25–28 September 2005; pp. 1017–1020. [Google Scholar]
- Niknazar, M.; Rivet, B.; Jutten, C. Fetal ECG extraction by extended state kalman filtering based on single-channel recordings. IEEE Trans. Biomed. Eng. 2013, 60, 1345–1352. [Google Scholar] [CrossRef] [PubMed]
- Reaz, M.; Wei, L. Adaptive Linear Neural Network Filter for Fetal ECG Extraction. the Proceedings of Intelligent Sensing and Information Processing, Chennai, India, 4–7 January 2004; pp. 321–324. [Google Scholar]
- Assaleh, K. Extraction of fetal electrocardiogram using adaptive neuro-fuzzy inference systems. IEEE Trans. Biomed. Eng. 2007, 54, 59–68. [Google Scholar] [CrossRef] [PubMed]
- Kedir-Talha, M.; Guettouche, M.; Bousbia-Salah, A. Combination of a FIR Filter With a Genetic Algorithm for The Extraction of a Fetal ECG. the Proceedings of Signals, Systems and Computers (ASILOMAR), Pacific Grove, CA, USA, 7–10 November 2010; pp. 76–79. [Google Scholar]
- Kam, A.; Cohen, A. Detection of fetal ECG with IIR adaptive filtering and genetic algorithms. In Proceedings of the IEEE International Conference on Acoustics, Speech, and Signal Processing, Phoenix, AZ, USA, 15–19 March 1999; pp. 2335–2338. [Google Scholar]
- Coquillard, G.; Palao, B.; Patterson, B. Quantification of intracellular HPV E6/E7 mRNA expression increases the specificity and positive predictive value of cervical cancer screening compared to HPV DNA. Gynecol. Oncol. 2011, 120, 89–93. [Google Scholar] [CrossRef] [PubMed]
- Cosman, P.; Gray, R.; Olshen, R. Evaluating Quality of Compressed Medical Images: SNR, Subjective Rating, and Diagnostic Accuracy. Proc. IEEE 1994, 82, 919–932. [Google Scholar] [CrossRef]
- Wu, S.; Shen, Y.; Zhou, Z.; Lin, L.; Zeng, Y.; Gao, X. Research of fetal ECG extraction using wavelet analysis and adaptive filtering. Comput. Biol. Med. 2013, 43, 1622–1627. [Google Scholar] [CrossRef] [PubMed]
- Behar, J.; Johnson, A.; Clifford, G.; Oster, J. A comparison of single channel fetal ECG extraction methods. Ann. Biomed. Eng. 2014, 42, 1340–1353. [Google Scholar] [CrossRef] [PubMed]
- Ma, Y.; Xiao, Y.; Wei, G.; Sun, J. A multichannel nonlinear adaptive noise canceller based on generalized FLANN for fetal ECG extraction. Meas. Sci. Technol. 2015, 27. [Google Scholar] [CrossRef]
- Ma, Y.; Xiao, Y.; Wei, G.; Sun, J.; Wei, H. A Hybrid Nonlinear Adaptive Noise Canceller for Fetal ECG Extraction; Institute of Electrical and Electronics Engineers Inc.: Hong Kong, China, 16–19 December 2015; pp. 811–814. [Google Scholar]
- Andreotti, F.; Riedl, M.; Himmelsbach, T.; Wedekind, D.; Wessel, N.; Stepan, H.; Schmieder, C.; Jank, A.; Malberg, H.; Zaunseder, S. Robust fetal ECG extraction and detection from abdominal leads. Physiol. Meas. 2014, 35, 1551–1567. [Google Scholar] [CrossRef] [PubMed]
- Subhashini, S.; Jagannath, D.; Selvakumar, A. Extricating Non Invasive Fetal ECG by Adaptive Optimization Technique; Institute of Electrical and Electronics Engineers Inc.: Coimbatore, India, 2014; pp. 1–5. [Google Scholar]
- Martinek, R.; Kelnar, M.; Koudelka, P.; Vanus, J.; Bilik, P.; Janku, P.; Nazeran, H.; Zidek, J. A novel LabVIEW-based multi-channel non-invasive abdominal maternal-fetal electrocardiogram signal generator. Physiol. Meas. 2016, 37, 238–256. [Google Scholar] [CrossRef] [PubMed]
- Martinek, R.; Sincl, A.; Vanus, J.; Kelnar, M.; Bilik, P.; Machacek, Z.; Zidek, J. Modelling of fetal hypoxic conditions based on virtual instrumentation. Adv. Intell. Syst. Comput. 2016, 427, 249–259. [Google Scholar]
- Martinek, R.; Kelnar, M.; Vojcinak, P.; Koudelka, P.; Vanus, J.; Bilik, P.; Janku, P.; Nazeran, H.; Zidek, J. Virtual simulator for the generation of patho-physiological foetal ECGs during the prenatal period. Electron. Lett. 2015, 51, 1738–1740. [Google Scholar] [CrossRef]
- Fruhman, G.; Gavard, J.A.; Mccormick, K.; Wilson-Griffin, J.; Amon, E.; Gross, G.A. Standard External Doppler Fetal Heart Tracings versus External Fetal Electrocardiogram in Very Preterm Gestation: A Pilot Study. Am. J. Perinatol. Rep. 2016, 6, e378–e383. [Google Scholar]
- Ahmadieh, H.; Asl, B. Fetal ECG extraction via Type-2 adaptive neuro-fuzzy inference systems. Comput. Methods Progr. Biomed. 2017, 142, 101–108. [Google Scholar] [CrossRef] [PubMed]
- Redif, S. Fetal electrocardiogram estimation using polynomial eigenvalue decomposition. Turk. J. Electr. Eng. Comput. Sci. 2016, 24, 2483–2497. [Google Scholar] [CrossRef]
- Fajkus, M.; Nedoma, J.; Martinek, R.; Vasinek, V.; Nazeran, H.; Siska, P. A non-invasive multichannel hybrid fiber-optic sensor system for vital sign monitoring. Sensors 2017, 17, 111. [Google Scholar] [CrossRef] [PubMed]
- Martinek, R.; Nedoma, J.; Fajkus, M.; Kahankova, R.; Konecny, J.; Janku, P.; Kepak, S.; Bilik, P.; Nazeran, H. A Phonocardiographic-Based Fiber-Optic Sensor and Adaptive Filtering System for Noninvasive Continuous Fetal Heart Rate Monitoring. Sensors 2017, 17, 890. [Google Scholar] [CrossRef] [PubMed]
- Marossero, D.; Erdogmus, D.; Euliano, N.; Principe, J.; Hild, K.E. Independent Components Analysis for Fetal Electrocardiogram Extraction: A Case for the Data Efficient Mermaid Algorithm; IEEE: Toulouse, France, 2003; pp. 399–408. [Google Scholar]
- Jezewski, J.; Horoba, K.; Roj, D.; Wrobel, J.; Kupka, T.; Matonia, A. Evaluating the fetal heart rate baseline estimation algorithms by their influence on detection of clinically important patterns. Biocybern. Biomed. Eng. 2016, 36, 562–573. [Google Scholar] [CrossRef]
- Jezewski, J.; Wrobel, J.; Matonia, A.; Horoba, K.; Martinek, R.; Kupka, T.; Jezewski, M. Is abdominal fetal electrocardiography an alternative to Doppler ultrasound for FHR variability evaluation? Front. Physiol. 2017, 8, 305. [Google Scholar] [CrossRef]
- Hoyer, D.; Zebrowski, J.; Cysarz, D.; Goncalves, H.; Pytlik, A.; Amorim-Costa, C.; Bernardes, J.; Ayres-de Campos, D.; Witte, O.; Schleusner, E.; et al. Monitoring fetal maturation-objectives, techniques and indices of autonomic function. Physiol. Meas. 2017, 38, R61–R88. [Google Scholar] [CrossRef] [PubMed]
- Behar, J.; Zhu, T.; Oster, J.; Niksch, A.; Mah, D.; Chun, T.; Greenberg, J.; Tanner, C.; Harrop, J.; Sameni, R.; et al. Evaluation of the fetal QT interval using non-invasive fetal ECG technology. Physiol. Meas. 2016, 37, 1392–1403. [Google Scholar] [CrossRef] [PubMed]
- Khandoker, A.H.; Marzbanrad, F.; Voss, A.; Schulz, S.; Kimura, Y.; Endo, M.; Palaniswami, M. Analysis of maternal-fetal heart rate coupling directions with partial directed coherence. Biomed. Signal Process. Control 2016, 30, 25–30. [Google Scholar] [CrossRef]
- Schreiber, T.; Kaplan, D. Signal separation by nonlinear projections: The fetal electrocardiogram. Phys. Rev. E 1996, 53, R4326–R4329. [Google Scholar] [CrossRef]
- Richter, M.; Schreiber, T.; Kaplan, D. Fetal ECG extraction with nonlinear state-space projections. IEEE Trans. Biomed. Eng. 1998, 45, 133–137. [Google Scholar] [CrossRef] [PubMed]
- Burattini, L.; Agostinelli, A.; Grillo, M.; Biagini, A.; Giuliani, C.; Burattini, L.; Fioretti, S.; Di Nardo, F.; Giannubilo, S.; Ciavattini, A. Noninvasive Fetal Electrocardiography: An Overview of the Signal Electrophysiological Meaning, Recording Procedures, and Processing Techniques. Ann. Noninvasive Electrocardiol. 2015, 20, 303–313. [Google Scholar]
- Agostinelli, A.; Sbrollini, A.; Burattini, L.; Fioretti, S.; Di Nardo, F.; Burattini, L. Noninvasive Fetal Electrocardiography Part II: Segmented-Beat Modulation Method for Signal Denoising. Open Biomed. Eng. J. 2017, 11, 25–35. [Google Scholar] [CrossRef]
- Martinek, R.; Kahankova, R.; Skutova, H.; Koudelka, P.; Zidek, J.; Koziorek, J. Adaptive Signal Processing Techniques for Extracting Abdominal Fetal Electrocardiogram; Institute of Electrical and Electronics Engineers Inc.: Prague, Czech Republic, 2016; pp. 1–6. [Google Scholar]
- Martinek, R.; Zidek, J. A system for improving the diagnostic quality of fetal electrocardiogram. Prz. Elektrotech. 2012, 88, 164–173. [Google Scholar]
- Martinek, R.; Zidek, J. Refining the diagnostic quality of the abdominal fetal electrocardiogram using the techniques of artificial intelligence. Prz. Elektrotechn. 2012, 88, 155–160. [Google Scholar]
- Martinek, R.; Skutova, H.; Kahankova, R.; Koudelka, P.; Bilik, P.; Koziorek, J. Fetal ECG Extraction Based on Adaptive Neuro-Fuzzy Interference System; Institute of Electrical and Electronics Engineers Inc.: Prague, Czech Republic, 2016. [Google Scholar]
- Martinek, R.; Kahankova, R.; Skukova, H.; Konecny, J.; Bilik, P.; Zidek, J.; Nazeran, H. Nonlinear Adaptive Signal Processing Improves the Diagnostic Quality of Transabdominal Fetal Electrocardiography. In Advanced Biosignal Processing and Diagnostic Methods; InTech: Rijeka, Croatia, 2016. [Google Scholar]
- Goldberger, A.; Amaral, L.; Glass, L.; Hausdorff, J.; Ivanov, P.; Mark, R.; Mietus, J.; Moody, G.; Peng, C.; Stanley, H. PhysioBank, PhysioToolkit, and PhysioNet: Components of a new research resource for complex physiologic signals. Circulation 2000, 101, E215–E220. [Google Scholar] [CrossRef] [PubMed]
- Jezewski, J.; Matonia, A.; Kupka, T.; Roj, D.; Czabanski, R. Determination of fetal heart rate from abdominal signals: Evaluation of beat-to-beat accuracy in relation to the direct fetal electrocardiogram. Biomed. Eng. 2012, 57, 383–394. [Google Scholar] [CrossRef] [PubMed]
- Matonia, A.; Jezewski, J.; Kupka, T.; Horoba, K.; Wrobel, J.; Gacek, A. The influence of coincidence of fetal and maternal QRS complexes on fetal heart rate reliability. Med. Biol. Eng. Comput. 2006, 44, 393–403. [Google Scholar] [CrossRef] [PubMed]
- Kotas, M.; Jezewski, J.; Horoba, K.; Matonia, A. Application of spatio-temporal filtering to fetal electrocardiogram enhancement. Comput. Methods Progr. Biomed. 2011, 104, 1–9. [Google Scholar] [CrossRef] [PubMed]
- Kotas, M.; Jezewski, J.; Matonia, A.; Kupka, T. Towards noise immune detection of fetal QRS complexes. Comput. Methods Progr. Biomed. 2010, 97, 241–256. [Google Scholar] [CrossRef] [PubMed]
- Andreotti, F.; Behar, J.; Zaunseder, S.; Oster, J.; Clifford, G. An open-source framework for stress-testing non-invasive foetal ECG extraction algorithms. Physiol. Meas. 2016, 37, 627–648. [Google Scholar] [CrossRef] [PubMed]
- Sameni, R.; Clifford, G.; Jutten, C.; Shamsollahi, M. Multichannel ECG and noise modeling: Application to maternal and fetal ECG signals. Eurasip J. Adv. Signal Process. 2007, 2007. [Google Scholar] [CrossRef]
- Almasi, A.; Shamsollahi, M.; Senhadji, L. A Dynamical Model for Generating Synthetic Phonocardiogram Signals; IEEE: Boston, MA, USA, 2011; pp. 5686–5689. [Google Scholar]
- Sayadi, O.; Shamsollahi, M.; Clifford, G. Synthetic ECG generation and Bayesian filtering using a Gaussian wave-based dynamical model. Physiol. Meas. 2010, 31, 1309–1329. [Google Scholar] [CrossRef] [PubMed]
- Vaseghi, S.V. Advanced Signal Processing and Digital Noise Reduction; John Wiley & Sons: New York City, NY, USA, 2006. [Google Scholar]
- Haykin, S. Adaptive Filter Theory, 4th ed.; Pearson Education: New Delhi, India, 2008. [Google Scholar]
- Uncini, A. Fundamentals of Adaptive Signal Processing; Springer: New York City, NY, USA, 2015. [Google Scholar]
- Ingle, V.K.; Proakis, J.G. Digital Signal Processing Using MATLAB, 3rd ed.; Cengage Learning: Stamford, CT, USA, 2012. [Google Scholar]
- Benesty, J.; Huang, Y. Adaptive Signal Processing, 1st ed.; Springer: Berlin, Germany, 2003. [Google Scholar]
- Farhang-Boroujeny, B. Adaptive Filters, 2nd ed.; John Wiley & Sons Ltd.: New York City, NY, USA, 2013. [Google Scholar]
- Smith, S.W. Digital Signal Processing, 1st ed.; Newnes: Boston, MA, USA, 2003. [Google Scholar]
- McSharry, P.; Clifford, G.; Tarassenko, L.; Smith, L. A dynamical model for generating synthetic electrocardiogram signals. IEEE Trans. Biom. Eng. 2003, 50, 289–294. [Google Scholar] [CrossRef] [PubMed]
- Behar, J. Extraction of Clinical Information From the Non-Invasive Fetal Electrocardio-Gram. Ph.D. Thesis, University of Oxford, Oxford, UK, 2014. [Google Scholar]
- Fuchs, T.; Grobelak, K.; Pomorski, M.; Zimmer, M. Fetal heart rate monitoring using maternal abdominal surface electrodes in third trimester: Can we obtain additional information other than CTG trace? Adv. Clin. Exp. Med. 2016, 25, 309–316. [Google Scholar] [CrossRef] [PubMed]
- Dodd, K.; Elm, K.; Smith, S. Comparison of the QRS Complex, ST-Segment, and T-Wave among Patients with Left Bundle Branch Block with and without Acute Myocardial Infarction. J. Emerg. Med. 2016, 51, 1–8. [Google Scholar] [CrossRef] [PubMed]
- Rei, M.; Tavares, S.; Pinto, P.; Machado, A.; Monteiro, S.; Costa, A.; Costa-Santos, C.; Bernardes, J.; Ayres-De-Campos, D. Interobserver agreement in CTG interpretation using the 2015 FIGO guidelines for intrapartum fetal monitoring. Eur. J. Obstet. Gynecol. Reprod. Biol. 2016, 205, 27–31. [Google Scholar] [CrossRef] [PubMed]
- Ayres-De-Campos, D.; Spong, C.; Chandraharan, E. FIGO consensus guidelines on intrapartum fetal monitoring: Cardiotocography. Int. J. Gynecol. Obstet. 2015, 131, 13–24. [Google Scholar] [CrossRef] [PubMed]
- Ma, Y.; Xiao, Y.; Wei, G.; Sun, J. Fetal ECG Extraction Using Adaptive Functional Link Artificial Neural Network. Proceedings of Signal and Information Processing Association Annual Summit and Conference (APSIPA), Siem Reap, Cambodia, 9–12 December 2014. [Google Scholar]
- Martinez, M.; Calpe, J.; Soria, E.; Guerrero, J.; Camps, G.; Gómez, L. Methods to Evaluate the Performance of Fetal Electrocardiogram Extraction Algorithms; IEEE: Rotterdam, The Netherlands, 2001; pp. 253–256. [Google Scholar]
- Agostinelli, A.; Marcantoni, I.; Moretti, E.; Sbrollini, A.; Fioretti, S.; Di Nardo, F.; Burattini, L. Noninvasive Fetal Electrocardiography Part I: Pan-Tompkins’ Algorithm Adaptation to Fetal R-peak Identification. Open Biomed. Eng. J. 2017, 11, 17–24. [Google Scholar] [CrossRef]
- Martinek, R.; Kelnar, M.; Koudelka, P.; Vanus, J.; Bilik, P.; Janku, P.; Nazeran, H.; Zidek, J. Enhanced processing and analysis of multi-channel non-invasive abdominal foetal ECG signals during labor and delivery. Electron. Lett. 2015, 51, 1744–1746. [Google Scholar] [CrossRef]
- Vullings, R.; Peters, C.H.L.; Mischi, M.; Oei, S.G.; Bergmans, J.W.M. Fetal Movement Quantification by Fetal Vectorcardiography: A Preliminary Study. Proceesdings of the 30th Annual International IEEE EMBS Conference, Vancouver, BC, Canada, 20–24 August 2008; pp. 1056–1059. [Google Scholar]
- Vullings, R.; De Vries, B.; Bergmans, J.W. An adaptive Kalman filter for ECG signal enhancement. IEEE Trans. Biomed. Eng. 2011, 58, 1094–1103. [Google Scholar] [CrossRef] [PubMed]
- Vullings, R.; Mischi, M.; Oei, S.G.; Bergmans, J.W. Novel Bayesian vectorcardiographic loop alignment for improved monitoring of ECG and fetal movement. IEEE Trans. Biomed. Eng. 2013, 60, 1580–1588. [Google Scholar] [CrossRef] [PubMed]


| LMS Algorithm |
| RLS Algorithm |
| Electrodes | ||||||||
|---|---|---|---|---|---|---|---|---|
| (dB) | (-) | (-) | (dB) | (%) | (%) | (%) | (%) | |
| AE002-TE098 | −24.94 | 15 | 0.0110 | 0.93 | 92.91 | 95.61 | 90.62 | 89.98 |
| AE002-TE124 | −24.94 | 57 | 0.0046 | 0.71 | 91.53 | 94.48 | 89.14 | 88.51 |
| AE002-TE141 | −24.94 | 25 | 0.0480 | 0.27 | 91.07 | 94.17 | 83.90 | 80.87 |
| AE002-TE145 | −24.94 | 22 | 0.0100 | 1.09 | 92.94 | 95.74 | 91.57 | 89.69 |
| AE022-TE098 | −21.73 | 21 | 0.0270 | 0.07 | 91.75 | 93.71 | 81.74 | 79.15 |
| AE022-TE124 | −21.73 | 39 | 0.0071 | 0.94 | 92.88 | 95.78 | 91.12 | 90.02 |
| AE022-TE141 | −21.73 | 23 | 0.0420 | 1.71 | 93.82 | 96.71 | 94.07 | 91.11 |
| AE022-TE145 | −21.73 | 19 | 0.0310 | 3.59 | 95.25 | 97.84 | 95.03 | 93.48 |
| AE048-TE098 | −17.09 | 17 | 0.0120 | 3.46 | 95.04 | 97.57 | 94.74 | 92.71 |
| AE048-TE124 | −17.09 | 45 | 0.0060 | 1.11 | 93.54 | 96.69 | 93.57 | 90.69 |
| AE048-TE141 | −17.09 | 21 | 0.0420 | 2.01 | 94.13 | 97.58 | 95.17 | 93.64 |
| AE048-TE145 | −17.09 | 70 | 0.0044 | 5.64 | 97.86 | 98.77 | 97.11 | 96.57 |
| AE074-TE098 | −26.36 | 21 | 0.0093 | −0.97 | 91.81 | 94.09 | — | — |
| AE074-TE124 | −26.36 | 53 | 0.0035 | −0.31 | 92.48 | 94.79 | — | — |
| AE074-TE141 | −26.36 | 87 | 0.0147 | −3.45 | — | — | — | — |
| AE074-TE145 | −26.36 | 26 | 0.0097 | −1.25 | 87.65 | 88.71 | — | — |
| AE094-TE098 | −31.71 | 19 | 0.0074 | −2.85 | — | — | — | — |
| AE094-TE124 | −31.71 | 48 | 0.0034 | −2.09 | 83.71 | 84.81 | — | — |
| AE094-TE141 | −31.71 | 27 | 0.0510 | −3.93 | — | — | — | — |
| AE094-TE145 | −31.71 | 25 | 0.0121 | −2.14 | 84.19 | 85.14 | — | — |
| Electrodes | ||||||||
|---|---|---|---|---|---|---|---|---|
| (dB) | (-) | (-) | (dB) | (%) | (%) | (%) | (%) | |
| AE002-TE098 | −24.94 | 11 | 1.0000 | 1.38 | 97.24 | 93.39 | 93.43 | 89.21 |
| AE002-TE124 | −24.94 | 51 | 0.9993 | 1.55 | 97.81 | 93.76 | 93.90 | 89.84 |
| AE002-TE141 | −24.94 | 37 | 0.9995 | 0.17 | 95.57 | 92.24 | 92.31 | 88.51 |
| AE002-TE145 | −24.94 | 31 | 0.9994 | 1.51 | 97.44 | 93.65 | 93.79 | 89.52 |
| AE022-TE098 | −21.73 | 17 | 1.0000 | 0.45 | 95.91 | 92.77 | 92.65 | 89.04 |
| AE022-TE124 | −21.73 | 39 | 1.0000 | 1.38 | 96.91 | 93.01 | 93.19 | 88.95 |
| AE022-TE141 | −21.73 | 24 | 1.0000 | 2.05 | 98.09 | 95.13 | 95.31 | 91.29 |
| AE022-TE145 | −21.73 | 15 | 1.0000 | 3.31 | 98.16 | 95.57 | 95.38 | 91.33 |
| AE048-TE098 | −17.09 | 13 | 1.0000 | 2.40 | 97.69 | 94.81 | 94.63 | 90.84 |
| AE048-TE124 | −17.09 | 29 | 1.0000 | 1.40 | 97.76 | 93.47 | 93.41 | 89.96 |
| AE048-TE141 | −17.09 | 26 | 1.0000 | −0.09 | 94.21 | 91.86 | 80.74 | 78.06 |
| AE048-TE145 | −17.09 | 67 | 1.0000 | 5.30 | 98.75 | 98.31 | 97.46 | 95.79 |
| AE074-TE098 | −26.36 | 19 | 0.9997 | −0.53 | 94.71 | 90.71 | 80.14 | 77.27 |
| AE074-TE124 | −26.36 | 75 | 1.0000 | 0.16 | 95.36 | 92.71 | 92.88 | 88.17 |
| AE074-TE141 | −26.36 | 41 | 0.9998 | −5.97 | — | — | — | — |
| AE074-TE145 | −26.36 | 39 | 1.0000 | −1.79 | 89.41 | 87.83 | — | — |
| AE094-TE098 | −31.71 | 23 | 0.9991 | −5.07 | — | — | — | — |
| AE094-TE124 | −31.71 | 57 | 1.0000 | −1.94 | 87.21 | 86.09 | — | — |
| AE094-TE141 | −31.71 | 29 | 1.0000 | −5.32 | — | — | — | — |
| AE094-TE145 | −31.71 | 25 | 0.9993 | −3.47 | — | — | — | — |
© 2017 by the authors. Licensee MDPI, Basel, Switzerland. This article is an open access article distributed under the terms and conditions of the Creative Commons Attribution (CC BY) license (http://creativecommons.org/licenses/by/4.0/).
Share and Cite
Martinek, R.; Kahankova, R.; Nazeran, H.; Konecny, J.; Jezewski, J.; Janku, P.; Bilik, P.; Zidek, J.; Nedoma, J.; Fajkus, M. Non-Invasive Fetal Monitoring: A Maternal Surface ECG Electrode Placement-Based Novel Approach for Optimization of Adaptive Filter Control Parameters Using the LMS and RLS Algorithms. Sensors 2017, 17, 1154. https://doi.org/10.3390/s17051154
Martinek R, Kahankova R, Nazeran H, Konecny J, Jezewski J, Janku P, Bilik P, Zidek J, Nedoma J, Fajkus M. Non-Invasive Fetal Monitoring: A Maternal Surface ECG Electrode Placement-Based Novel Approach for Optimization of Adaptive Filter Control Parameters Using the LMS and RLS Algorithms. Sensors. 2017; 17(5):1154. https://doi.org/10.3390/s17051154
Chicago/Turabian StyleMartinek, Radek, Radana Kahankova, Homer Nazeran, Jaromir Konecny, Janusz Jezewski, Petr Janku, Petr Bilik, Jan Zidek, Jan Nedoma, and Marcel Fajkus. 2017. "Non-Invasive Fetal Monitoring: A Maternal Surface ECG Electrode Placement-Based Novel Approach for Optimization of Adaptive Filter Control Parameters Using the LMS and RLS Algorithms" Sensors 17, no. 5: 1154. https://doi.org/10.3390/s17051154
APA StyleMartinek, R., Kahankova, R., Nazeran, H., Konecny, J., Jezewski, J., Janku, P., Bilik, P., Zidek, J., Nedoma, J., & Fajkus, M. (2017). Non-Invasive Fetal Monitoring: A Maternal Surface ECG Electrode Placement-Based Novel Approach for Optimization of Adaptive Filter Control Parameters Using the LMS and RLS Algorithms. Sensors, 17(5), 1154. https://doi.org/10.3390/s17051154