
Blockwise PPG Enhancement Based on Time-Variant Zero-Phase Harmonic Notch Filtering


Abstract
:1. Introduction
2. Methods
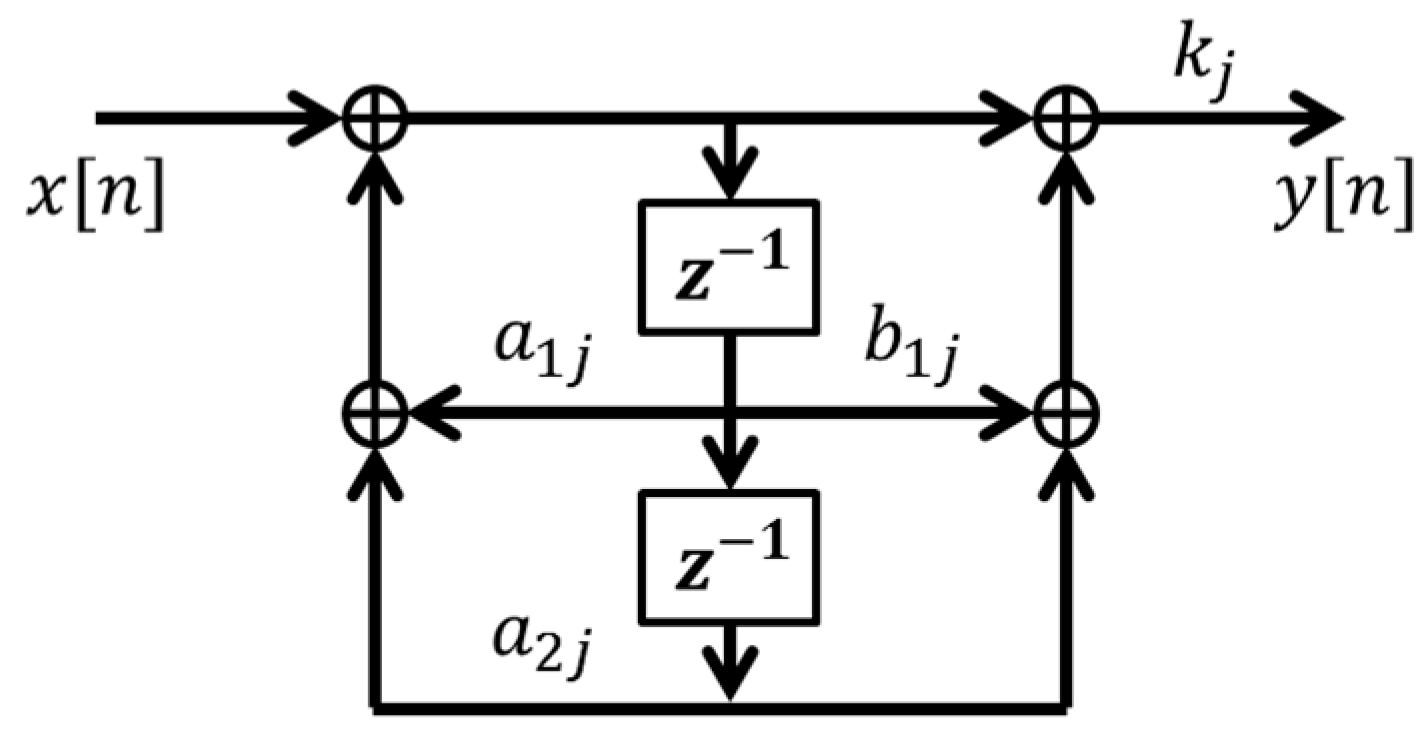
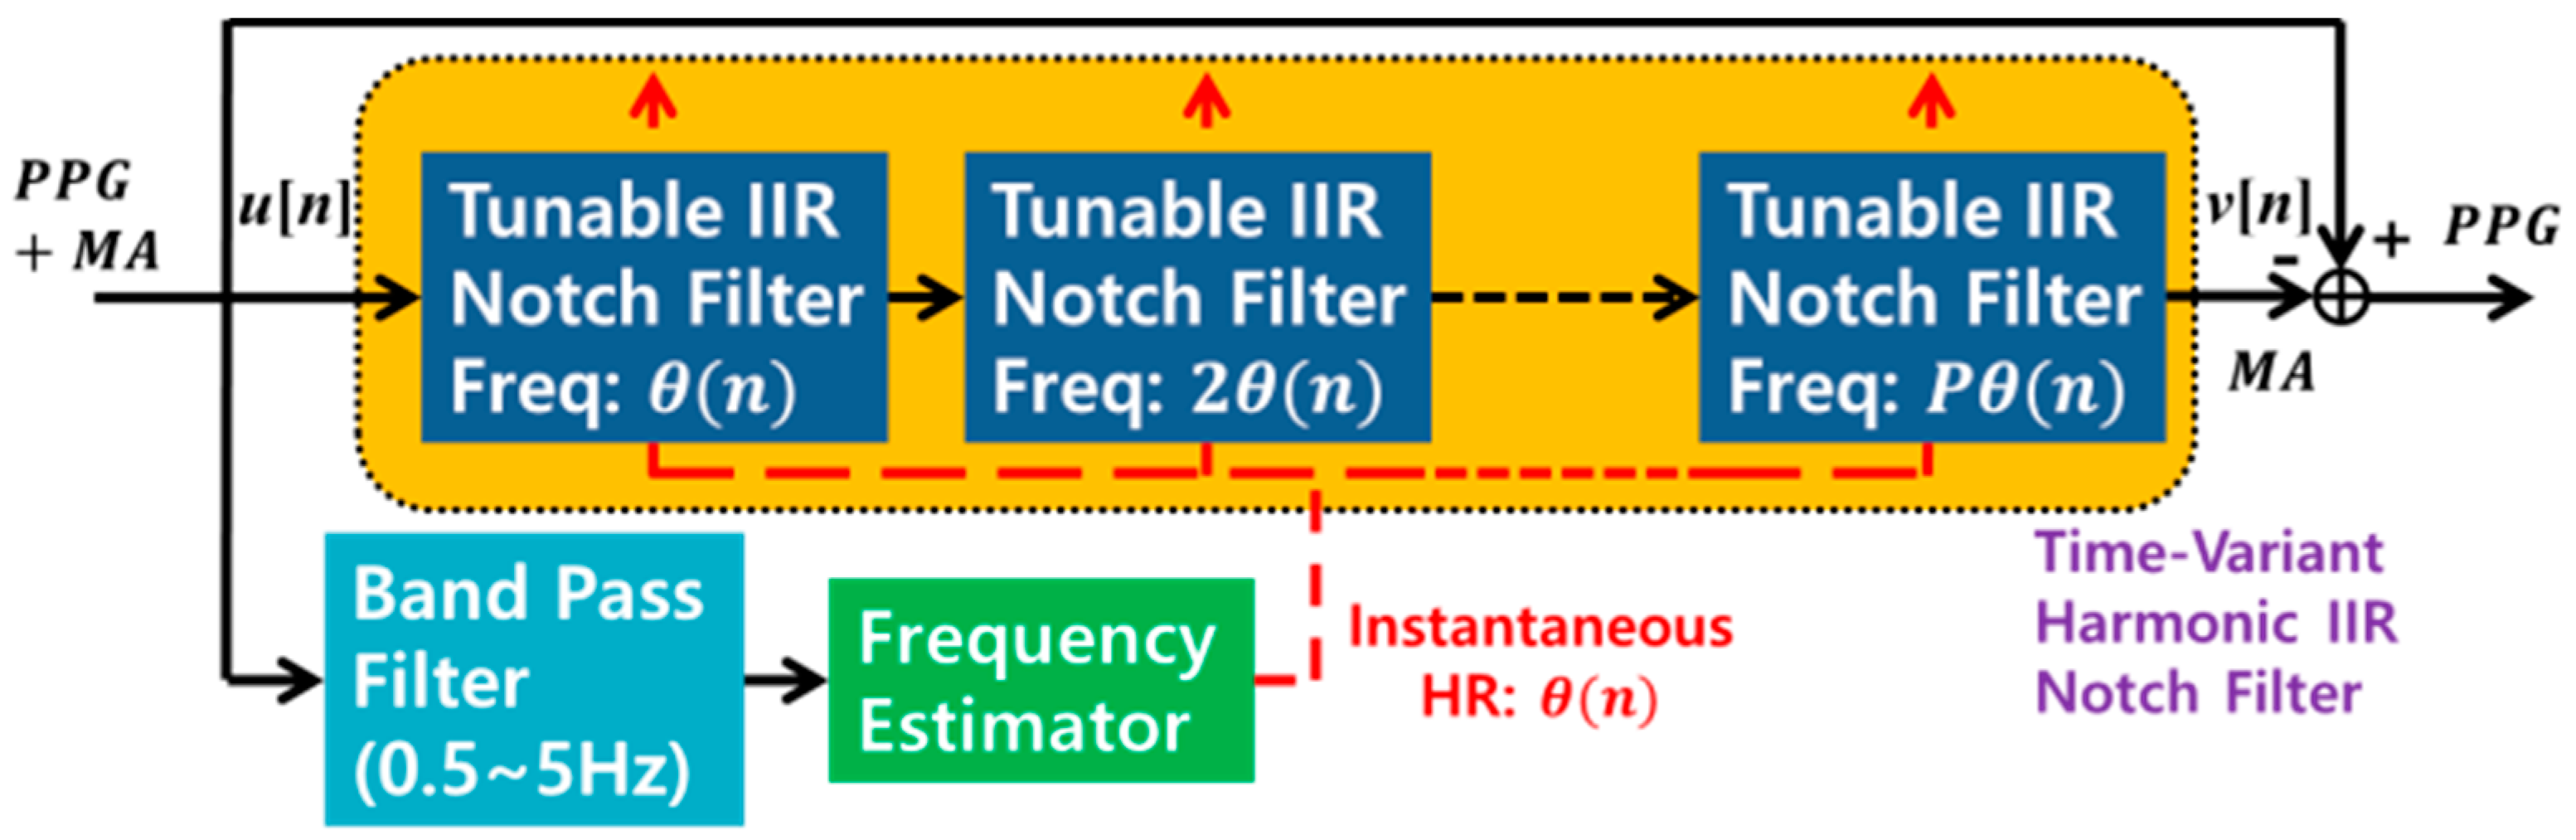
2.1. Adaptive Comb Filter
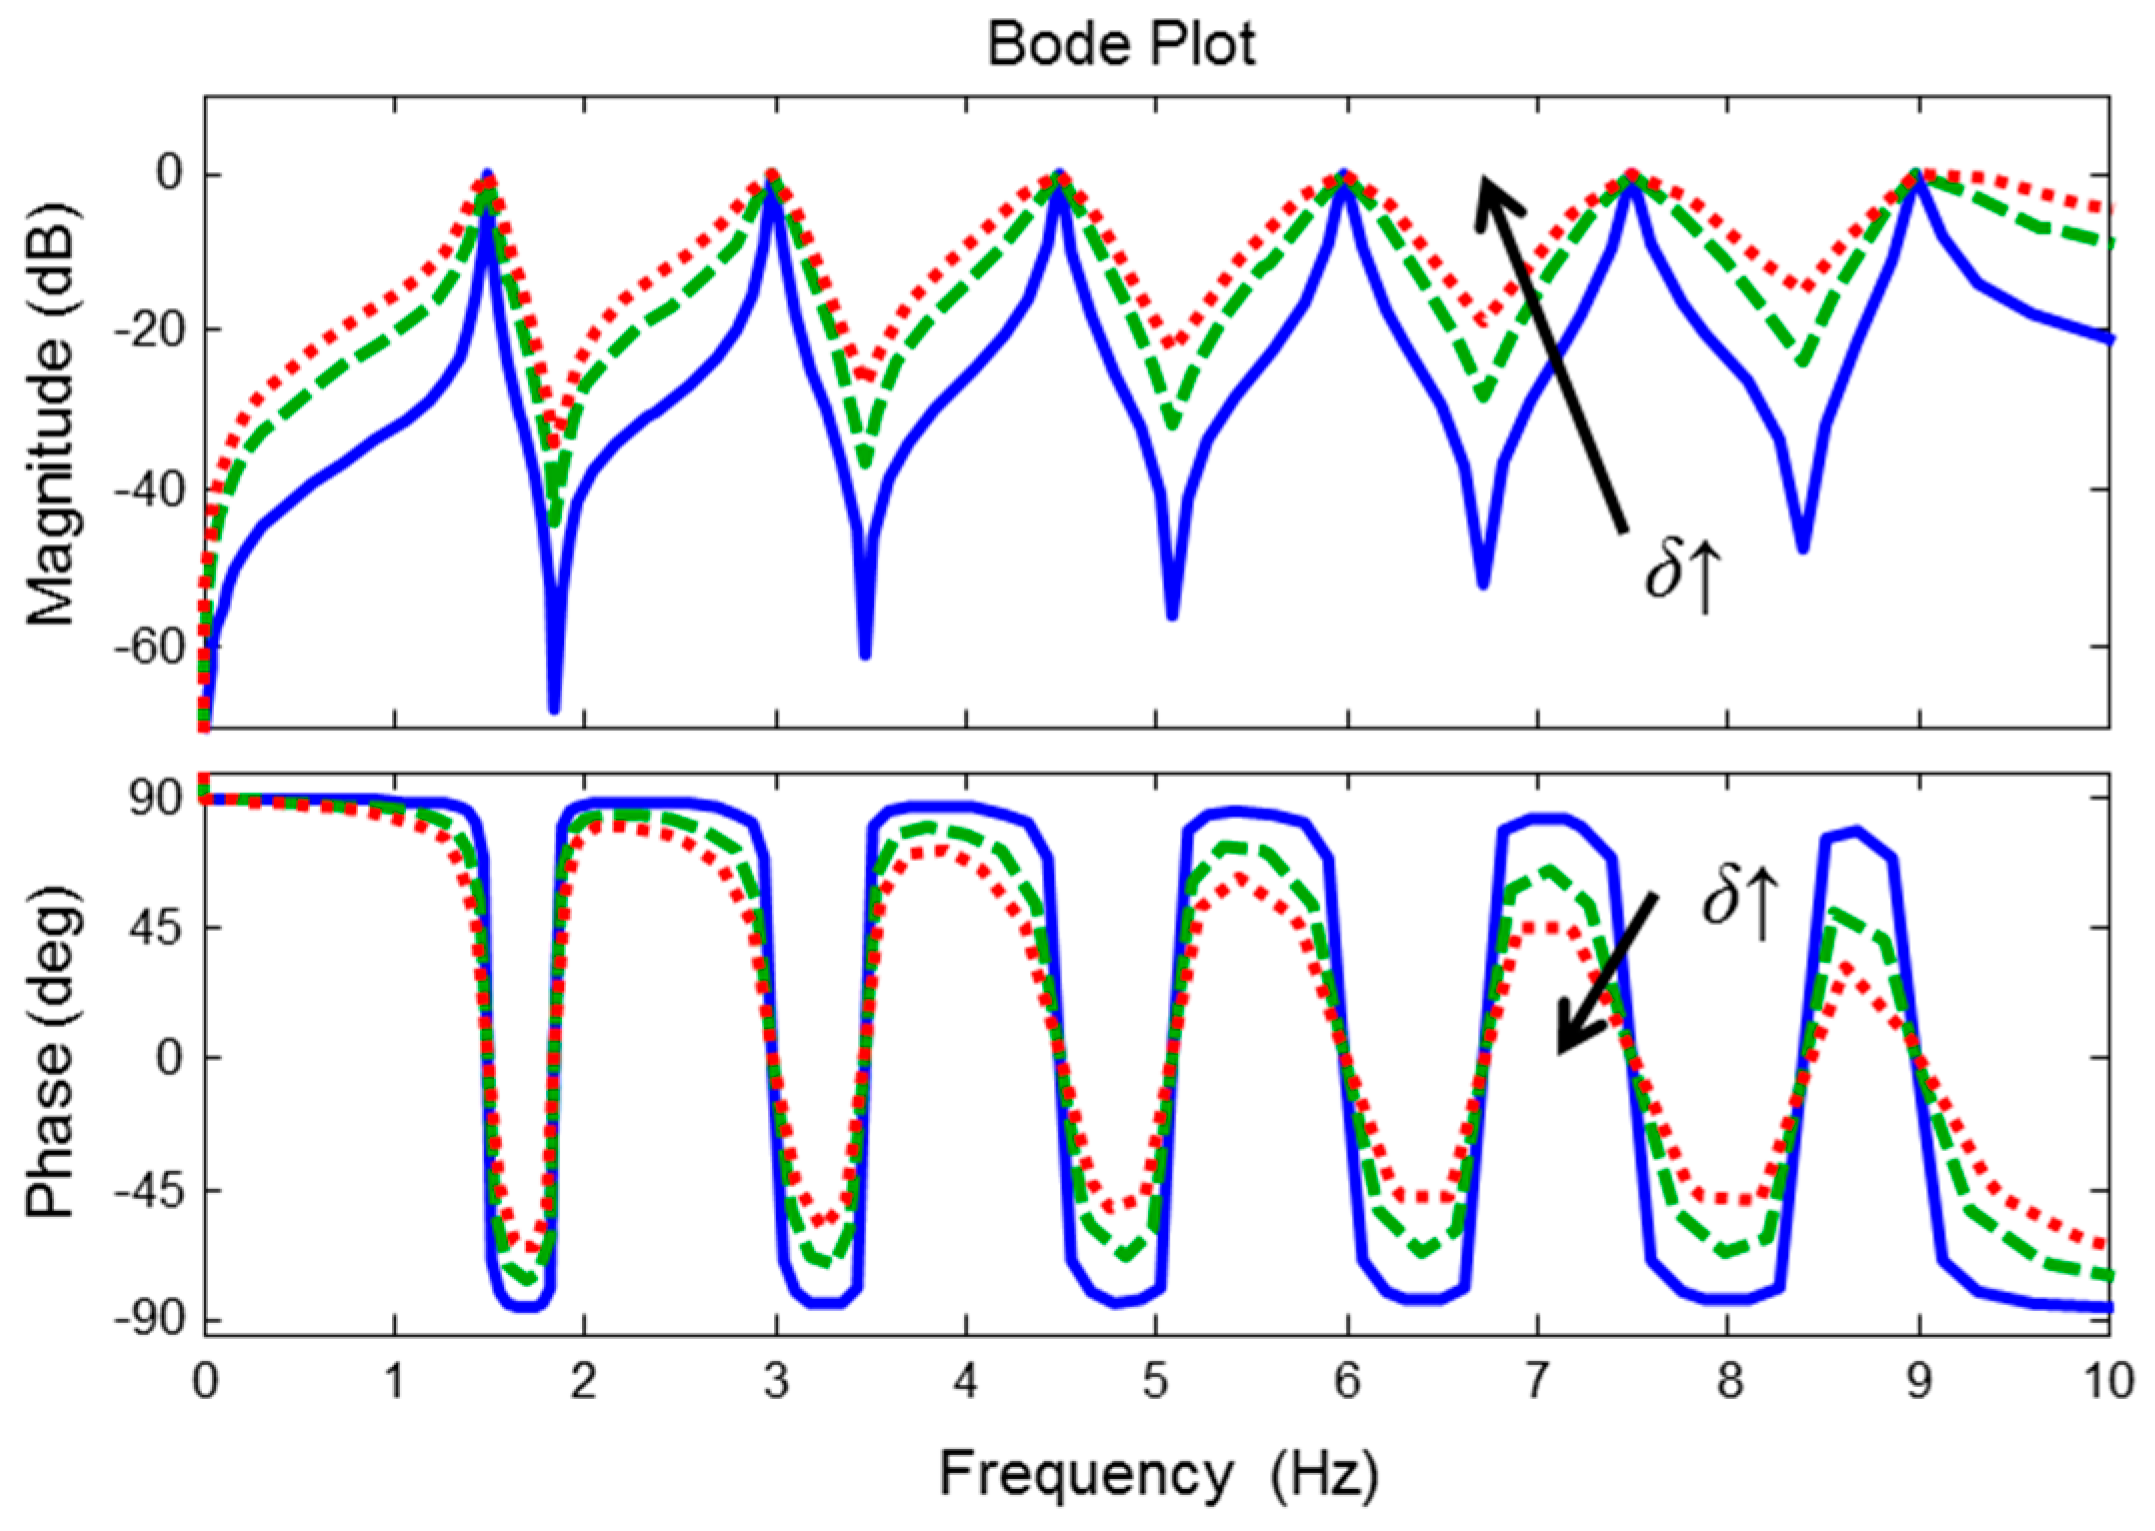
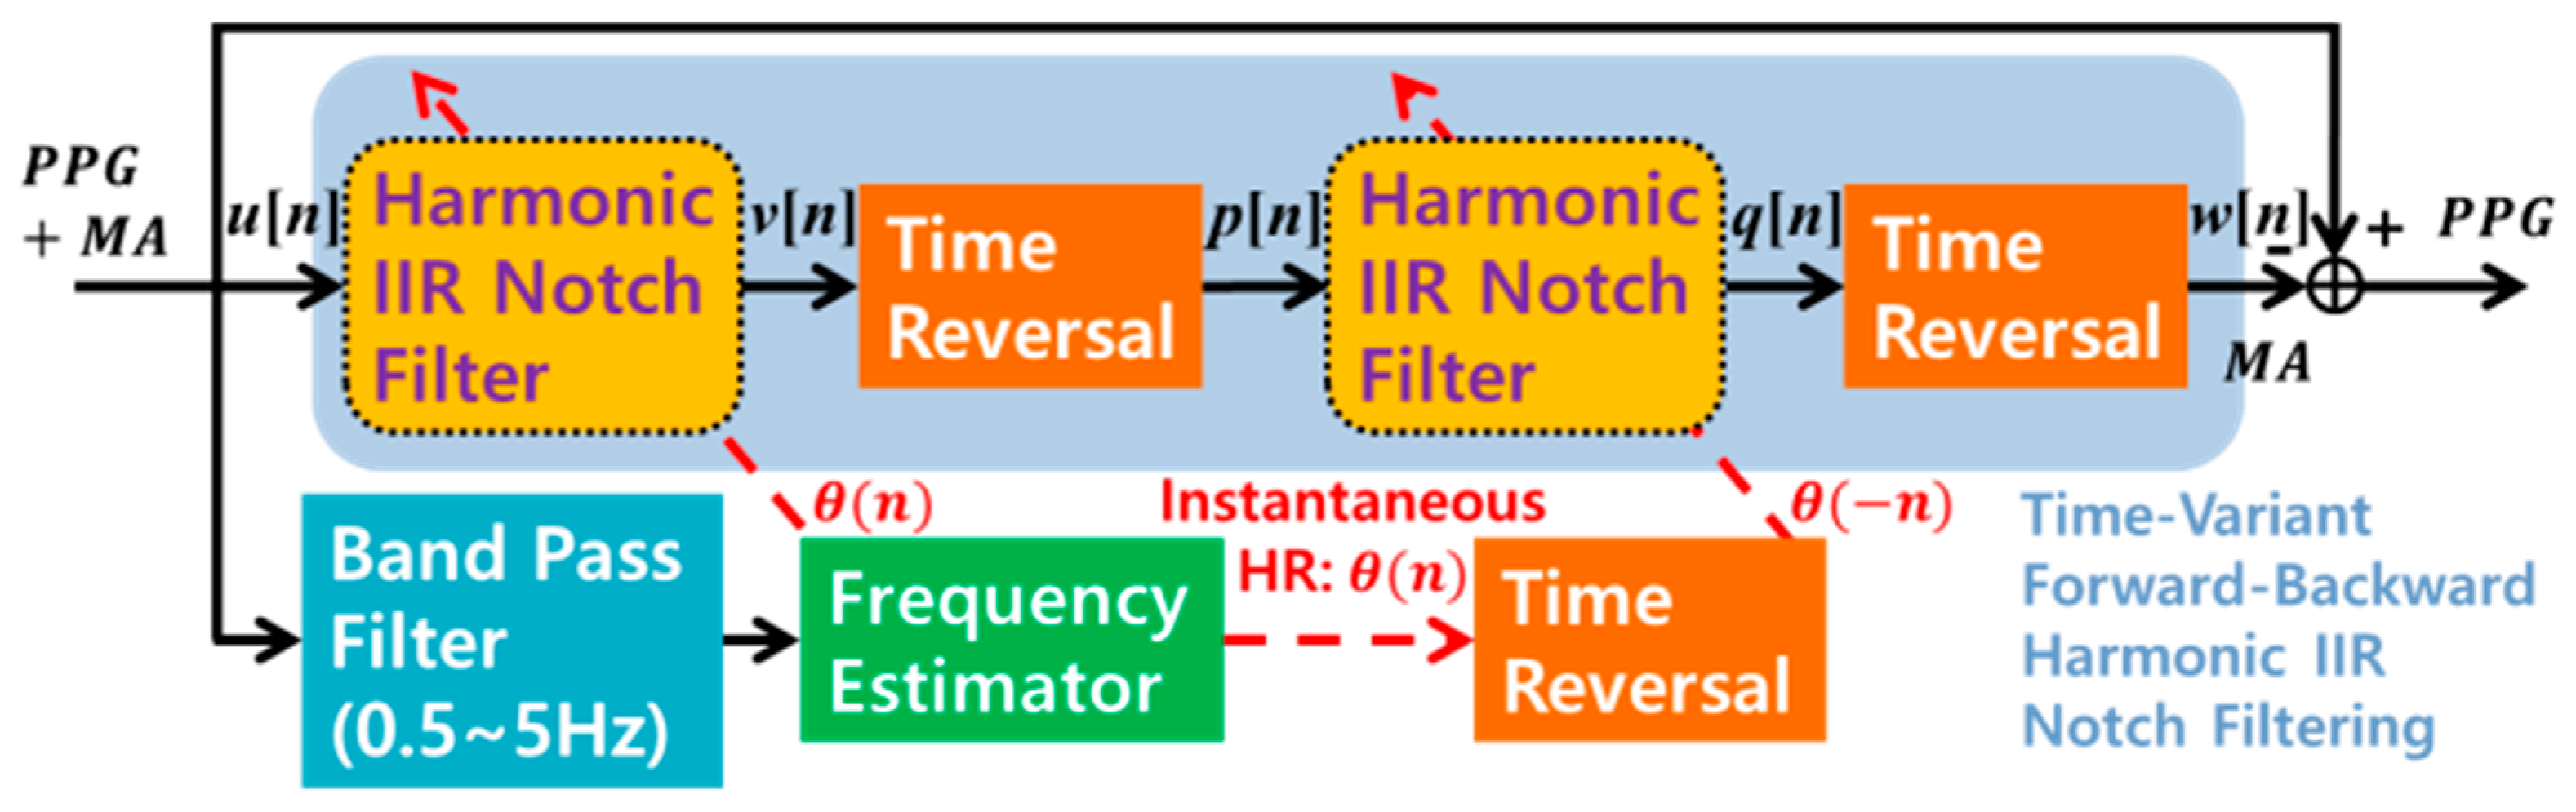
2.2. Zero-Phase Line Enhancer
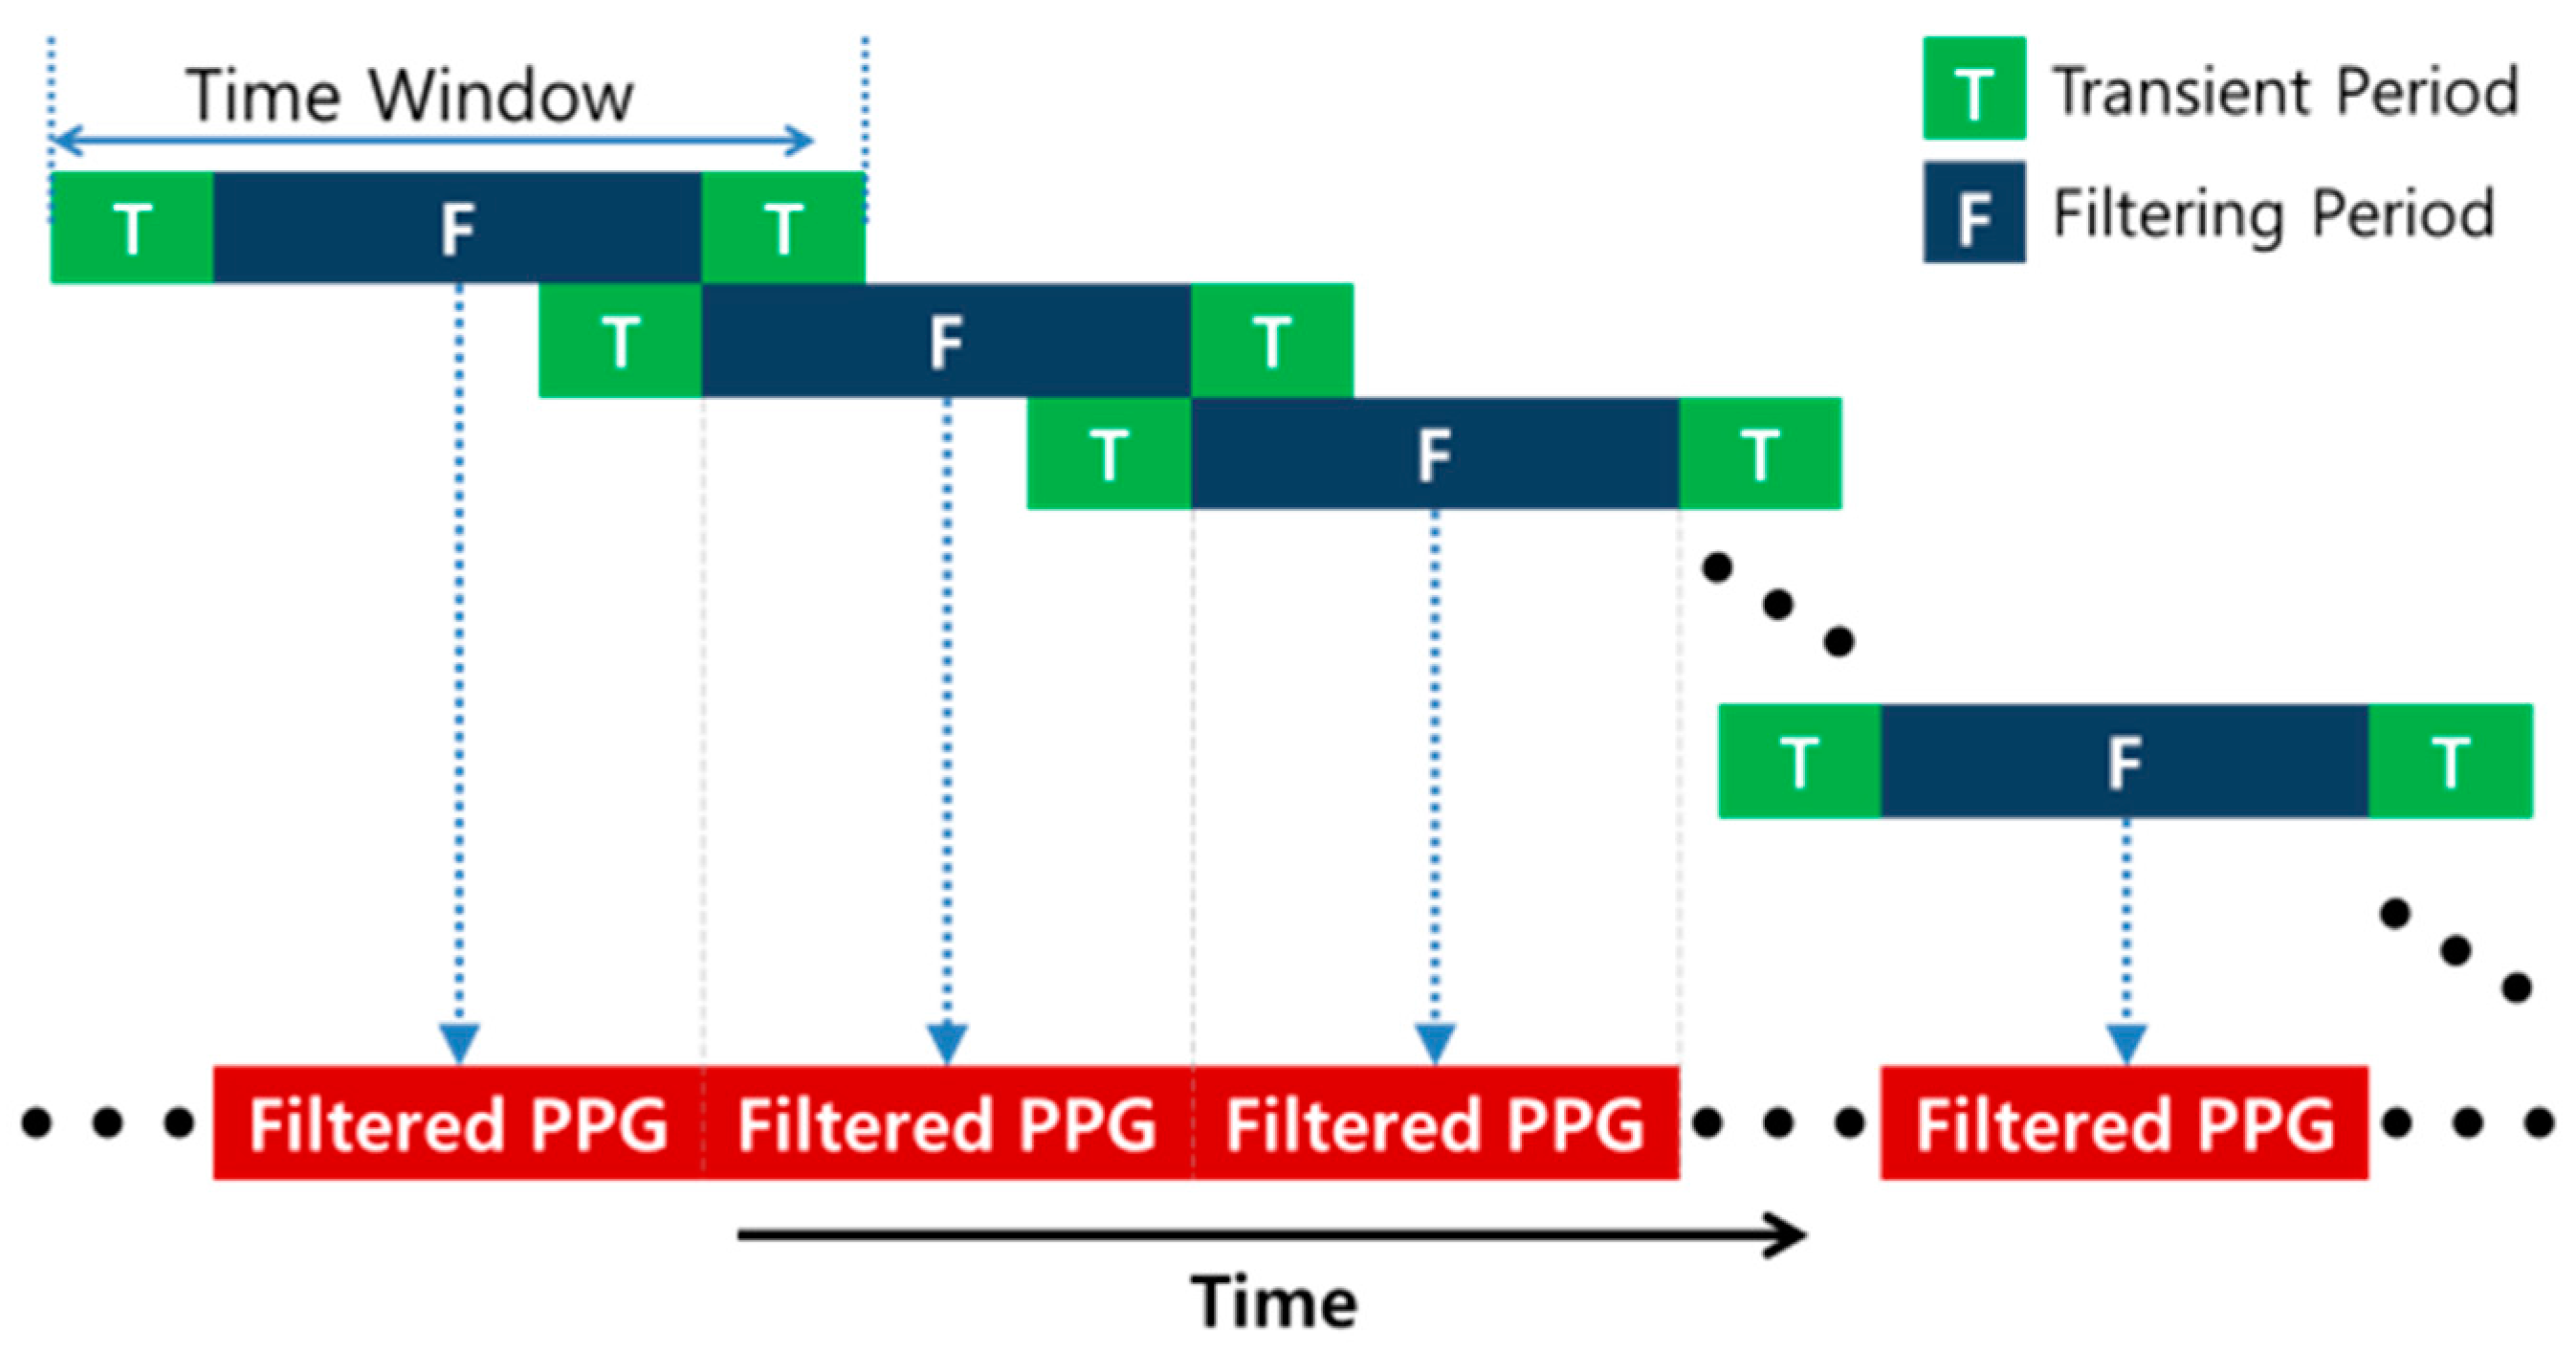
2.3. Real-Time Implementation of Zero-Phase Line Enhancer
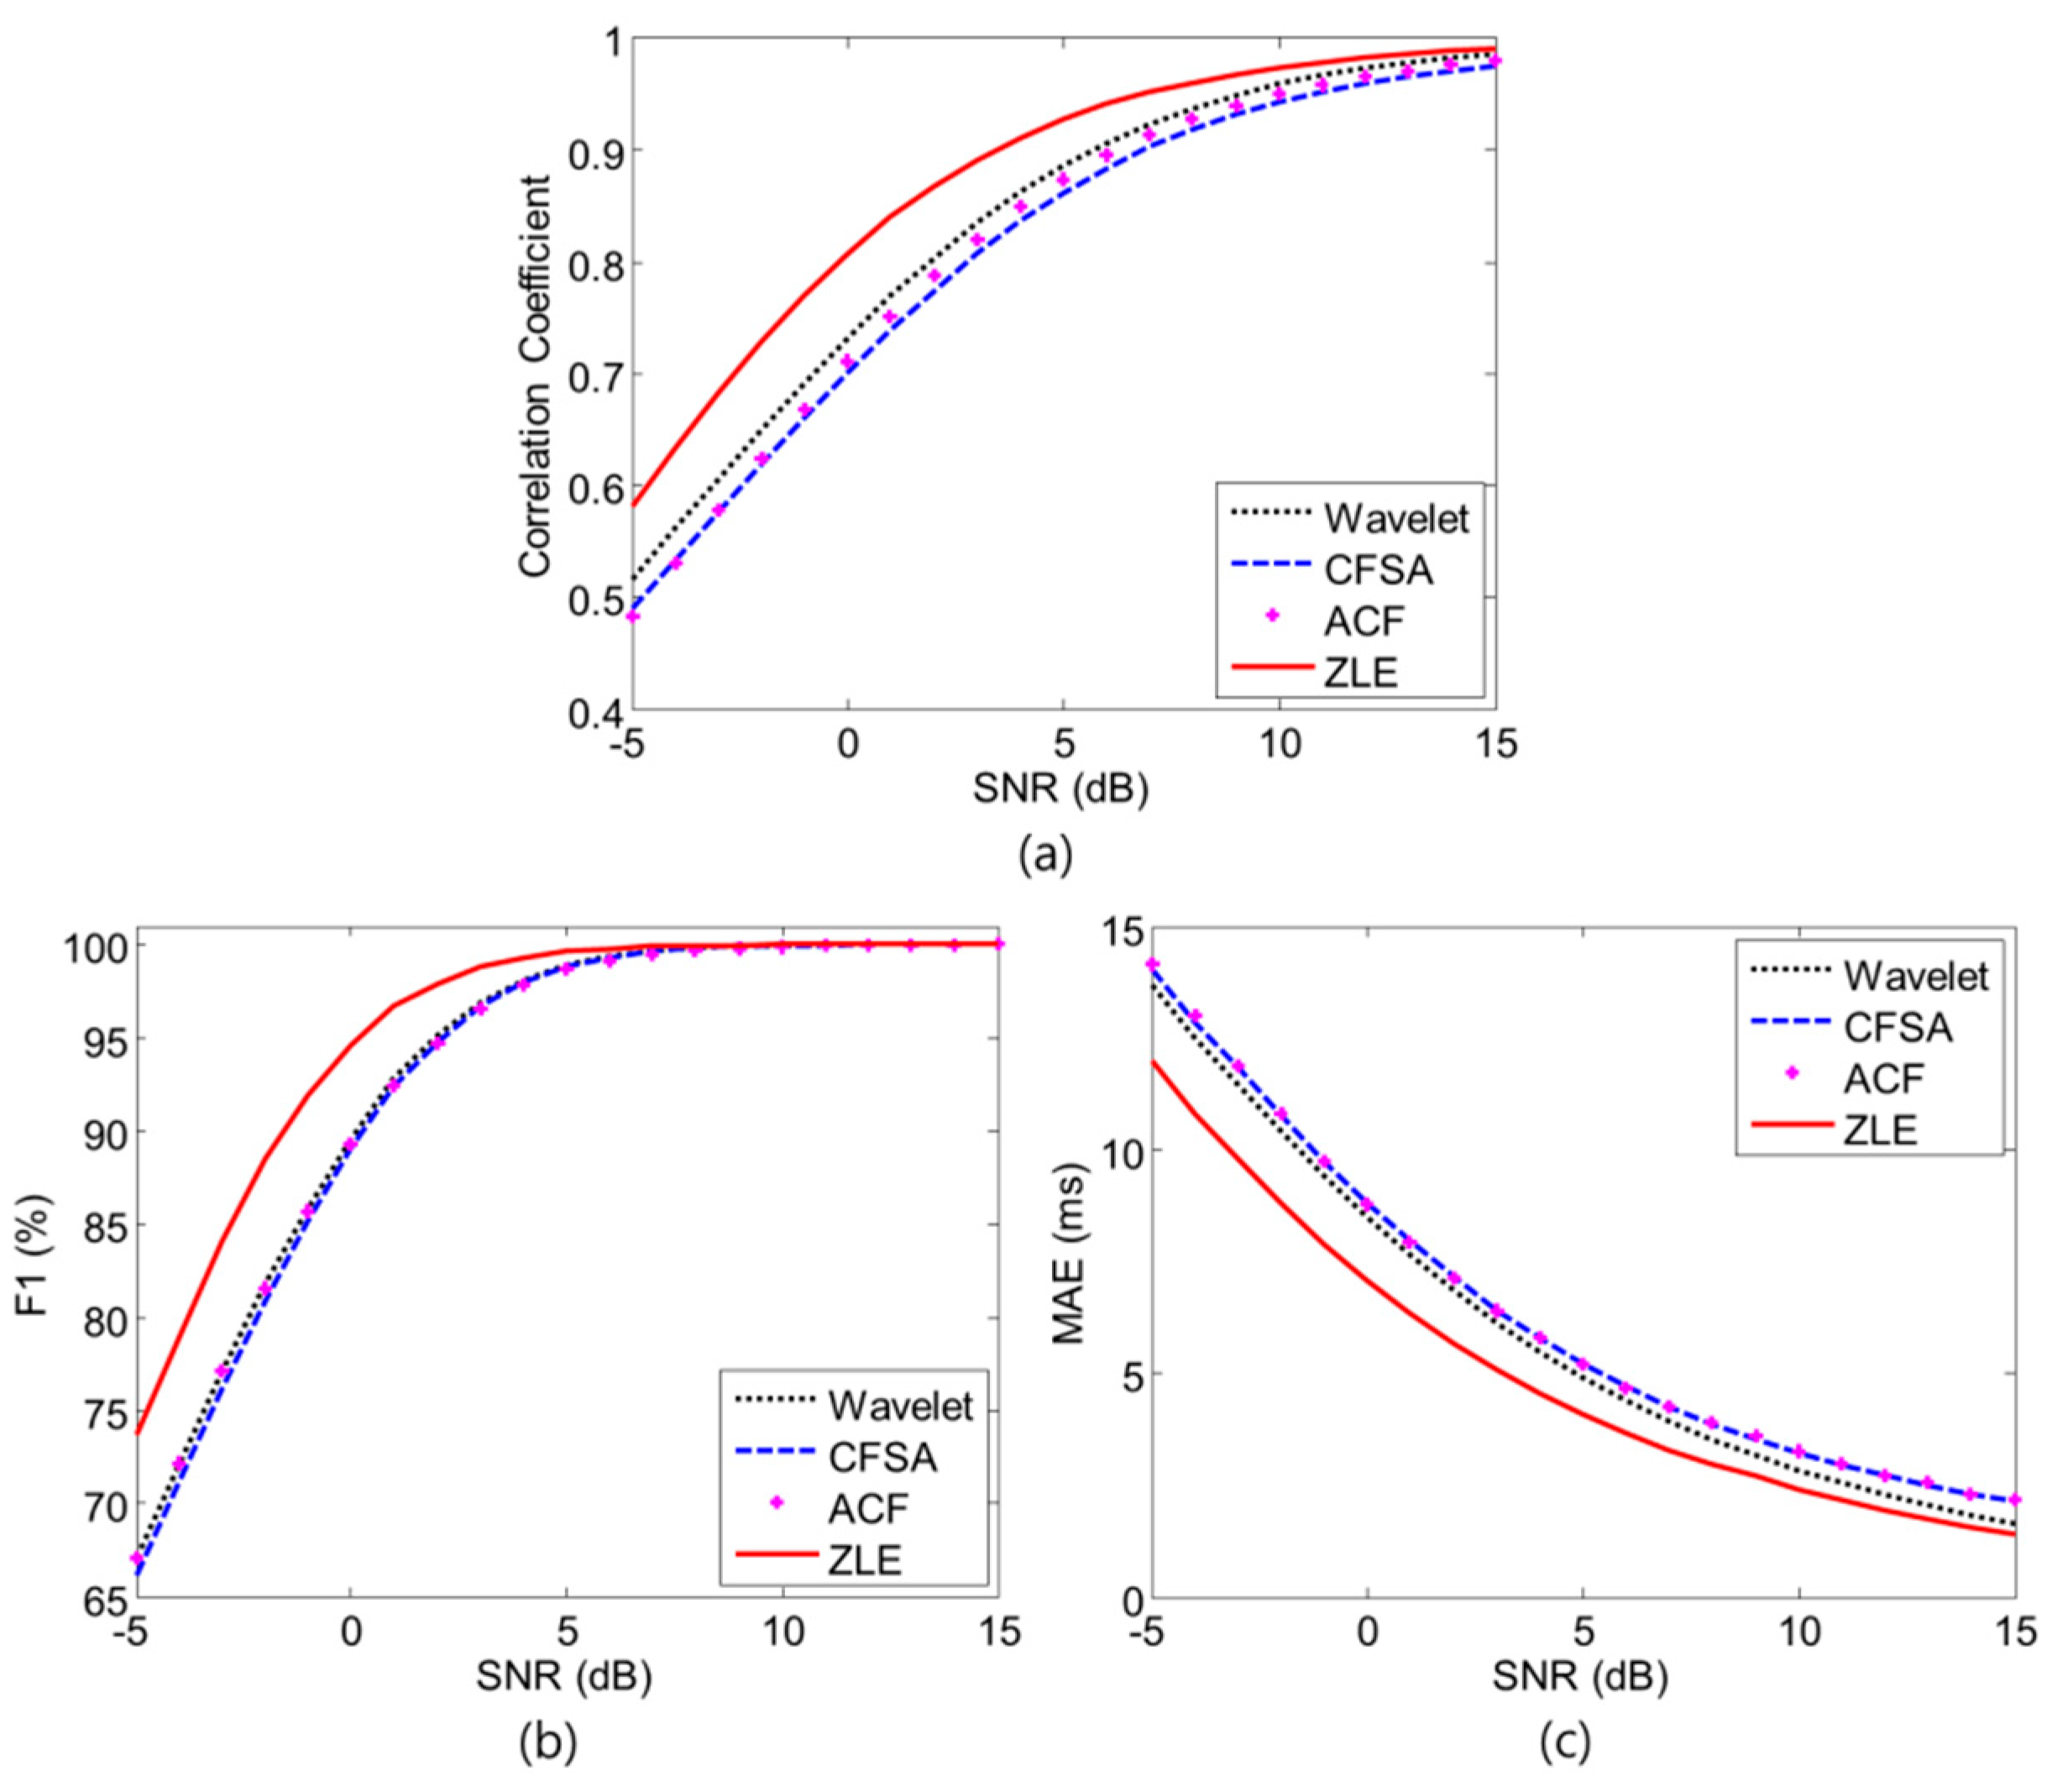
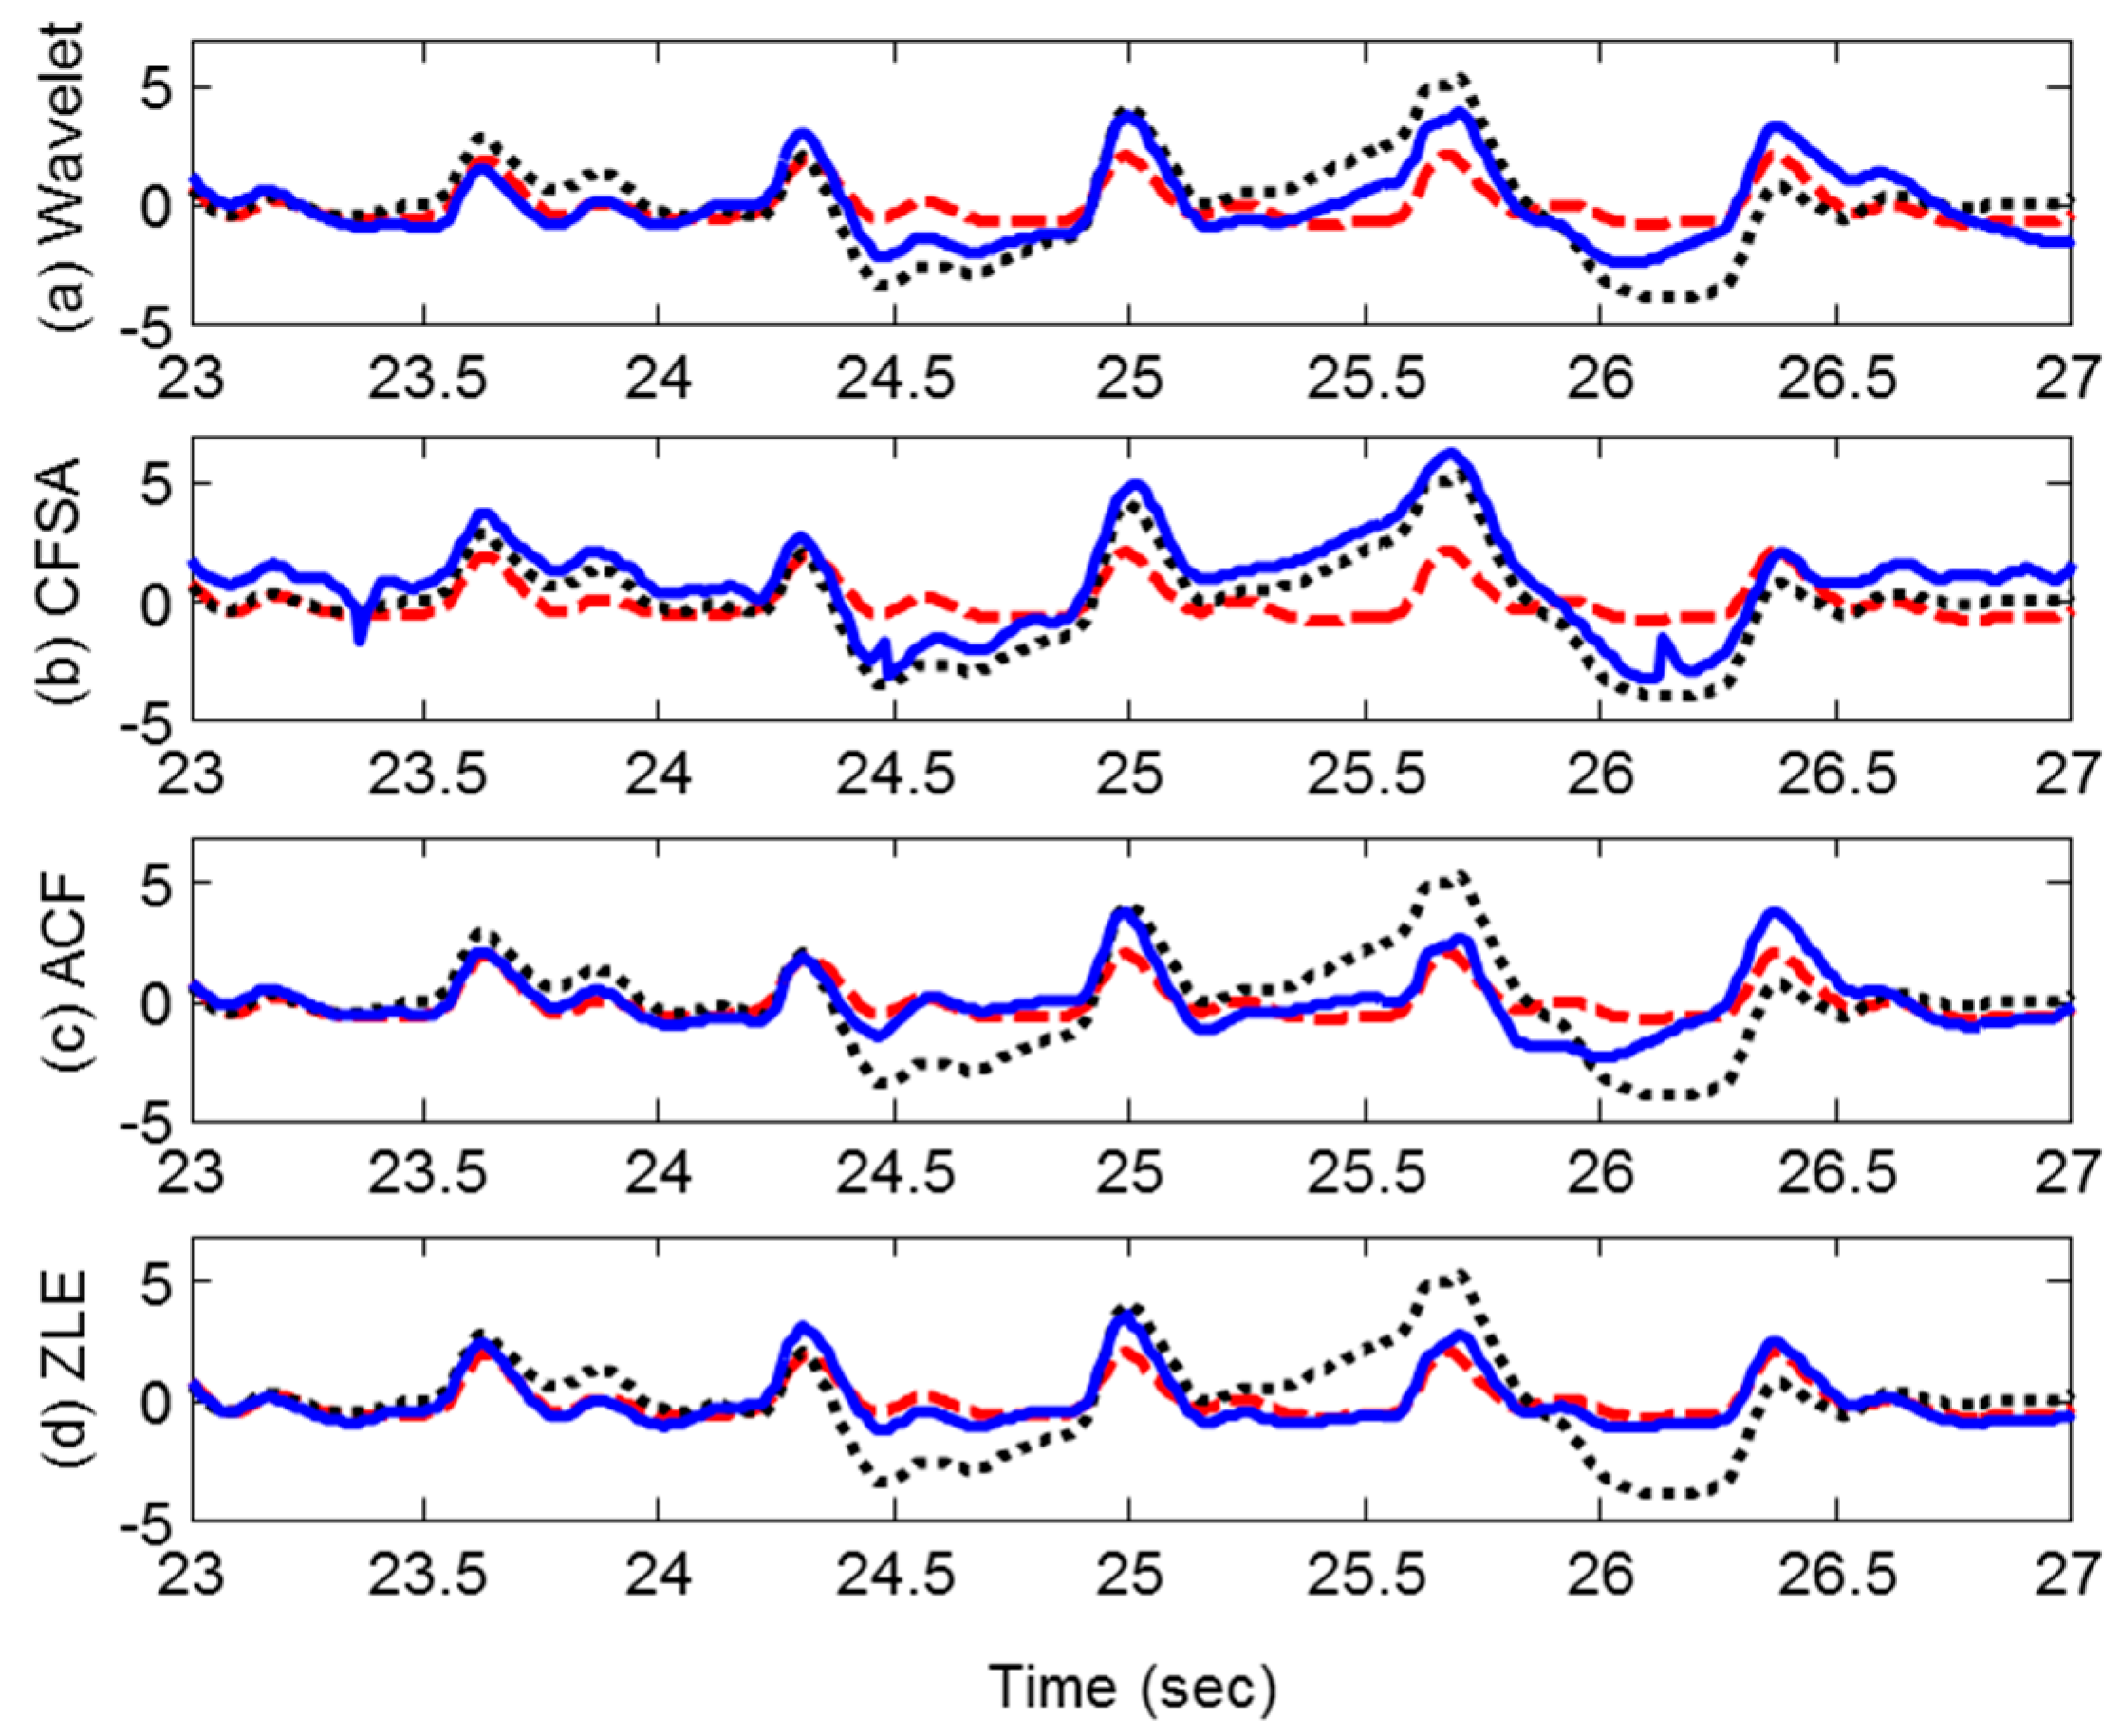
2.4. Performance Comparison under Colored Noise Interference
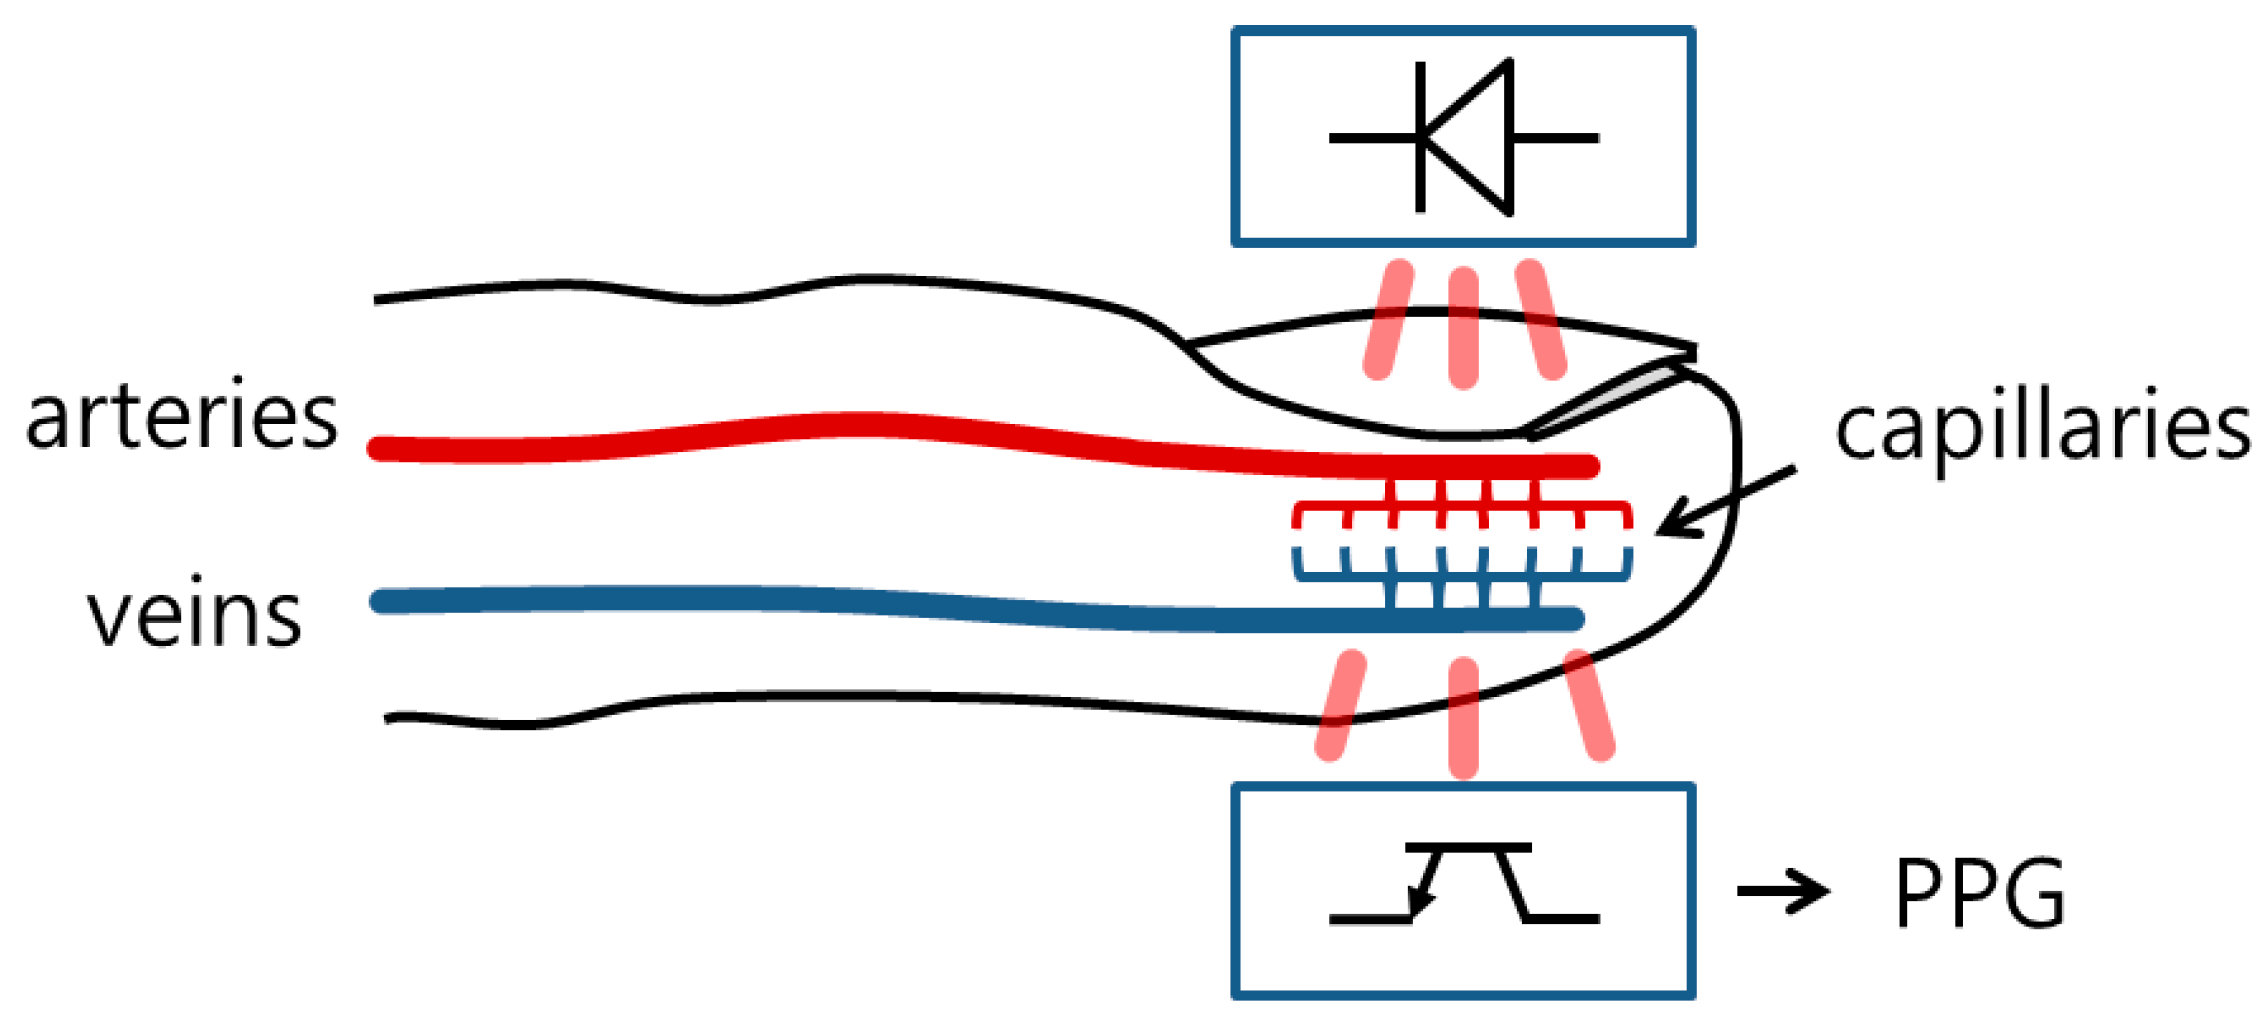
2.5. Data Acquisition
3. Results
4. Discussion
5. Conclusions
Supplementary Materials
Acknowledgments
Author Contributions
Conflicts of Interest
Abbreviations
| MA | Motion artifact |
| PPG | Photoplethysmogram |
| ECG | Electrocardiogram |
| HR | Heart rate |
| RR | Respiratory rate |
| HRV | Heart rate variability |
| ANC | Adaptive noise canceller |
| ICA | Independent Component Analysis |
| CFSA | Cycle by cycle Fourier series analysis |
| SSA | Singular spectrum analysis |
| ACF | Adaptive comb filter |
| IIR | Infinite impulse response |
| FIR | Finite impulse response |
| ZLE | Zero-phase line enhancer |
| ALNF | Adaptive lattice notch filter |
| MAE | Mean absolute error |
| Se | Sensitivity |
| PPV | Positive predictive value |
| SNR | Signal-to-noise ratio |
| LTV | linear time-variant |
References
- Bech, M.; Christiansen, T.; Khoman, E.; Lauridsen, J.; Weale, M. Ageing and health care expenditure in EU-15. Eur. J. Heal. Econ. 2011, 12, 469–478. [Google Scholar] [CrossRef] [PubMed]
- Touati, F.; Tabish, R. U-Healthcare system: State-of-the-art review and challenges. J. Med. Syst. 2013, 37, 9949. [Google Scholar] [CrossRef] [PubMed]
- Karlen, W.; Raman, S.; Ansermino, J.M.; Dumont, G.A. Multiparameter respiratory rate estimation from the photoplethysmogram. IEEE Trans. Biomed. Eng. 2013, 60, 1946–1953. [Google Scholar] [CrossRef] [PubMed]
- Zhang, Z.; Pi, Z.; Liu, B. TROIKA: A general framework for heart rate monitoring using wrist-type photoplethysmographic signals during intensive physical exercise. IEEE Trans. Biomed. Eng. 2015, 62, 522–531. [Google Scholar] [CrossRef] [PubMed]
- Poh, M.Z.; McDuff, D.J.; Picard, R.W. Non-contact, automated cardiac pulse measurements using video imaging and blind source separation. Opt. Express 2010, 18, 10762–10774. [Google Scholar] [CrossRef] [PubMed]
- Park, C.; Lee, B. Real-time estimation of respiratory rate from a photoplethysmogram using an adaptive lattice notch filter. Biomed. Eng. Online 2014, 13, 170. [Google Scholar] [CrossRef] [PubMed]
- Lu, S.; Zhao, H.; Ju, K.; Shin, K.; Lee, M.; Shelley, K.; Chon, K.H. Can photoplethysmography variability serve as an alternative approach to obtain heart rate variability information? J. Clin. Monit. Comput. 2008, 22, 23–29. [Google Scholar] [CrossRef] [PubMed]
- Kurylyak, Y.; Lamonaca, F.; Grimaldi, D. A Neural Network-based method for continuous blood pressure estimation from a PPG signal. In Proceedings of the 2013 IEEE International Instrumentation and Measurement Technology Conference (I2MTC), Minneapolis, MN, USA, 6–9 May 2013; pp. 280–283. [Google Scholar]
- Teng, X.F.; Zhang, Y.T. Continuous and noninvasive estimation of arterial blood pressure using a photoplethysmographic approach. In Proceedings of the 25th Annual International Conference of the IEEE Engineering in Medicine and Biology Society, Cancun, Mexico, 17–21 September 2003. [Google Scholar]
- Lee, B.; Han, J.; Baek, H.J.; Shin, J.H.; Park, K.S.; Yi, W.J. Improved elimination of motion artifacts from a photoplethysmographic signal using a Kalman smoother with simultaneous accelerometry. Physiol. Meas. 2010, 31, 1585–1603. [Google Scholar] [CrossRef] [PubMed]
- Widrow, B.; Glover, J.R.; McCool, J.M.; Kaunitz, J.; Williams, C.S.; Hearn, R.H.; Zeidler, J.R.; Eugene Dong, J.; Goodlin, R.C. Adaptive noise cancelling: Principles and applications. Proc. IEEE 1975, 63, 1692–1716. [Google Scholar] [CrossRef]
- Kim, B.S.; Yoo, S.K. Motion artifact reduction in photoplethysmography using independent component analysis. IEEE Trans. Biomed. Eng. 2006, 53, 566–568. [Google Scholar] [CrossRef] [PubMed]
- Foo, J.Y.A. Use of Independent Component Analysis to Reduce Motion Artifact in Pulse Transit Time Measurement. IEEE Signal Process. Lett. 2008, 15, 124–126. [Google Scholar] [CrossRef]
- Peng, F.; Zhang, Z.; Gou, X.; Liu, H.; Wang, W. Motion artifact removal from photoplethysmographic signals by combining temporally constrained independent component analysis and adaptive filter. Biomed. Eng. Online 2014, 13, 50. [Google Scholar] [CrossRef] [PubMed]
- Sweeney, K.T.; Ward, T.E.; McLoone, S.F. Artifact removal in physiological signals--practices and possibilities. IEEE Trans. Inf. Technol. Biomed. 2012, 16, 488–500. [Google Scholar] [CrossRef] [PubMed]
- Lee, C.M.; Zhang, Y.T. Reduction of motion artifacts from photoplethysmographic recordings using a wavelet denoising approach. In Proceedings of the IEEE EMBS Asian-Pacific Conference on Biomedical Engineering, Kyoto-Osaka-Nara, Japan, 20–22 October 2003; pp. 194–195. [Google Scholar]
- Reddy, K.A.; George, B.; Kumar, V.J. Use of Fourier Series Analysis for Motion Artifact Reduction and Data Compression of Photoplethysmographic Signals. IEEE Trans. Instrum. Meas. 2009, 58, 1706–1711. [Google Scholar]
- Naraharisetti, K.V.P.; Bawa, M. Comparison of different signal processing methods for reducing artifacts from photoplethysmograph signal. In Proceedings of the 2011 IEEE International Conference on Electro/Information Technology, Mankato, MN, USA, 15–17 May 2011; pp. 1–8. [Google Scholar]
- Salehizadeh, S.M.A.; Dao, D.K.; Chong, J.W.; McManus, D.; Darling, C.; Mendelson, Y.; Chon, K.H. Photoplethysmograph signal reconstruction based on a novel motion artifact detection-reduction approach. Part II: Motion and noise artifact removal. Ann. Biomed. Eng. 2014, 42, 2251–2263. [Google Scholar] [CrossRef] [PubMed]
- Cyrill, D.; McNames, J.; Aboy, M. Adaptive comb filters for quasiperiodic physiologic signals. In Proceedings of the 25th Annual International Conference of the IEEE Engineering in Medicine and Biology Society, Cancun, Mexico, 17–21 September 2003. [Google Scholar]
- Pei, S.; Tseng, C. Elimination of AC interference in electrocardiogram using IIR notch filter with transient suppression. IEEE Trans. Biomed. Eng. 1995, 42, 1128–1132. [Google Scholar] [PubMed]
- Lee, B.; Kee, Y.; Han, J.; Yi, W.J. Adaptive comb filtering for motion artifact reduction from PPG with a structure of adaptive lattice IIR notch filter. In Proceedings of the 33rd Annual International Conference of the IEEE Engineering in Medicine and Biology Society, Boston, MA, USA, 30 August–3 September 2011. [Google Scholar]
- Ramli, R.; Noor, A.; Samad, S. A Review of Adaptive Line Enhancers for Noise Cancellation. Aust. J. Basic Appl. Sci. 2012, 6, 337–352. [Google Scholar]
- Cho, N.I.; Lee, S.U. On the adaptive lattice notch filter for the detection of sinusoids. IEEE Trans. Circuits Syst. II Analog Digit. Signal Process. 1993, 40, 405–416. [Google Scholar] [CrossRef]
- Mitra, S. Digital Signal Processing: A Computer-Based Approach, 4th ed.; McGraw-Hill: New York, NY, USA, 2011. [Google Scholar]
- Prater, J.S.; Loeffler, C.M. Analysis and design of periodically time-varying IIR filters, with applications to transmultiplexing. IEEE Trans. Signal Process. 1992, 40, 2715–2725. [Google Scholar] [CrossRef]
- Vaidyanathan, P.P. Time-varying filters and filter banks: Some basic principles. IEEE Trans. Signal Process. 1996, 44, 2971–2987. [Google Scholar]
- Sörnmo, L. Time-varying digital filtering of ECG baseline wander. Med. Biol. Eng. Comput. 1993, 31, 503–508. [Google Scholar] [CrossRef] [PubMed]
- Gustafsson, F. Determining the initial states in forward-backward filtering. IEEE Trans. Signal Process. 1996, 44, 988–992. [Google Scholar] [CrossRef]
- Kasdin, N.J. Discrete simulation of colored noise and stochastic processes and 1/f/sup /spl alpha// power law noise generation. Proc. IEEE 1995, 83, 802–827. [Google Scholar] [CrossRef]
- Pimentel, M.; Santos, M.D.; Springer, D.B.; Clifford, G.D. Heart beat detection in multimodal physiological data using a hidden semi-Markov model and signal quality indices. Physiol. Meas. 2015, 36, 1717–1727. [Google Scholar] [CrossRef] [PubMed]
- Lee, K.J.; Lee, B. Sequential Total Variation Denoising for the Extraction of Fetal ECG from Single-Channel Maternal Abdominal ECG. Sensors 2016, 16, 1020. [Google Scholar] [CrossRef] [PubMed]
- Guo, Q.; Zhang, C. A noise reduction approach based on Stein’s unbiased risk estimate. Sci. Asia 2012, 207–211. [Google Scholar] [CrossRef]


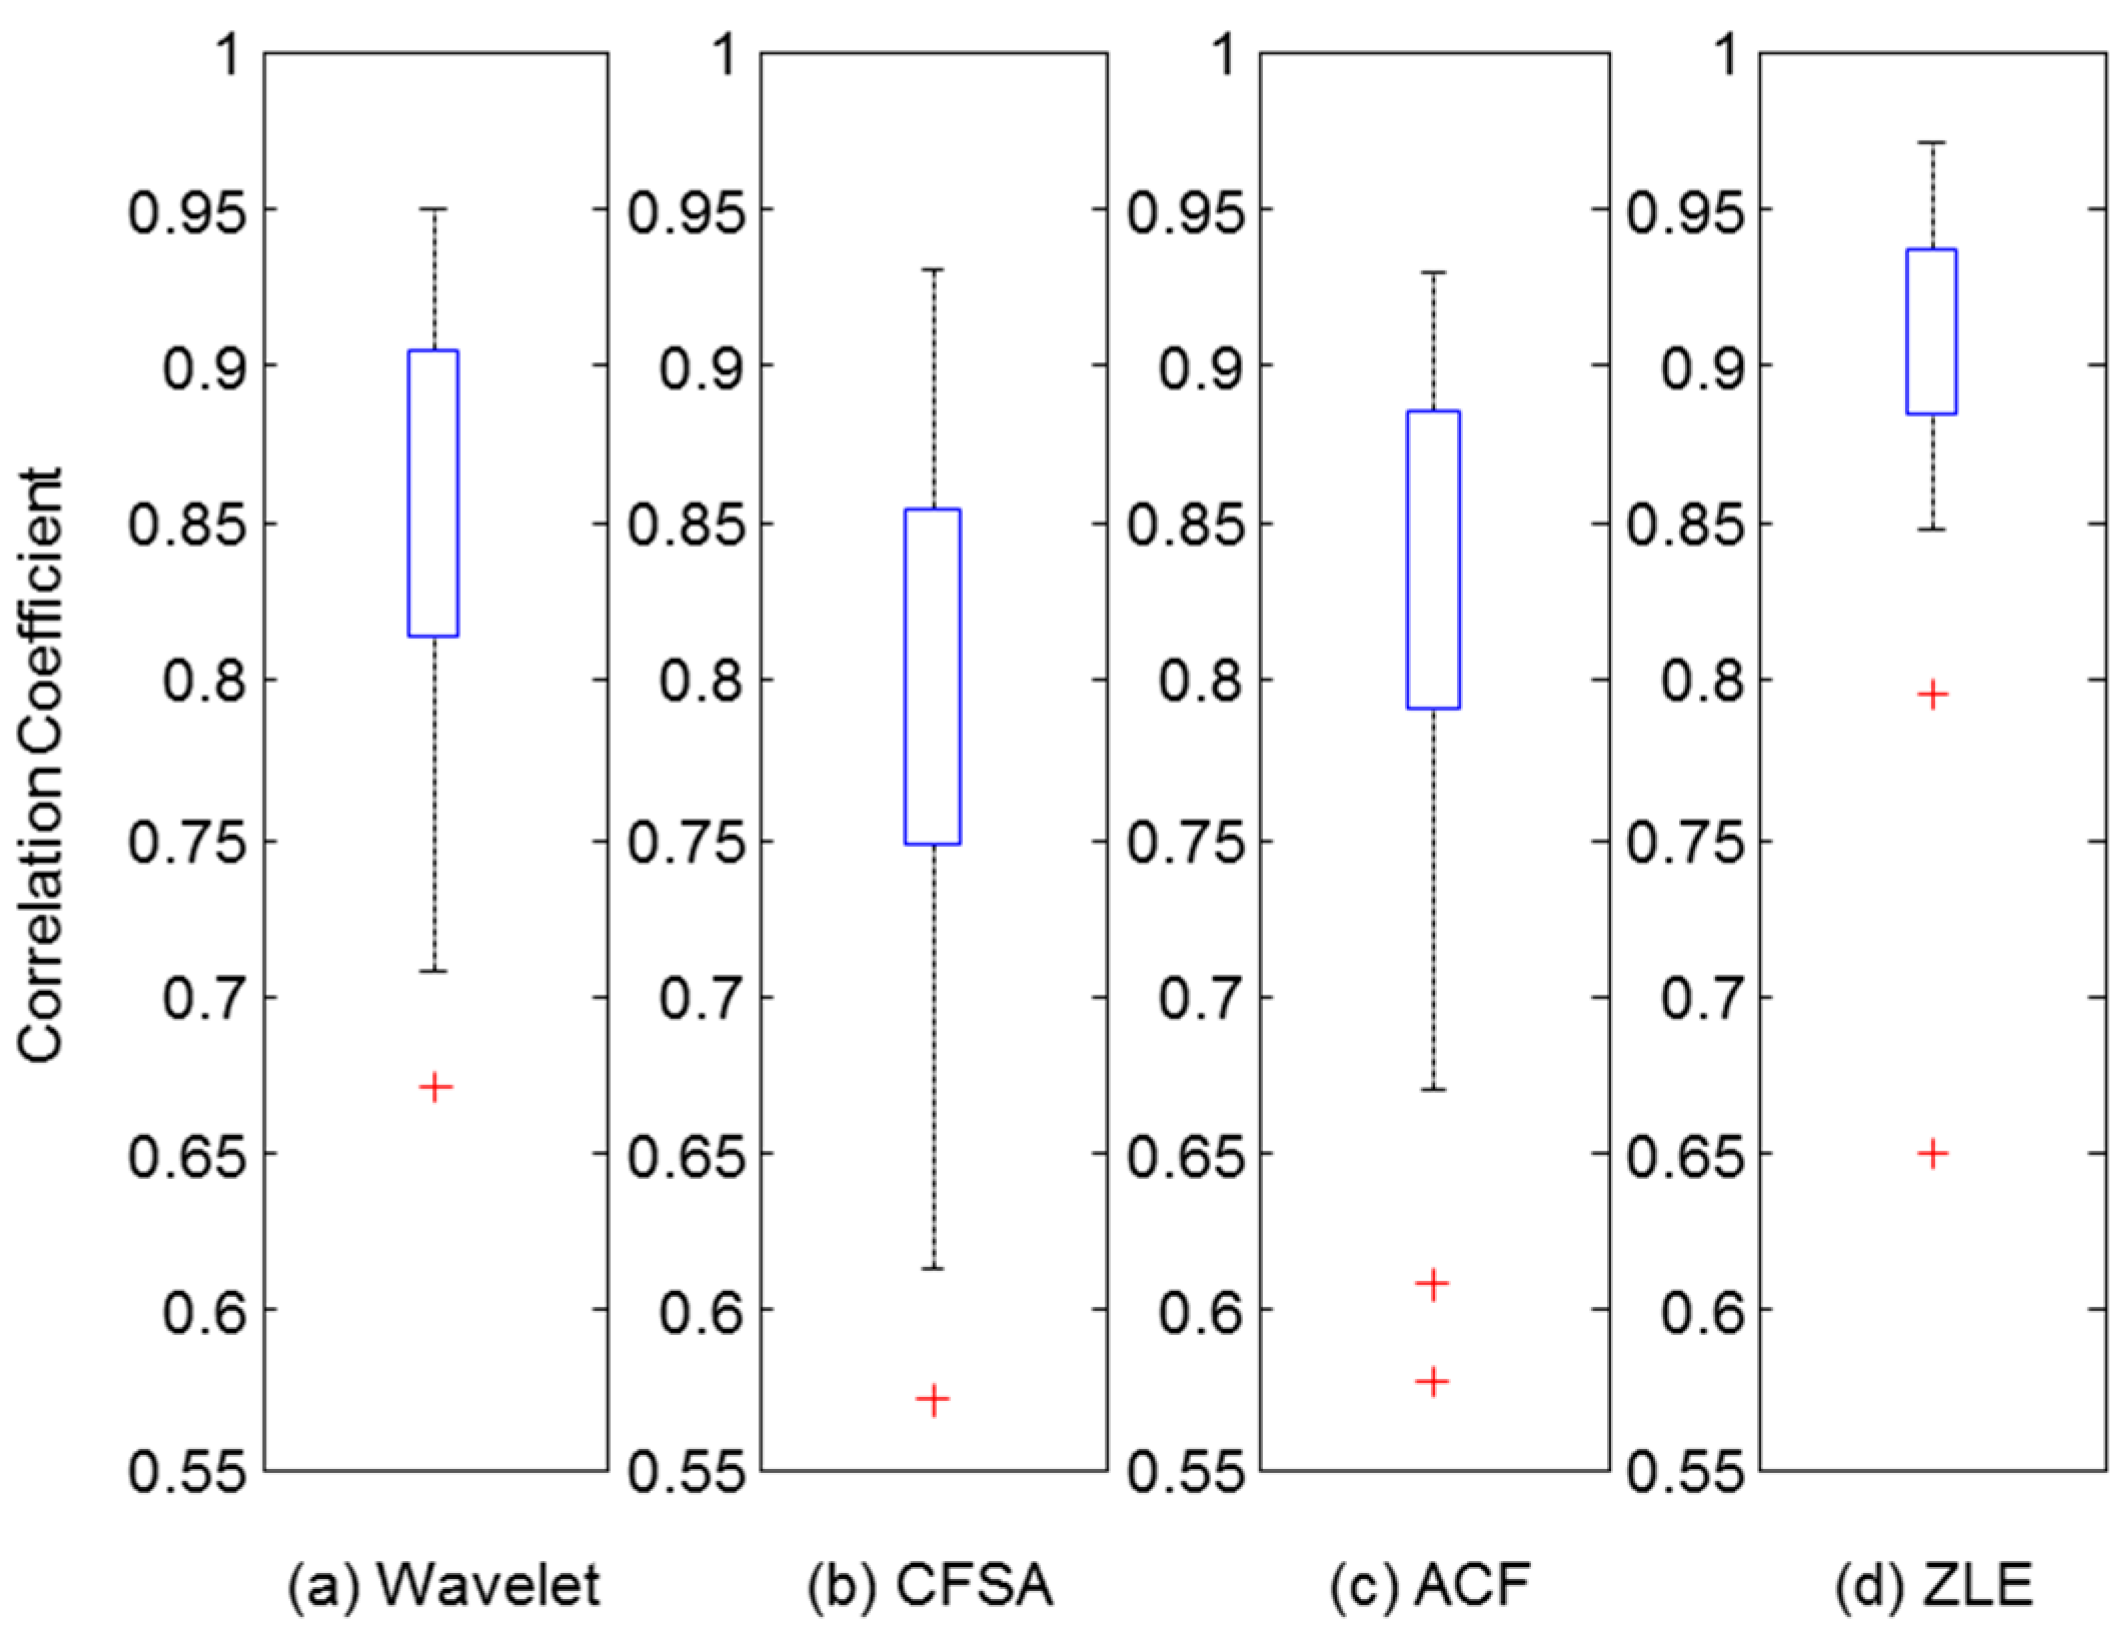
| Wavelet | CFSA | ACF | ZLE | |
|---|---|---|---|---|
| Finger Bending | 0.8237 ± 0.0716 | 0.7405 ± 0.0945 | 0.7824 ± 0.1082 | 0.8728 ± 0.0976 |
| Elbow Bending | 0.8777 ± 0.0548 | 0.8357 ± 0.0569 | 0.8619 ± 0.0523 | 0.9262 ± 0.0287 |
| Arm Swing | 0.8352 ± 0.0822 | 0.7956 ± 0.0929 | 0.8198 ± 0.1000 | 0.9043 ± 0.0526 |
| Total | 0.8455 ± 0.0713 | 0.7906 ± 0.0890 | 0.8214 ± 0.0924 | 0.9011 ± 0.0670 |
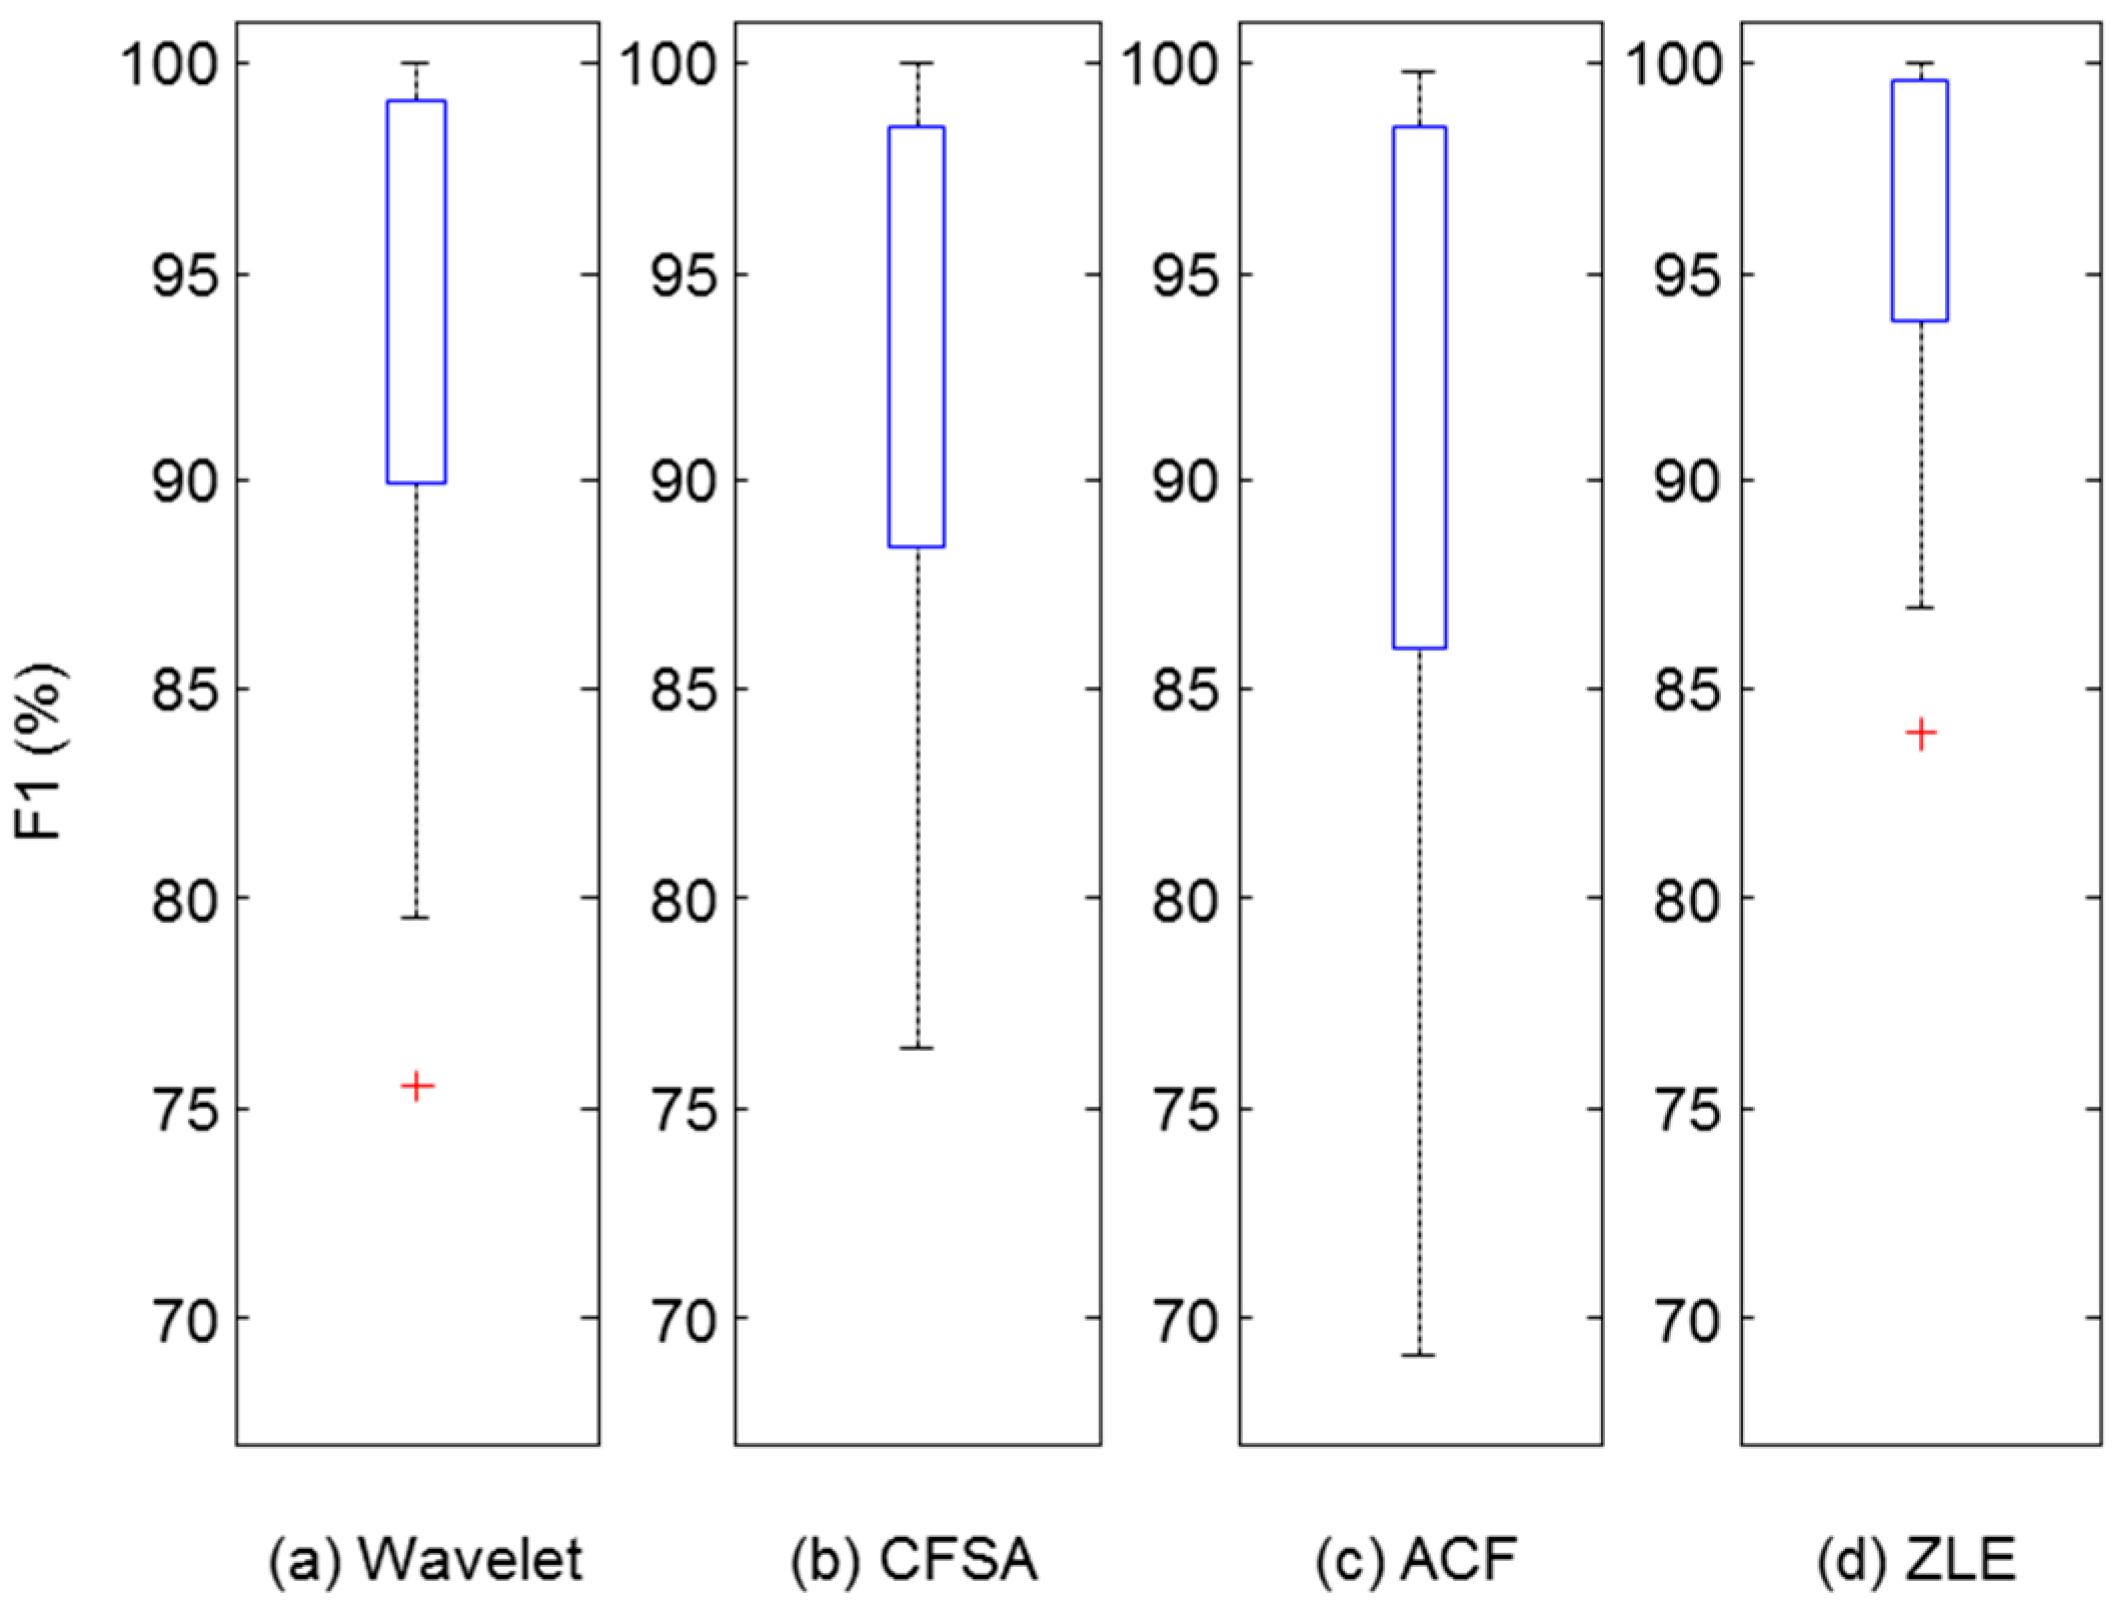
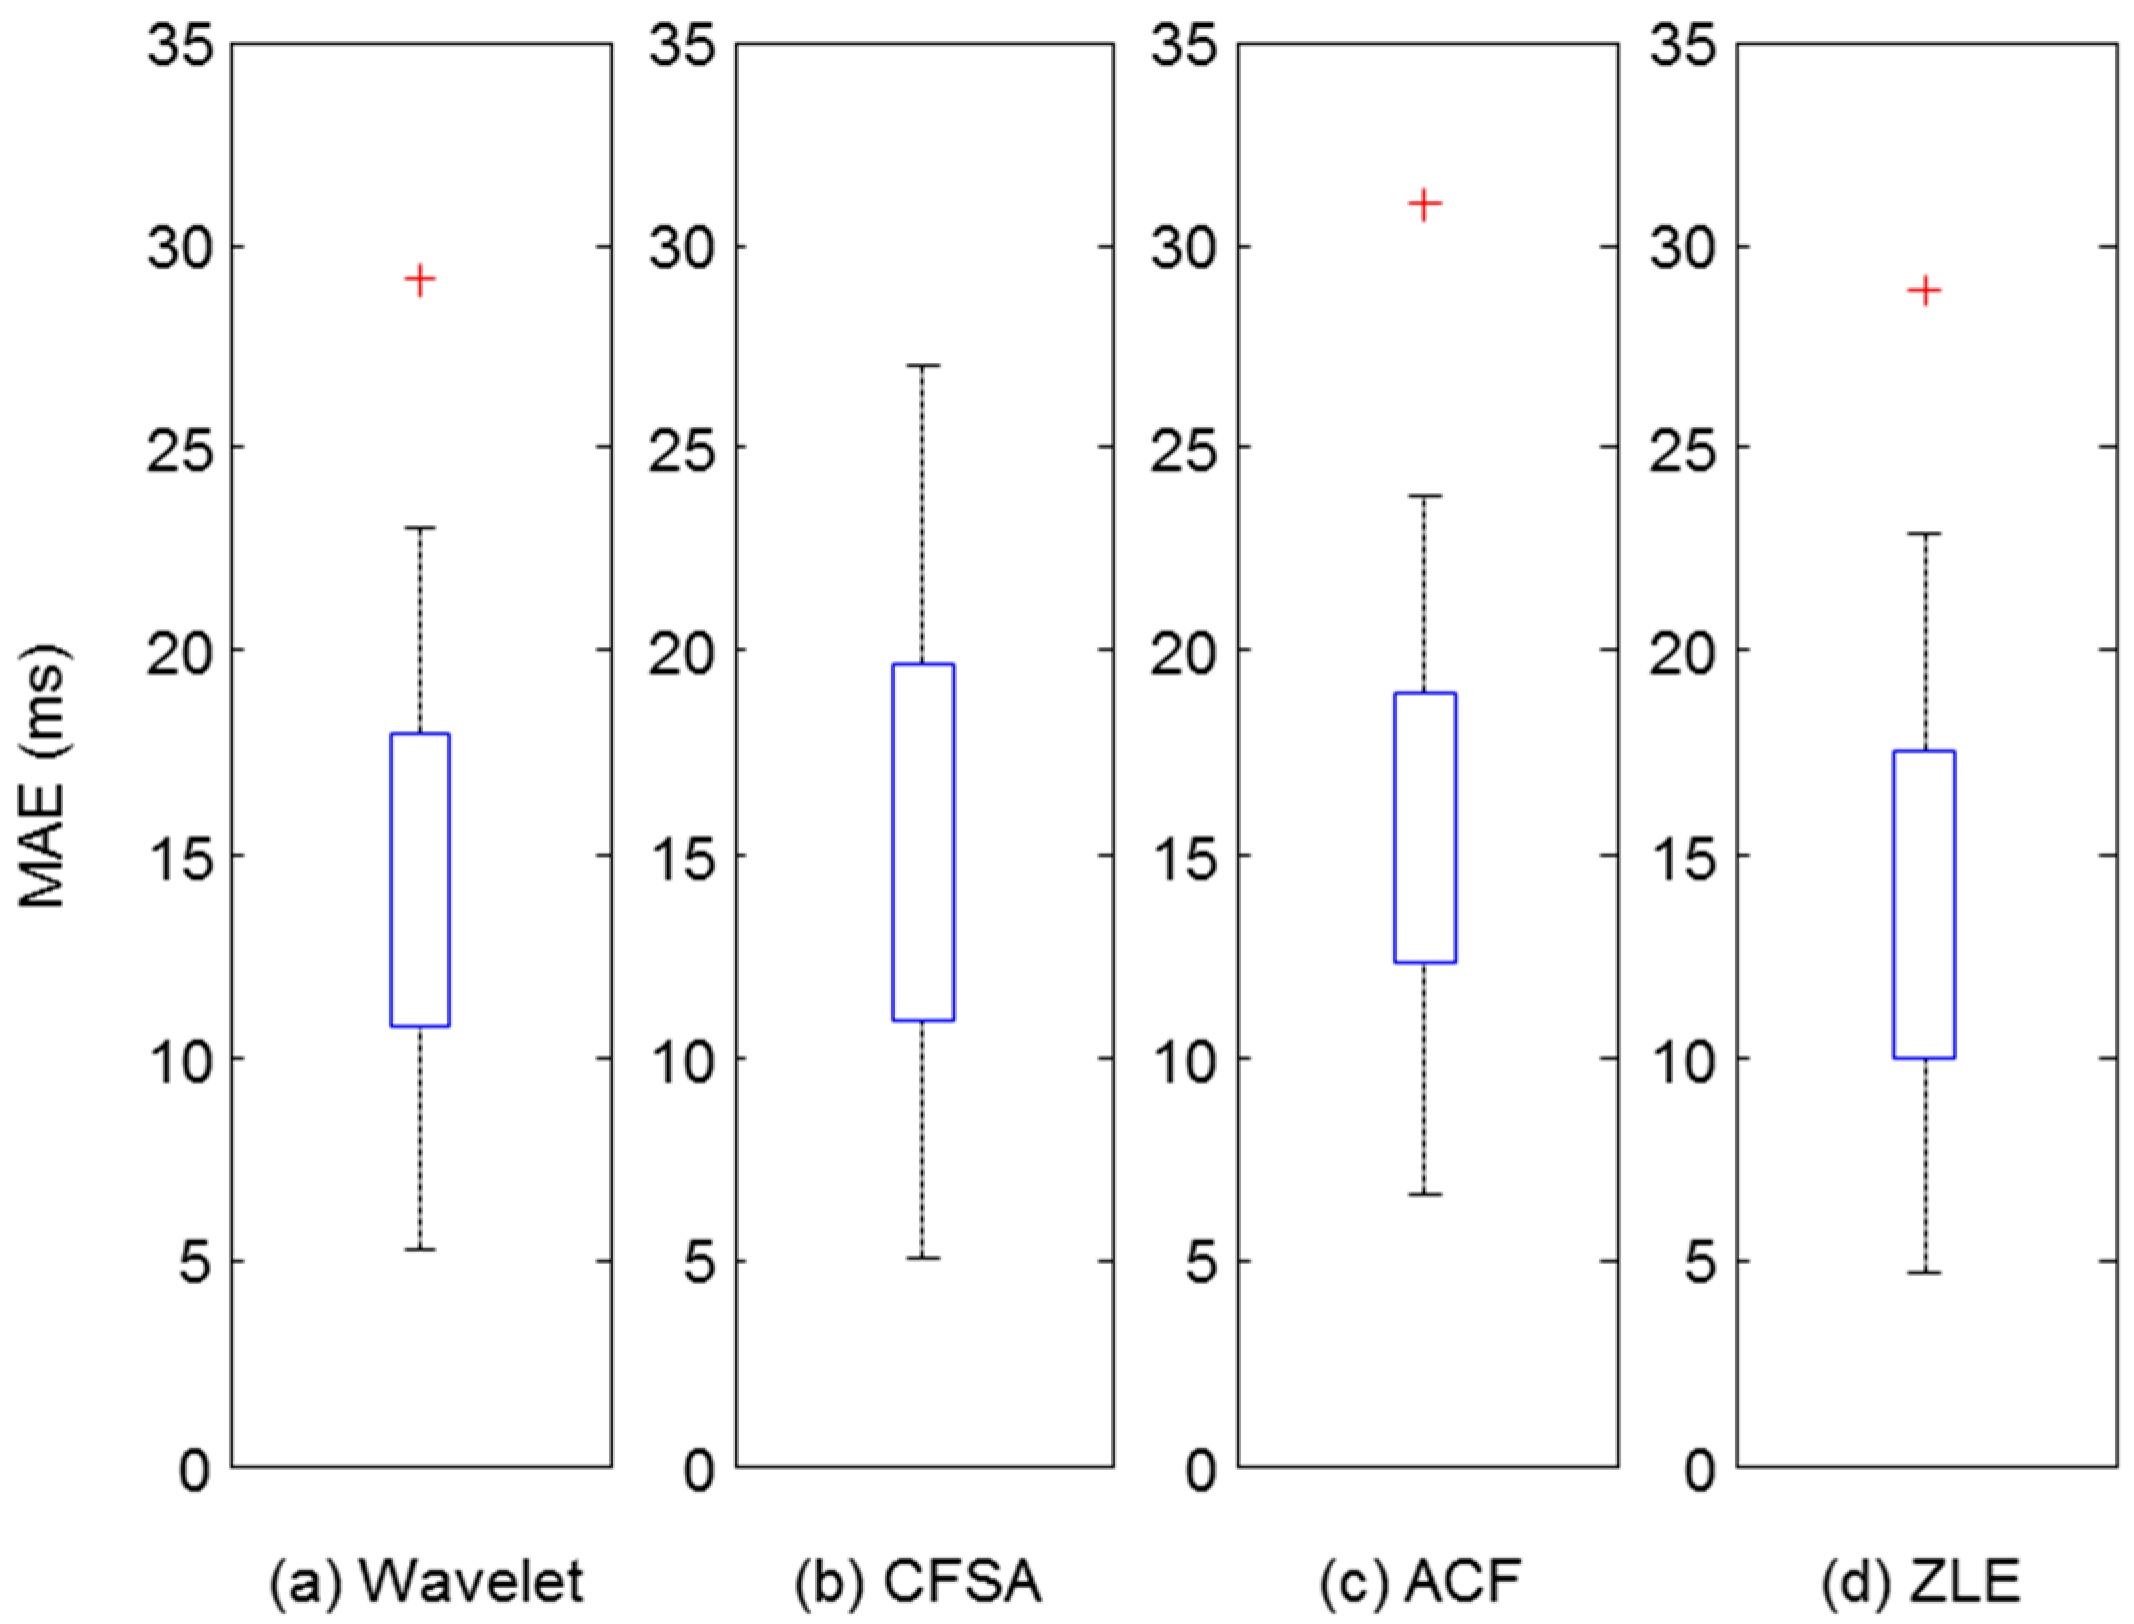
| Wavelet | CFSA | ACF | ZLE | |
|---|---|---|---|---|
| MAE (ms) | 1.5078 ± 0.5645 | 1.5400 ± 0.5570 | 1.5582 ± 0.5499 | 1.4371 ± 0.5625 |
| Se (%) | 93.1247 ± 7.2786 | 91.5446 ± 8.1233 | 89.8683 ± 8.7489 | 96.2713 ± 4.4469 |
| PPV (%) | 93.8799 ± 6.5653 | 93.6469 ± 6.3911 | 91.8527 ± 7.7115 | 96.5478 ± 4.1635 |
| F1 (%) | 93.4971 ± 6.9150 | 92.5655 ± 7.2395 | 90.8341 ± 8.1817 | 96.4068 ± 4.2807 |
© 2017 by the authors. Licensee MDPI, Basel, Switzerland. This article is an open access article distributed under the terms and conditions of the Creative Commons Attribution (CC BY) license (http://creativecommons.org/licenses/by/4.0/).
Share and Cite
Park, C.; Shin, H.; Lee, B. Blockwise PPG Enhancement Based on Time-Variant Zero-Phase Harmonic Notch Filtering. Sensors 2017, 17, 860. https://doi.org/10.3390/s17040860
Park C, Shin H, Lee B. Blockwise PPG Enhancement Based on Time-Variant Zero-Phase Harmonic Notch Filtering. Sensors. 2017; 17(4):860. https://doi.org/10.3390/s17040860
Chicago/Turabian StylePark, Chanki, Hyunsoon Shin, and Boreom Lee. 2017. "Blockwise PPG Enhancement Based on Time-Variant Zero-Phase Harmonic Notch Filtering" Sensors 17, no. 4: 860. https://doi.org/10.3390/s17040860
APA StylePark, C., Shin, H., & Lee, B. (2017). Blockwise PPG Enhancement Based on Time-Variant Zero-Phase Harmonic Notch Filtering. Sensors, 17(4), 860. https://doi.org/10.3390/s17040860