
Preliminary Study for Designing a Novel Vein-Visualizing Device


Abstract
:1. Introduction
2. Methods
2.1. Methods for Equipment
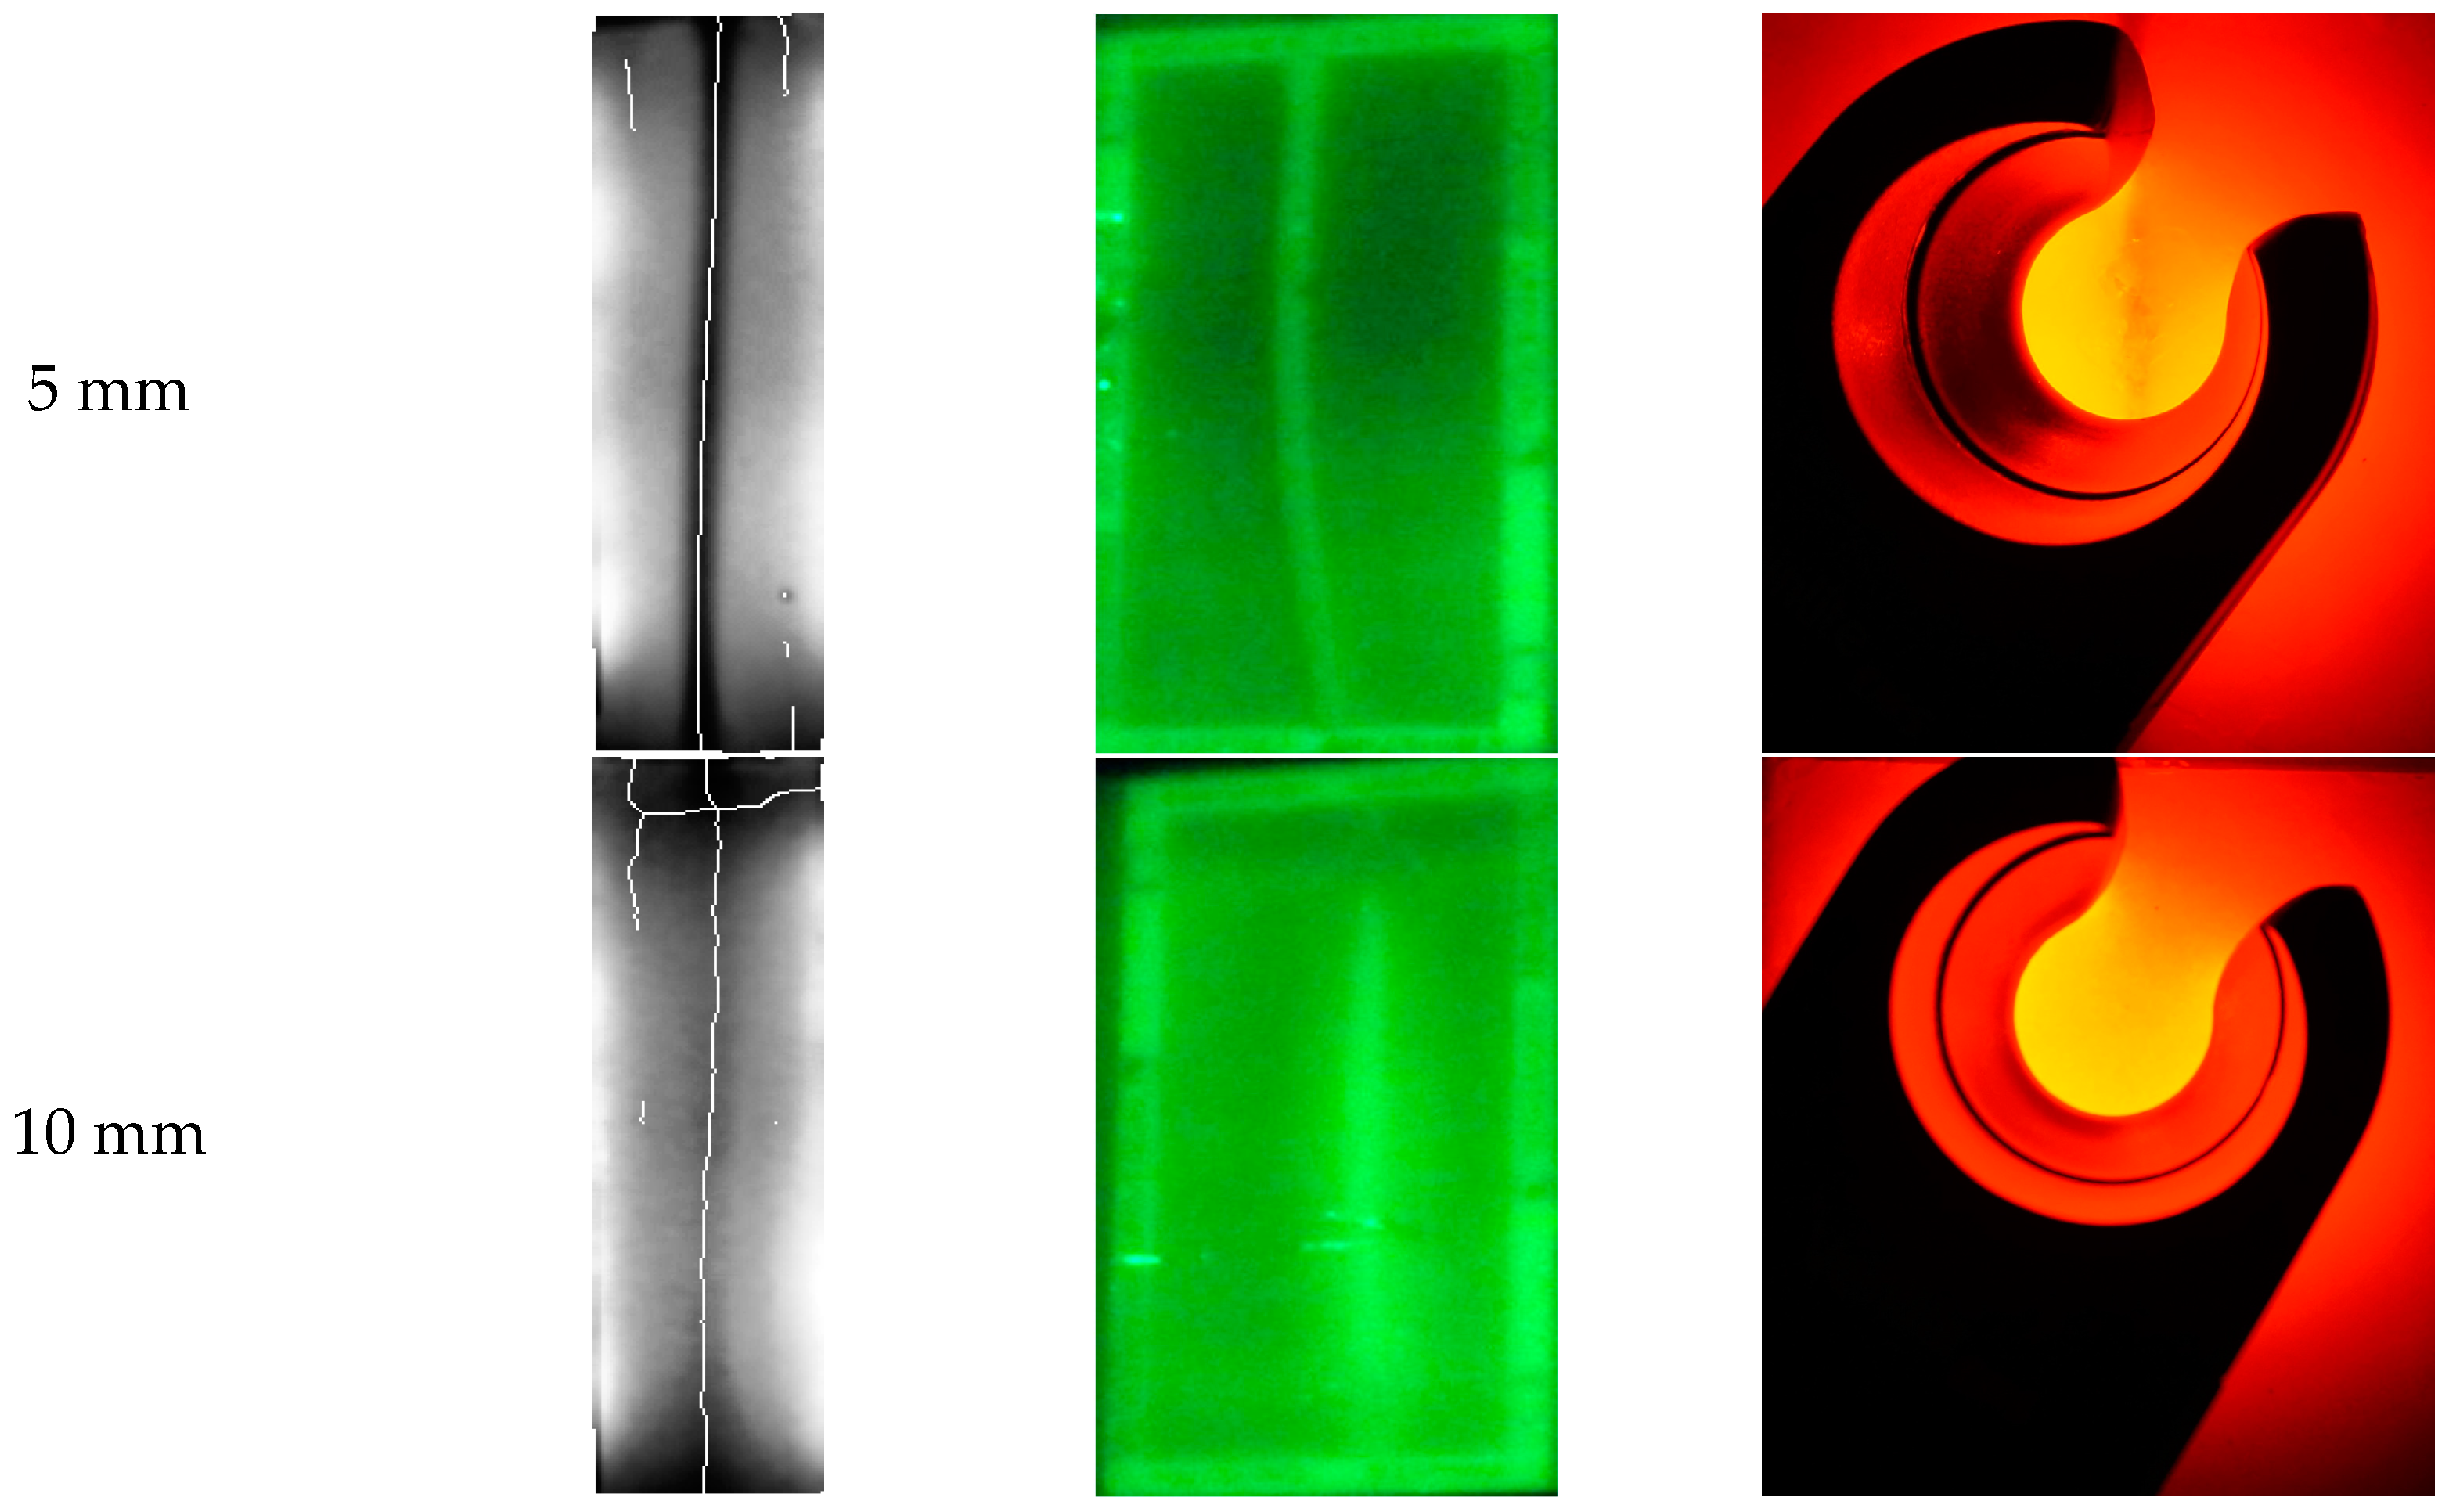
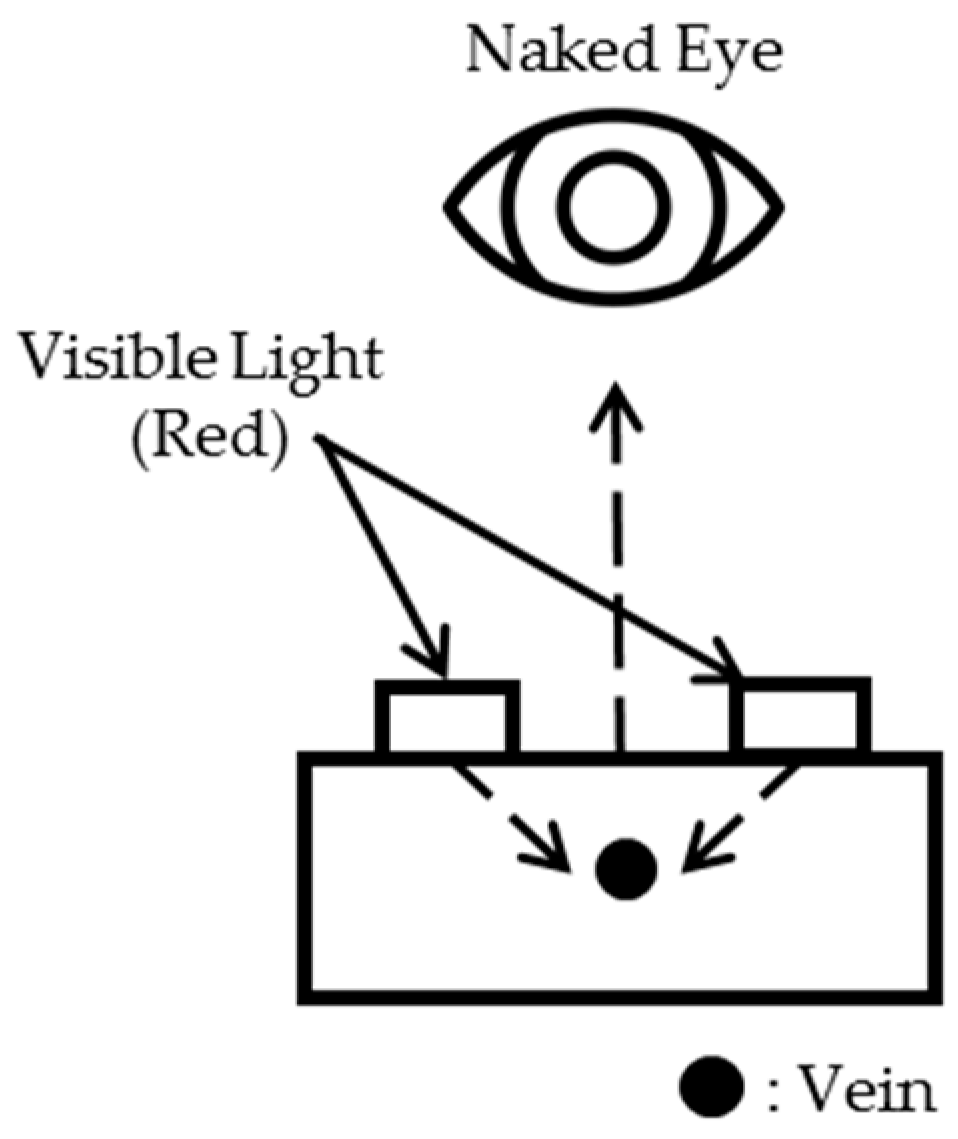
2.1.1. Limitation of the Reflection Method
2.1.2. Limitation of the Existing Penetration Method
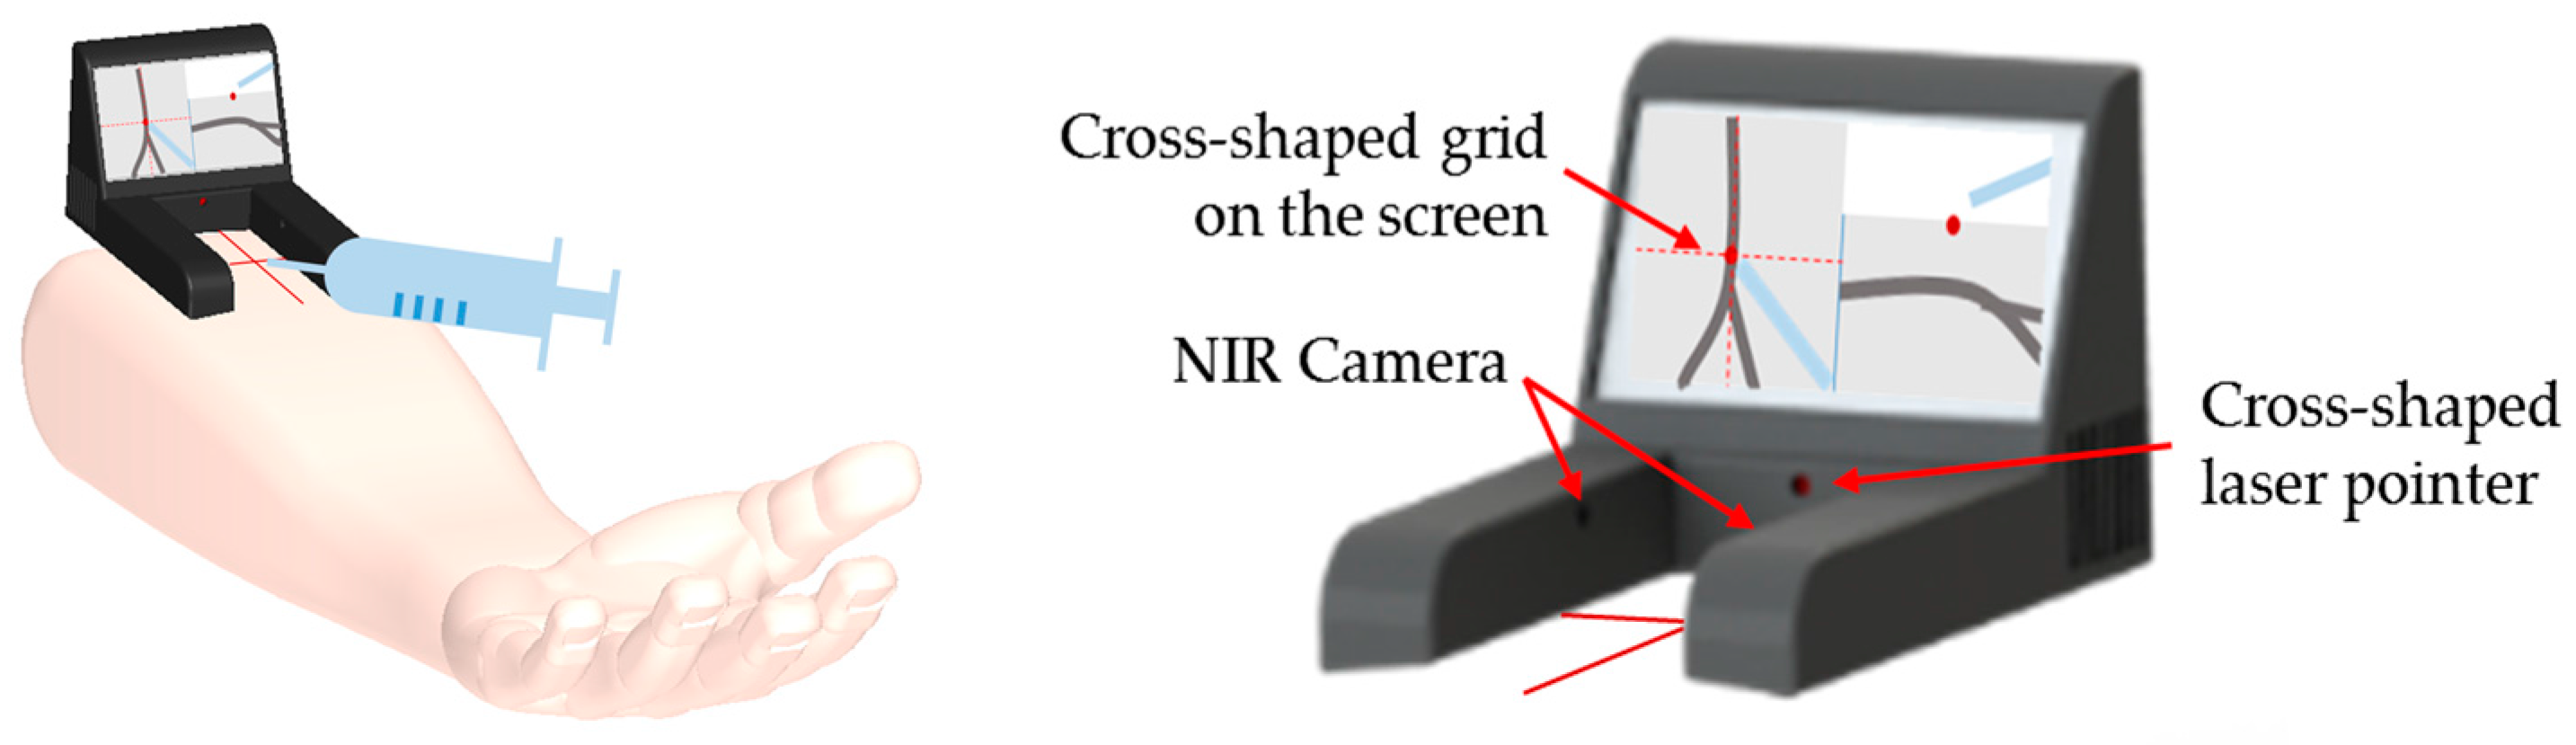
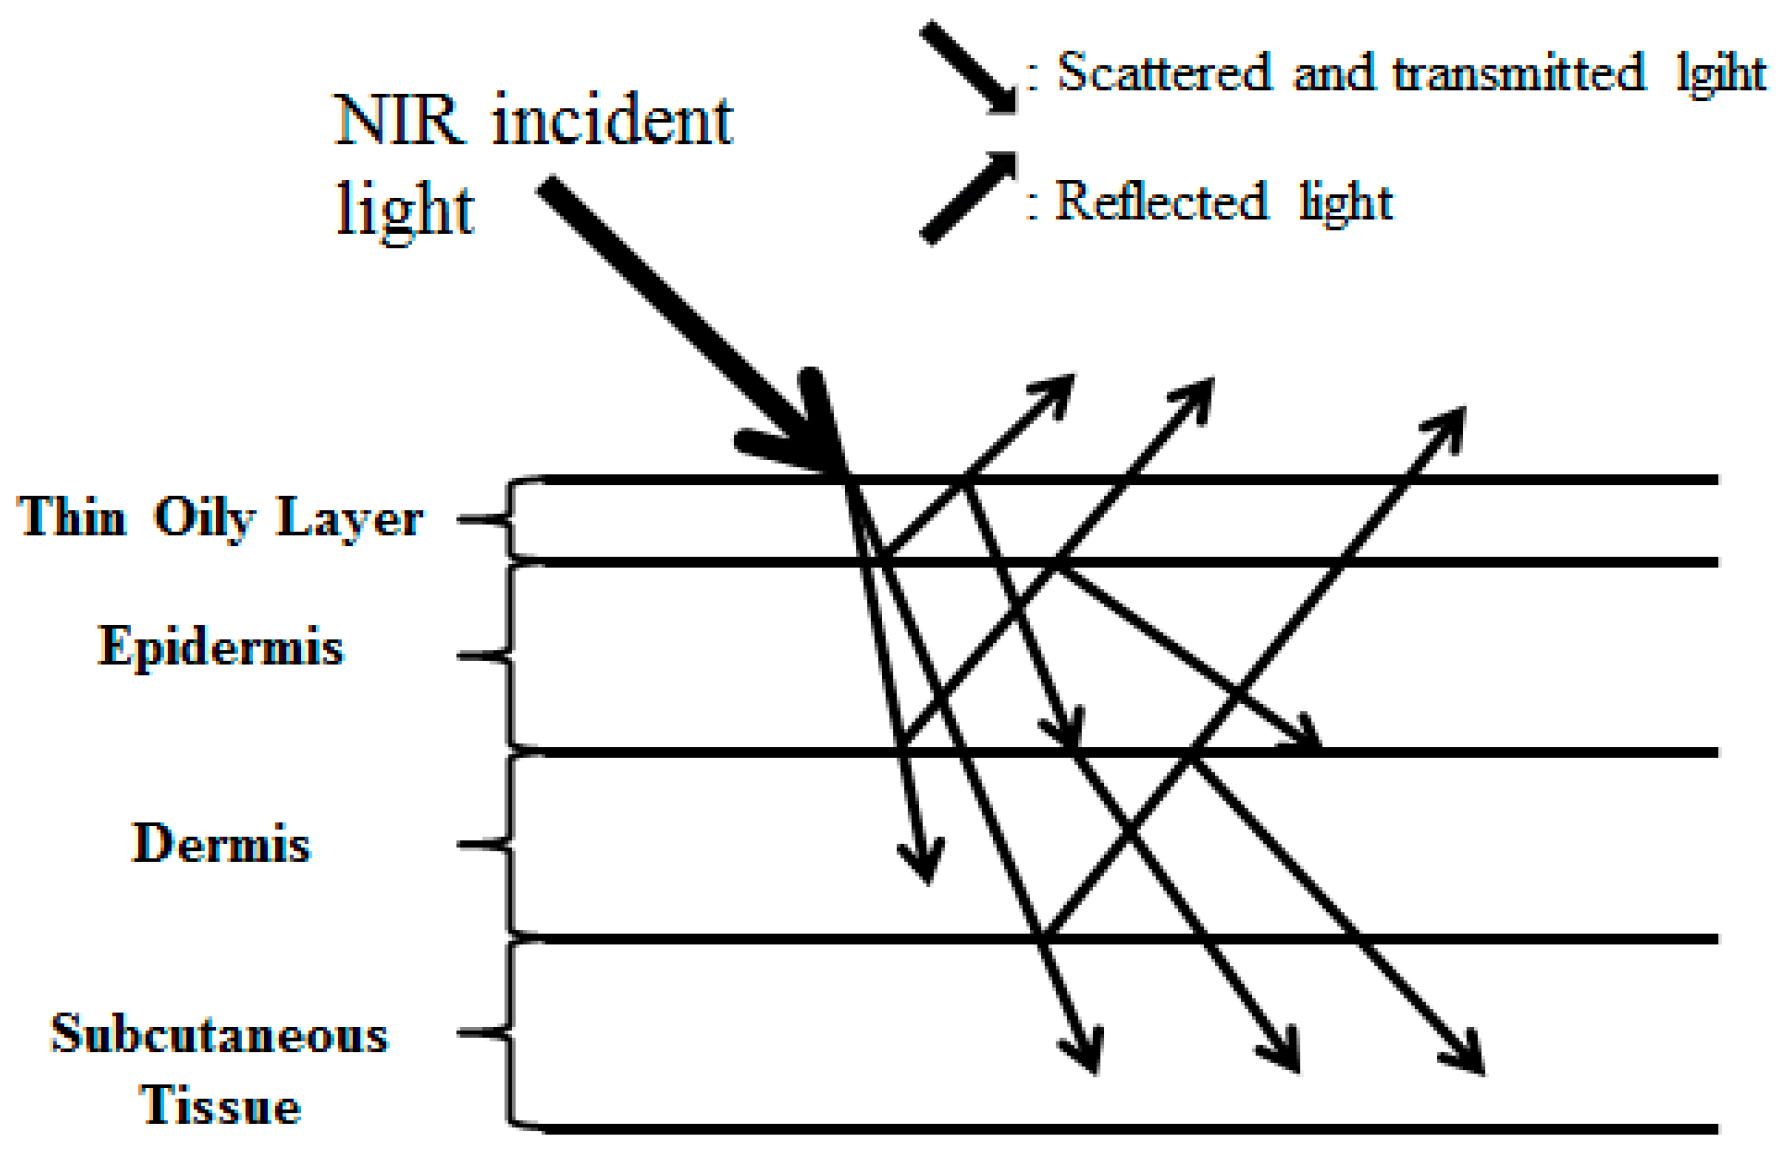
2.1.3. Working Principle of the NIR Module
2.1.4. Development of New NIR Diode Module
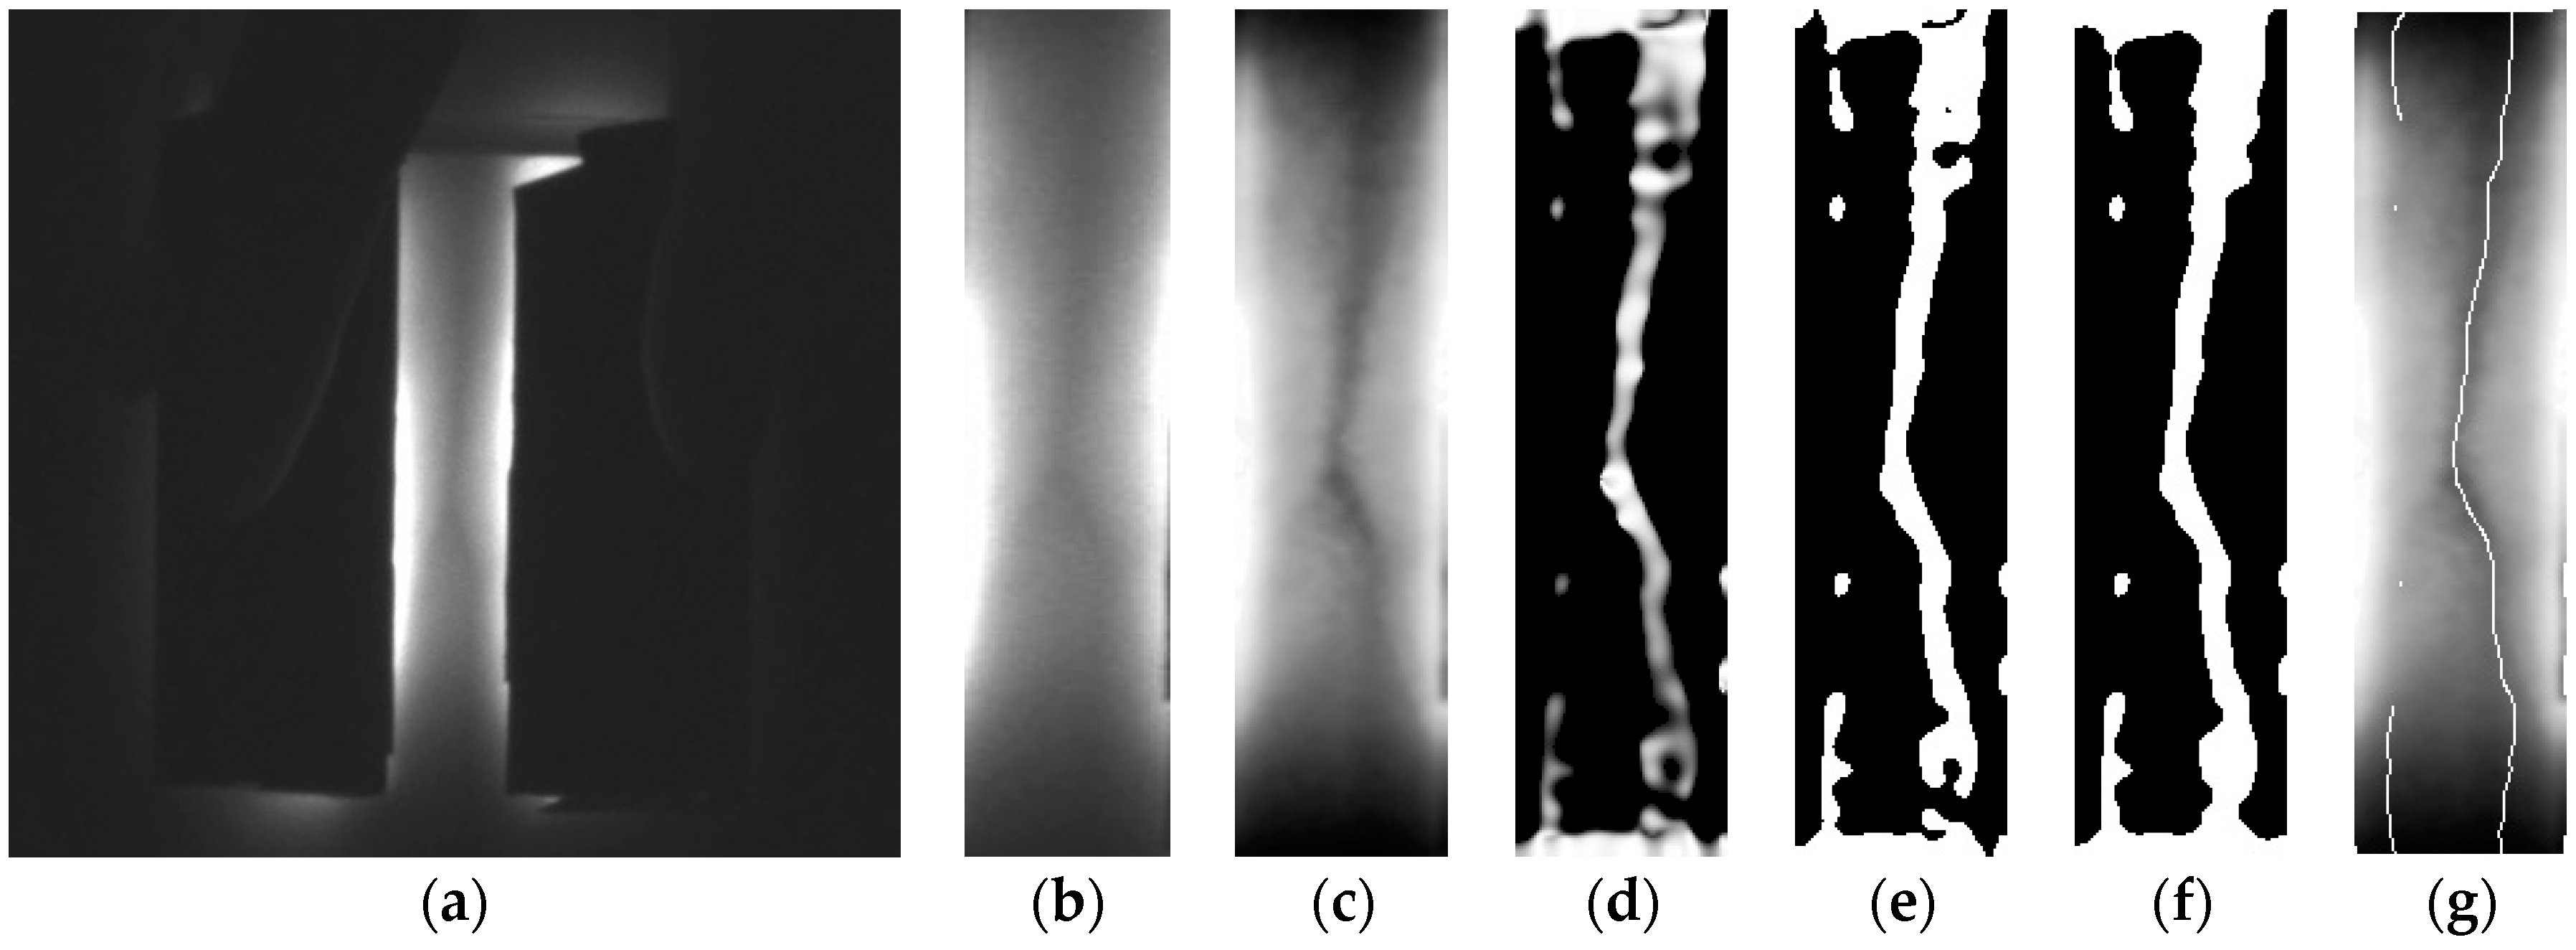
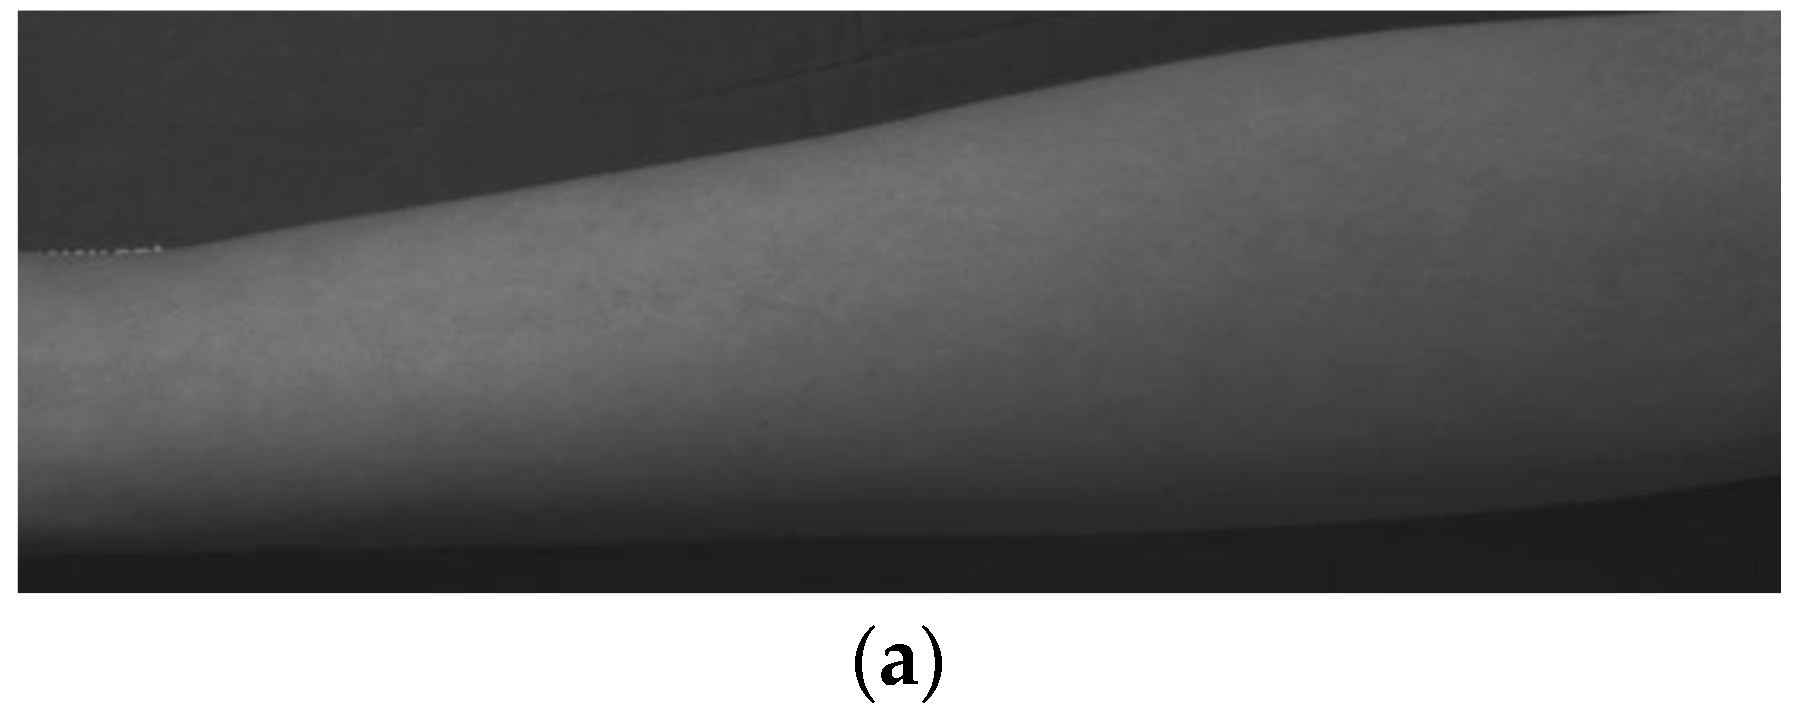
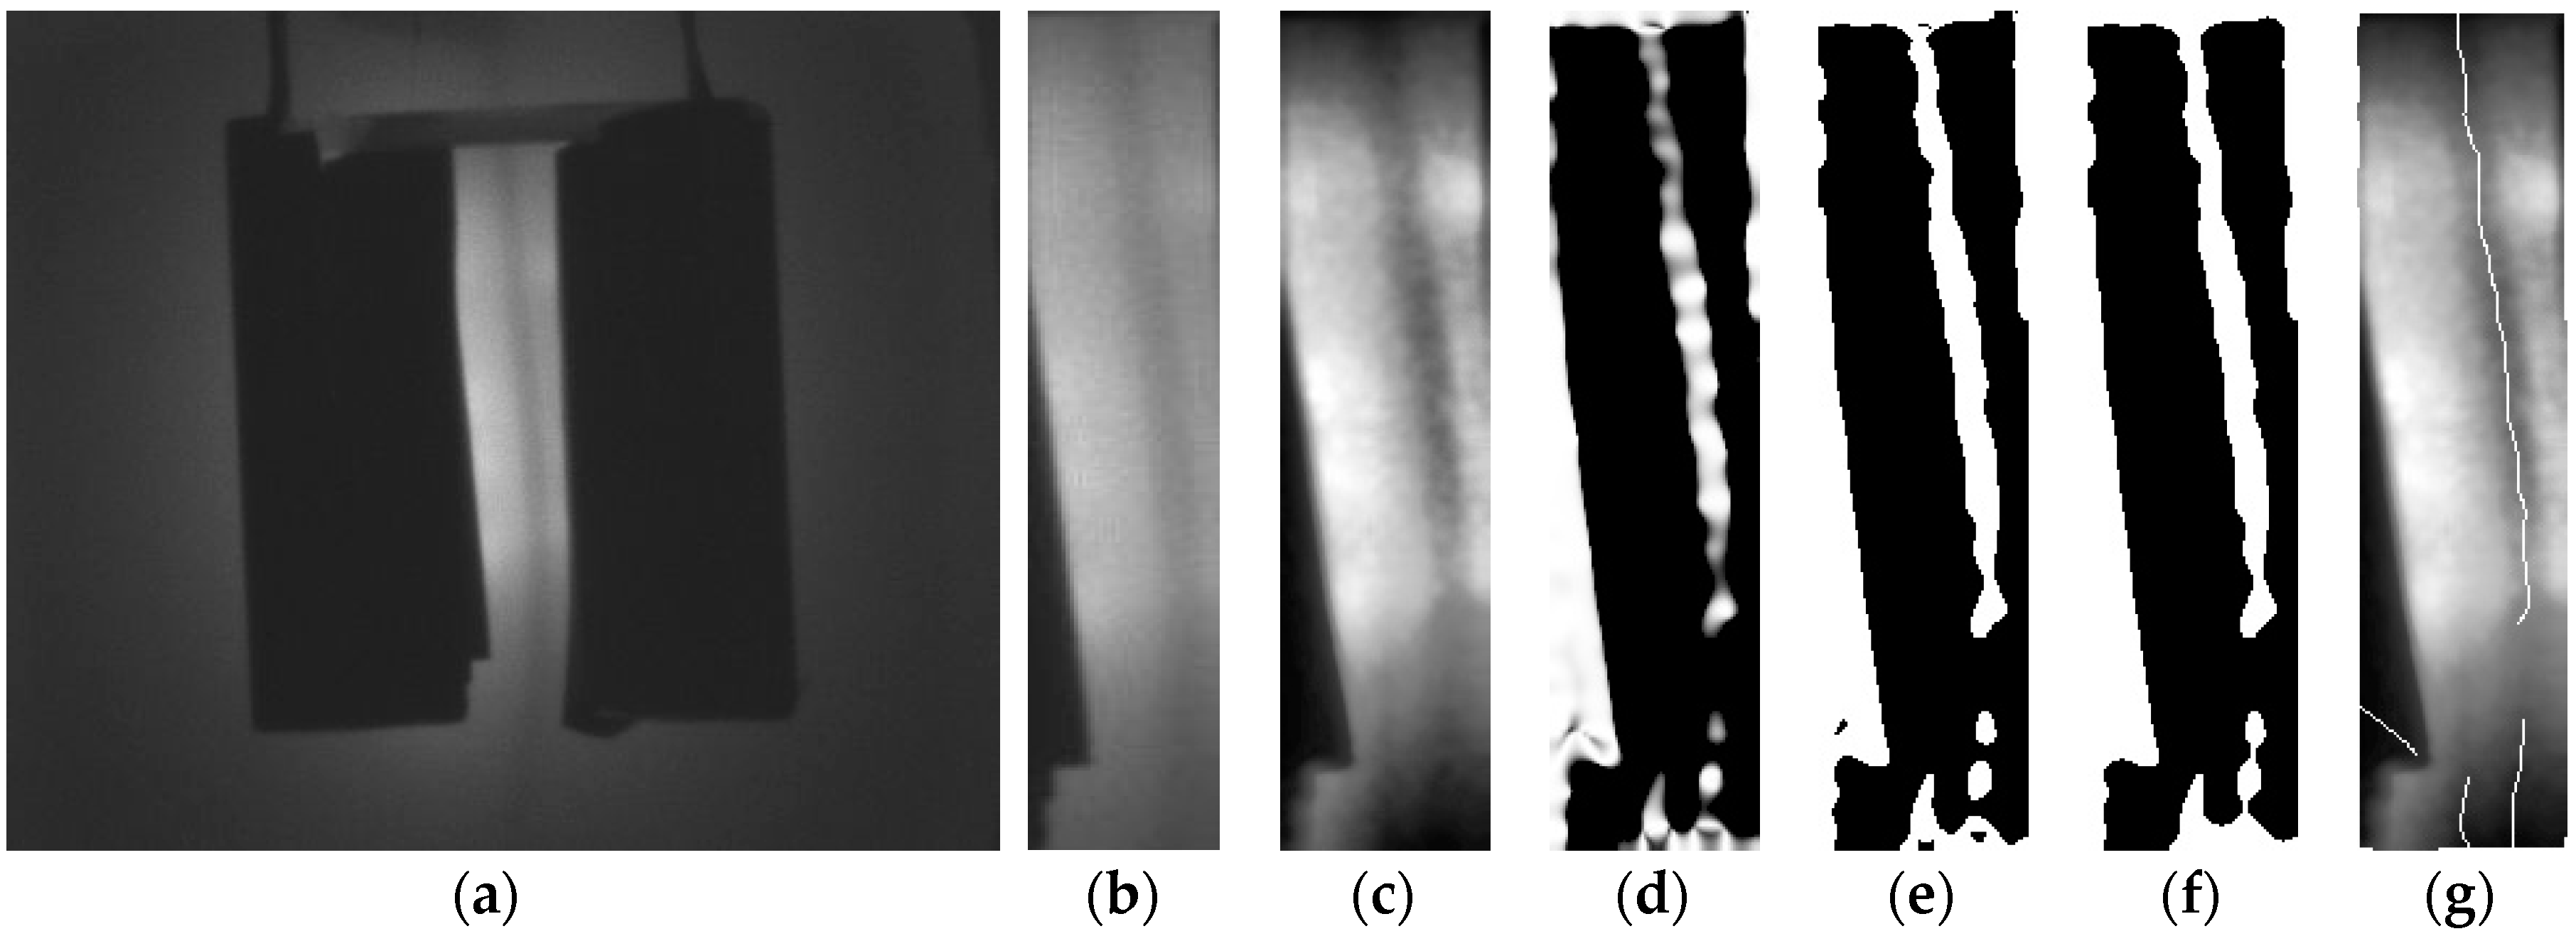
2.2. Methods for Image Processing
2.2.1. Setting the ROI
2.2.2. Complex Histogram Equalization
2.2.3. Vein Structure Enhancement Method Using 2D Line Filter
2.2.4. Segmentation Using Adaptive Thresholding and Morphology-Closing
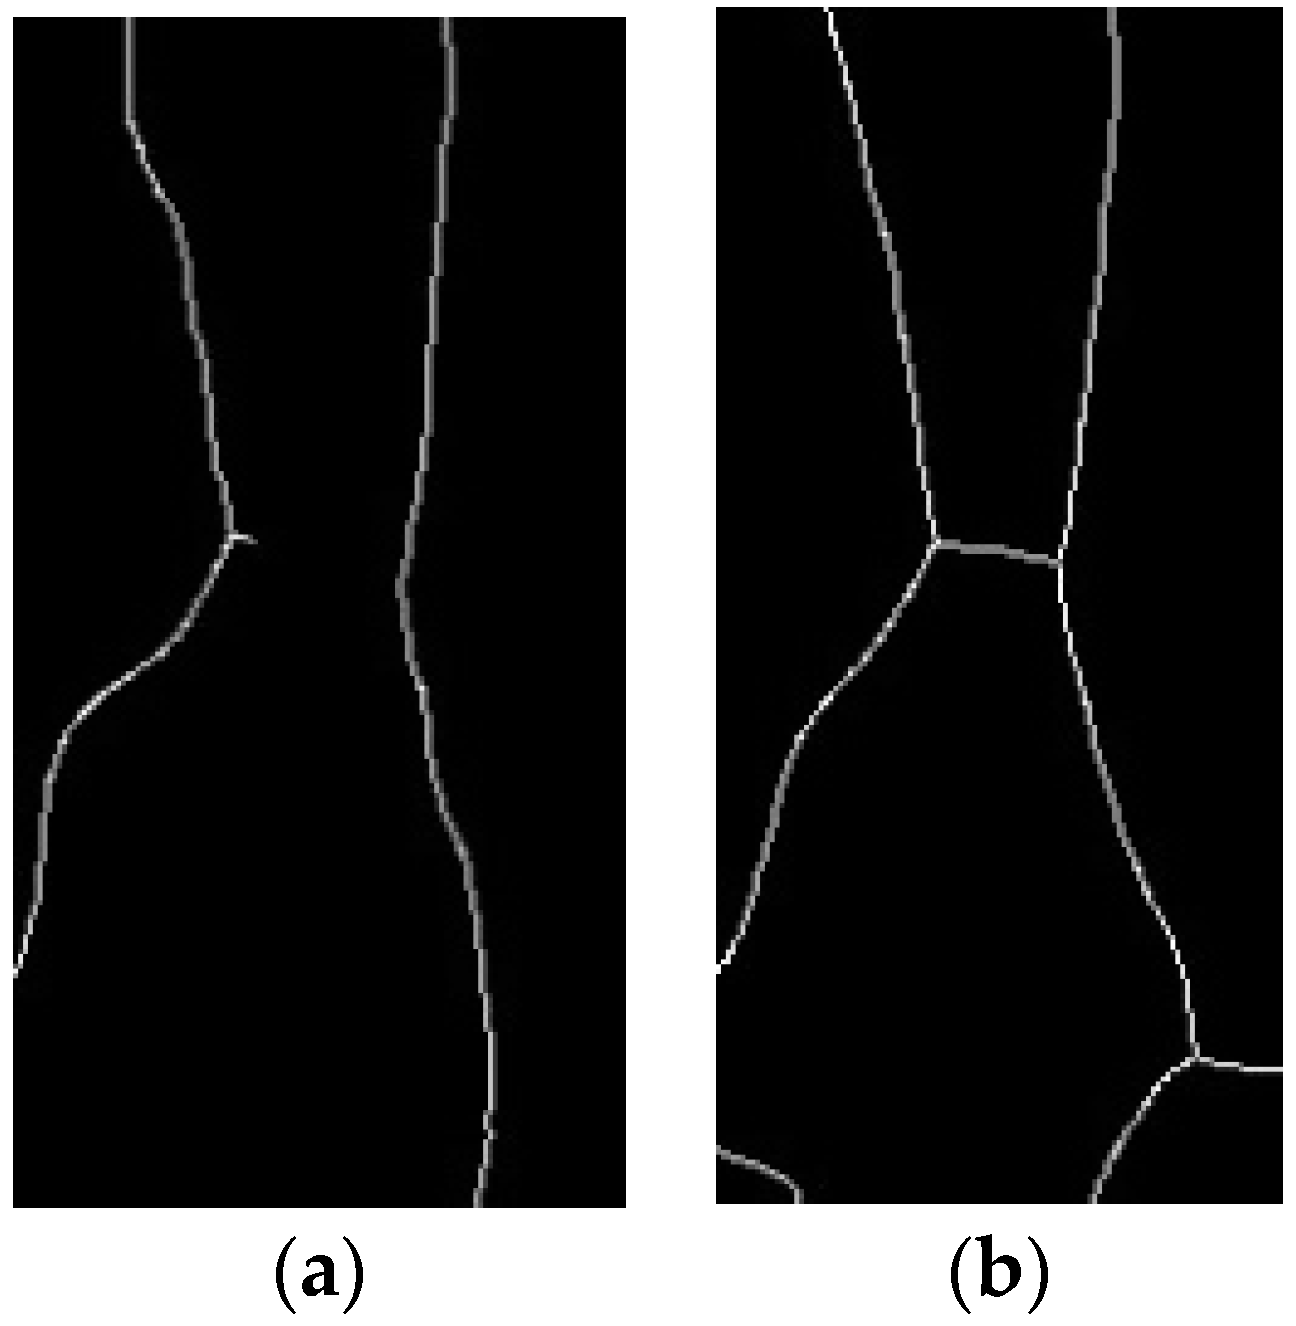
2.2.5. Skeletonizing the Vein Structure
3. Experimental Results and Analysis
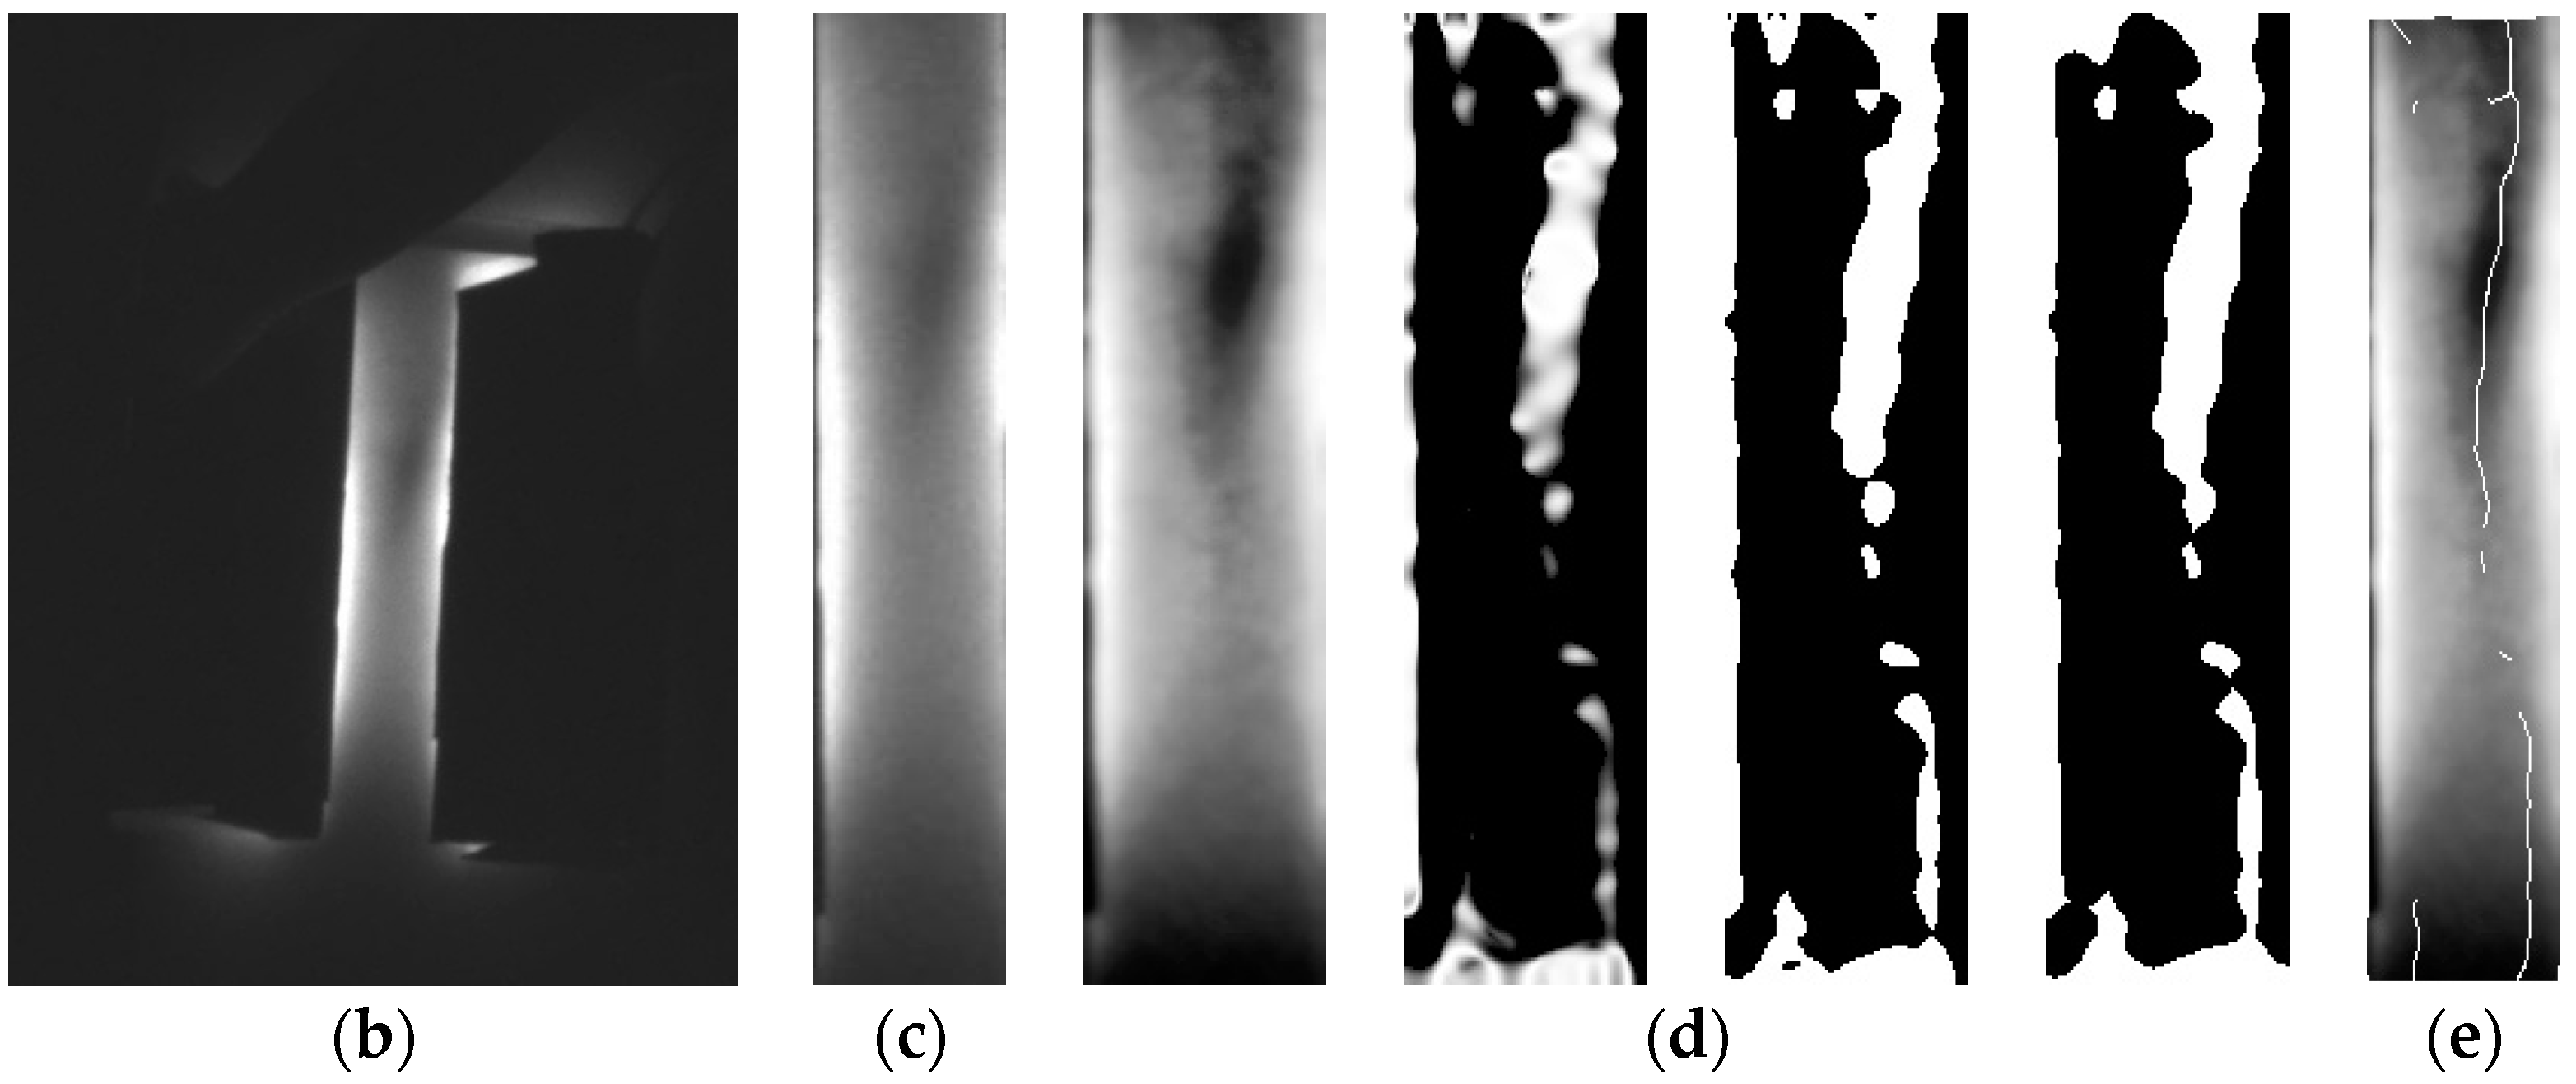
3.1. Phantom Study
3.1.1. Composition of the Tissue Phantom
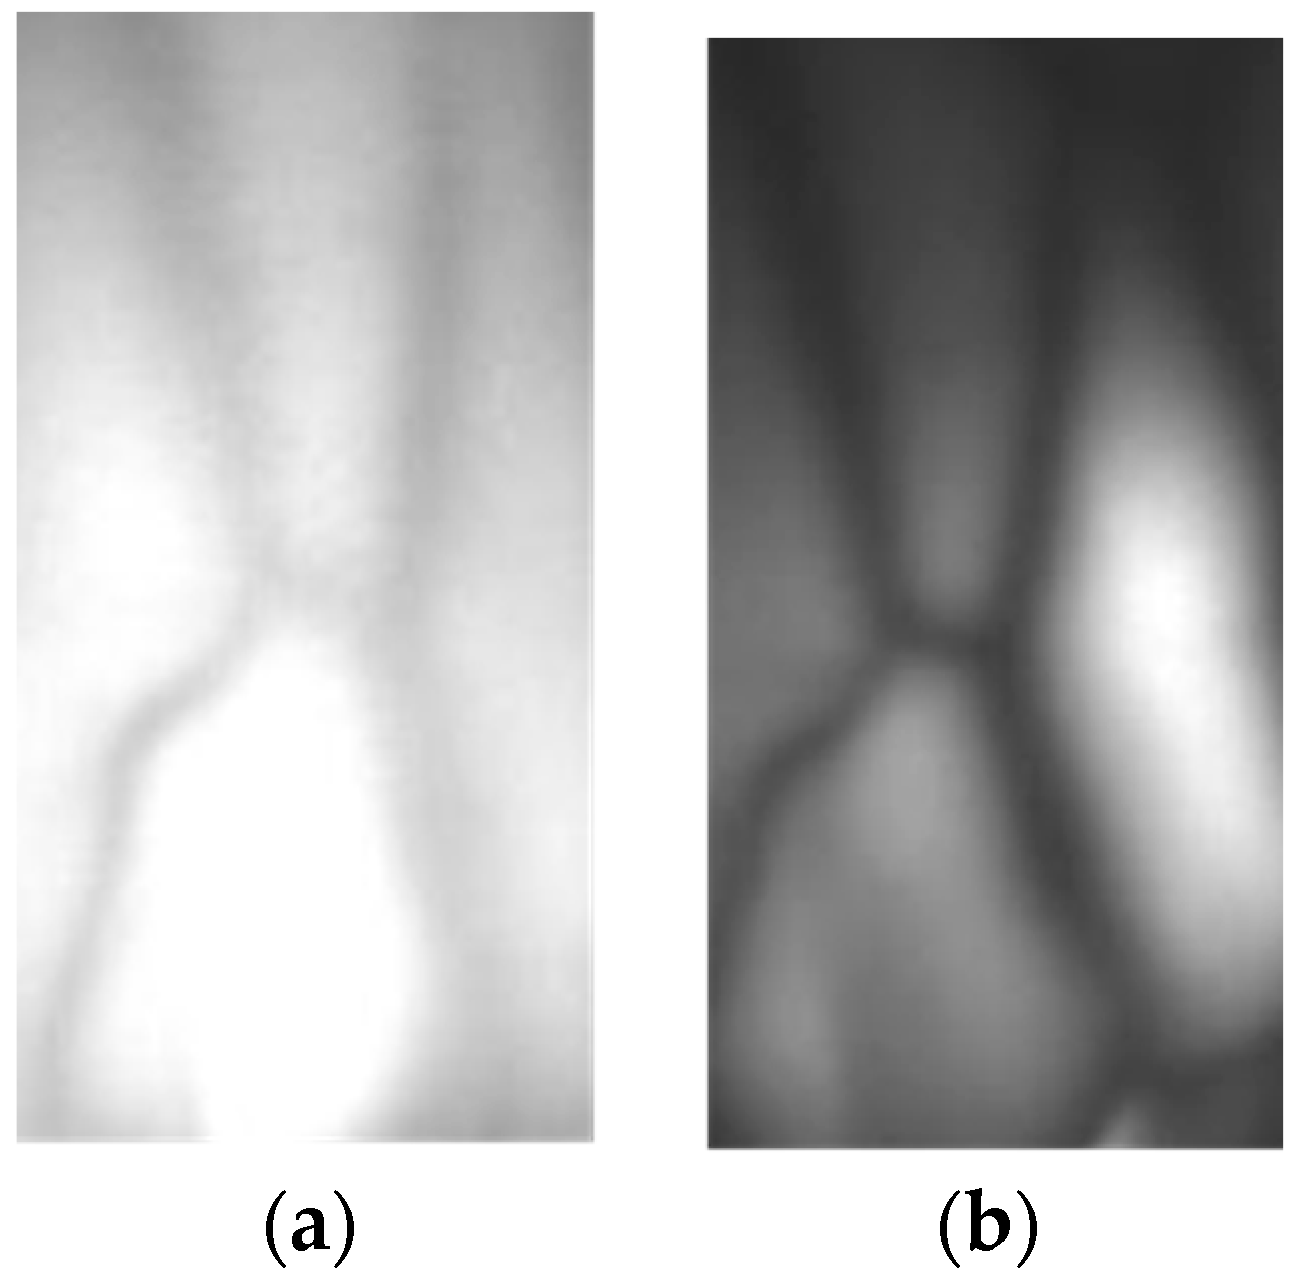
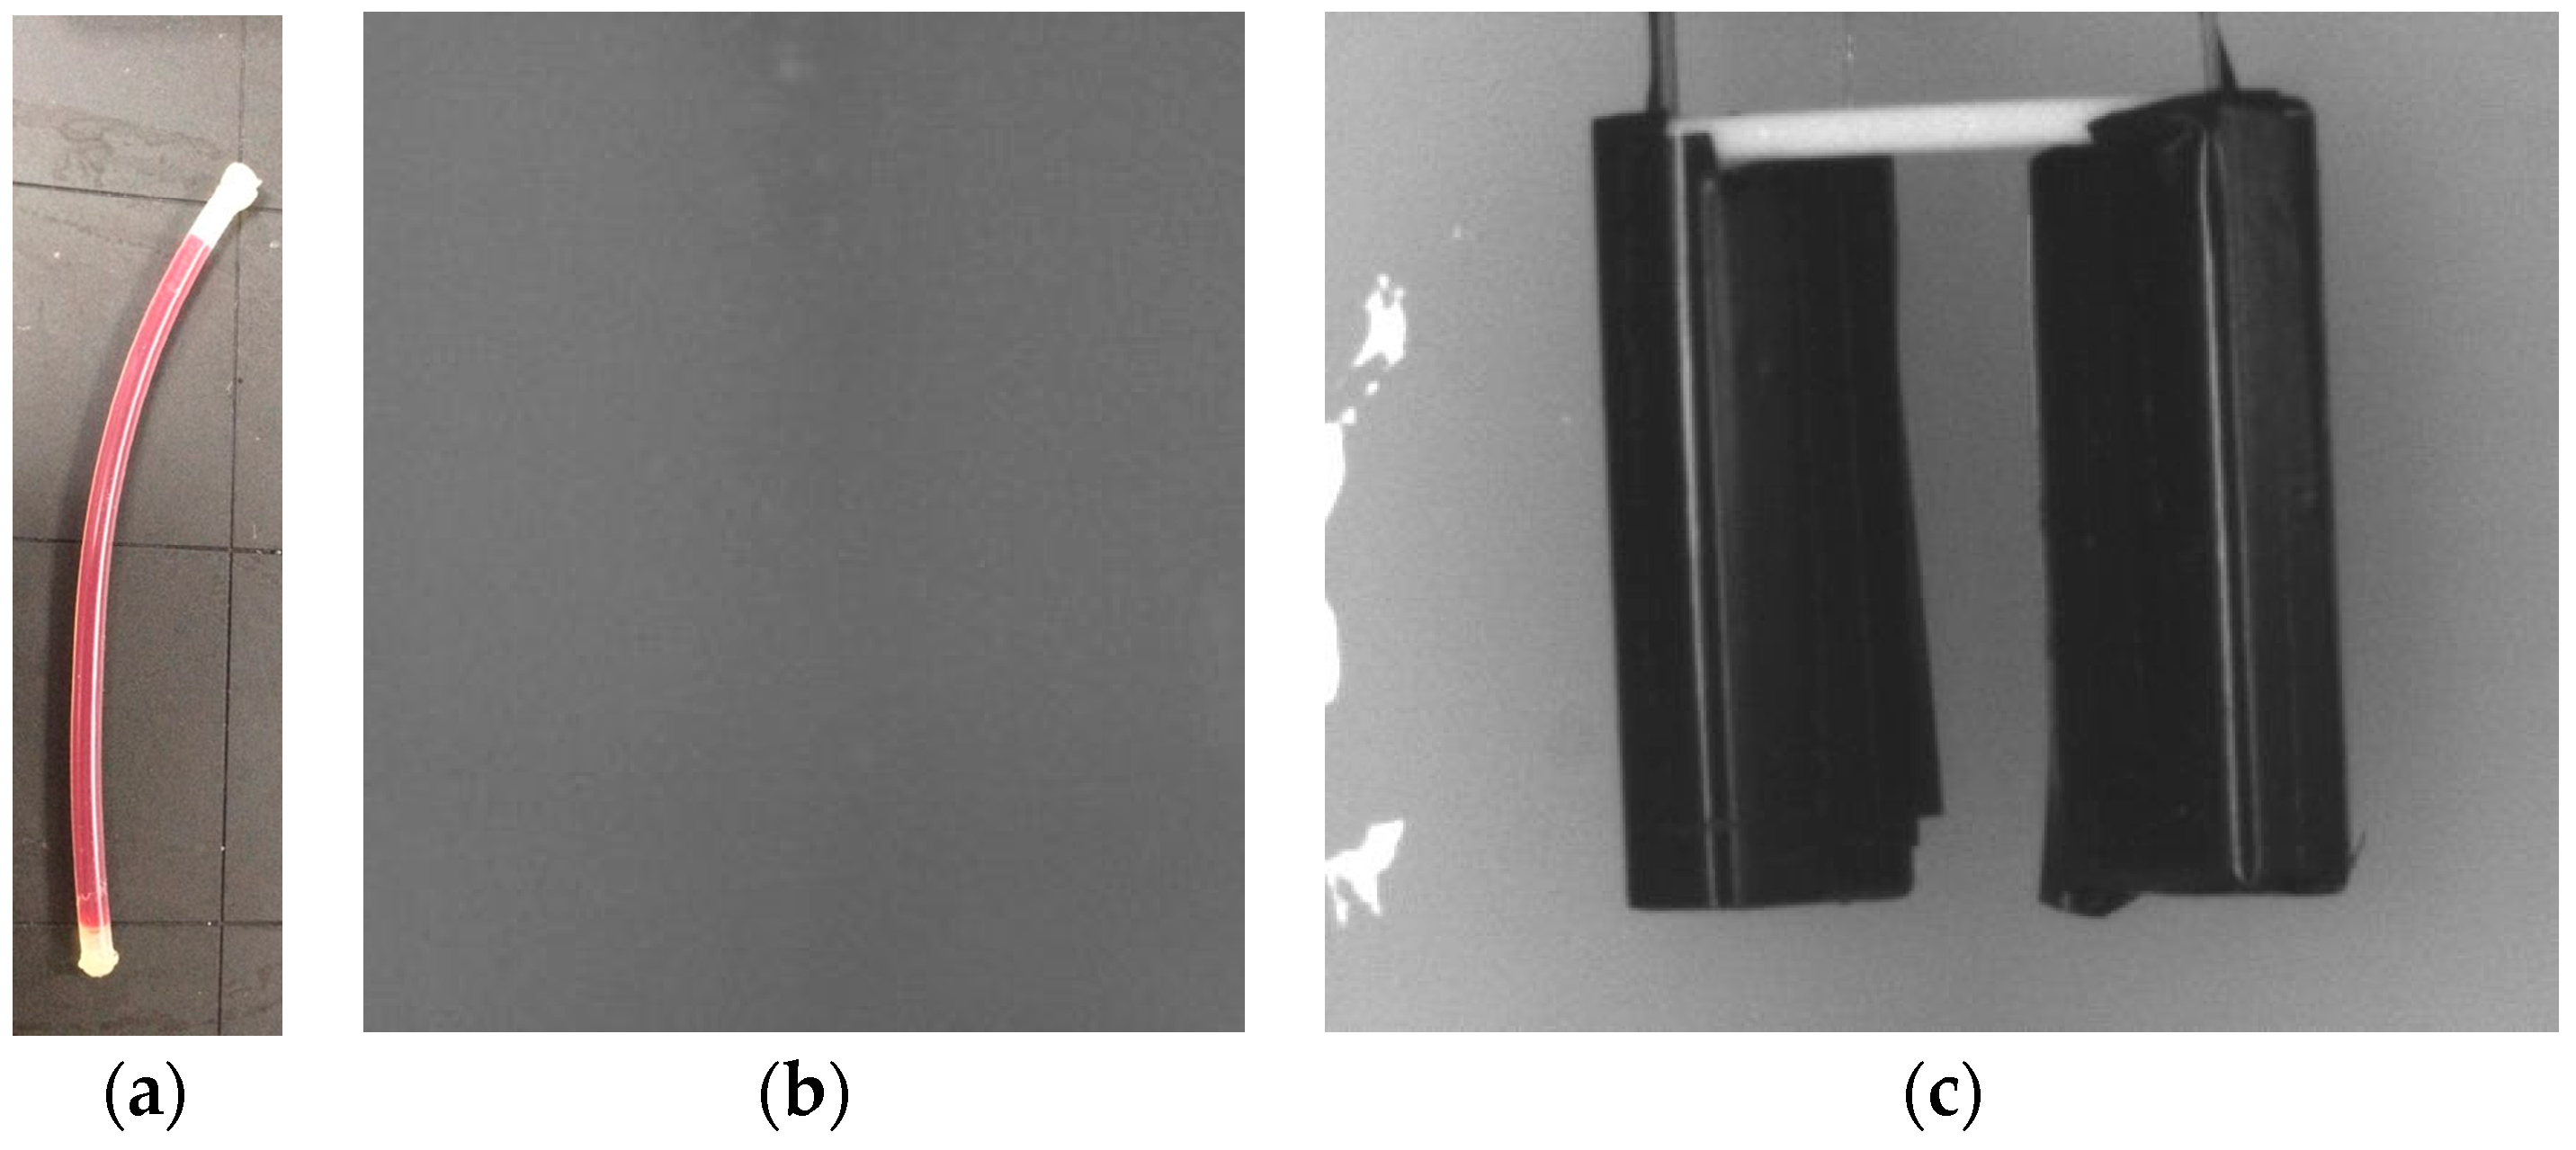
3.1.2. Comparison of Detached and Attached Penetration Modes
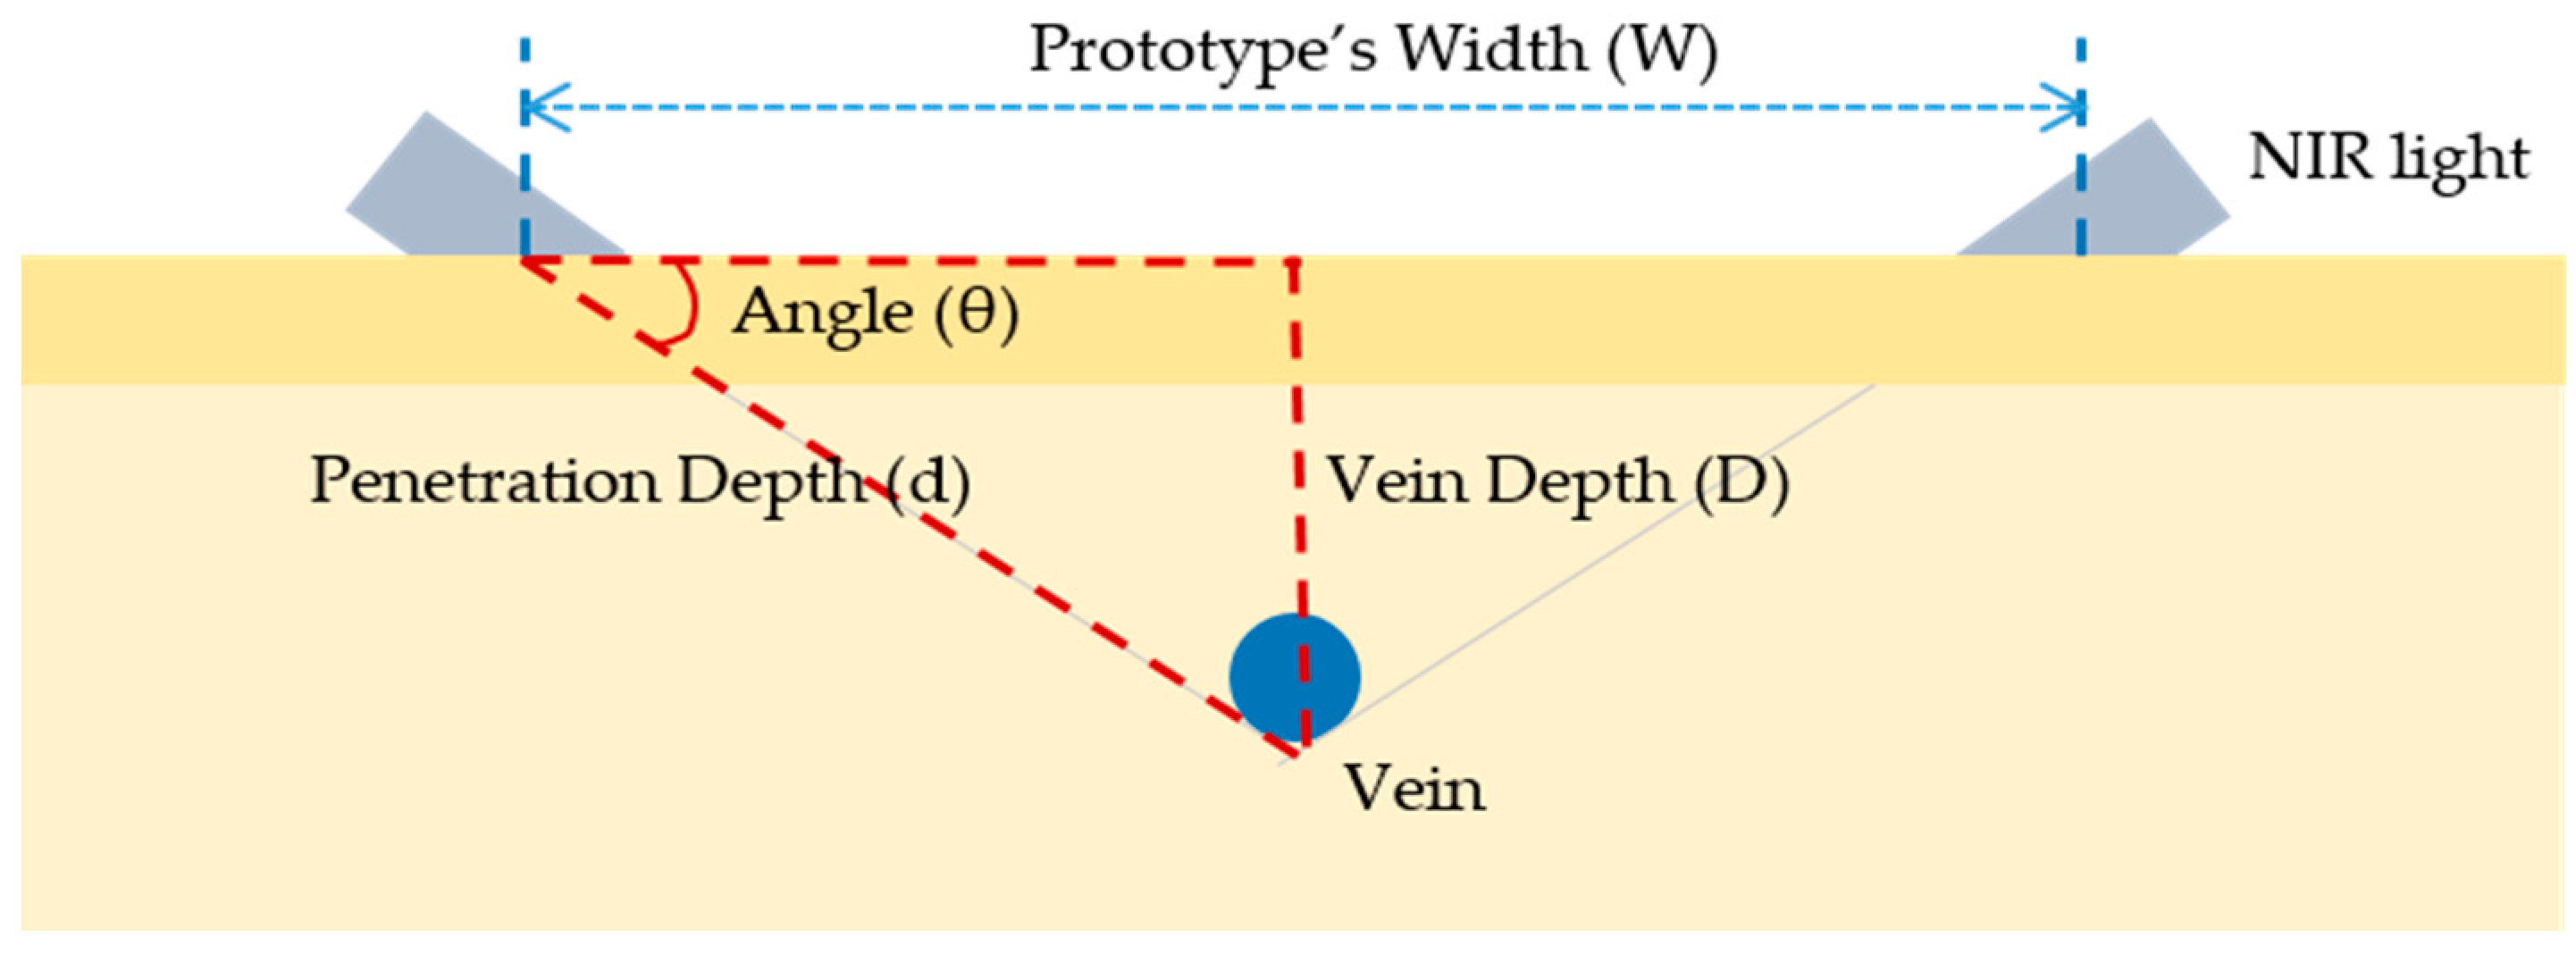
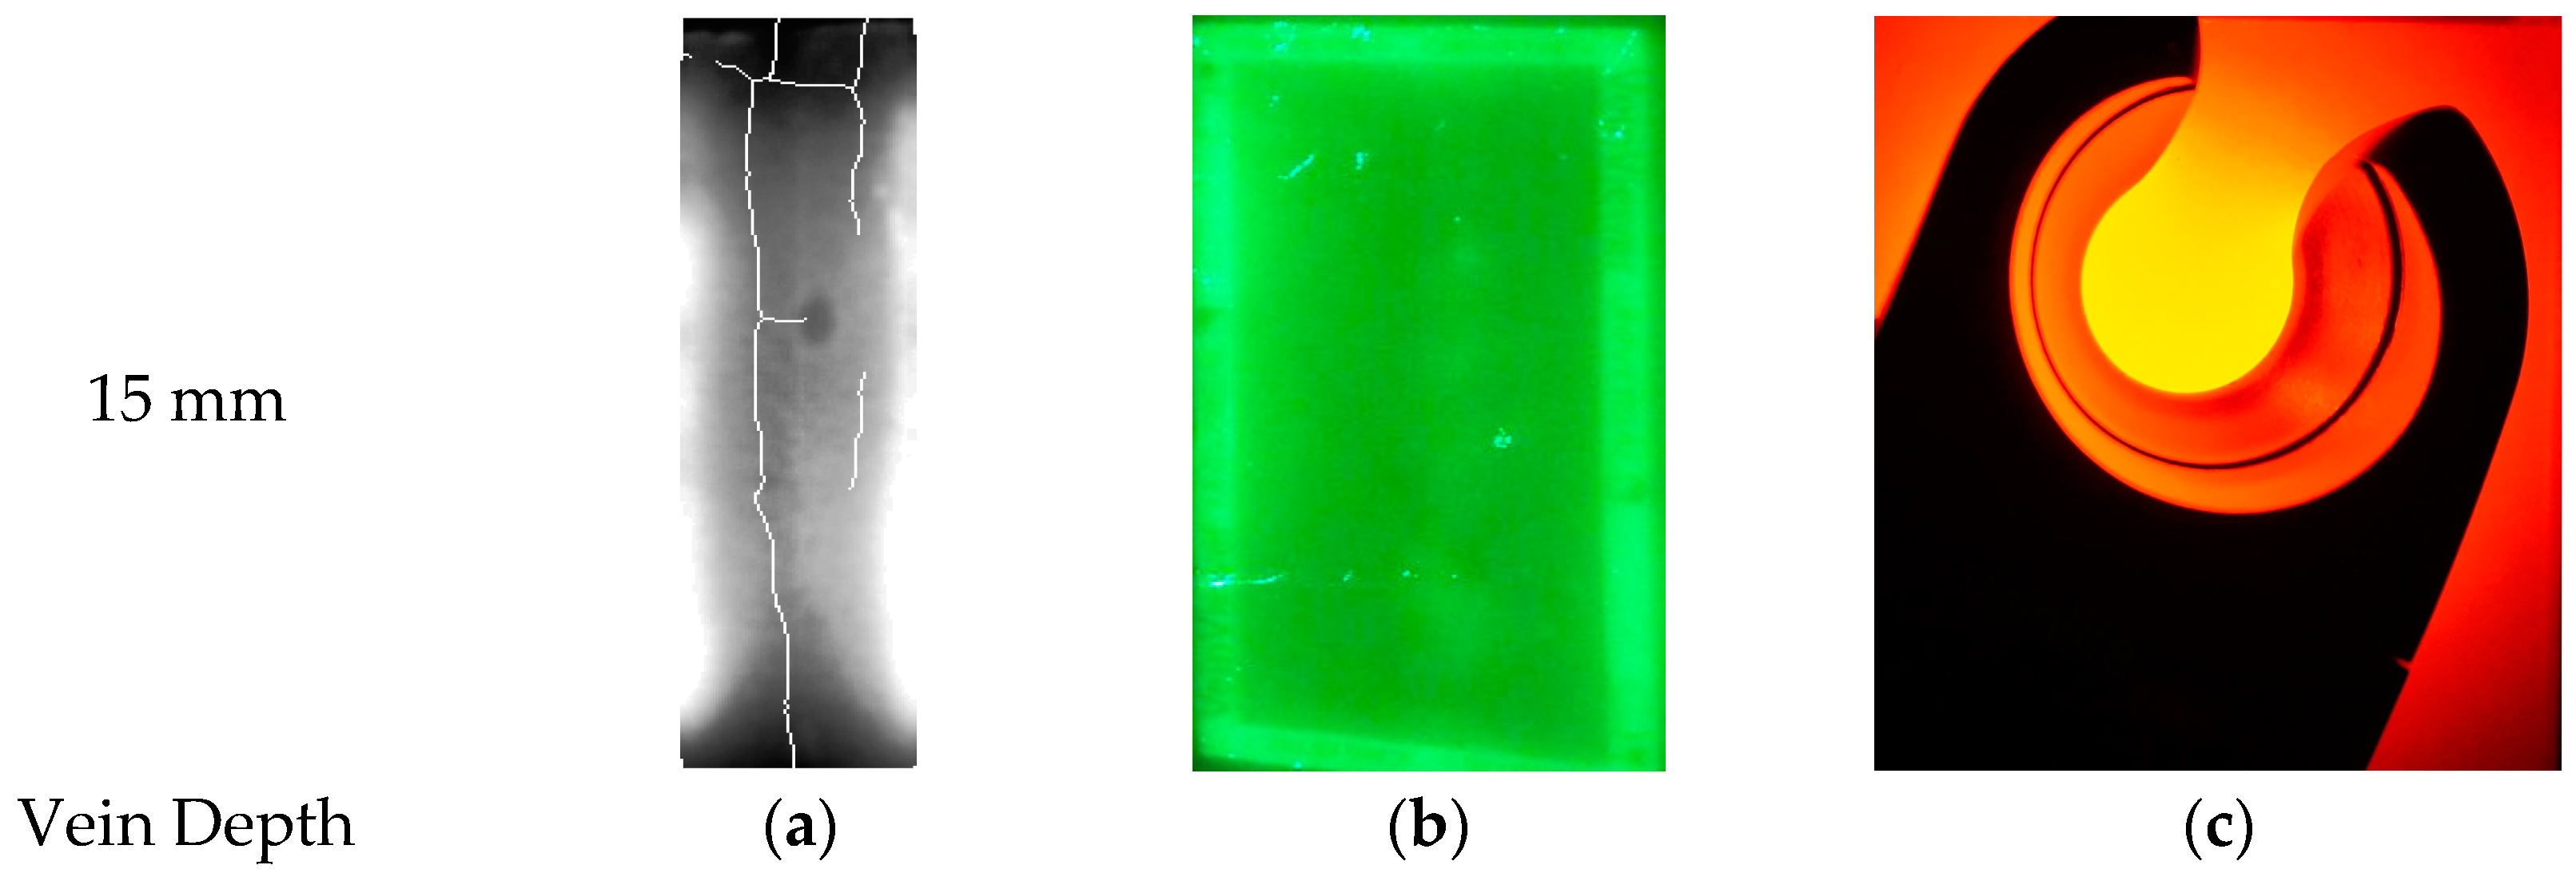
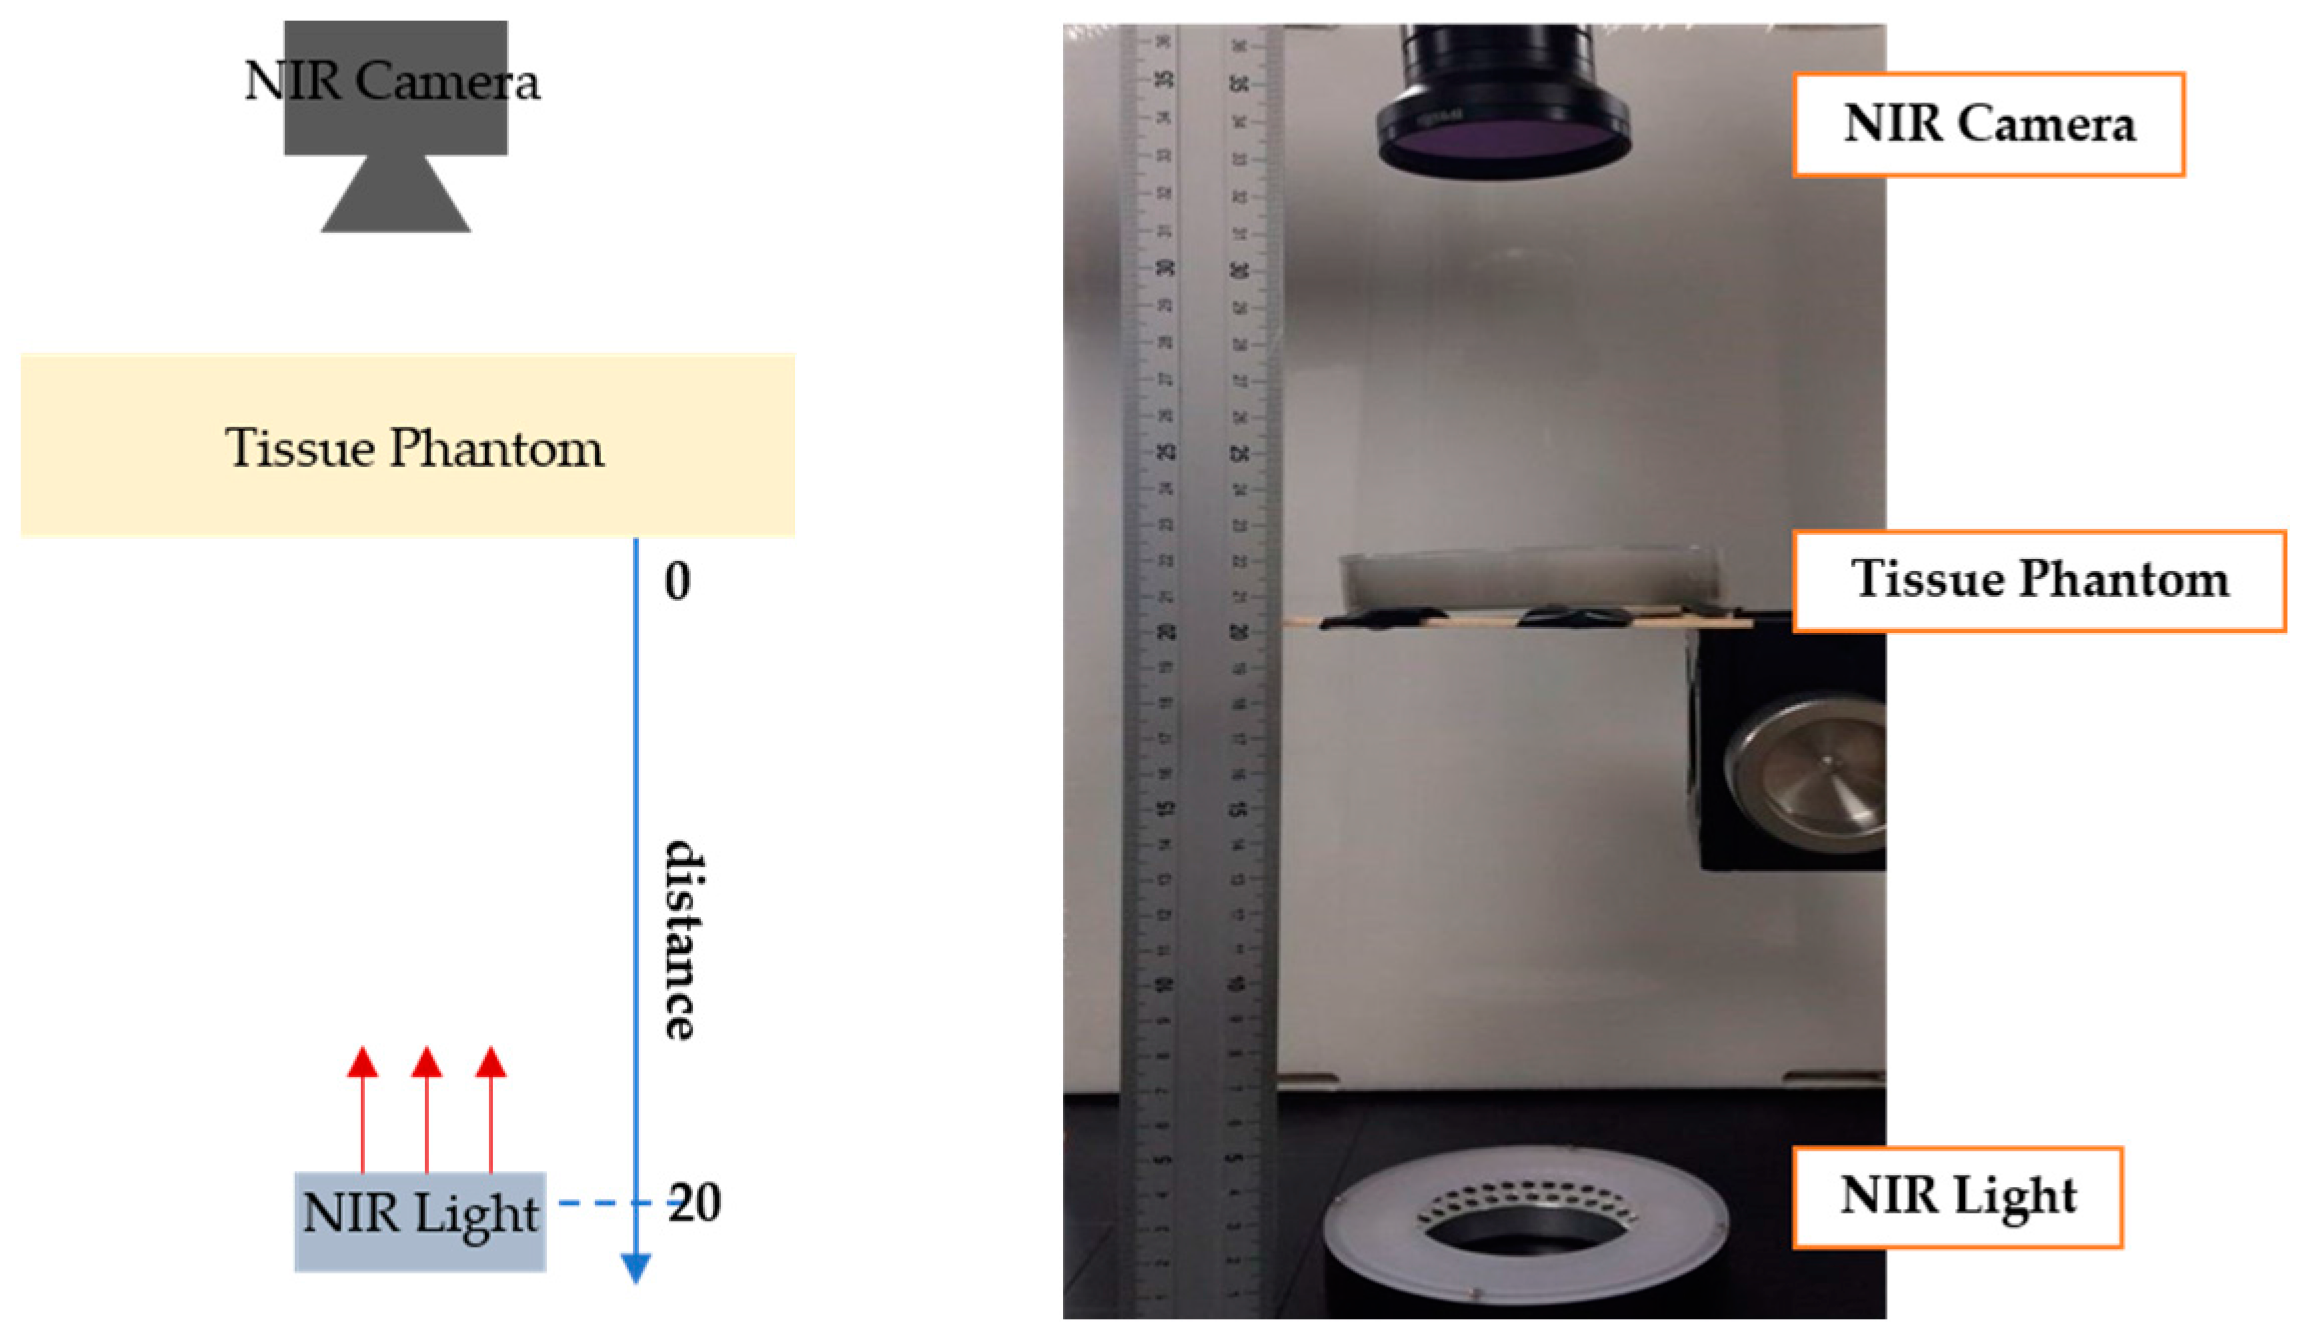
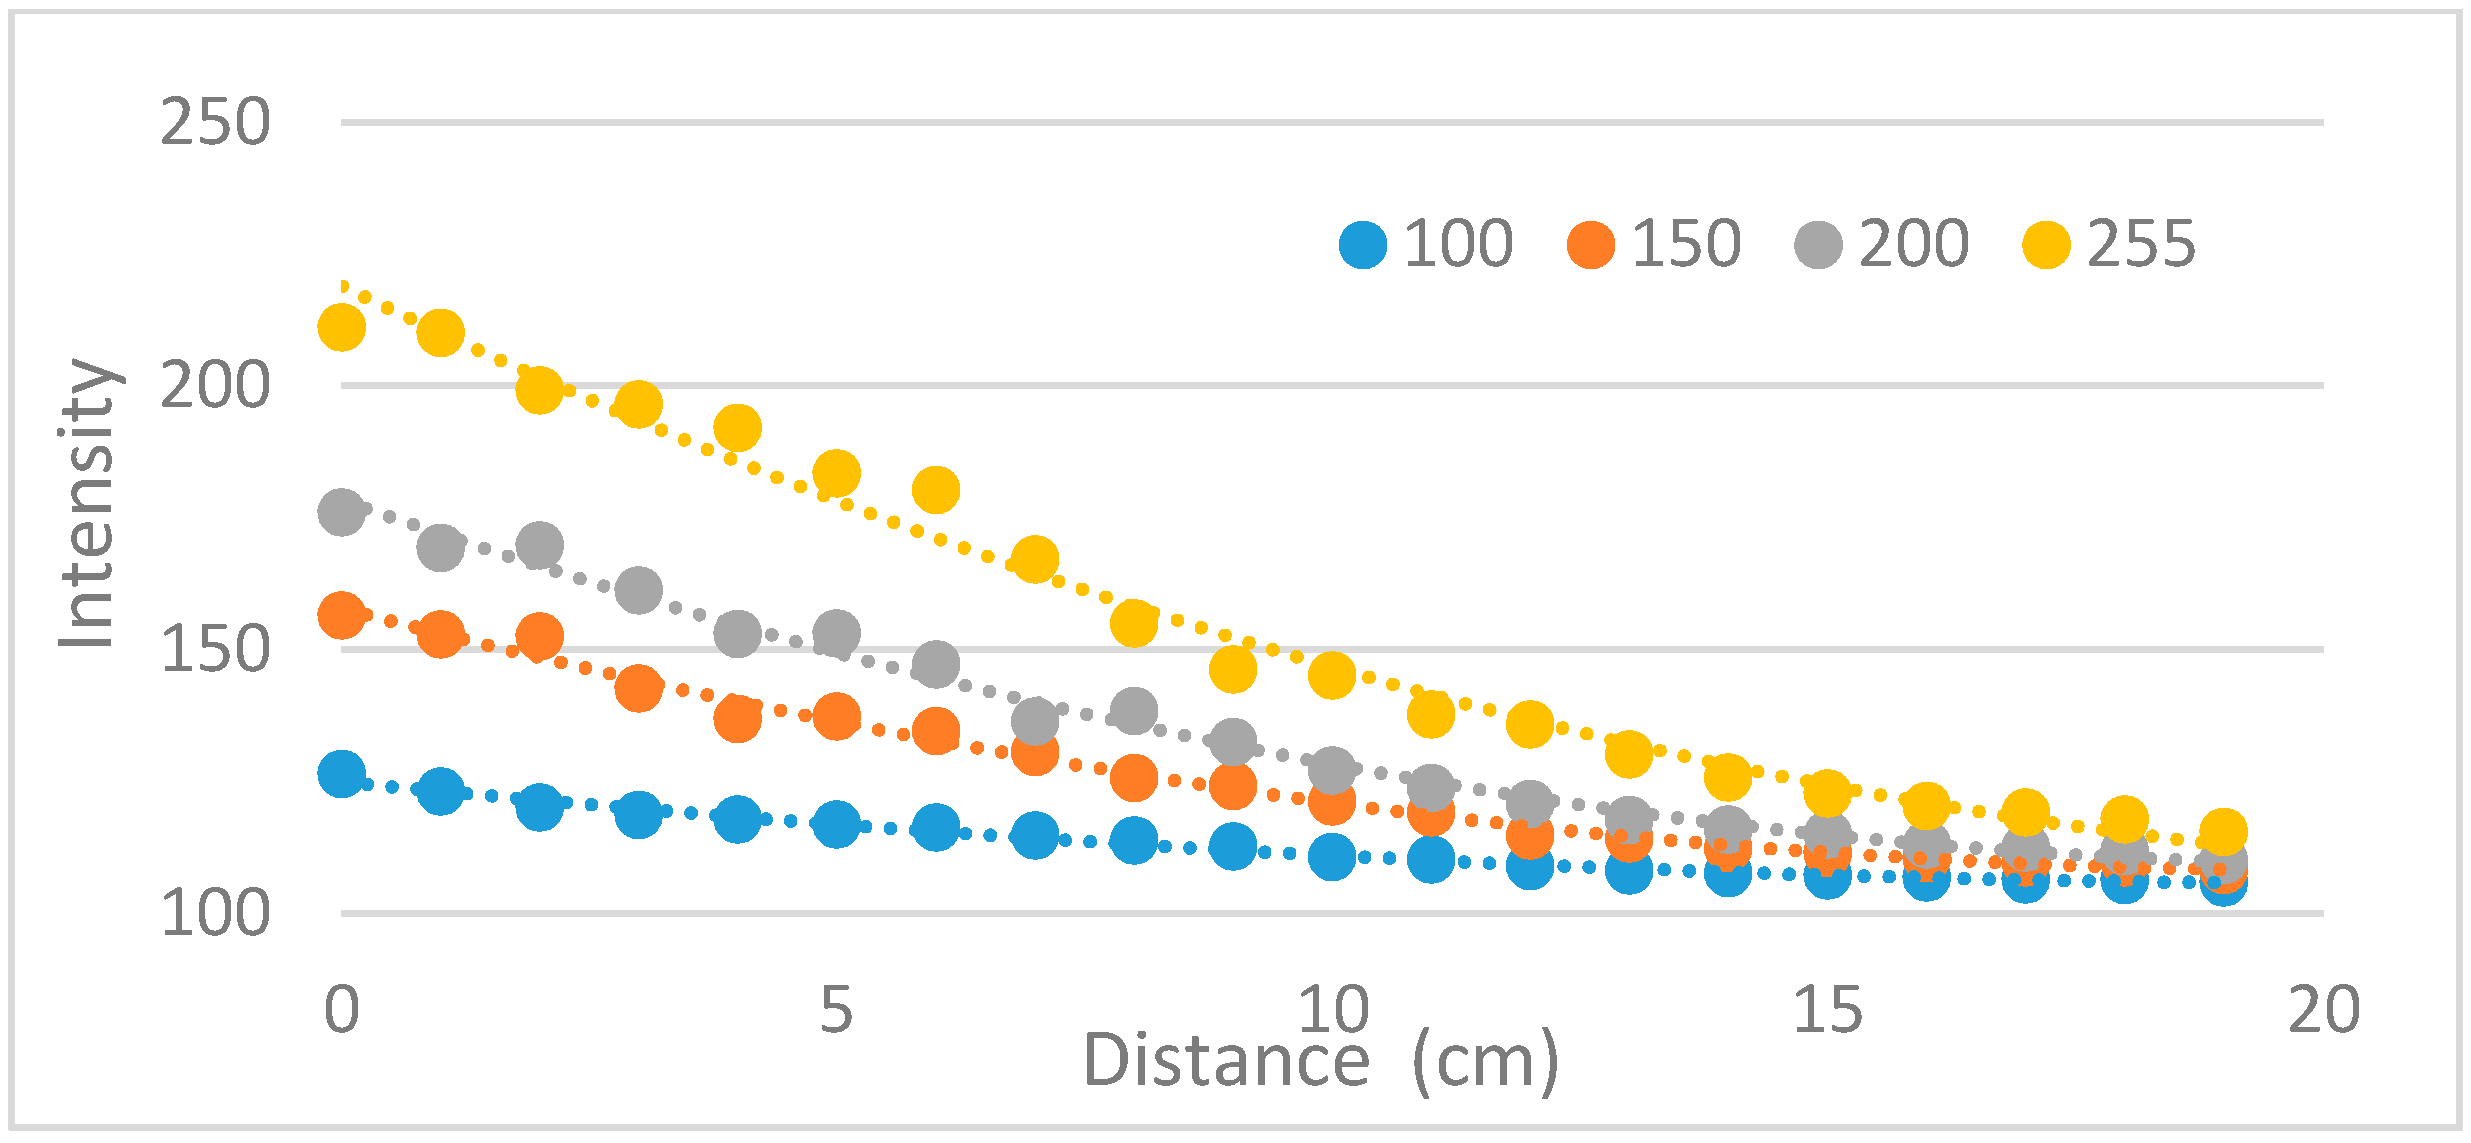
3.1.3. Measuring the Penetration Depth of the NIR Light Source
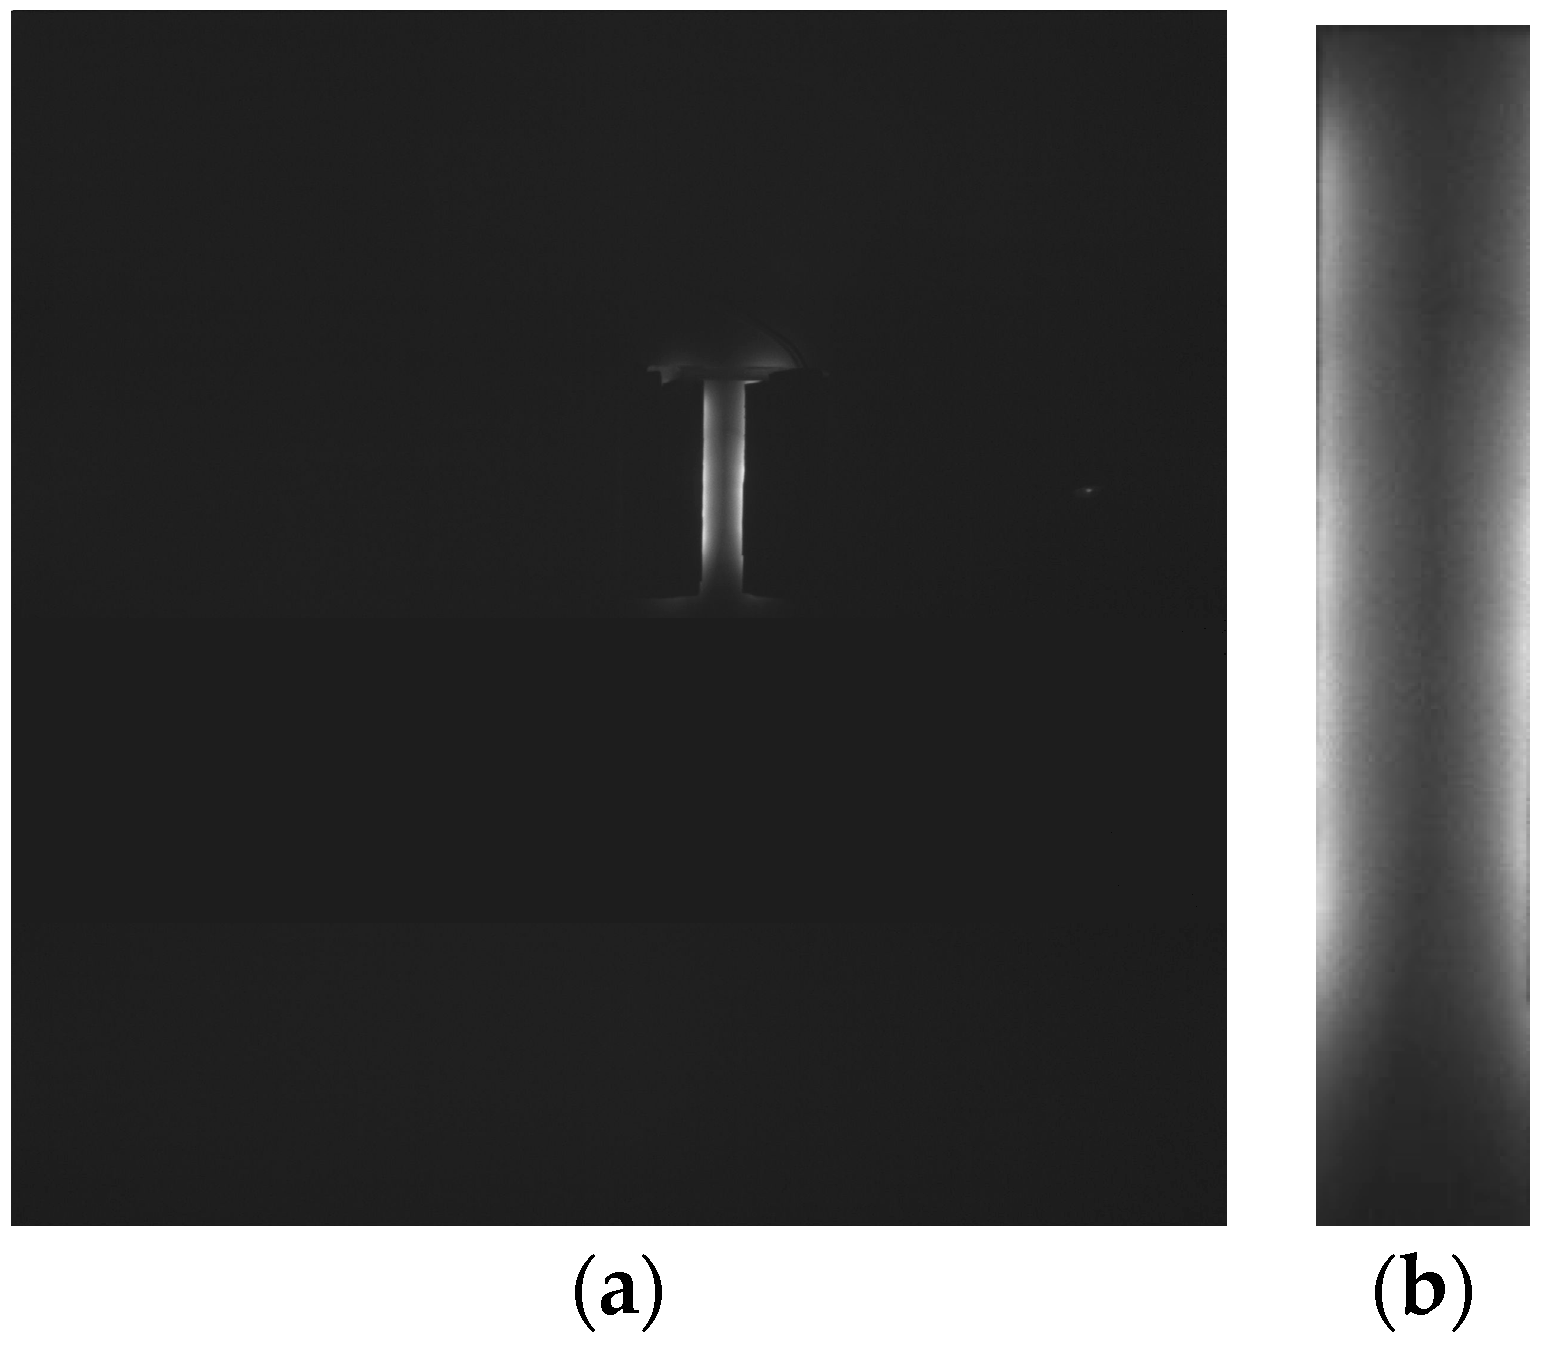
3.1.4. Determining the LED Penetration Angle of the Prototype
3.2. Feasibility Test
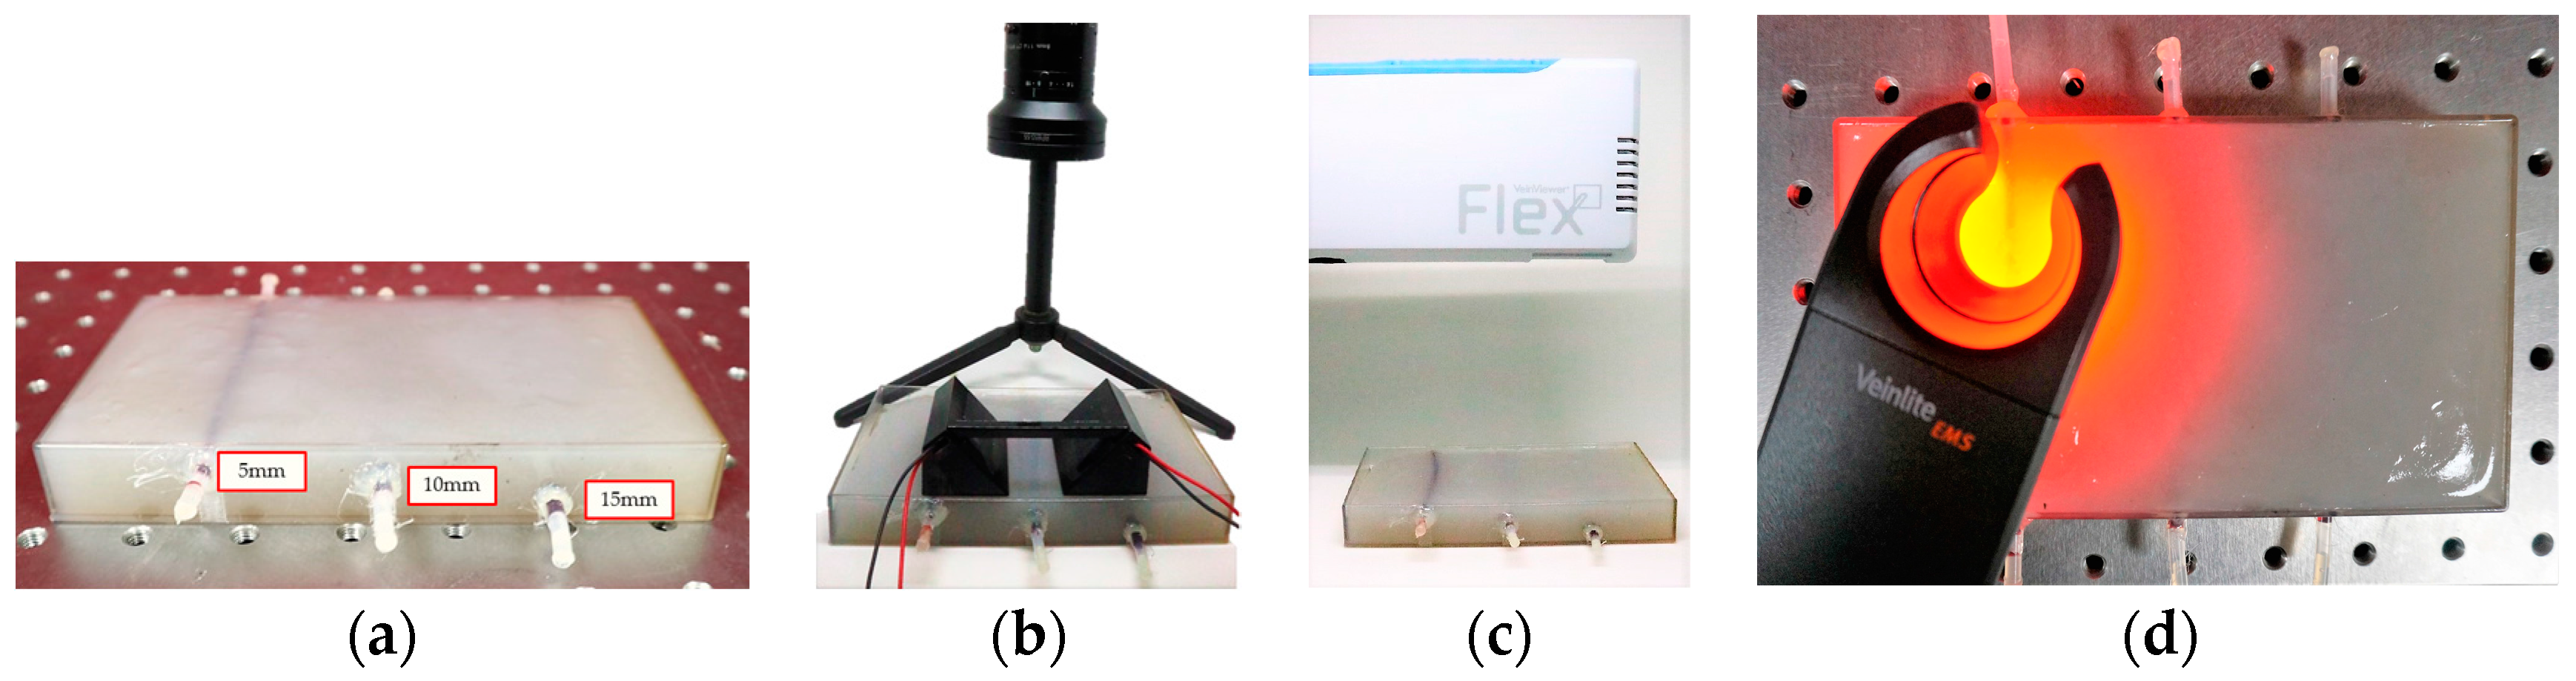
3.2.1. Feasibility Test with a Phantom
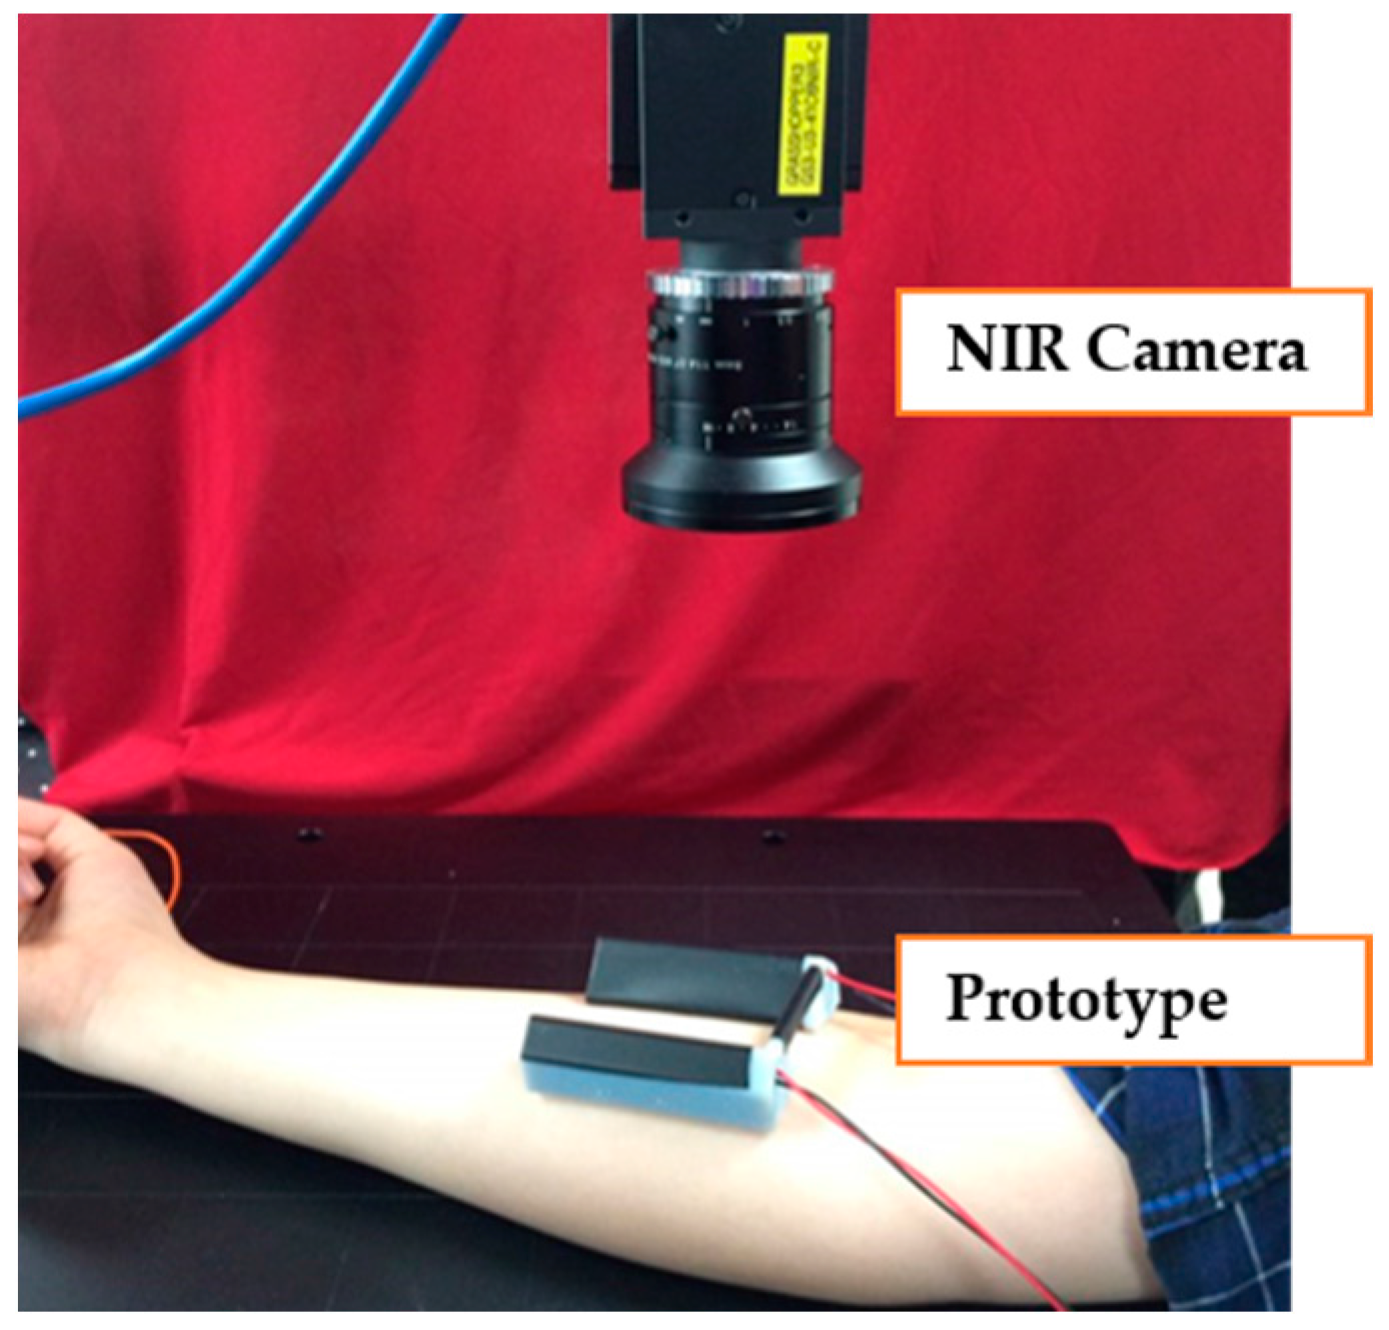
3.2.2. Feasibility Test in Vivo
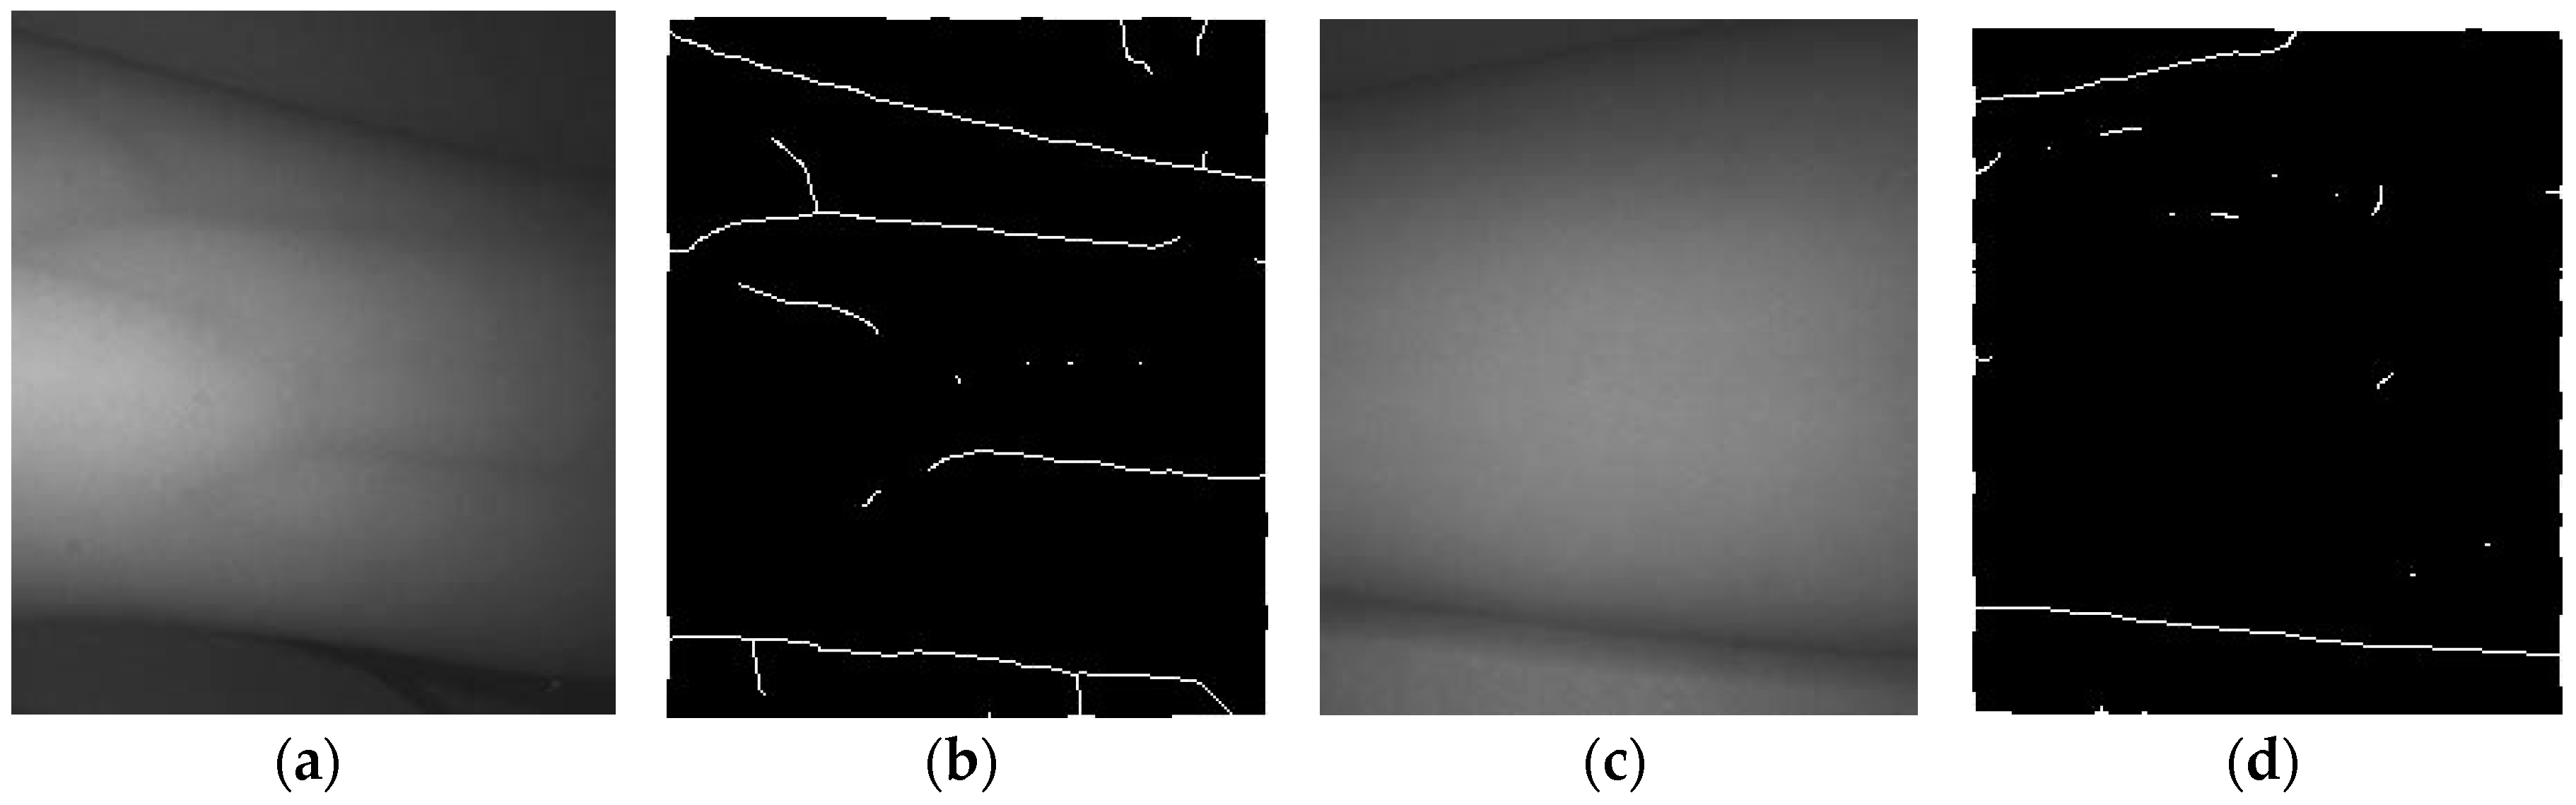
3.3. Verifying the Effectiveness of the Proposed Method
4. Discussion
Acknowledgments
Author Contributions
Conflicts of Interest
References
- Jacobson, A.F.; Elizabeth, H.W. Variables influencing intravenous catheter insertion difficulty and failure: An analysis of 339 intravenous catheter insertions. Heart Lung 2005, 34, 345–359. [Google Scholar] [CrossRef] [PubMed]
- Nafiu, O.O.; Burke, C.; Cowan, A.; Tutuo, N.; Maclean, S.; Tremper, K.K. Comparing peripheral venous access between obese and normal weight children. Pediatr. Anesth. 2010, 20, 172–176. [Google Scholar] [CrossRef] [PubMed]
- Kaddoum, R.N.; Anghelescu, D.L.; Parish, M.E.; Wright, B.B.; Trujillo, L.; Wu, J.; Wu, Y.; Burgoyne, L.L. A randomized controlled trial comparing the AccuVein AV300 device to standard insertion technique for intravenous cannulation of anesthetized children. Pediatr. Anesth. 2012, 22, 884–889. [Google Scholar] [CrossRef] [PubMed]
- Wang, L.; Leedham, G.; Cho, S. Infrared Imaging of Hand Vein Patterns for Biometric Purposes. IET Comput. Vis. 2007, 1, 113–122. [Google Scholar] [CrossRef]
- Cuper, N.J.; Klaessens, J.H.; Jaspers, J.E.; de Roode, R.; Noordmans, H.J.; de Graaff, J.C.; Verdaasdonk, R.M. The use of near-infrared light for safe and effective visualization of subsurface blood vessels to facilitate blood withdrawal in children. Med. Eng. Phys. 2013, 35, 433–440. [Google Scholar] [CrossRef] [PubMed]
- Brian, D.; Dhawan, A.P. Transillumination imaging for blood oxygen saturation estimation of skin lesions. IEEE Trans. Biomed. Eng. 2012, 59, 2660–2667. [Google Scholar]
- Jobsis, F.F. Noninvasive, infrared monitoring of cerebral and myocardial oxygen sufficiency and circulatory parameters. Science 1977, 198, 1264–1267. [Google Scholar] [CrossRef] [PubMed]
- Juric, S.; Flis, V.; Debevc, M.; Holzinger, A.; Zalik, B. Towards a low-cost mobile subcutaneous vein detection solution using near-infrared spectroscopy. Sci. World J. 2014, 2014. [Google Scholar] [CrossRef] [PubMed]
- Katsogridakis, Y.L.; Seshadri, R.; Sullivan, C.; Waltzman, M.L. Veinlite transillumination in the pediatric emergency department: A therapeutic interventional trial. Pediatr. Emerg. Care 2008, 24, 83–88. [Google Scholar] [CrossRef] [PubMed]
- Dryden, P.; Haselby, K. Vein Locator. U.S. Patent Application No. 11/043,300, 25 January 2005. [Google Scholar]
- Lee, S.; Park, S.; Lee, D. A phantom study on the propagation of NIR rays under the skin for designing a novel vein- visualizing device. In Proceedings of the 2013 13th International Conference on Control, Automation and Systems (ICCAS), Gwangju, Korea, 20–23 October 2013.
- Zhang, T.Y.; Ching, Y.S. A fast parallel algorithm for thinning digital patterns. Commun. ACM 1984, 27, 236–239. [Google Scholar] [CrossRef]
- Huang, K.; Chang, C.; Chang, H.; Chang, C. The image analysis of skin tissue irradiated with difference wavelengths of LED sources. In Proceedings of the 2012 IEEE International Instrumentation and Measurement Technology Conference (I2MTC), Graz, Austria, 13–16 May 2012.
- OpenCV. Available online: www.opencv.org/ (accessed on 6 February 2017).
- Mohammad, A.; Kabir, M.H.; Dewan, M.A.A.; Chae, O. A dynamic histogram equalization for image contrast enhancement. IEEE Trans. Consum. Electron. 2007, 53, 593–600. [Google Scholar]
- Pizer, S.M.; Amburn, E.P.; Austin, J.D.; Cromartie, R.; Geselowitz, A.; Greer, T.; Romeny, B.T.H.; Zimmerman, J.B. Adaptive histogram equalization and its variations. Comput. Vis. Graph. Image Process. 1987, 39, 355–368. [Google Scholar] [CrossRef]
- Frangi, A.F.; Niessen, W.J.; Vincken, K.L.; Viergever, M.A. Multiscale vessel enhancement filtering. In International Conference on Medical Image Computing and Computer-Assisted Intervention; Springer: Berlin/Heidelberg, Germany, 1998; pp. 130–137. [Google Scholar]
- Cubeddu, R.; Pifferi, A.; Taroni, P.; Torricelli, A.; Valentini, G. A solid tissue phantom for photon migration studies. Phys. Med. Biol. 1997, 42, 1971–1979. [Google Scholar] [CrossRef] [PubMed]
- Lindeberg, T. Edge detection and ridge detection with automatic scale selection. Int. J. Comput. Vis. 1998, 30, 117–156. [Google Scholar] [CrossRef]
- Pogue, W.B.; Patterson, M.S. Review of tissue simulating phantoms for optical spectroscopy, imaging and dosimetry. J. Biomed. Opt. 2006, 11, 041102. [Google Scholar] [CrossRef] [PubMed]
- Galena, H.J. Complications occurring from diagnostic venipuncture. J. Fam. Pract. 1992, 34, 582–585. [Google Scholar] [PubMed]
- Network, OAS Announces Campus Assessment. Available online: http://www.esrdnetwork18.org/pdfs/QI%20-%20FF%20Tools/FFToolKit.pdf/ (accessed on 6 February 2017).


| Image Collecting System | Method 1 (Reflection) | Method 2 (Penetration) | Method 3 (Penetration) |
|---|---|---|---|
| Design | 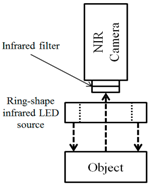 |  |  |
| Characteristic | Bright image/low contrast, Can’t penetrate thick part like an arm | Can’t penetrate thick part like an arm | No major difference with standard of care/Consumes high energy |
| Device | Veinviewer/AccuVein | Transilluminator Device/Vein Navigation Device/VascuLuminator | Veinlite |
© 2017 by the authors. Licensee MDPI, Basel, Switzerland. This article is an open access article distributed under the terms and conditions of the Creative Commons Attribution (CC BY) license ( http://creativecommons.org/licenses/by/4.0/).
Share and Cite
Kim, D.; Kim, Y.; Yoon, S.; Lee, D. Preliminary Study for Designing a Novel Vein-Visualizing Device. Sensors 2017, 17, 304. https://doi.org/10.3390/s17020304
Kim D, Kim Y, Yoon S, Lee D. Preliminary Study for Designing a Novel Vein-Visualizing Device. Sensors. 2017; 17(2):304. https://doi.org/10.3390/s17020304
Chicago/Turabian StyleKim, Donghoon, Yujin Kim, Siyeop Yoon, and Deukhee Lee. 2017. "Preliminary Study for Designing a Novel Vein-Visualizing Device" Sensors 17, no. 2: 304. https://doi.org/10.3390/s17020304
APA StyleKim, D., Kim, Y., Yoon, S., & Lee, D. (2017). Preliminary Study for Designing a Novel Vein-Visualizing Device. Sensors, 17(2), 304. https://doi.org/10.3390/s17020304