Active Wireless System for Structural Health Monitoring Applications


Abstract
1. Introduction
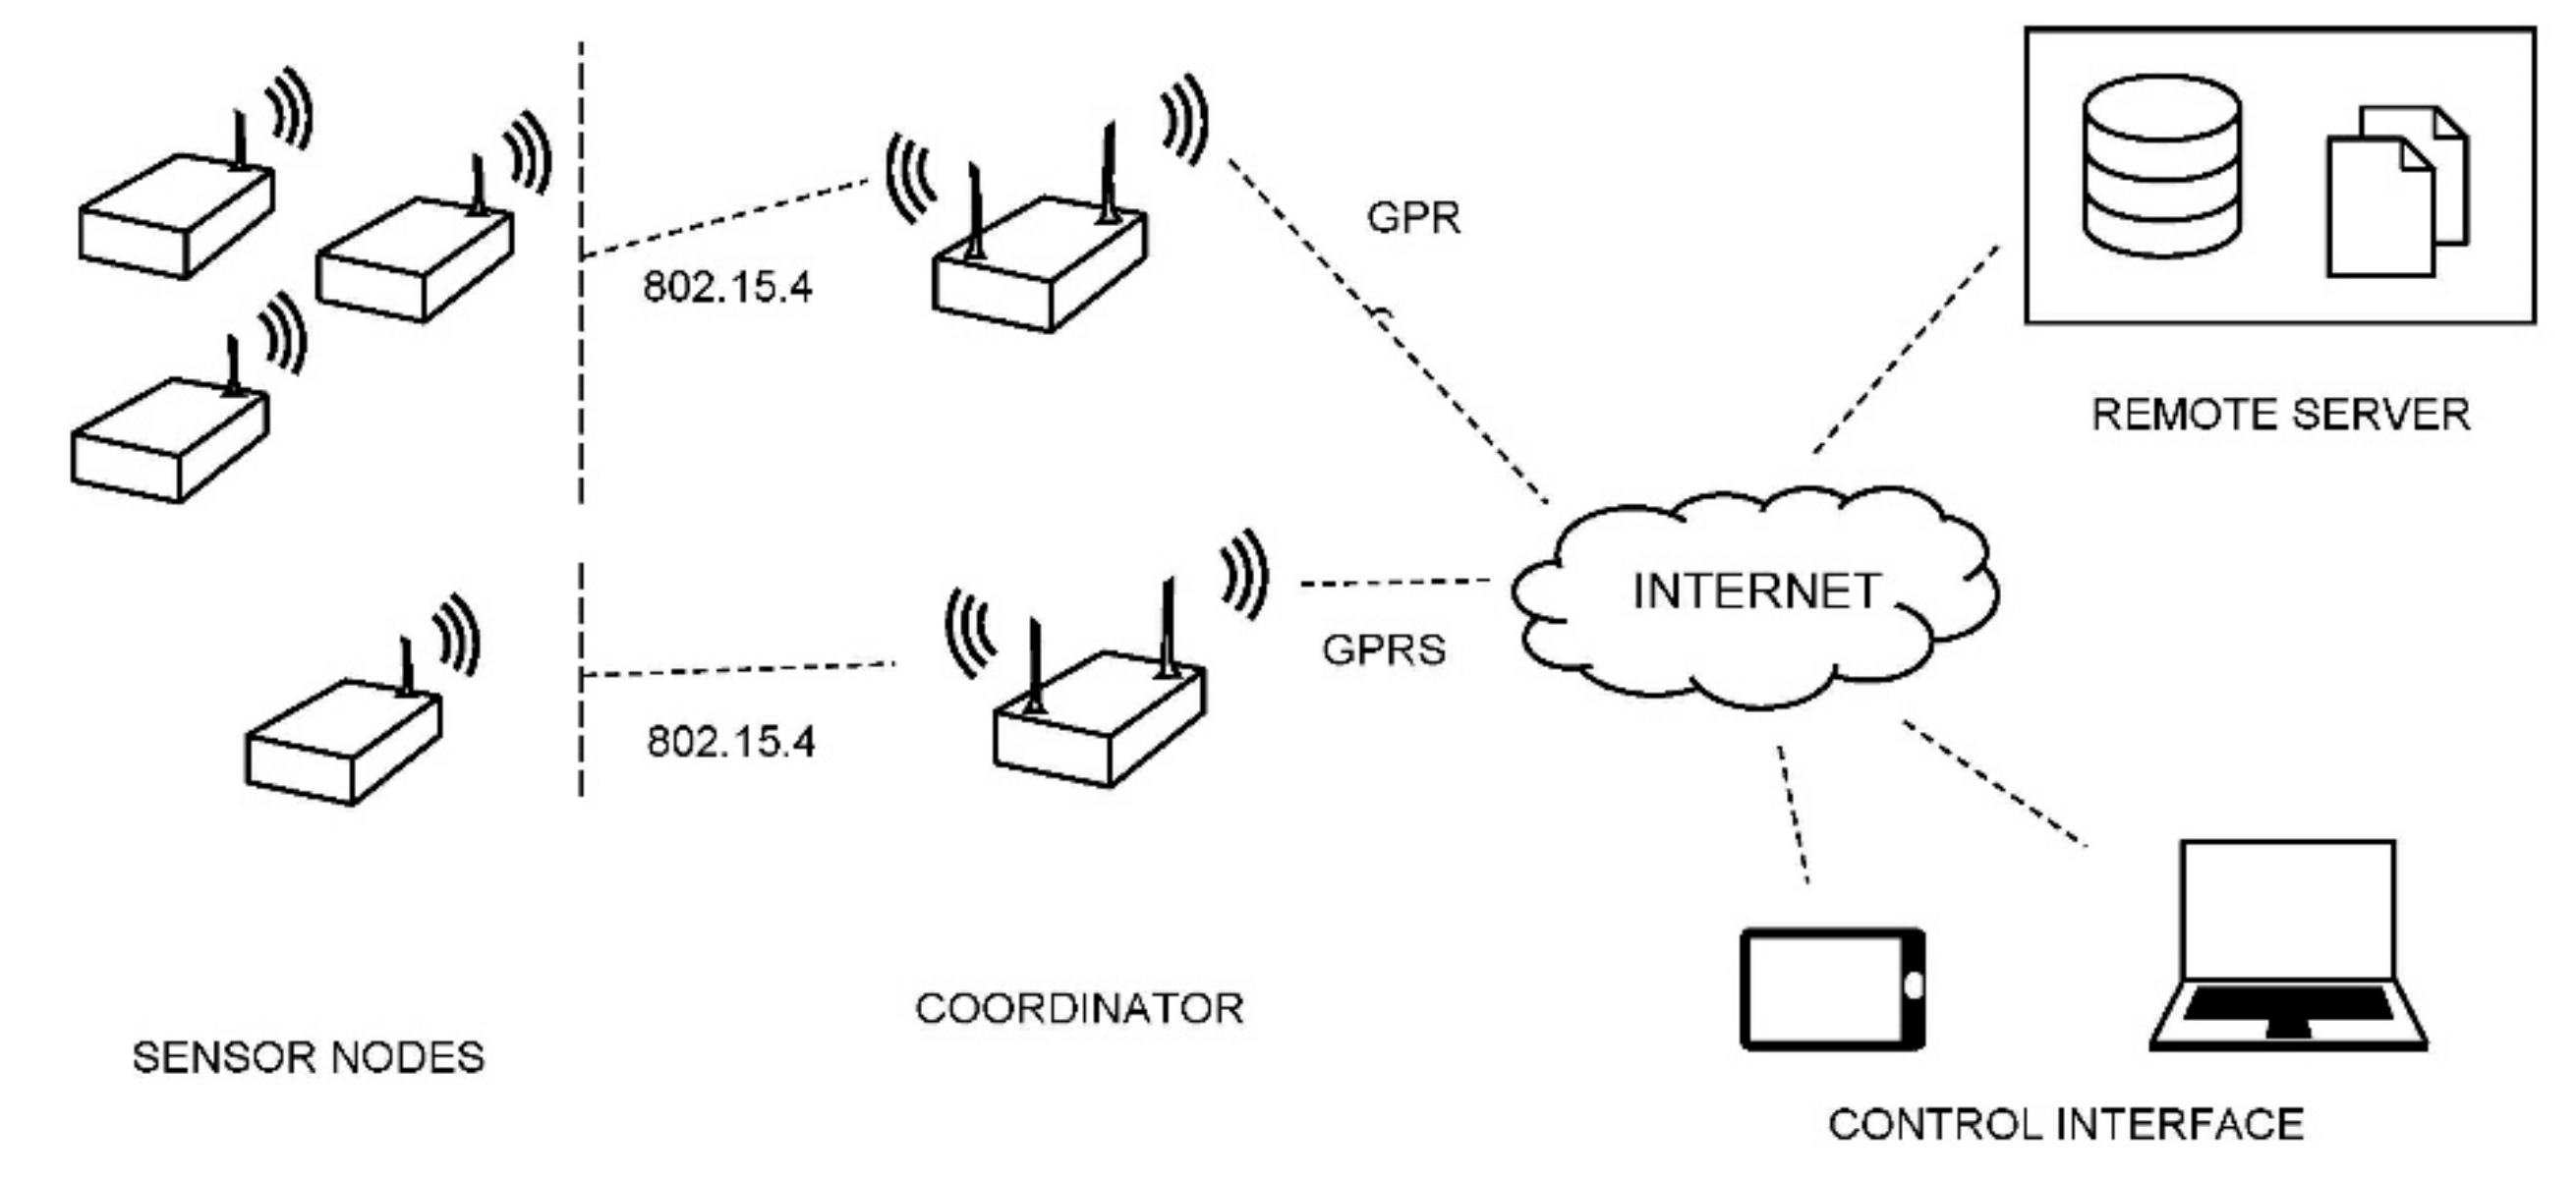
2. Description of the Active Wireless System
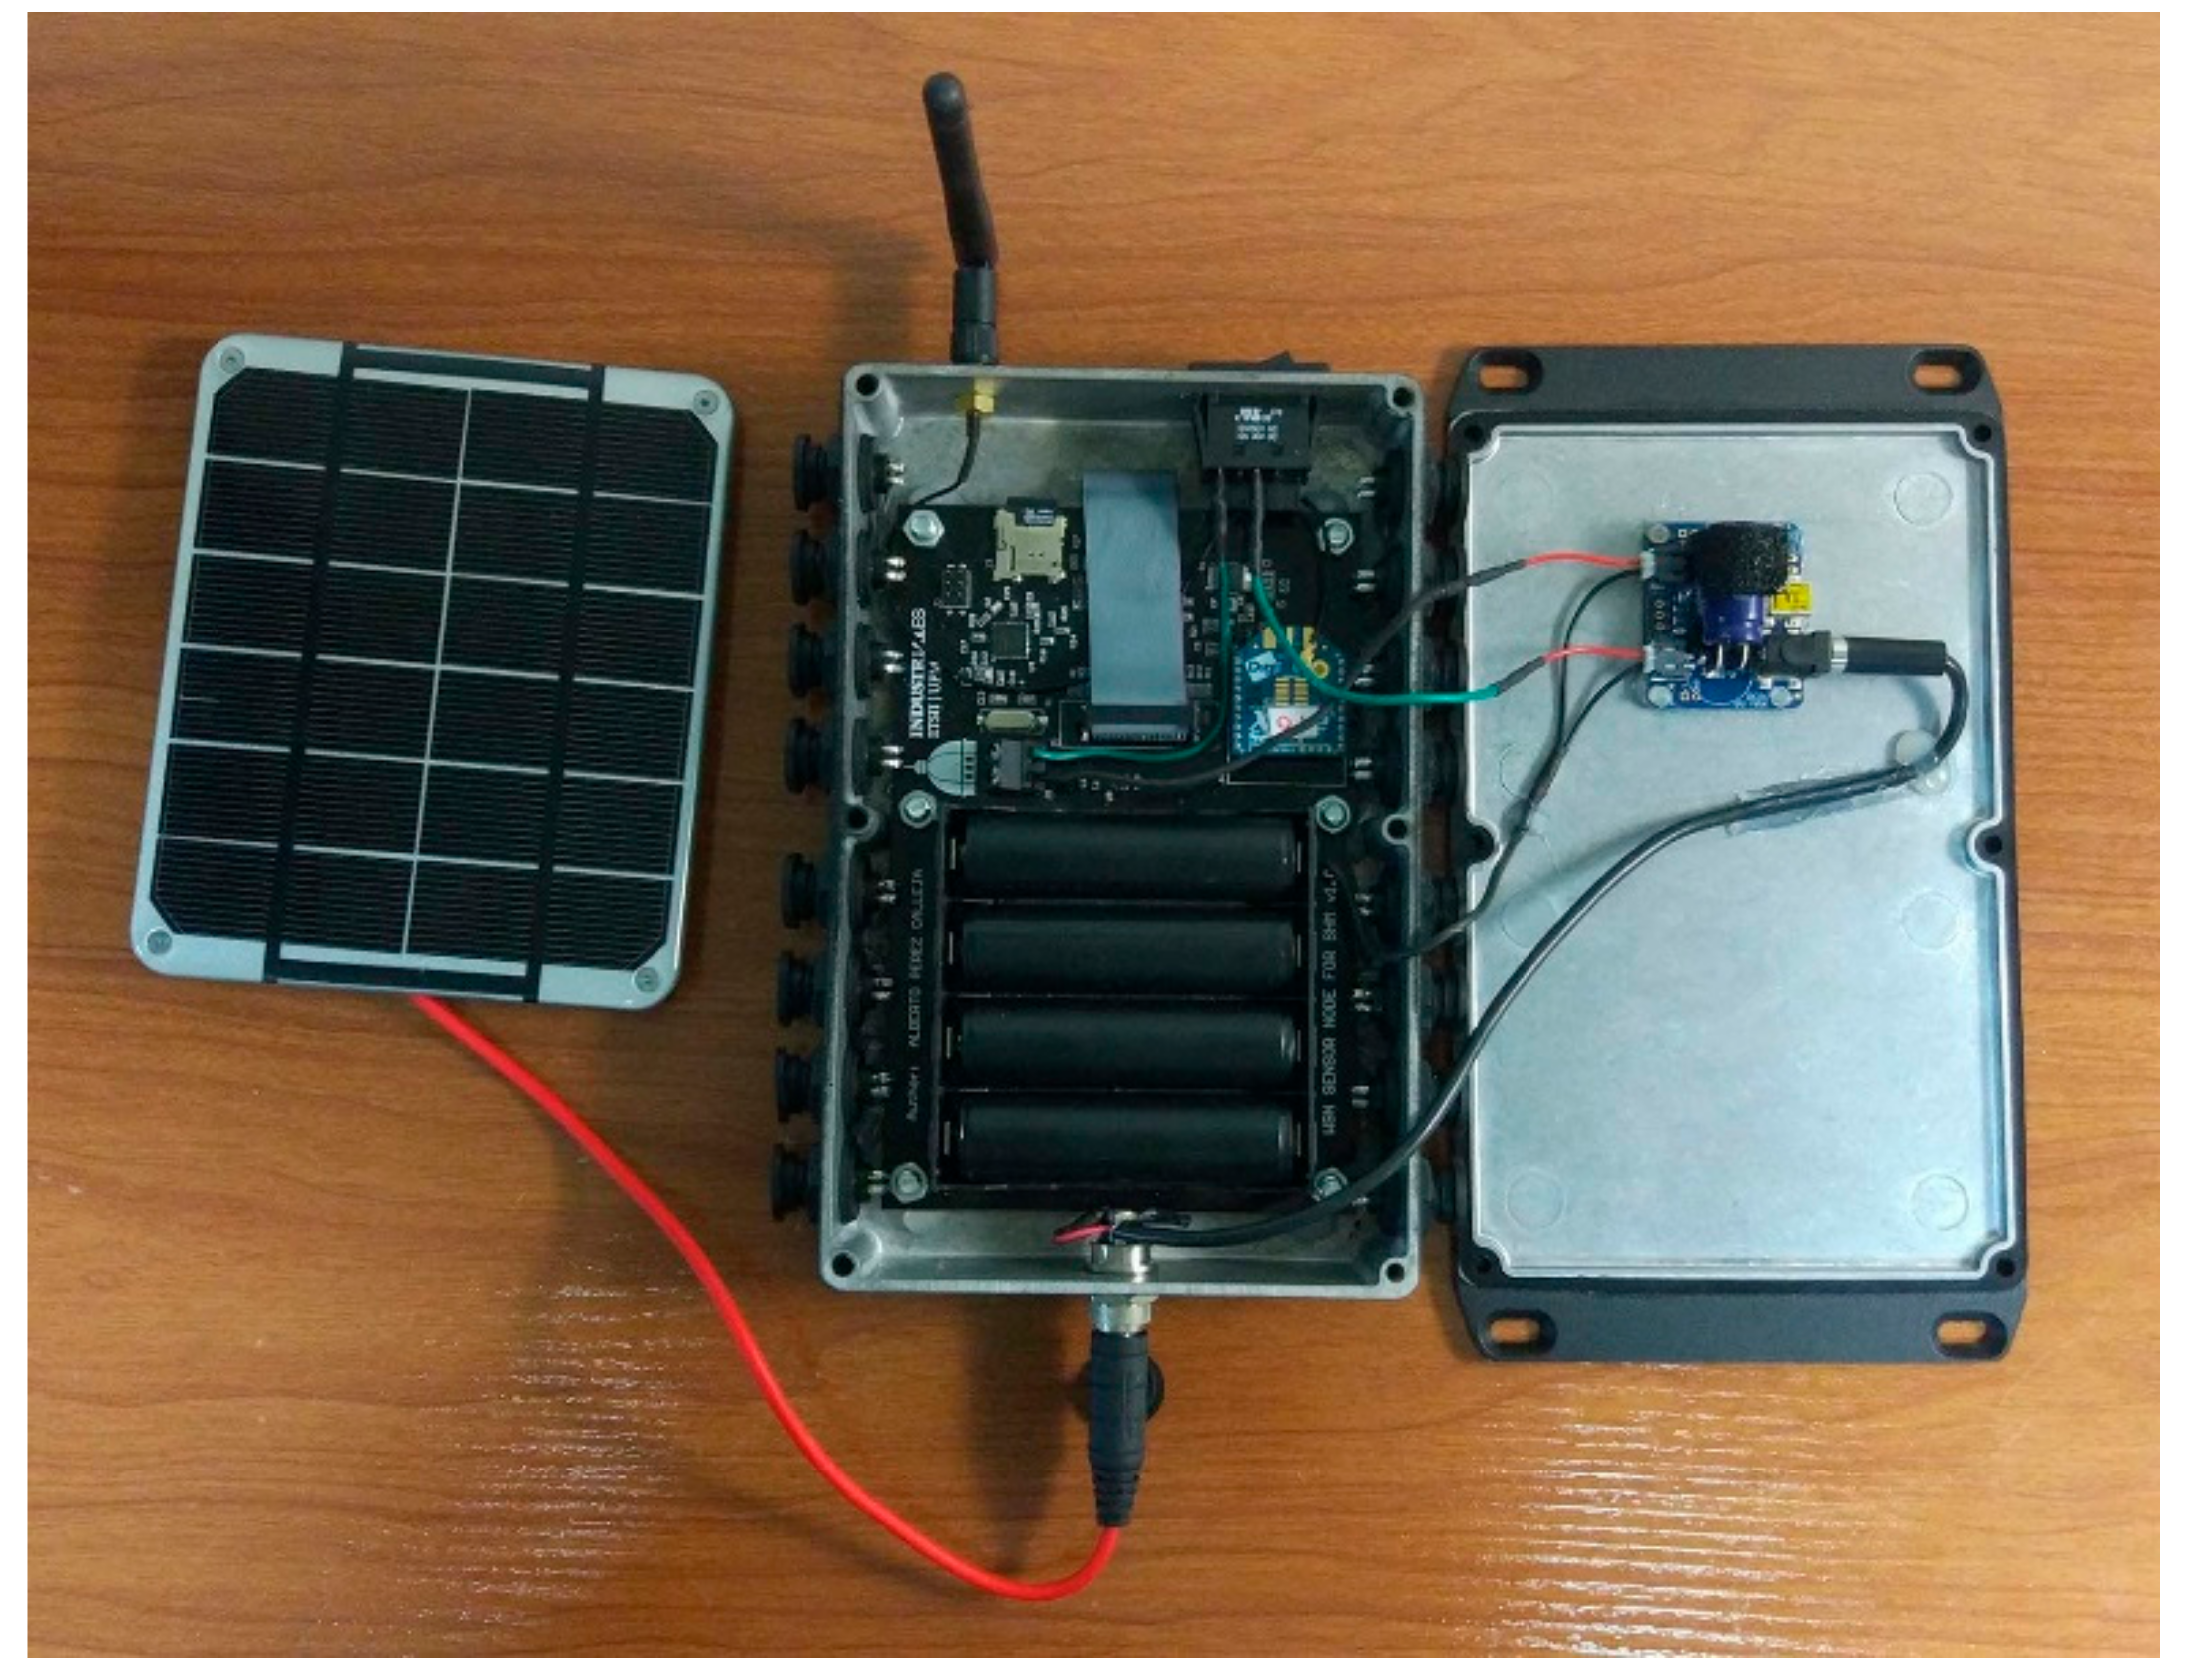
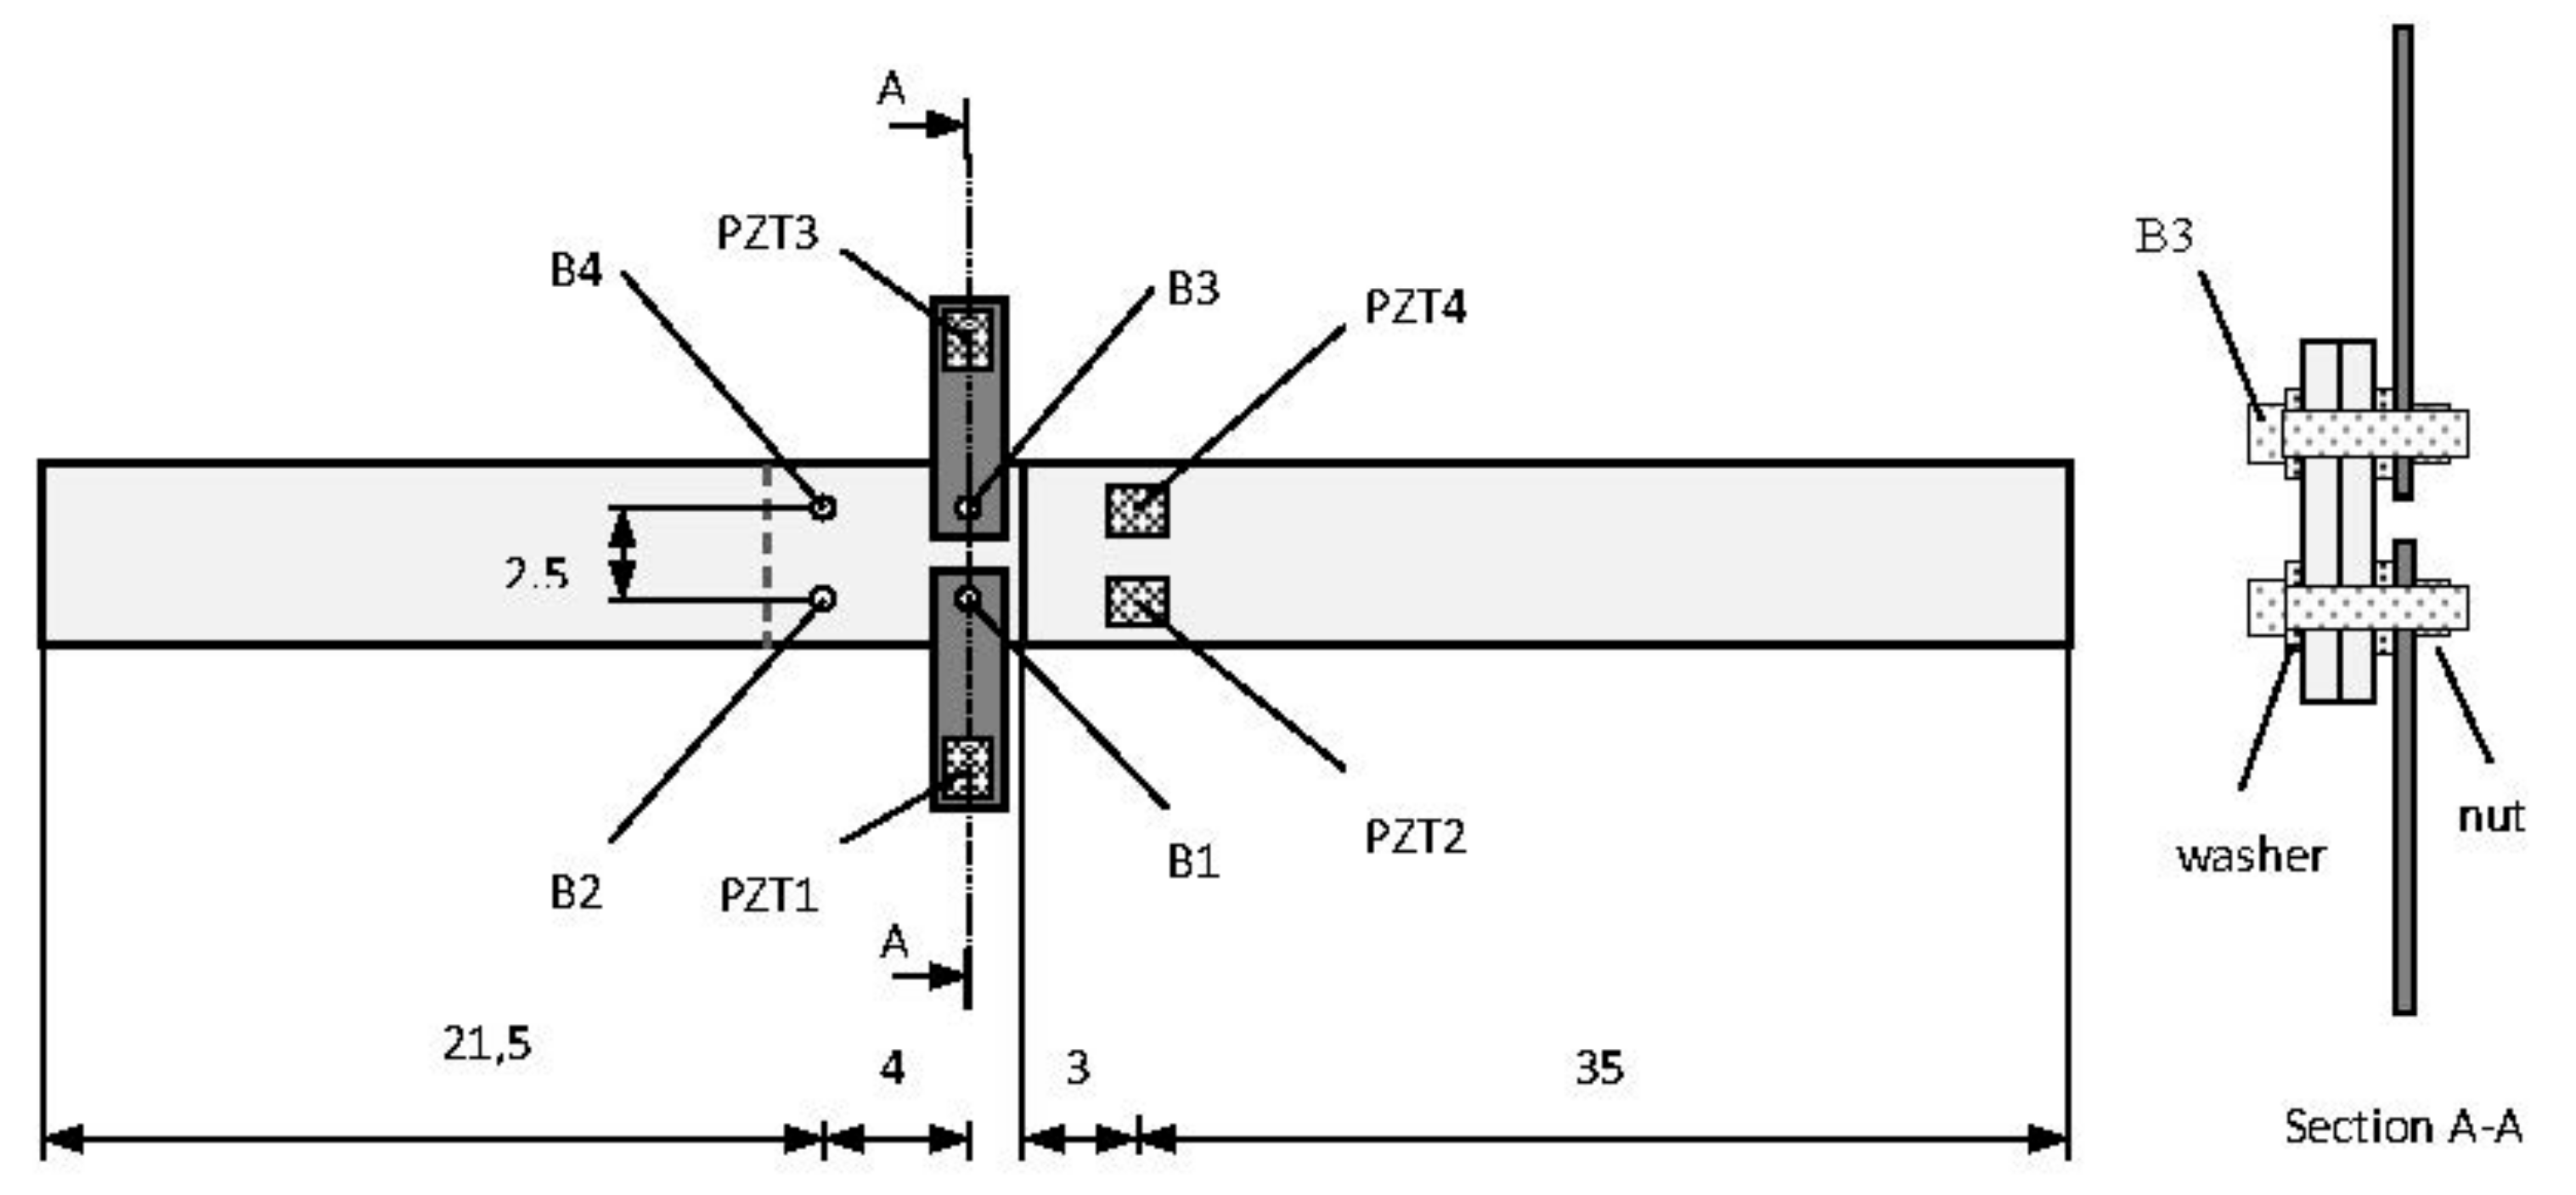
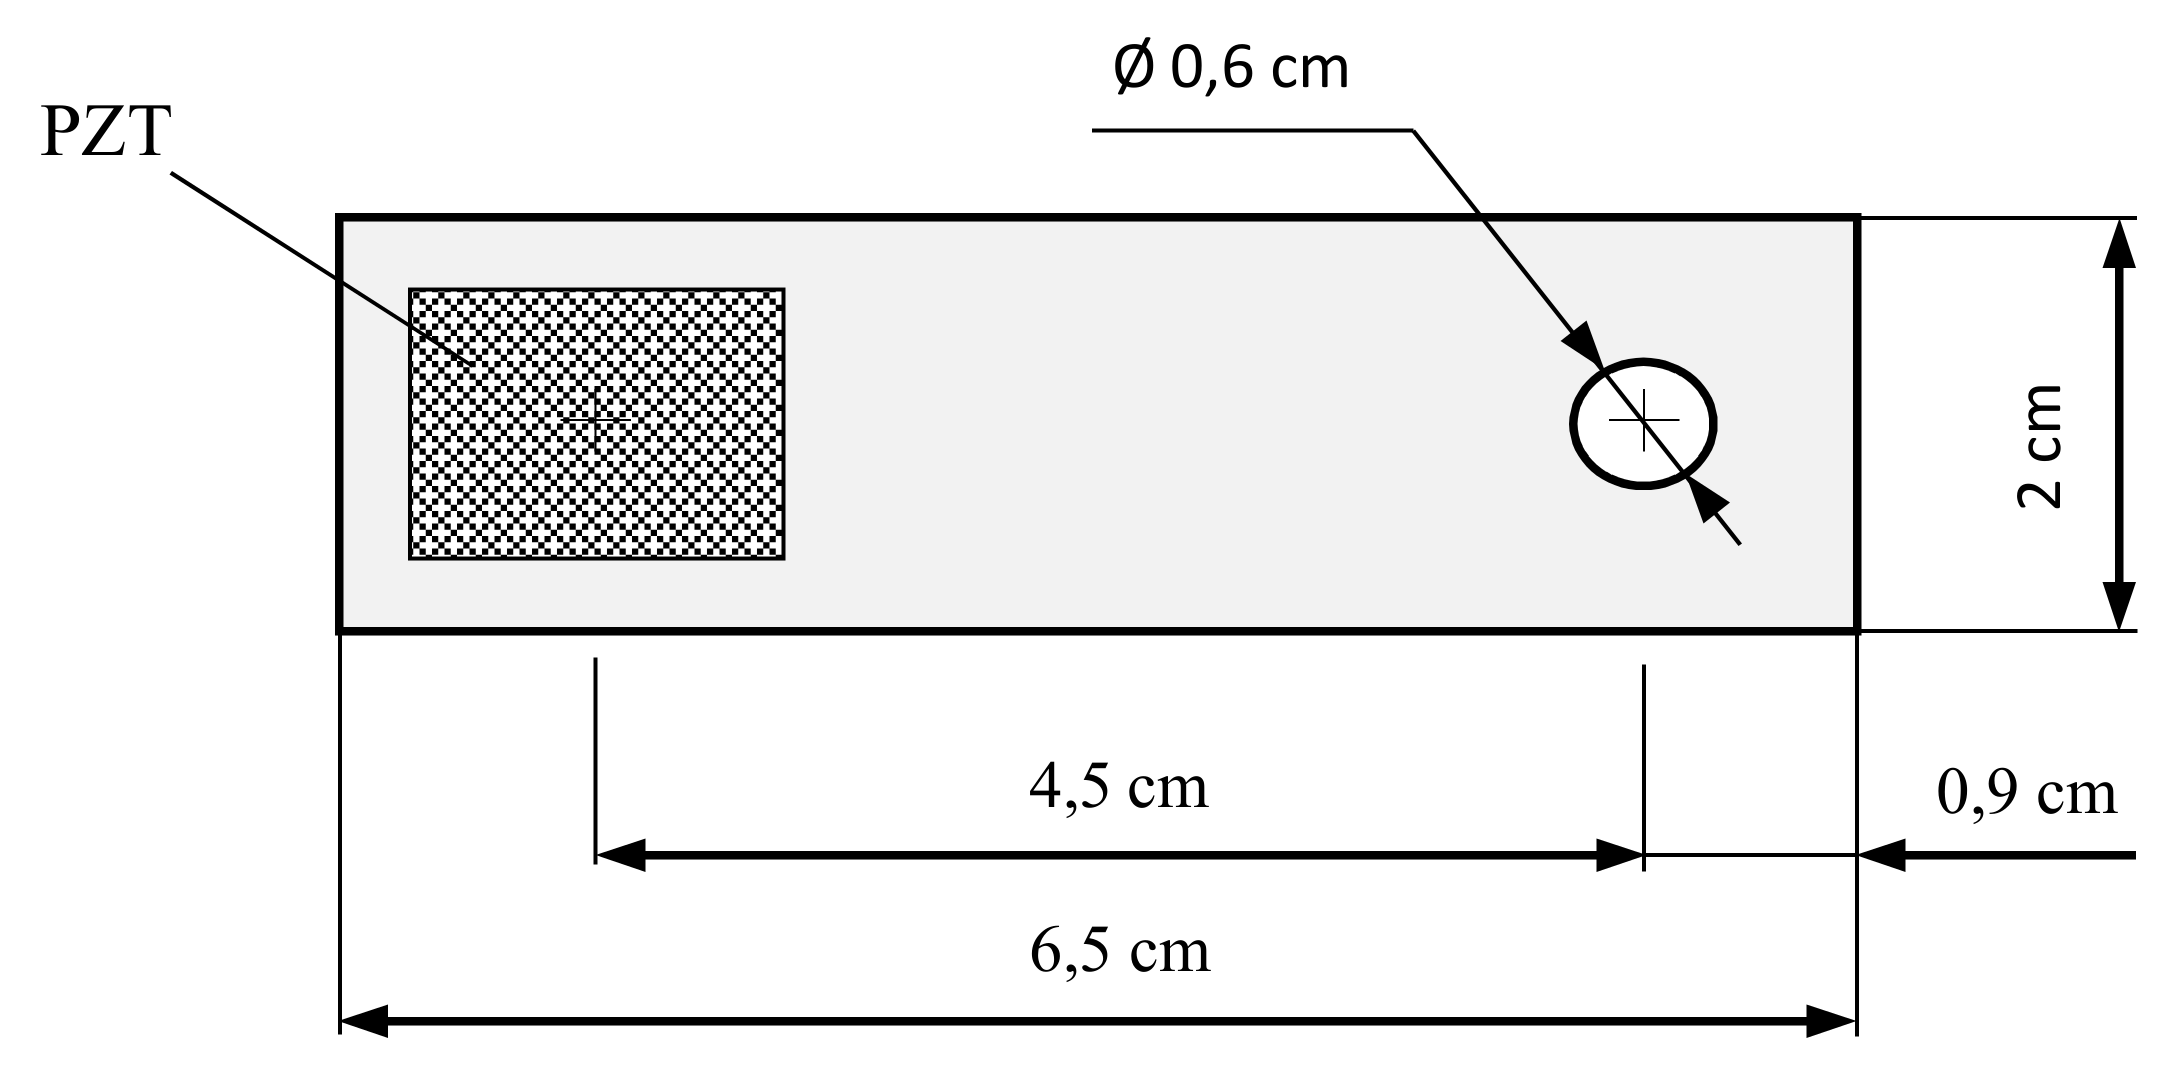
2.1. Impedance Based Sensor Node
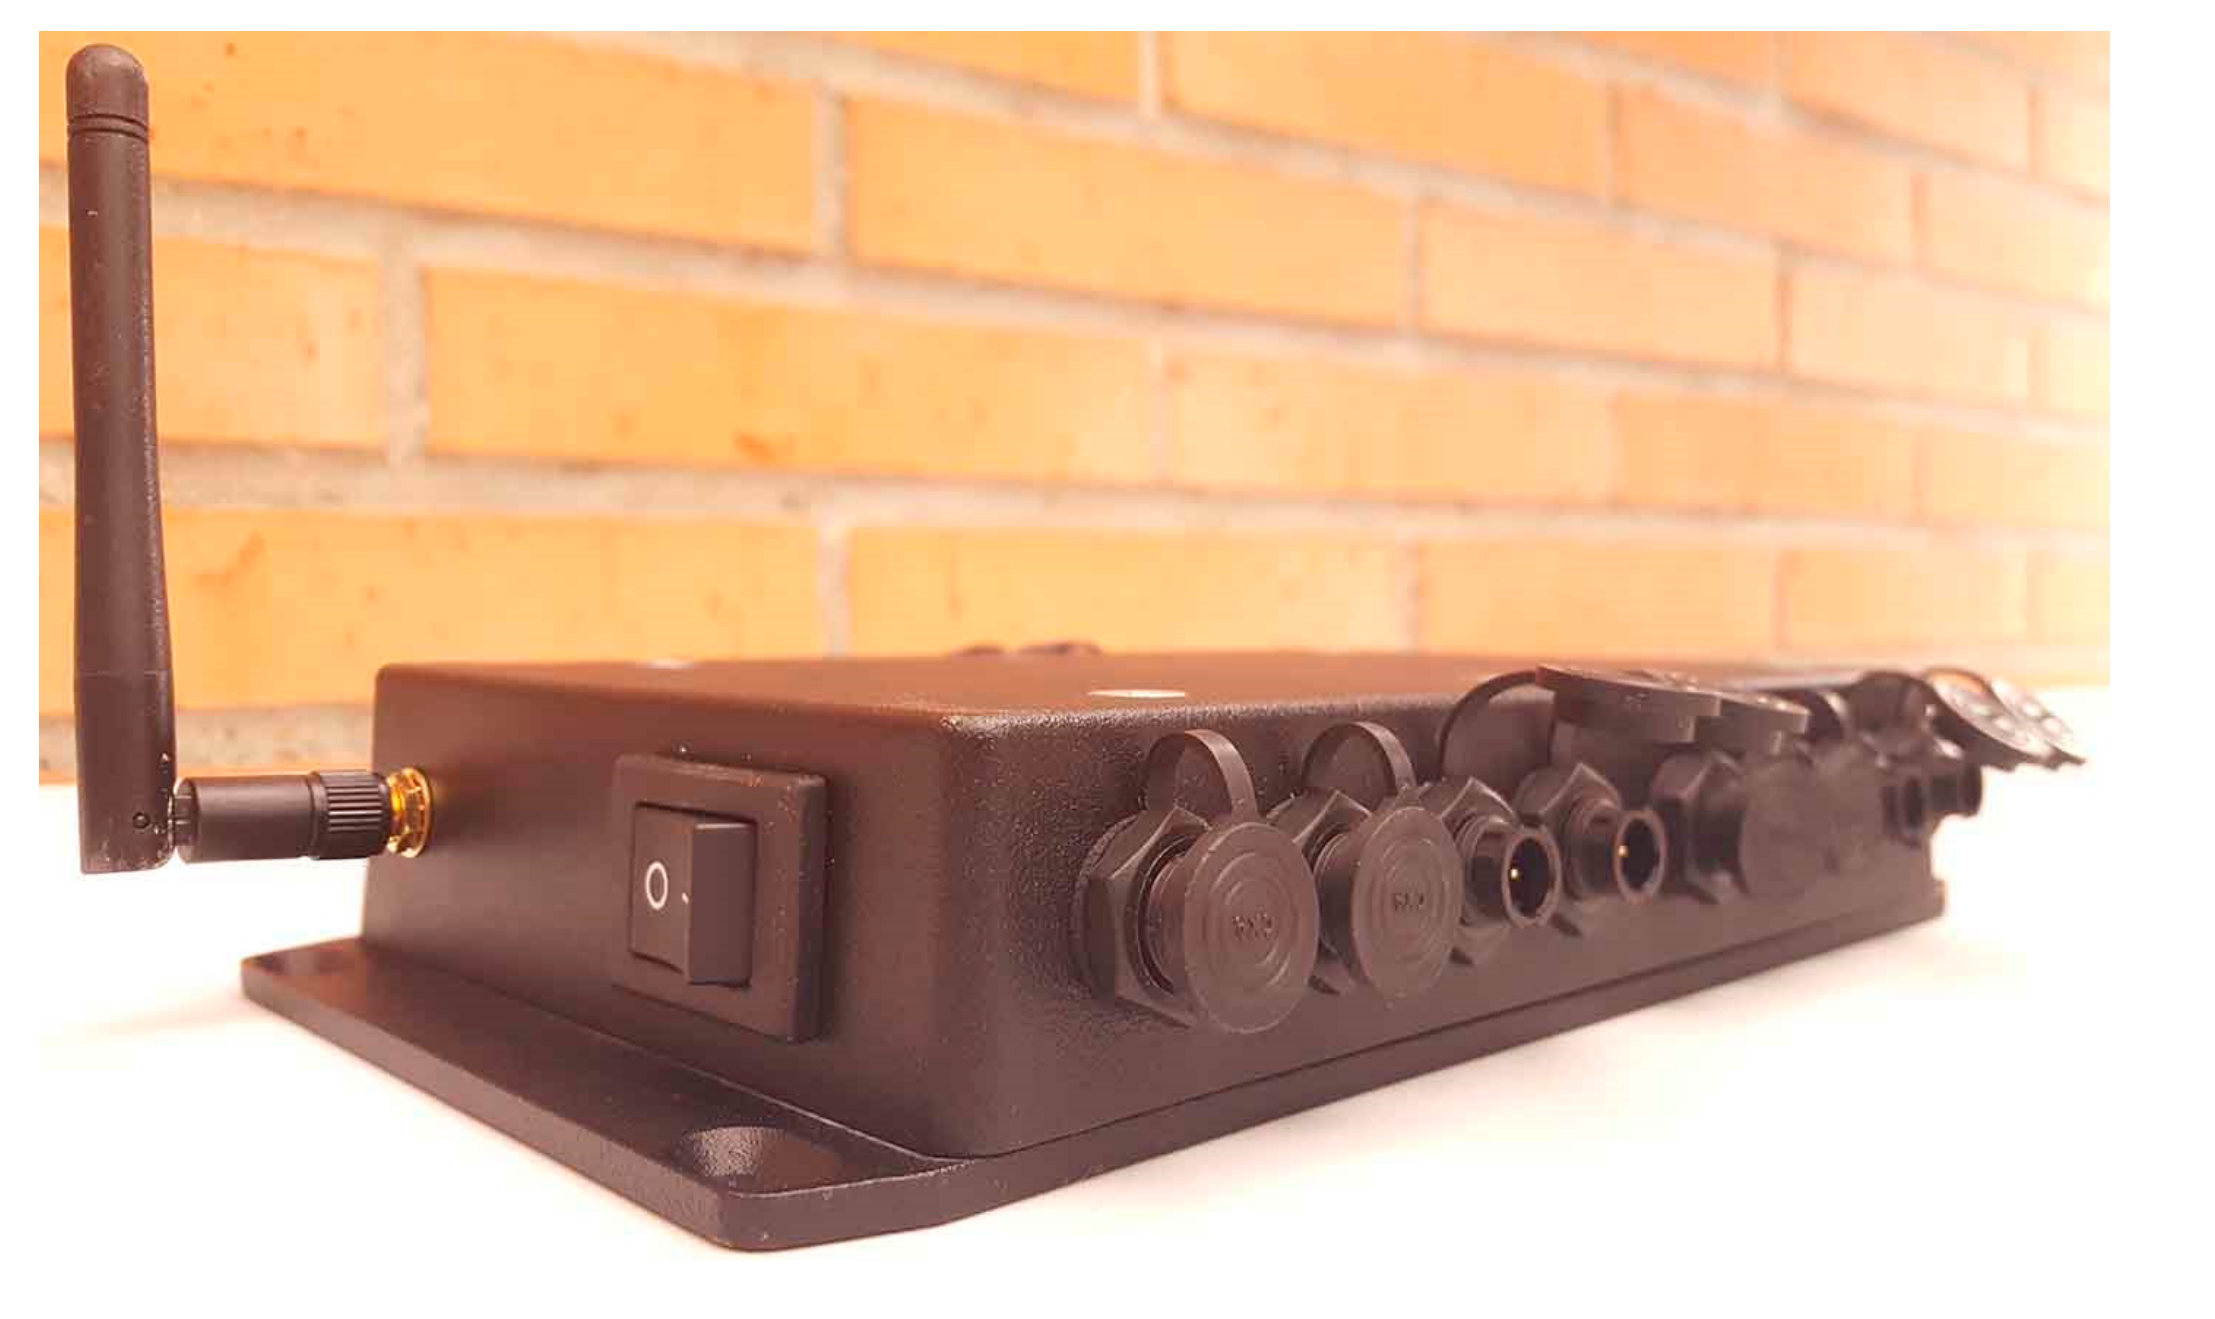
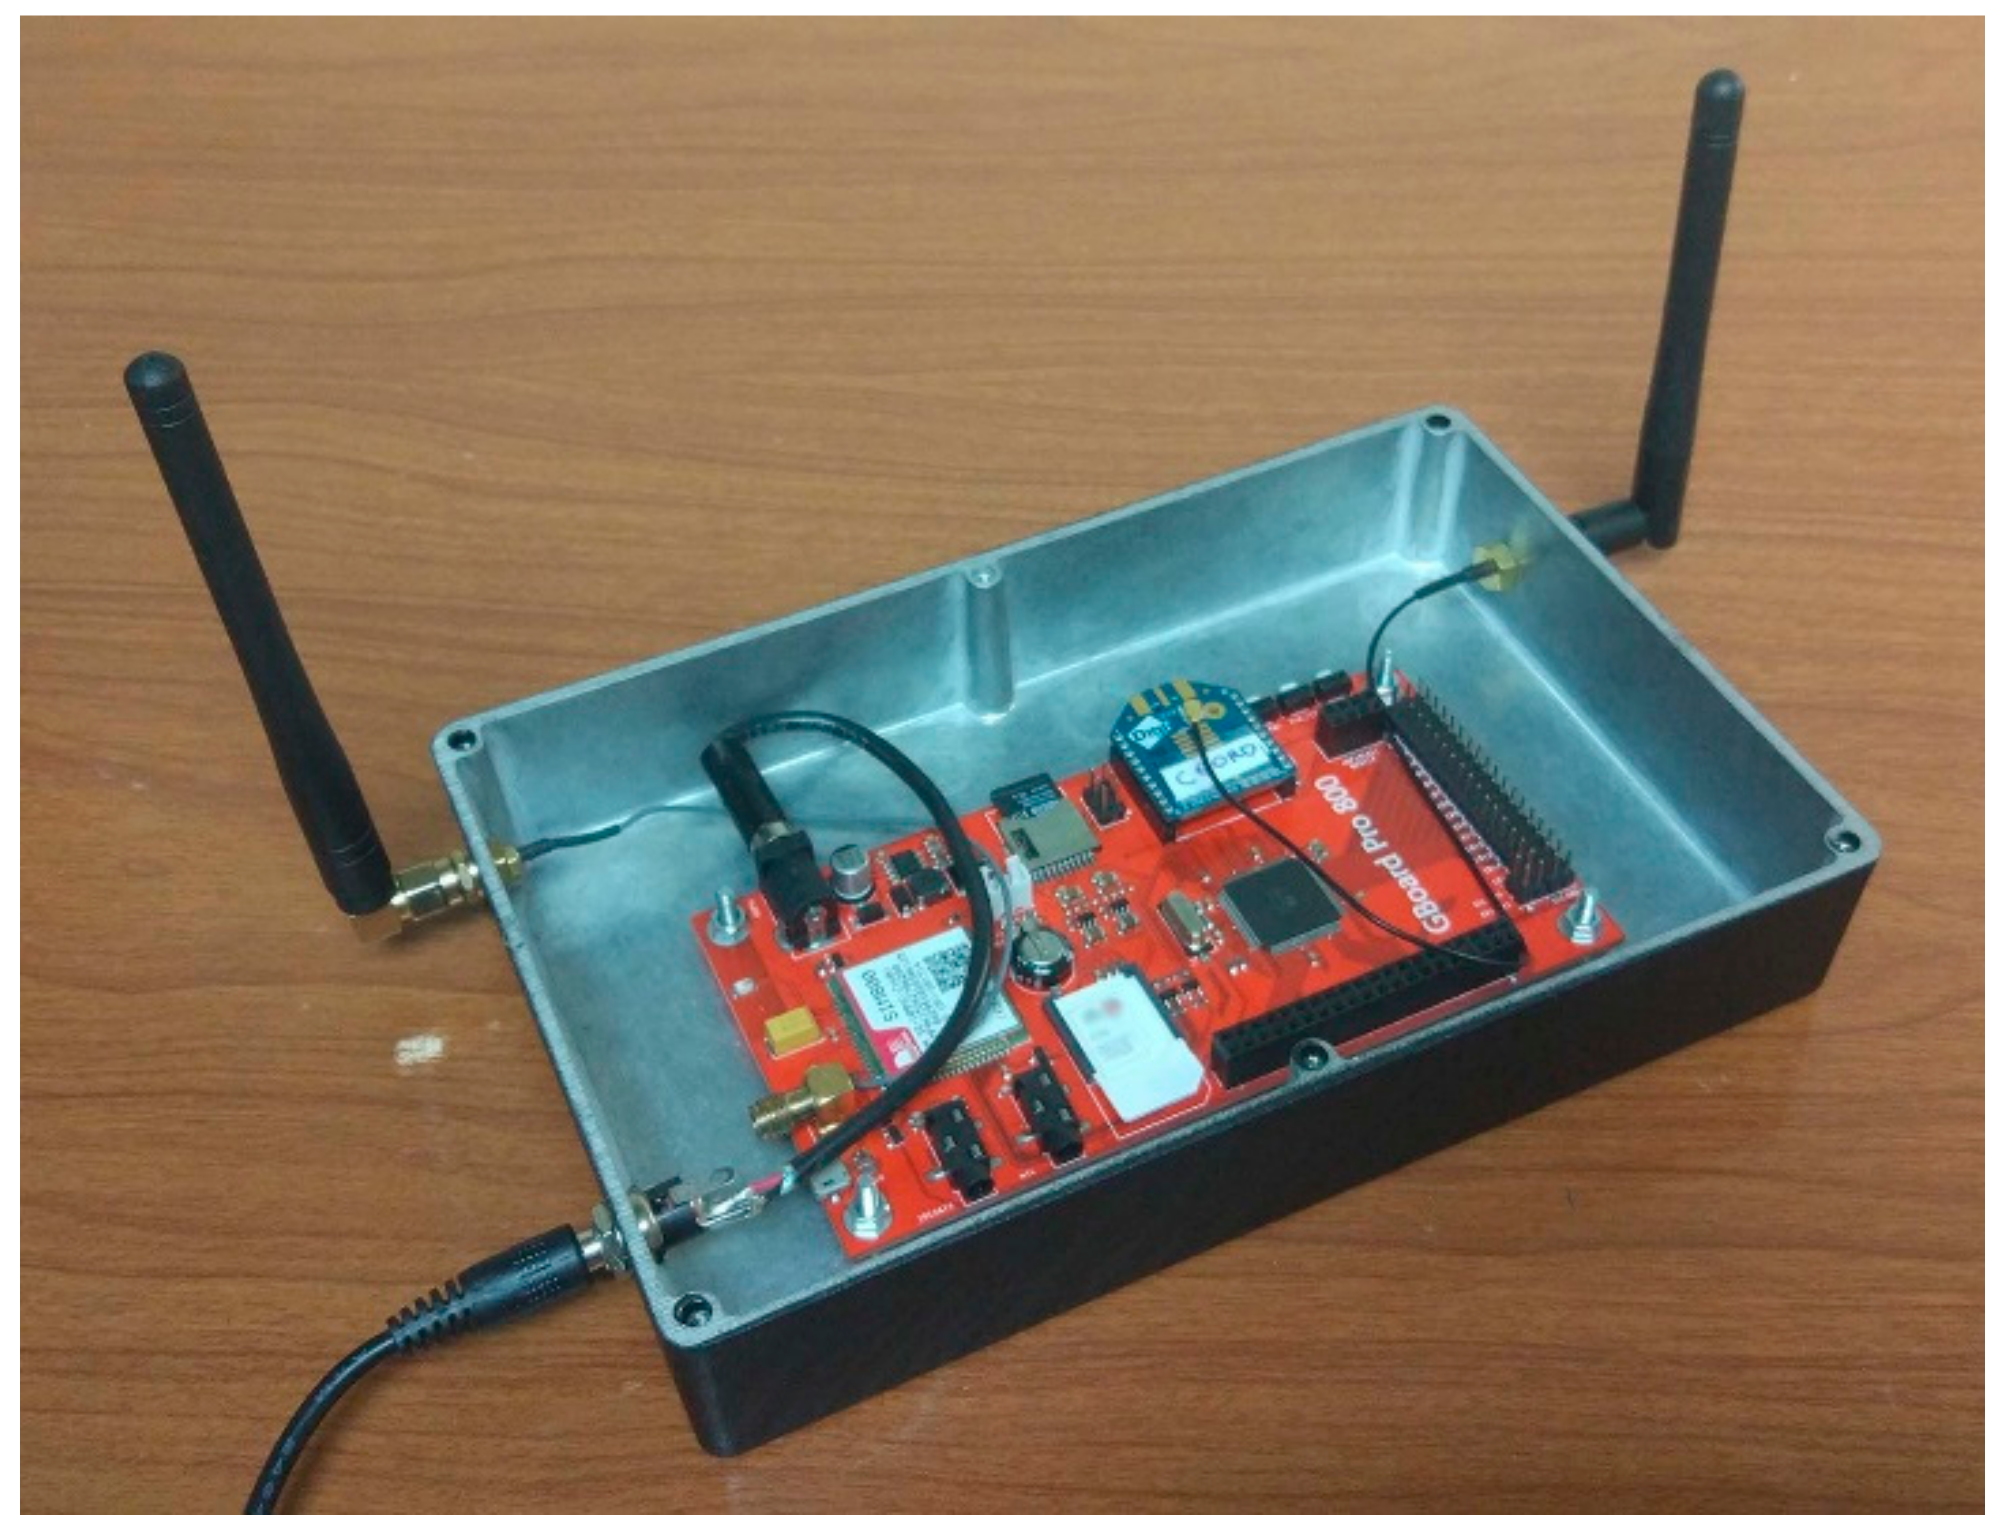
2.2. Coordinator Node
2.3. User Interface
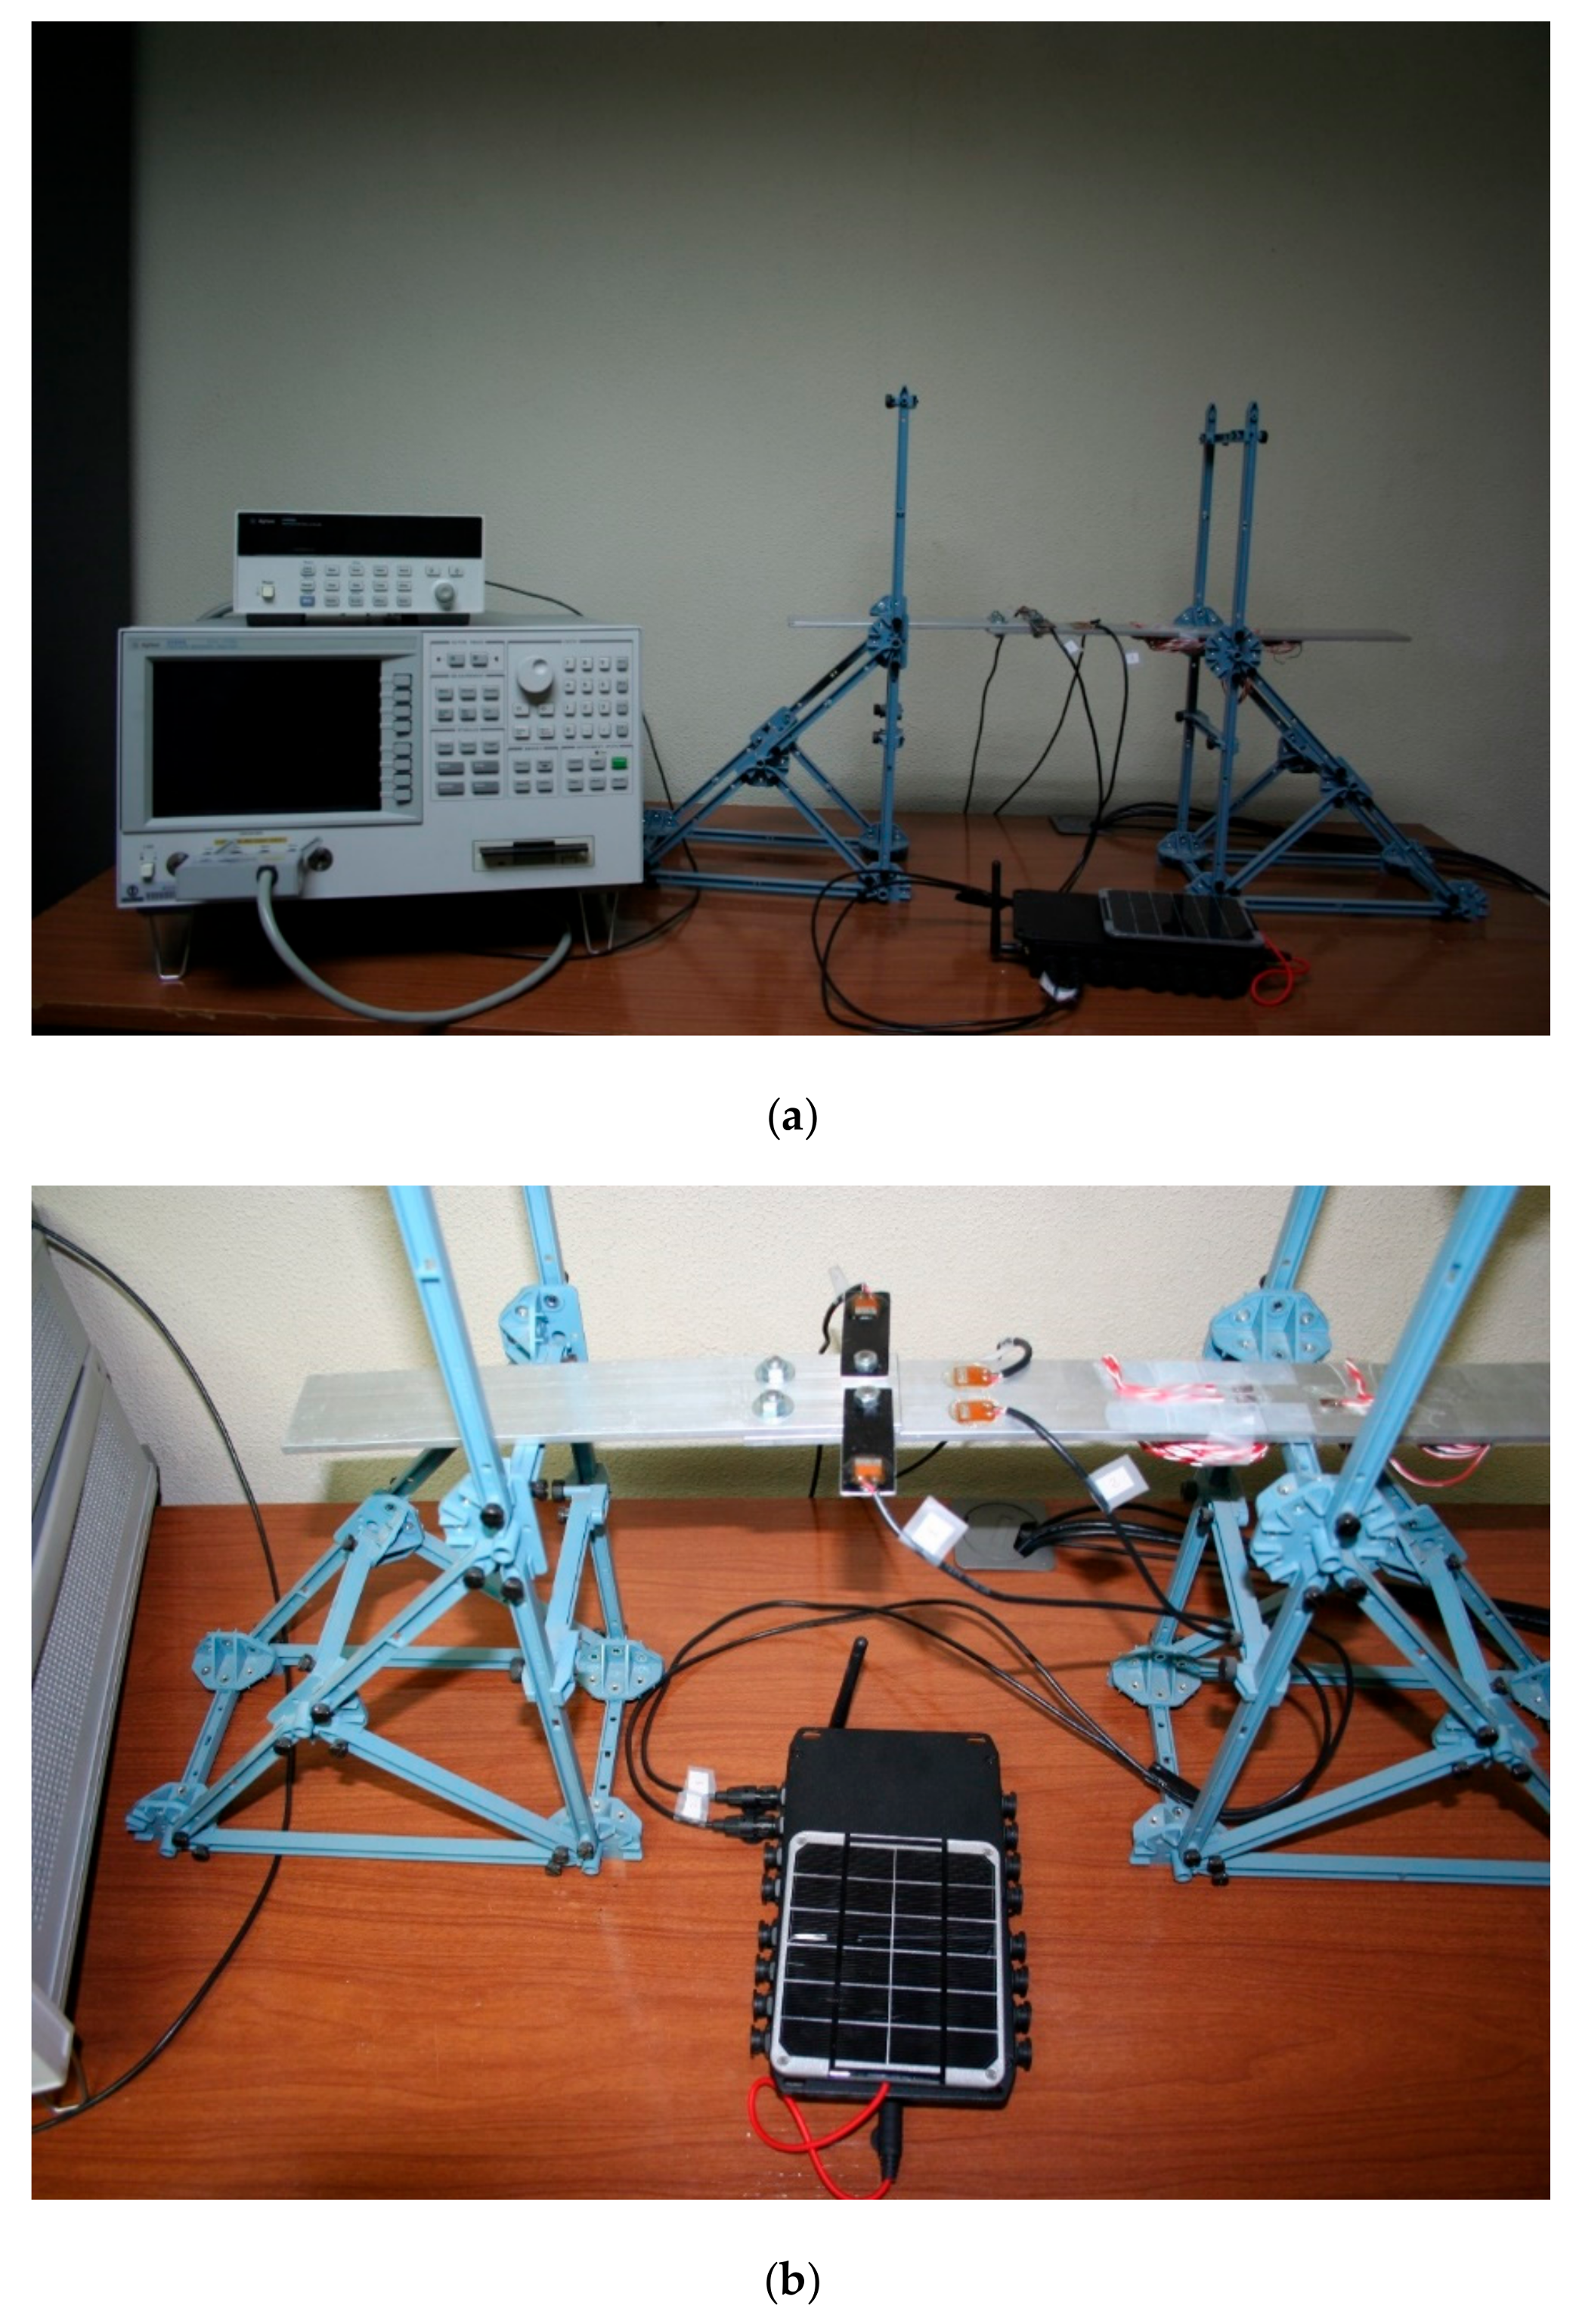
3. Results
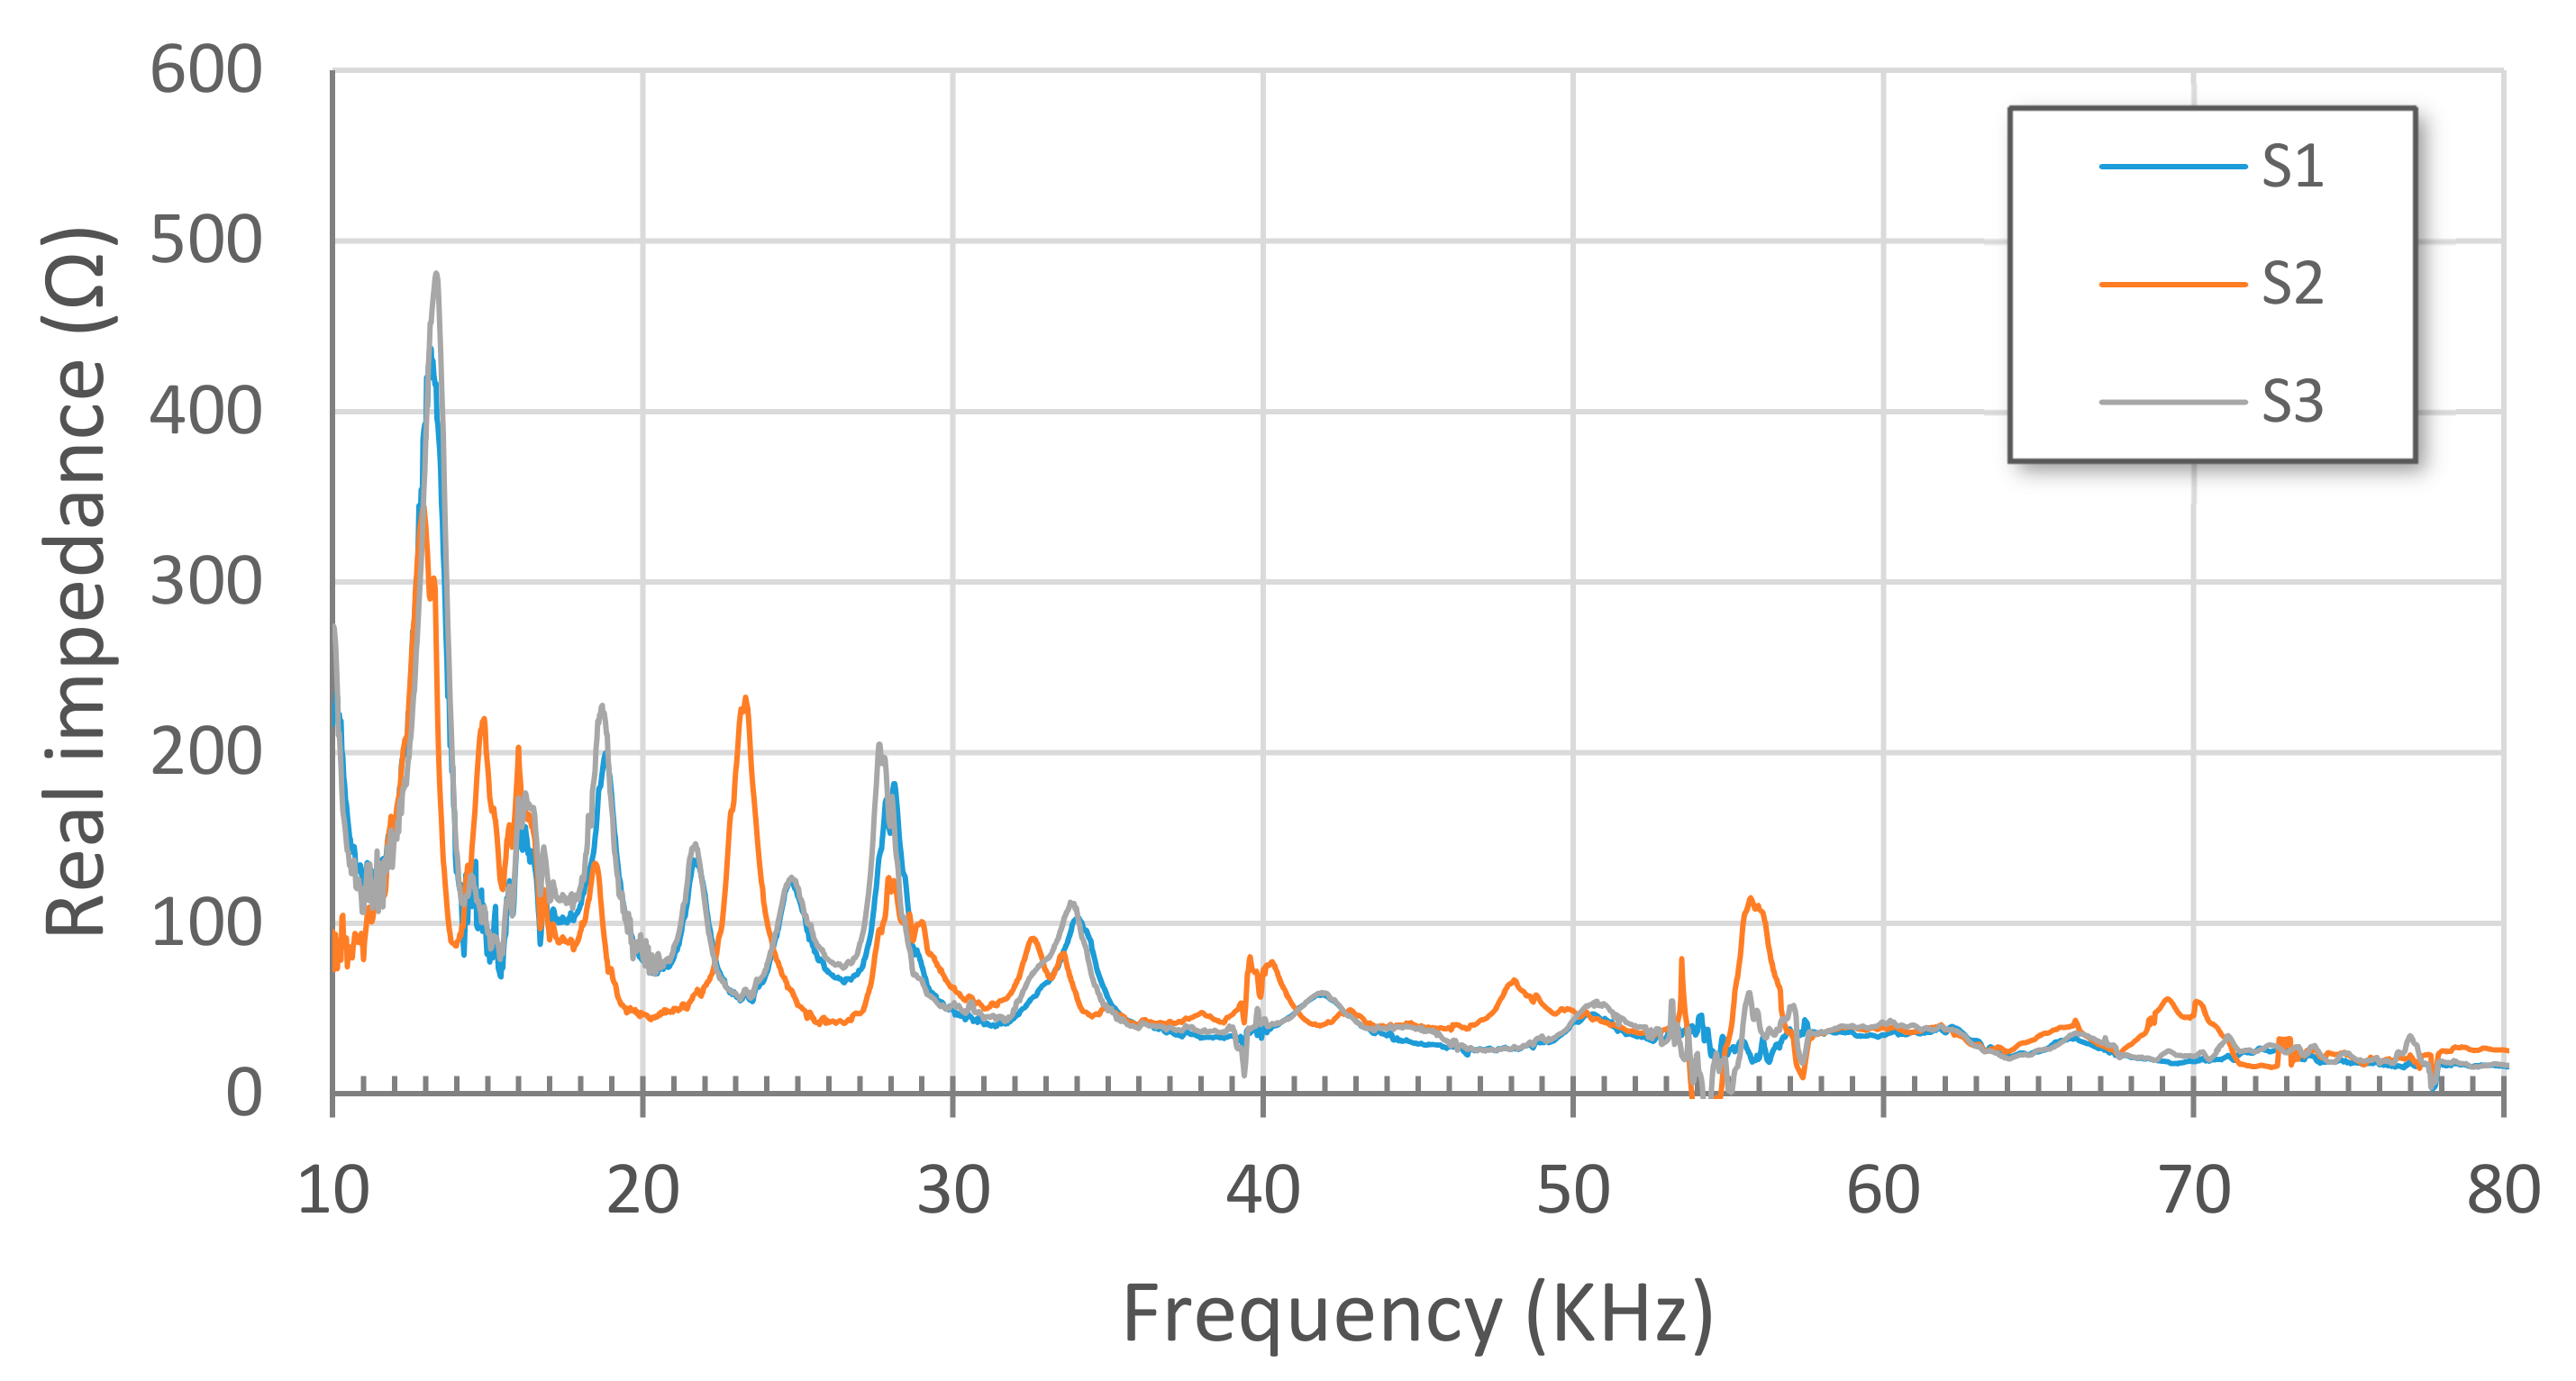
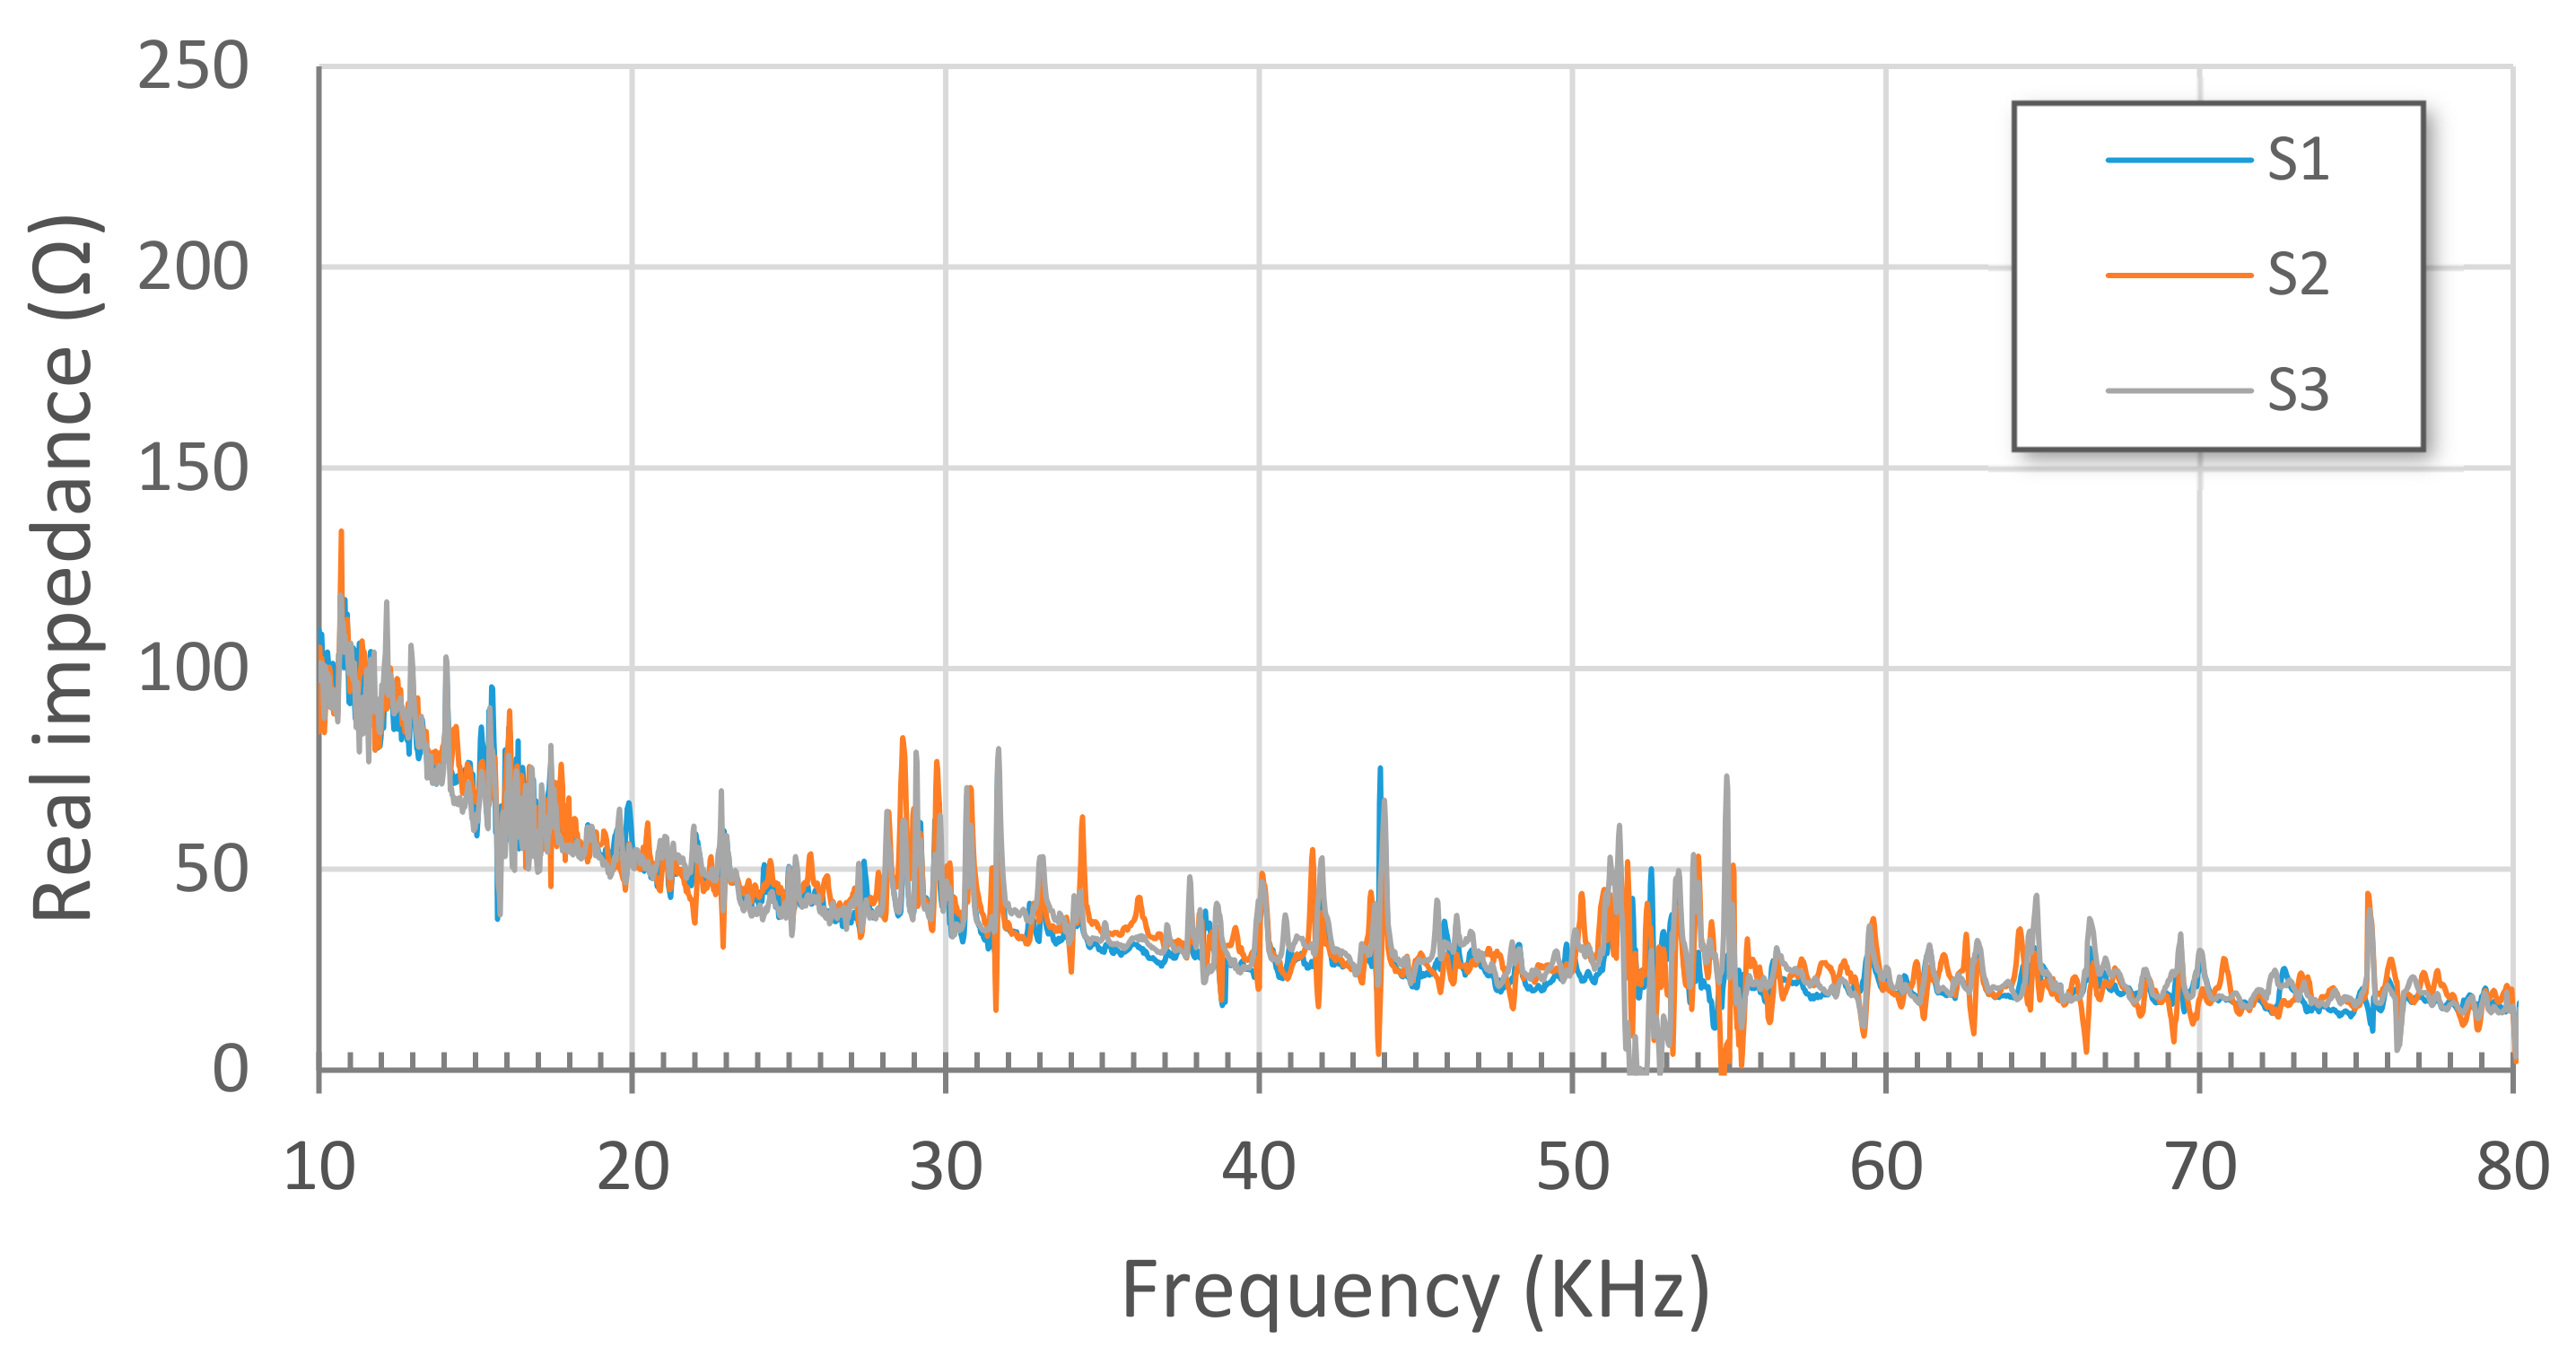
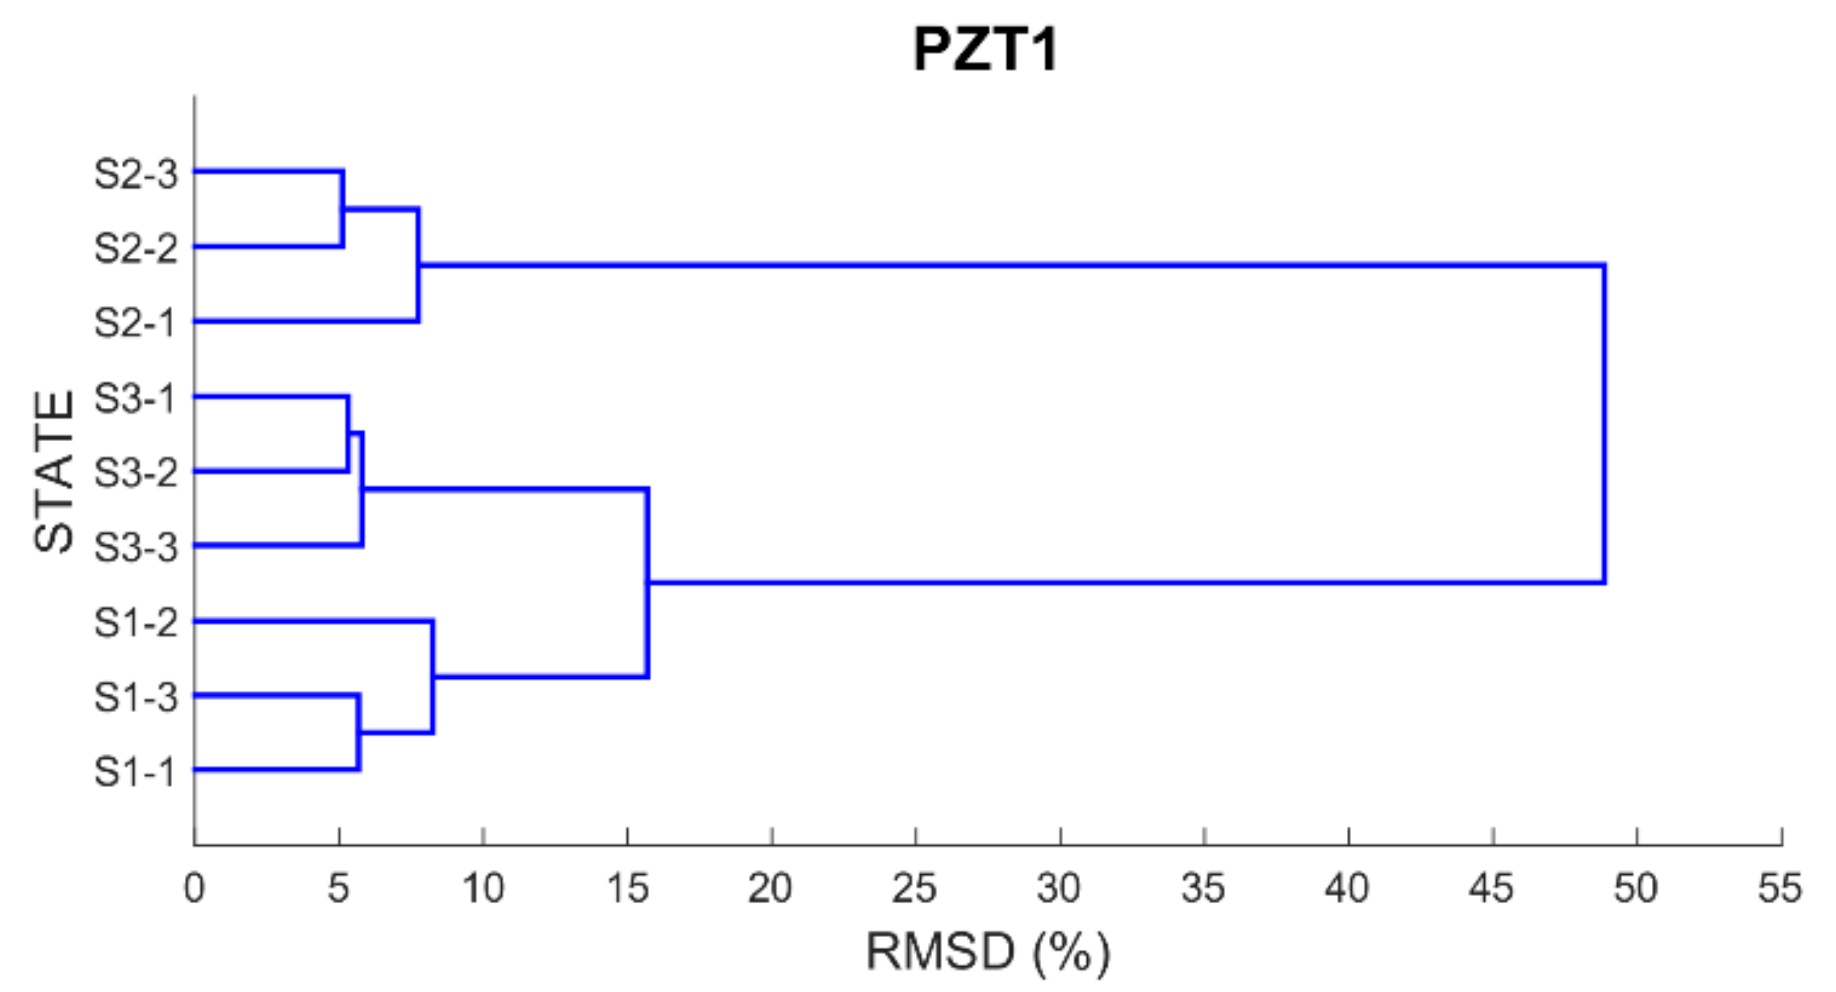
3.1. Damage Identification
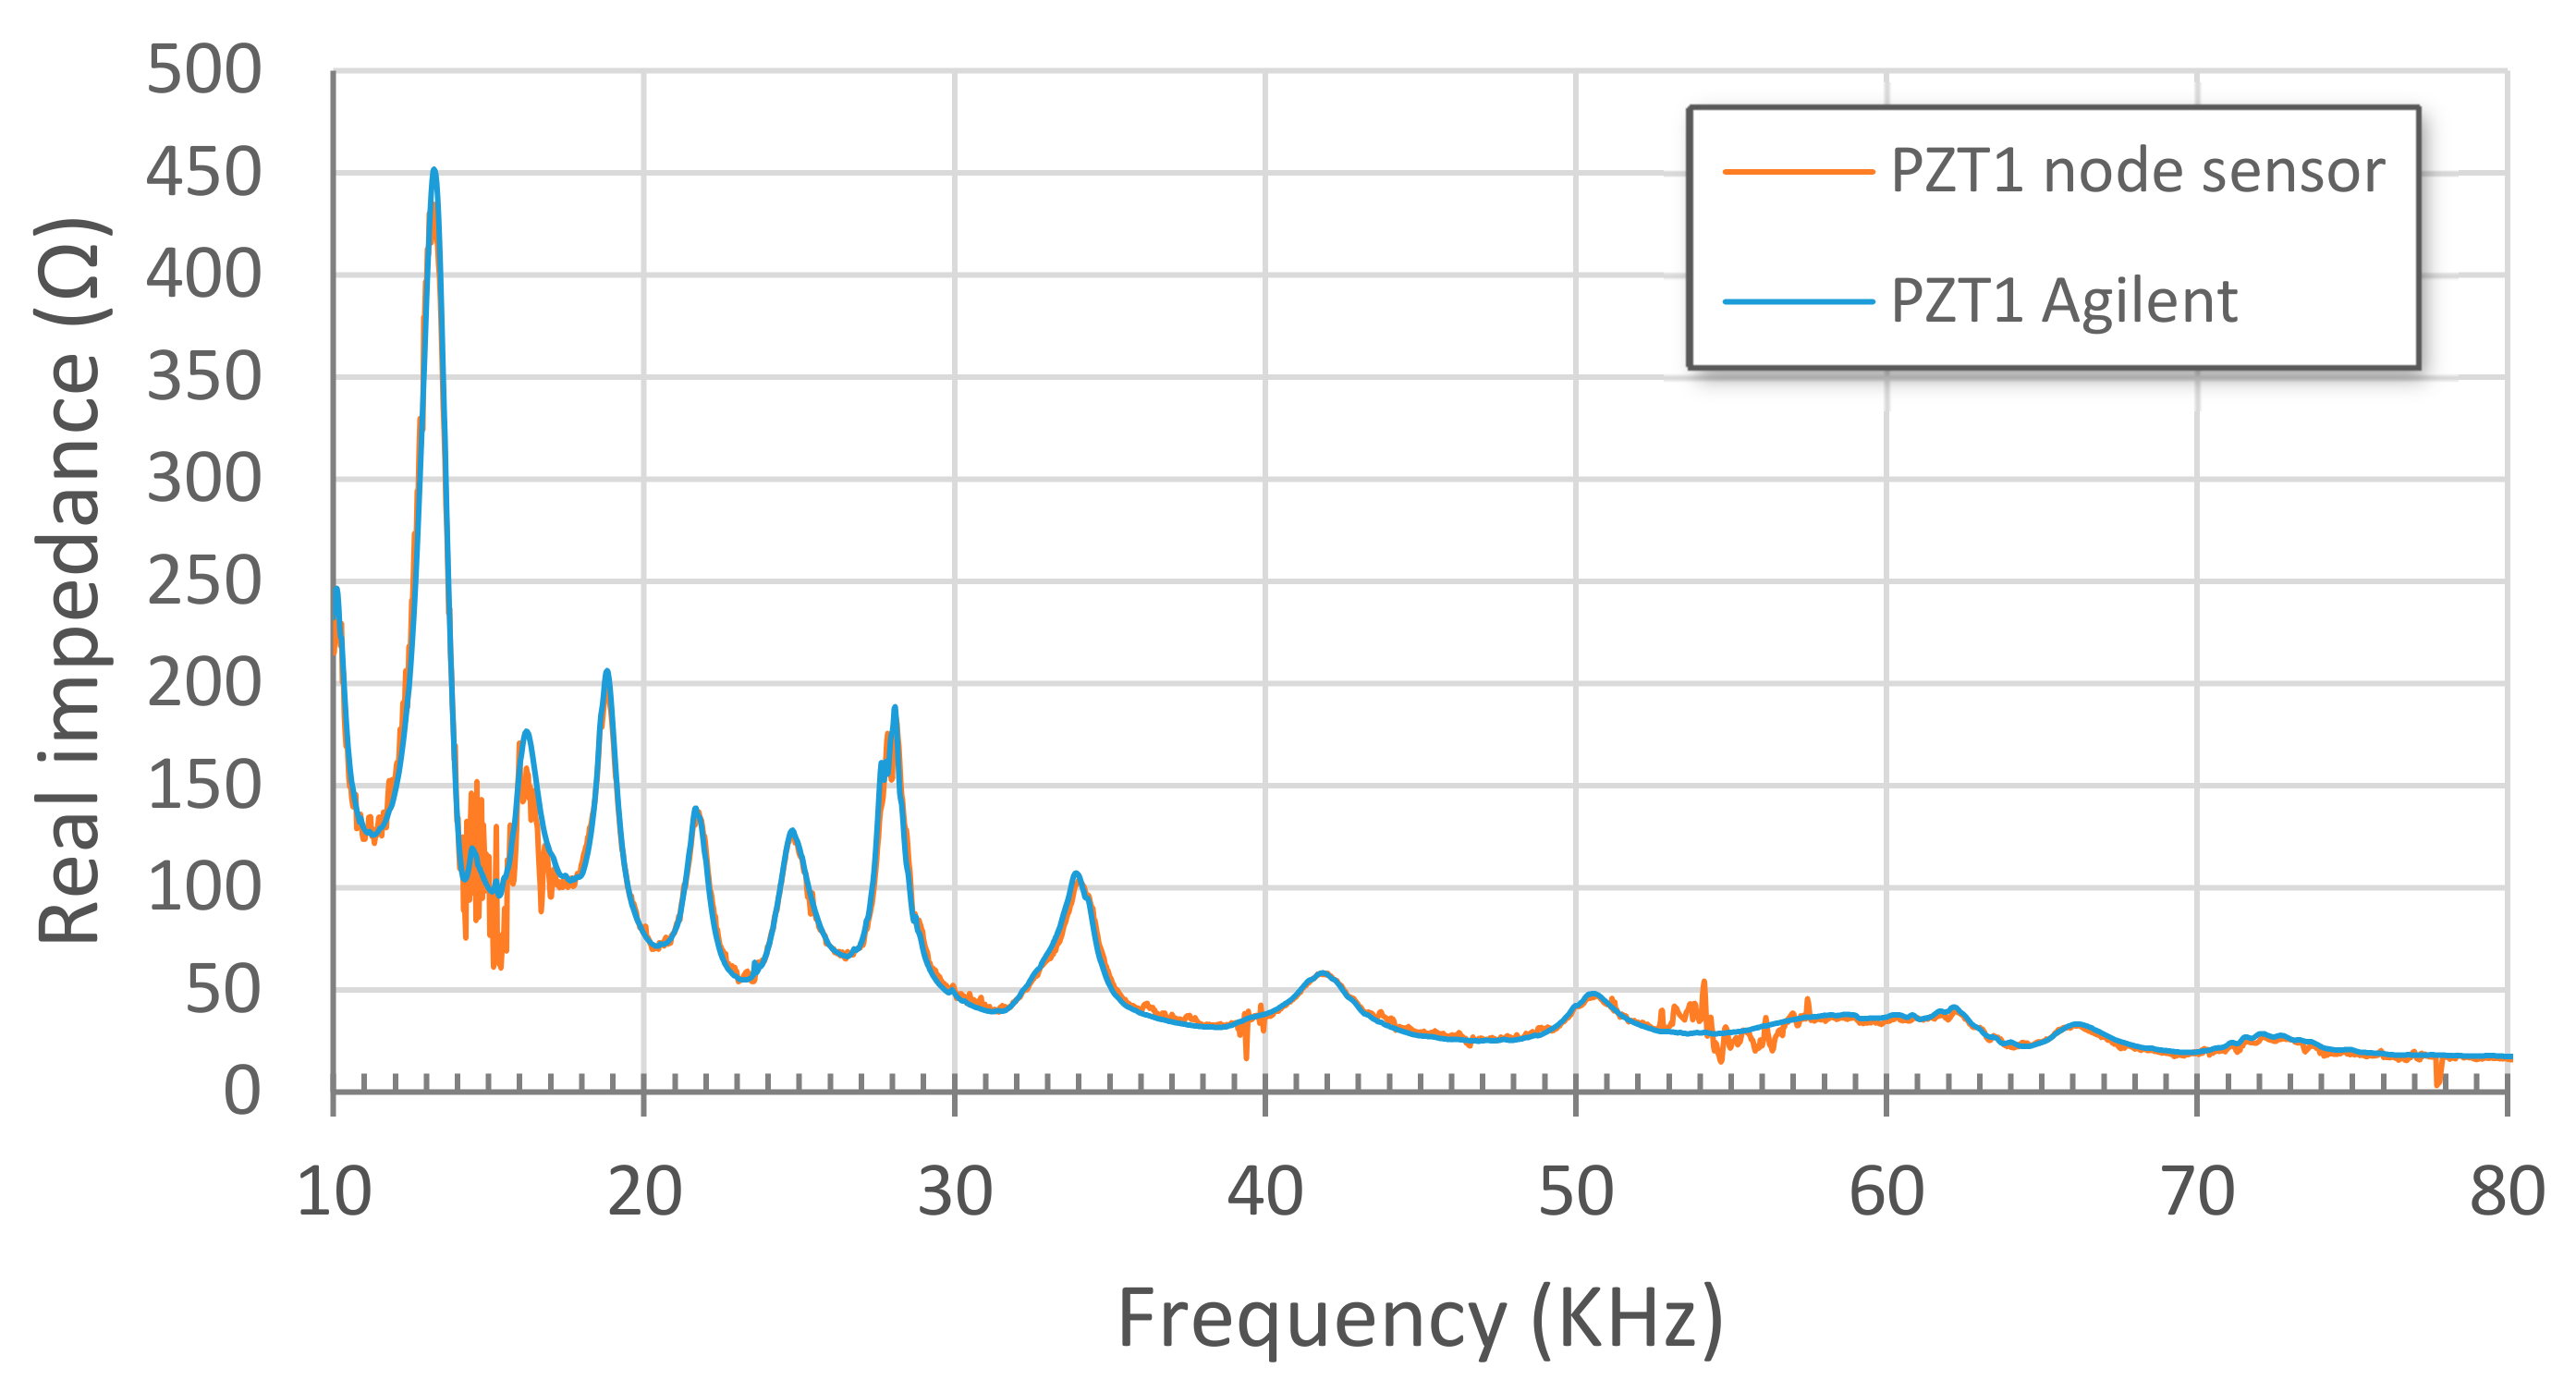
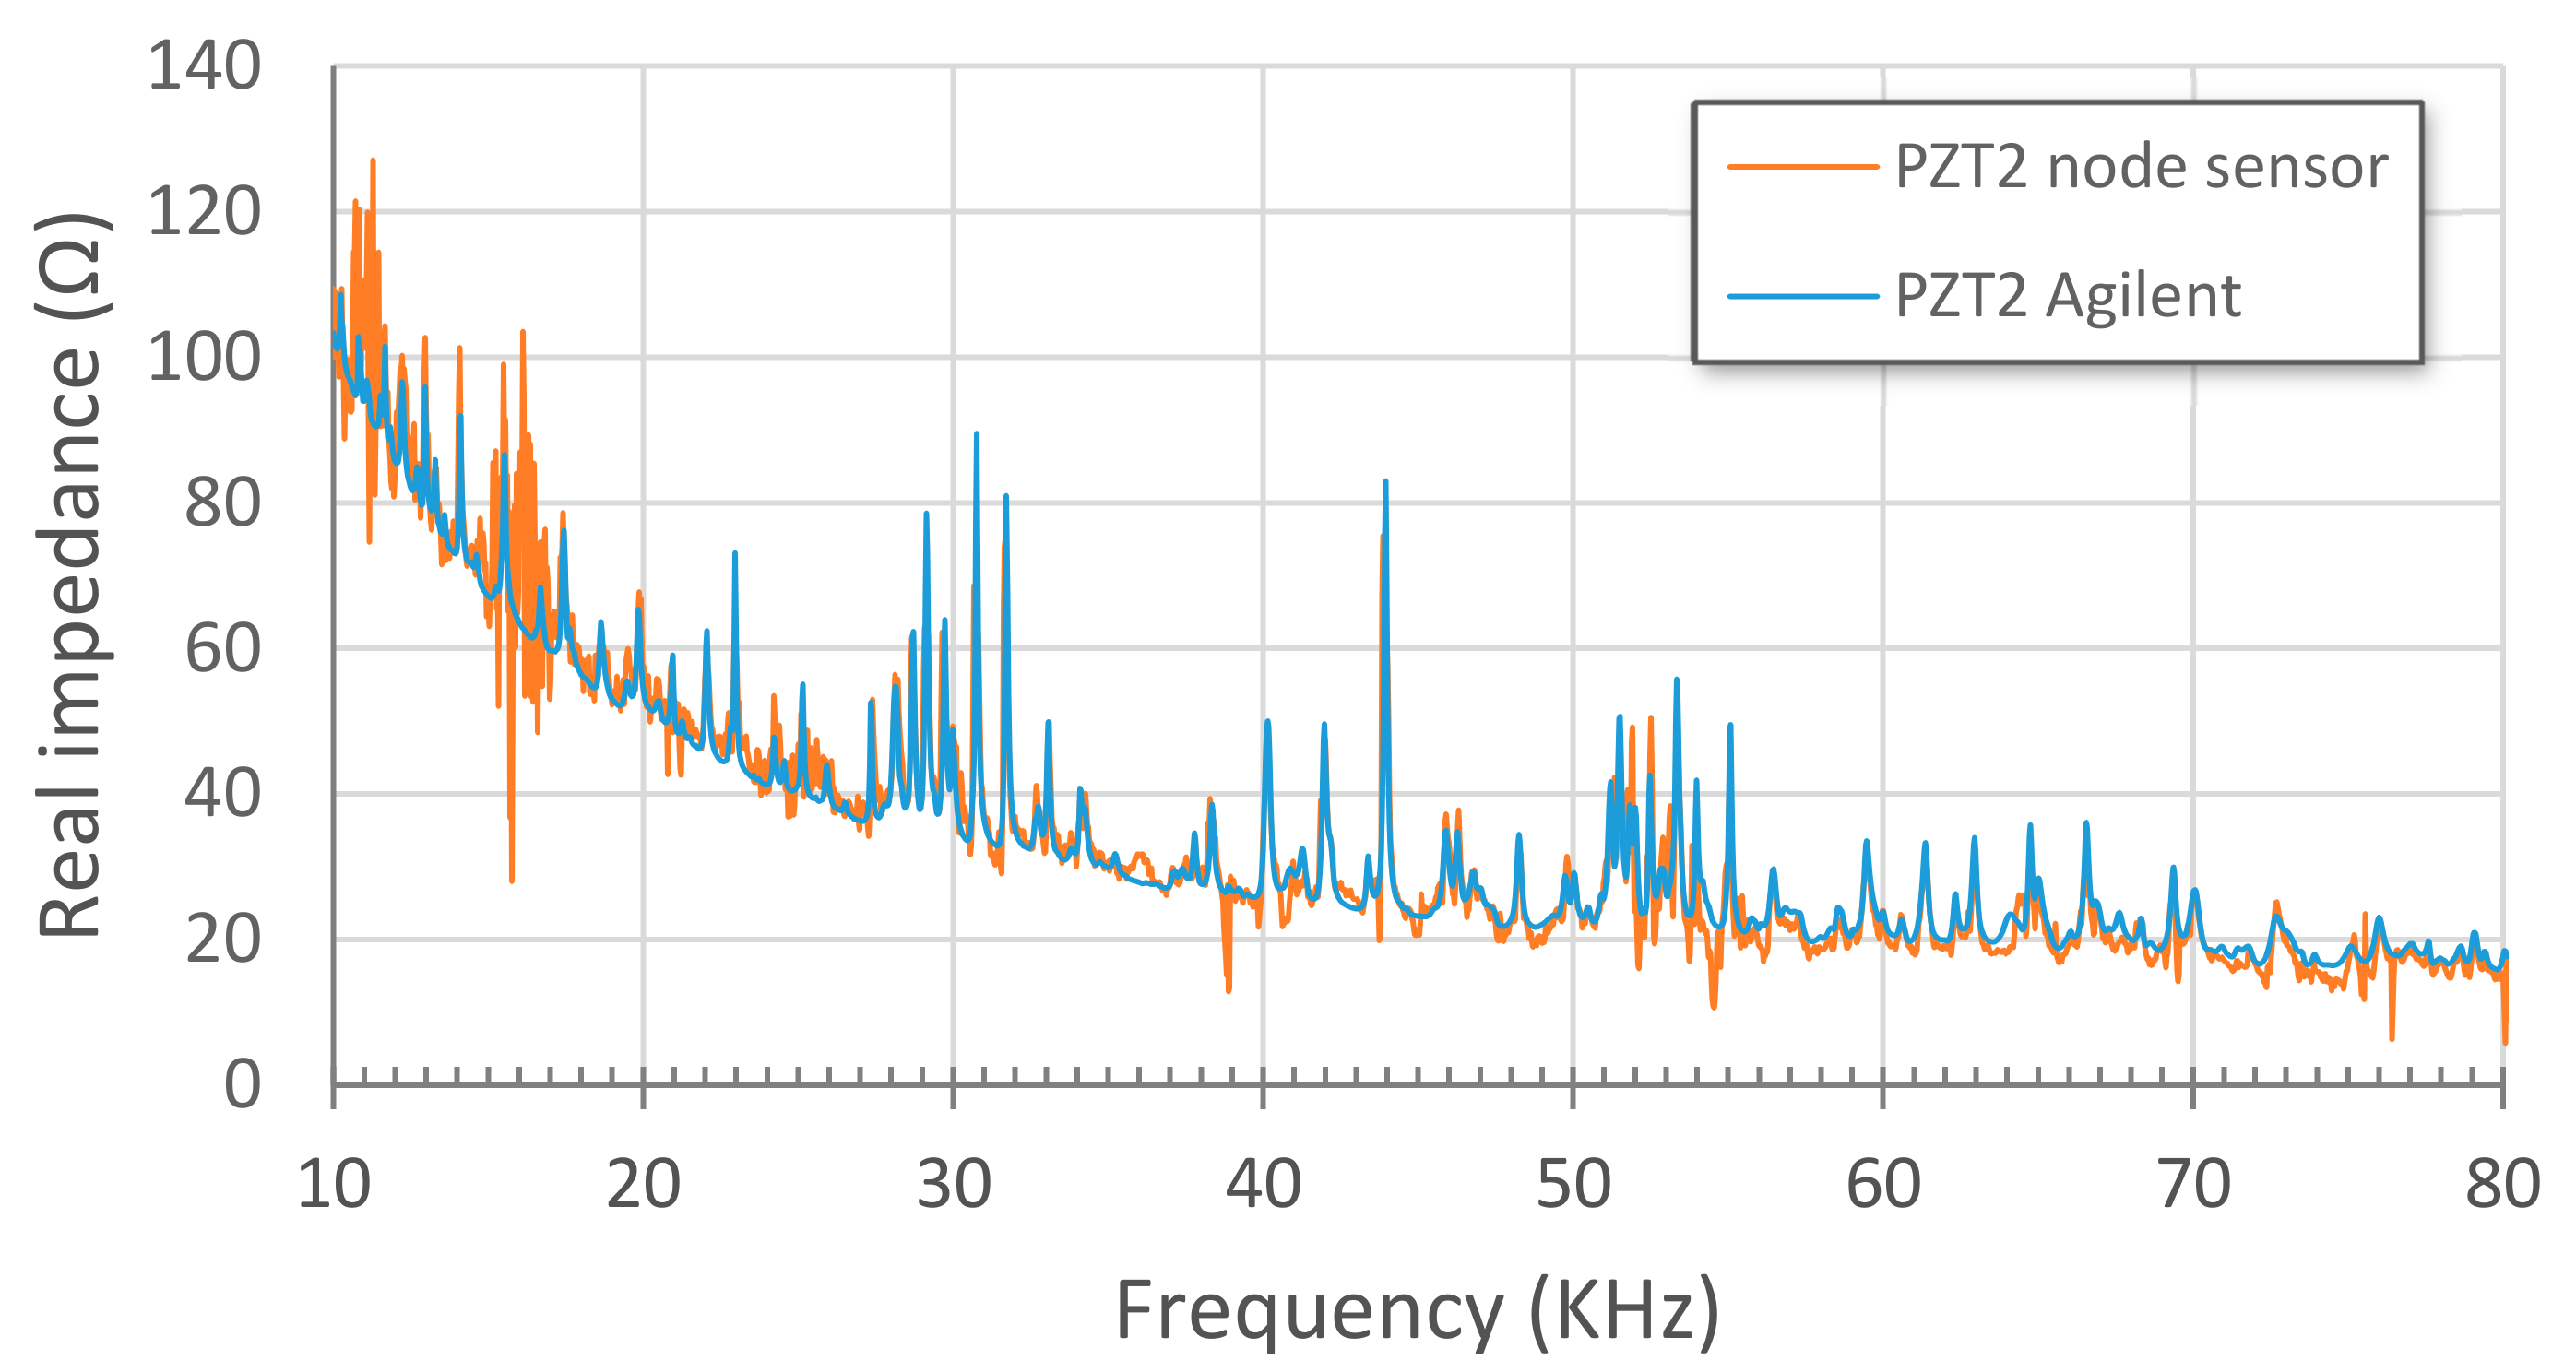
3.2. Performance of the Wireless System
4. Discussion and Conclusions
5. Patents
Acknowledgments
Author Contributions
Conflicts of Interest
References
- Giurgiutiu, V. Structural Health Monitoring with Piezoelectric Wafer Active Sensors; Academic Press—Elsevier: Cambridge, MA, USA, 2008. [Google Scholar]
- Karbhari, M.; Ansari, F. Structural Health Monitoring of Civil Infrastructure Systems; Woodhead Publishing Limited, CRC Press: Boca Raton, FL, USA, 2009. [Google Scholar]
- Farrar, C.; Worden, K. Structural Health Monitoring: A Machine Learning Perspective; Wiley: Hoboken, NJ, USA, 2013. [Google Scholar]
- Fan, W.; Qiao, P. Vibration-based damage identification methods: A review and comparative study. Struct. Health Monit. 2011, 10, 83–111. [Google Scholar] [CrossRef]
- Bhalla, S.; Soh, C.K. High frequency piezoelectric signatures for diagnosis of seismic/blast induced structural damages. NDT E Int. 2004, 37, 23–33. [Google Scholar] [CrossRef]
- Friswell, M.I. Damage identification using inverse methods. Philos. Trans. R. Soc. A 2007, 365, 393–410. [Google Scholar] [CrossRef] [PubMed]
- Perera, R.; Huerta, C.; Orquin, J.M. Identification of damage in RC beams using indexes based on local modal stiffness. Constr. Build. Mater. 2008, 22, 1656–1667. [Google Scholar] [CrossRef]
- Fang, S.E.; Perera, R.; De Roeck, G. Damage identification of a reinforced concrete frame by finite element model updating using damage parameterization. J. Sound Vib. 2008, 313, 544–559. [Google Scholar] [CrossRef]
- Perera, R.; Marín, R.; Ruiz, A. Static-dynamic multiscale structural damage identification in a multi-objective framework. J. Sound Vib. 2013, 332, 1484–1500. [Google Scholar] [CrossRef]
- Park, G.; Inman, D.J. Structural health monitoring using piezoelectric impedance measurements. Philos. Trans. R. Soc. A 2007, 365, 373–392. [Google Scholar] [CrossRef] [PubMed]
- Liang, C.; Sun, F.P.; Rogers, C.A. Coupled electro-mechanical analysis of adaptive material systems determination of the actuator power consumption and system energy transfer. J. Intell. Mater. Syst. Struct. 1994, 5, 12–20. [Google Scholar] [CrossRef]
- Yang, Y.; Divsholli, B.S. Sub-Frequency Interval Approach in Electromechanical Impedance Technique for Concrete Structure Health Monitoring. Sensors 2010, 10, 11644–11661. [Google Scholar] [CrossRef] [PubMed]
- Karayannis, C.G.; Voutetaki, M.E.; Chalioris, C.E.; Providakis, C.P.; Angeli, G.M. Detection of Flexural Damage Stages for RC Beams using Piezoelectric Sensors (PZT). Smart Struct. Syst. 2015, 15, 997–1018. [Google Scholar] [CrossRef]
- Karayannis, C.G.; Chalioris, C.E.; Angeli, G.M.; Papadopoulos, N.A.; Favvata, M.J.; Providakis, C.P. Experimental Damage Evaluation of Reinforced Concrete Steel Bars using Piezoelectric Sensors. Constr. Build. Mater. 2016, 105, 227–244. [Google Scholar] [CrossRef]
- Sevillano, E.; Sun, R.; Perera, R. Damage detection based on power dissipation measured with PZT sensors through the combination of electro-mechanical impedances and guided waves. Sensors 2016, 16, 639. [Google Scholar] [CrossRef] [PubMed]
- Wong, K.Y. Instrumentation and health monitoring of cable supported bridges. Struct. Control Health Monit. 2004, 11, 91–124. [Google Scholar] [CrossRef]
- Lynch, J.P.; Loh, K.J. A Summary Review of Wireless Sensors and Sensor Networks for Structural Health Monitoring. Shock Vib. Dig. 2006, 38, 91–128. [Google Scholar] [CrossRef]
- Rice, J.A.; Mechitov, K.; Sim, S.H.; Nagayama, T.; Jang, S.; Kim, R.; Spencer, B.F.; Agha, G.; Fujino, Y. Flexible smart sensor framework for autonomous structural health monitoring. Smart Struct. Syst. 2010, 6, 423–438. [Google Scholar] [CrossRef]
- Spencer, B.F.; Park, J.W.; Mechitov, K.A.; Jo, H.; Agha, G. Next generation wireless smart sensors toward sustainable civil infrastructure. Procedia Eng. 2017, 171, 5–13. [Google Scholar] [CrossRef]
- Park, S.; Kim, J.-W.; Lee, C.; Park, S.-K. Impedance-based wireless debonding condition monitoring of CFRP laminated concrete structures. NDT E Int. 2011, 44, 232–238. [Google Scholar] [CrossRef]
- Voutetaki, M.E.; Papadopoulos, N.A.; Angeli, G.M.; Providakis, C.P. Investigation of a New Experimental Method for Damage Assessment of RC Beams Failing in Shear using Piezoelectric Transducers. Eng. Struct. 2016, 114, 226–240. [Google Scholar] [CrossRef]
- Chalioris, C.E.; Karayannis, C.G.; Angeli, G.M.; Papadopoulos, N.A.; Favvata, M.J.; Providakis, C.P. Applications of Smart Piezoelectric Materials in a Wireless Admittance Monitoring System (WiAMS) to Structures—Tests in RC Elements. Case Stud. Constr. Mater. 2016, 5, 1–18. [Google Scholar] [CrossRef]
- Mascarenas, D.L.; Todd, M.D.; Park, G.; Farrar, C. Development of an impedance-based wireless sensor node for structural health monitoring. Smart Mater. Struct. 2007, 16, 2137–2145. [Google Scholar] [CrossRef]
- PI Piezo Technology. P-876 DuraAct Patch Transducer Whitepaper. 2014. Available online: http://piceramic.com/product-detail-page/p-876-101790.html (accessed on 7 November 2017).
- Nguyen, K.-D.; Lee, S.-Y.; Lee, P.-Y.; Kim, J.-T. Wireless SHM for Bolted Connections via Multiple PZT-Interfaces and Imote2-Platformed Impedance Sensor Node. In Proceedings of the 6th International Workshop on Advanced Smart Materials and Smart Structures Technology (ANCRiSST2011), Dalian, China, 25–26 July 2011. [Google Scholar]
- Sevillano, E.; Sun, R.; Gil, A.; Perera, R. Interfacial crack-induced debonding identification in FRP strengthened RC beams from PZT signatures using hierarchical clustering analysis. Compos. Part B Eng. 2016, 87, 322–335. [Google Scholar] [CrossRef]
- Sun, R.; Sevillano, E.; Perera, R. Identification of intermediate debonding damage in FRP-strengthened RC beams based on a multi-objective updating approach and PZT sensors. Compos. Part B Eng. 2017, 109, 248–258. [Google Scholar] [CrossRef]
- Giurgiutiu, V.; Reynolds, A.; Rogers, C.A. Experimental investigation of E/M impedance health monitoring for spot-welded structural joints. J. Intell. Mater. Syst. Struct. 1999, 10, 802–812. [Google Scholar] [CrossRef]
- Baptista, F.G.; Budoya, D.E.; Vinicius, A.D.; Ulson, J.A. An experimental study on the effect of temperature on piezoelectric sensors for impedance based structural health monitoring. Sensors 2014, 14, 1208–1227. [Google Scholar] [CrossRef] [PubMed]


| Final State | ||||||||||
| S1-1 | S1-2 | S1-3 | S2-1 | S2-2 | S2-3 | S3-1 | S3-2 | S3-3 | ||
| Initial State | S1-1 | 7.8 | 5.7 | 46.2 | 46.1 | 46.2 | 16.4 | 15.2 | 14.2 | |
| S1-2 | 8.6 | 45.6 | 45.4 | 45.6 | 19.1 | 17.9 | 16.5 | |||
| S1-3 | 46.4 | 46.3 | 46.4 | 16.2 | 14.9 | 14.1 | ||||
| S2-1 | 7.4 | 8.1 | 53.4 | 53.1 | 52.1 | |||||
| S2-2 | 5.1 | 53.5 | 53.2 | 52.3 | ||||||
| S2-3 | 53.7 | 53.4 | 52.4 | |||||||
| S3-1 | 5.3 | 6.2 | ||||||||
| S3-2 | 5.3 | |||||||||
| S3-3 | ||||||||||
| Final State | ||||||||||
| S1-1 | S1-2 | S1-3 | S2-1 | S2-2 | S2-3 | S3-1 | S3-2 | S3-3 | ||
| Initial State | S1-1 | 9.4 | 9.1 | 18.8 | 18.7 | 18.5 | 18.8 | 17.9 | 17.1 | |
| S1-2 | 10.0 | 19.4 | 19.2 | 19.1 | 19.5 | 18.7 | 18.2 | |||
| S1-3 | 19.0 | 18.9 | 18.9 | 18.5 | 17.3 | 16.8 | ||||
| S2-1 | 7.3 | 7.6 | 21.1 | 20.6 | 20.2 | |||||
| S2-2 | 7.1 | 21.5 | 21.0 | 20.4 | ||||||
| S2-3 | 21.4 | 21.0 | 20.5 | |||||||
| S3-1 | 7.9 | 9.1 | ||||||||
| S3-2 | 7.7 | |||||||||
| S3-3 | ||||||||||
| Final State | ||||||||||
| S1-1 | S1-2 | S1-3 | S2-1 | S2-2 | S2-3 | S3-1 | S3-2 | S3-3 | ||
| Initial State | S1-1 | 1.2 | 0.8 | 40.3 | 40.4 | 40.3 | 31.3 | 31.6 | 31.2 | |
| S1-2 | 1.9 | 39.8 | 39.9 | 39.8 | 31.6 | 31.9 | 31.5 | |||
| S1-3 | 40.6 | 40.8 | 40.7 | 31.1 | 31.4 | 31.1 | ||||
| S2-1 | 7.2 | 8.4 | 46.9 | 47.3 | 46.8 | |||||
| S2-2 | 2.5 | 47.0 | 47.5 | 46.9 | ||||||
| S2-3 | 46.9 | 47.4 | 46.8 | |||||||
| S3-1 | 1.8 | 1.8 | ||||||||
| S3-2 | 1.3 | |||||||||
| S3-3 | ||||||||||
| Final State | ||||||||||
| S1-1 | S1-2 | S1-3 | S2-1 | S2-2 | S2-3 | S3-1 | S3-2 | S3-3 | ||
| Initial State | S1-1 | 0.4 | 0.8 | 16.4 | 16.1 | 16.0 | 10.1 | 9.6 | 9.5 | |
| S1-2 | 1.1 | 16.4 | 16.0 | 16.0 | 10.1 | 9.6 | 9.4 | |||
| S1-3 | 16.5 | 16.2 | 16.1 | 10.2 | 9.7 | 9.6 | ||||
| S2-1 | 3.5 | 4.0 | 17.4 | 17.3 | 17.3 | |||||
| S2-2 | 1.3 | 17.2 | 17.1 | 17.0 | ||||||
| S2-3 | 17.3 | 17.2 | 17.1 | |||||||
| S3-1 | 2.7 | 3.1 | ||||||||
| S3-2 | 0.7 | |||||||||
| S3-3 | ||||||||||
© 2017 by the authors. Licensee MDPI, Basel, Switzerland. This article is an open access article distributed under the terms and conditions of the Creative Commons Attribution (CC BY) license (http://creativecommons.org/licenses/by/4.0/).
Share and Cite
Perera, R.; Pérez, A.; García-Diéguez, M.; Zapico-Valle, J.L. Active Wireless System for Structural Health Monitoring Applications. Sensors 2017, 17, 2880. https://doi.org/10.3390/s17122880
Perera R, Pérez A, García-Diéguez M, Zapico-Valle JL. Active Wireless System for Structural Health Monitoring Applications. Sensors. 2017; 17(12):2880. https://doi.org/10.3390/s17122880
Chicago/Turabian StylePerera, Ricardo, Alberto Pérez, Marta García-Diéguez, and José Luis Zapico-Valle. 2017. "Active Wireless System for Structural Health Monitoring Applications" Sensors 17, no. 12: 2880. https://doi.org/10.3390/s17122880
APA StylePerera, R., Pérez, A., García-Diéguez, M., & Zapico-Valle, J. L. (2017). Active Wireless System for Structural Health Monitoring Applications. Sensors, 17(12), 2880. https://doi.org/10.3390/s17122880